an of the indiana 2015 istep+ - in.govin.gov/sboe/files/validity_study-final.pdf · of the indiana...
TRANSCRIPT

An Investigation into the Validity of the Indiana 2015 ISTEP+ Assessment Program
Edward Roeber and Derek Briggs
January 2016 Motivation for the Investigation The present investigation represents an independent evaluation of the validity of the 2015 ISTEP+ assessment program. Following the lead offered in the Standards for Educational and Psychological Testing (AERA, APA, & NCME, 2014), we define validity as the degree to which evidence and theory support the interpretations of test scores for proposed uses of tests. As this definition makes clear, the validity of any test—let alone an entire testing program—is almost never a yes‐or‐no proposition. Instead, the goal of a validity investigation is to shed light on both the strengths and weaknesses of the program; there will always be a mixture of both, because no program is perfect. Only when the weaknesses are so substantial that they threaten to overwhelm the strengths would one declare a testing program to be invalid. In contrast, the degree to which a program can be characterized as valid will involve professional judgment based on the accumulated evidence. This was the approach taken in this investigation. The Indiana State Board of Education (SBOE) contracted with two assessment specialists (Edward Roeber, Assessment Director, Michigan Assessment Consortium and Derek Briggs, Professor, University of Colorado) to conduct this investigation. We carried out seven smaller studies to support this larger investigation. For each study, we asked and obtained evidence related to intended interpretations and uses of ISTEP+ test scores from the Indiana Department of Education (IDOE) and the ISTEP+ contractor (CTB/McGraw‐Hill). These sources of evidence are described in both the overall validity investigation design (Appendix A) and the reports of each of the seven studies (appended). Summary of Findings Our investigation did not find weaknesses that with the ISTEP+ that fundamentally undermine the primary intended use of ISTEP+ test scores: to make inferences about student achievement and proficiency levels relative to Indiana’s Academic Standards. The ISTEP+ tests were designed according to a documented process in which the IDOE and CTB, with input from IN stakeholders, operationalized Indiana’s Academic Standards into a blueprint for item development. There is good evidence that CTB was successful in matching the item blueprint with respect to major score reporting categories. The results from administration of the 2015 ISTEP+ tests indicate that they produced student scores that are highly reliable measures in the subjects of math, English/Language Arts (E/LA), science, and social studies. These measures are used to classify IN students into proficiency levels that were established through a collaborative, systematic process that directly invoked the judgments of Indiana educators. The ISTEP+ tests in math and ELA were administered in both paper and pencil and online (i.e., digital) formats. Small effects on student performance in math and E/LA were sometimes found by mode of assessment. However, these effects were identified and adjustments were made to account for them. In all, there is adequate evidentiary support for using ISTEP+ scores to make inferences about student achievement and proficiency levels. ISTEP+ scores in math and ELA are also used to compute student growth percentiles which feed into the state’s accountability system. We find no evidence of floor or ceiling effects on test scores across grades

2
that would underline the interpretation and use of these growth percentiles. However, the direct evidentiary support for the use of ISTEP+ test scores to validly support inferences about growth is limited at this point in time. The ISTEP+ tests in math and ELA were assembled under an extremely tight timeline due to circumstances (changes in state policy related to assessment and accountability) that were outside the control of either the IDOE or its test vendor. Given this, it should come as little surprise that there are several areas where we recommend improvements in the design and development of the ISTEP+ tests for math and ELA going forward. In particular, the following seven areas, in order from most important to least important, require improvement: (1) While the Indiana Academic Standards have been characterized as rigorous and focusing on college‐
and career‐readiness, the items on the ISTEP+ math and ELA tests are primarily characterized by items that have been categorized in an independent review as relatively low in cognitive complexity. ISTEP+ math and E/LA items focus almost exclusively on recalling facts and applying basic skills and concepts. Far fewer items require students to demonstrate strategic thinking and reasoning. It is too late to address this for 2016, but this can and should be addressed by IDOE and its contractor for 2017.
(2) Not all standards are measurable by a standardized test. Given this, the overlap between what the ISTEP+ measures and what it does not measure with respect to Indiana’s academic standards needs to be clear. Although a third‐party alignment study examined the alignment of ISTEP+ items and showed considerable alignment, this study did not directly compare the rigor of ISTEP+ items to the rigor collectively implied by Indiana’s standards. A future alignment study should be able to make a stronger case that the rigor of ISTEP+ math and ELA items is aligned to the rigor of enacted content standards.
(3) Various blueprint documents exist for the ISTEP+ tests, but they are not always as detailed and complete as would be preferred. The next iteration of the ISTEP+ should include more comprehensive and inclusive test blueprints that describe in detail for each subject and grade the manner in which items have been designed, developed and refined to match the demands of the academic standards.
(4) Although the primary use of ISTEP+ tests is to measure student achievement, another implicitly intended use is making inferences about student (and school) growth in terms of score increases from grade to grade. Currently, this is being accomplished through the computation of student growth percentiles (SGPs). However, these SGPs do not directly support inferences in terms of scale score gains across grades, and this can be a source of confusion for Indiana’s educators and the public at large. In principle, the ISTEP+ vertical scales could support simpler and more straightforward inferences about growth. In practice, the current design of the ISTEP+ vertical scales make such interpretations highly equivocal. The design of the ISTEP+ vertical scales should be revisited with the ISTEP+ contractor for the 2017 administration.
(5) Another intended use of ISTEP+ test scores is to provide diagnostic information at the reporting category level to allow for finer‐grained inferences about students’ strengths and weaknesses. However, the reliability of scores by reporting categories can vary. CTB reports these scores using an index approach (i.e., the Indiana Performance Index) that attempts to adjust for differences in reporting category reliability. It is somewhat of an open question whether the approach being used to create an index score for each reporting category is the ideal way to report this information. This is something that should be considered more carefully in the future.
(6) The ISTEP+ was administered in two different modes with both online (OL) and paper‐and‐pencil (PP) versions. Statistical investigations of performance differences between students given the ISTEP+ tests OL versus PP showed small differences, usually favoring PP‐based testing. Based on the recommendation of the external experts, the SBOE approved slightly revised student scores to
3
account for these mode differences. These revised scores have been implemented. It will be important to continue to monitor this issue in the future.
(7) There are potential concerns about the fairness of the ISTEP+ for students with disabilities and English learners. One issue noted was that the practice online test and the actual online test engines were different – students practiced on a different testing system than was actually used. A more serious issue was that students who needed to use two or more accommodations simultaneously were unable to do so. This is an issue that will need to be addressed with the new ISTEP+ vendor.
To the extent that the ISTEP+ can be improved for administration and implementation in the future, the reports appended below provide such recommendations. It should be noted that the SBOE has taken the first, and most critical step in addressing improvements in the ISTEP+, namely, establishing an independent Technical Advisory Committee. Looking ahead, there is a new vendor supporting the ISTEP+ program in 2016 and beyond, which means a transition from a long‐standing contractor, CTB, to Pearson Assessment. This transition will introduce opportunities for the new management to address the technical and operational challenges of the program and for the IDOE and SBOE to monitor them as they do so.

4
Overview of the Investigation of the Validity of the Indiana 2015 ISTEP+ Assessment Program
Overview of the Investigation – Because the 2015 ISTEP+ assessment program was completely new and based on new academic standards, using untried assessment items – an operational field test – the Indiana State Board of Education (SBOE) contracted with two assessment specialists (Edward Roeber, Assessment Director, Michigan Assessment Consortium and Derek Briggs, Professor, University of Colorado) to conduct a comprehensive validity study to determine support for the inferences and uses of the ISTEP+ assessment for student instructional improvement, as well as educator and school accountability. There are a number of ways in which the validity of the ISTEP+ assessment program could be examined. In early discussions, over 25 potential studies were identified. However, not all of these potential studies are of the same importance, either for review of the 2015 ISTEP+ program, or for planning for the ISTEP+ in the future. A final draft plan prioritized the studies into three levels —high, moderate, and lower priority. Each of the studies bears some attention; in fact, some studies in the “low priority” category are ones that were placed in that category because it is too late to implement them after the assessment of students has concluded, but they may be important to incorporate into planning for future programs, since we believe that the validity of the assessment systems used at the state level should be examined on an on‐going basis. The final draft of the planning document is shown in Appendix A. Seven validity studies were agree to by the SBOE staff and assessment specialists. Each of the seven studies is briefly described in Figure 1.
Figure 1. Summary of Agreed‐Upon 2015 ISTEP+ Validity Studies
Study Number
Study Title Short Description
1 Standards Alignment
Determine the extent to which the 2015 ISTEP+ measured challenging college and career ready content standards adopted by the SBOE, as well as the process by which assessment content was determined.
2 Assessment Design
Describe how the 2015 ISTEP+ assessments were designed, whether comprehensive assessment blueprints were developed and used to determine the ISTEP+ test content, with documentation of design differences for the online versus paper‐based assessments.
3 Psychometric Evidence
Statistical data that supports the adequacy of the 2015 ISTEP+ tests, as well as the adequacy of the ISTEP+ reports of results.
4 Standard Setting
Evidence of the adequacy of the procedures used to set standards on each of the ISTEP+ tests, the rigor of those standards, the acceptance of them by those who set them, and the adoption of the standards by the SBOE.
5 Statistical Support for ISTEP+ Growth Reporting
The extent to which the ISTEP+ score scale will support inferences about growth and progress in student achievement.
6 Comparability of Paper‐Based and Online Assessment
The extent to which the ISTEP+ assessment mode of administration (online versus paper‐based) results in differences between the two modes, and if so, what adjustments if any should be made in students’ scores.
5
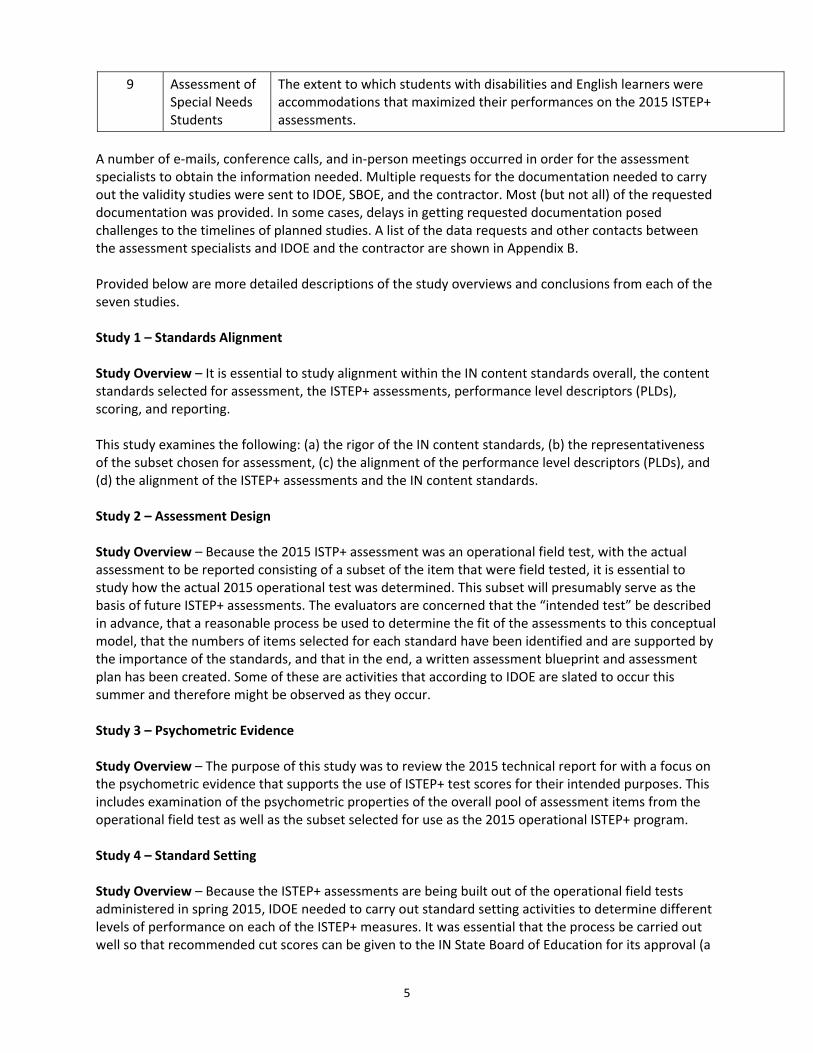
9 Assessment of Special Needs Students
The extent to which students with disabilities and English learners were accommodations that maximized their performances on the 2015 ISTEP+ assessments.
A number of e‐mails, conference calls, and in‐person meetings occurred in order for the assessment specialists to obtain the information needed. Multiple requests for the documentation needed to carry out the validity studies were sent to IDOE, SBOE, and the contractor. Most (but not all) of the requested documentation was provided. In some cases, delays in getting requested documentation posed challenges to the timelines of planned studies. A list of the data requests and other contacts between the assessment specialists and IDOE and the contractor are shown in Appendix B. Provided below are more detailed descriptions of the study overviews and conclusions from each of the seven studies. Study 1 – Standards Alignment Study Overview – It is essential to study alignment within the IN content standards overall, the content standards selected for assessment, the ISTEP+ assessments, performance level descriptors (PLDs), scoring, and reporting. This study examines the following: (a) the rigor of the IN content standards, (b) the representativeness of the subset chosen for assessment, (c) the alignment of the performance level descriptors (PLDs), and (d) the alignment of the ISTEP+ assessments and the IN content standards. Study 2 – Assessment Design Study Overview – Because the 2015 ISTP+ assessment was an operational field test, with the actual assessment to be reported consisting of a subset of the item that were field tested, it is essential to study how the actual 2015 operational test was determined. This subset will presumably serve as the basis of future ISTEP+ assessments. The evaluators are concerned that the “intended test” be described in advance, that a reasonable process be used to determine the fit of the assessments to this conceptual model, that the numbers of items selected for each standard have been identified and are supported by the importance of the standards, and that in the end, a written assessment blueprint and assessment plan has been created. Some of these are activities that according to IDOE are slated to occur this summer and therefore might be observed as they occur. Study 3 – Psychometric Evidence Study Overview – The purpose of this study was to review the 2015 technical report for with a focus on the psychometric evidence that supports the use of ISTEP+ test scores for their intended purposes. This includes examination of the psychometric properties of the overall pool of assessment items from the operational field test as well as the subset selected for use as the 2015 operational ISTEP+ program. Study 4 – Standard Setting Study Overview – Because the ISTEP+ assessments are being built out of the operational field tests administered in spring 2015, IDOE needed to carry out standard setting activities to determine different levels of performance on each of the ISTEP+ measures. It was essential that the process be carried out well so that recommended cut scores can be given to the IN State Board of Education for its approval (a

6
step necessary before score reports can be produced). The procedures used and the data that results need to be well documented. Study 5 – Statistical Support for ISTEP+ Growth Reporting Study Overview – Because the intention of IDOE and ISBE is to monitor changes in the performance of IN students over time, and perhaps calculate growth scores for educators for use in educator evaluation, it is essential to determine how well the ISTEP+ score scale will support inferences about growth and progress in student achievement. There are two ways the ISTEP+ test scores can be used to support inferences about growth. The first is to compare student scores from grade to grade directly; this is the purpose of a vertical sale. The second is to compute student growth percentiles, and this is the current metric used as part of Indiana’s school accountability system. To evaluate the support of inferences made using the ISTEP+ vertical scales in math and ELA we examine the design and calibration of these scales as documented by CTB, and we consider whether the subsequent growth interpretations are sensible and plausible. With respect to the use of ISTEP+ scores to compute student growth percentiles, our examinination focuses an looking for evidence of floor and ceiling effects, since these would pose serious threats to the use of student growth percentiles for accountability decisions. Study 6 – Comparability of Paper‐Based and Online Assessment Study Overview – A key issue for states that use online assessments for most but not all students is how comparable are the results of the assessments given on paper to those administered online? This is important to study both for considering the policy issue of whether universal online assessment should be used, as well as whether any adjustments to students’ scores should be made since the ISTEP+ test results are used in school and in educator accountability. Study 7 – Assessment of Special Needs Students Study Overview – An important issue for students, parents, and local educators is whether students with disabilities (SWDs) and English language learners (ELLs) were able to able to access the ISTEP+ assessments in a manner that gave them the opportunity of using all of the accommodations that their IEP or planning teams felt were necessary for the students to participate in the best manner possible. However, it is too late to carry out surveys of parents or educators for the 2015 program. Hence, our planning is more future‐orientated. A separate report of each of the seven studies was also prepared. These more detailed findings from each study are shown in Appendix C.

7
Appendix A
Potential Indiana 2015 ISTEP+ Validity Studies Version 2.1 – June 17, 2015 Summary Edward Roeber and Derek Briggs
There are a number of ways in which the validity of the ISTEP+ assessment program could be examined. In a previous draft of the validity study plan, over 25 potential studies were identified. However, not all of these potential studies are of the same importance, either for review of the 2014‐15 ISTEP+ program, or in planning the ISTEP+ program for 2015‐16 and beyond. Therefore, this draft plan prioritizes the studies into three levels —high, moderate, and lower priority. Each of the studies bears some attention; in fact, some studies in the “low priority” category are ones that are placed in that category because it is too late to implement them now in studying the assessment program during the summer time, but they may be important to incorporate into planning for future programs, since we believe that the validity of the assessment systems used at the state level should be examined on an on‐going basis.
Proposed Activities
High Priority Studies Study 1 Standards Alignment—It is essential to study alignment within the IN content standards overall, the content standards selected for assessment, the ISTEP+ assessments, performance level descriptors (PLDs), scoring, and reporting. This study would focus on the rigor of the IN content standards, the representativeness of the subset chosen for assessment, the nature of the ISTEP+ assessments, the alignment of the PLDs and the IN content standards, the alignment of the ISTEP+ assessments and the IN content standards, scoring is aligned to IN content standards, and the structure of the score reports based on the structure of the IN content standards is supported statistically. Methodology—Ideally, the IN Department of Education will have conducted a study of alignment such as a Webb alignment study. Thus, the evaluators will review the written results of the study that determine the level of rigor of the IN content standards, the representativeness of the standards that are assessed, and the match of the rigor of the assessments to the rigor of the standards. Our review would focus on the results of the alignment study. If such a study has not yet been carried out, we strongly urge IDOE to select a vendor for conducting such a study. This is essential to not only evaluate the quality of the 2015 assessments, it is essential to plan how to enhance the ISTEP+ program in 2016 and beyond. The evaluators will also seek documentation of the process used to create PLDs (the steps used, the representativeness of the panels used, and the review and approval processes), the alignment of the test scoring processes for written‐response items to the standards, and the statistical support for the score reporting structure for the ISTEP+ test results (using data to be supplied by the IDOE or its contractor). Study 2 Assessment Design—Because the 2015 ISTP+ assessment was an operational field test, with the actual assessment to be reported (and presumably, serving as the basis of future ISTEP+ assessments), it is essential to study how the actual 2015 operational test is determined. The evaluators are concerned that the “intended test” be described in advance, that a reasonable process be used to determine the fit of the assessments to this conceptual model, that the numbers of items selected for each standard have

8
been identified and are supported by the importance of the standards, and that in the end, a written assessment blueprint and assessment plan has been created. Some of these are activities that according to IDOE are slated to occur this summer and therefore might be observed as they occur. Methodology—The evaluators propose to interview IDOE staff and contractor staff to determine the current status of any written documentation of the intended assessment, an assessment blueprint, and/or written assessment design. The evaluators will review any written documentation that has been created and plan structured interviews of key IDOE and contractor staff. If the selection of the actual items occurs in one or more meetings, as an optional activity, the evaluators could attend such a meeting and look at the process of item selection as it occurs. Study 3 Statistical Soundness of the Assessment Measures—This study incorporates a number of the previously defined studies. This includes a review of the analyses planned and carried out by the contractor, the statistical data available from the contractor for these analyses, and a review of any technical reports that include these statistical results. This review would focus on the technical qualities of the various assessment items used, as well as the subset selected for use as the 2015 operational ISTEP+ program, how well the subsets of items represent the content standard that they measure, and whether the reporting structure used is supported statistically. Methodology—The evaluators will seek the statistical data for all of the assessments, as well as for the subsets of item selected as the operational tests for 2015. Reviews will focus on item, domain, and sub‐domain results. Any written documentation provided by the contractor (e.g., summaries of data, data tables, sections intended for technical reports) will also be sought and reviewed. The goal of the review will be to summarize the steps taken to validate the item pools (e.g., content reviews, DIF analyses, and other activities), the nature of the statistical data that is available, and overall judgments of the qualities of the item pool and the 2015 assessments drawn from them. Study 4 Standard Setting—Because the ISTEP+ assessments are being built out of the operational field tests administered in spring 2015, IDOE will need to carry out standard setting activities to determine different levels of performance on each of the ISTEP+ measures. It is essential that the process be carried out well so that when recommended cut scores are given to the IN State Board of Education for its approval (a step necessary before score reports can be produced). The procedures used and the data that results needs to be well documented. Methodology—The evaluator team will review the statistical nature of the standard setting process and outcomes (which would be done from statistical data produced by the conclusion of the standard setting activities) and prepare a summary of this information for the written report. Study 5 Statistical Support for ISTEP+ Growth Reporting—Because the intention of IDOE and ISBE is to monitor changes in the performance of IN students over time, and perhaps calculate growth scores for educators for use in educator evaluation, it is essential to determine how well the ISTEP+ score scale will support inferences about growth and progress in student achievement. Methodology—There are several analyses that would be carried out. These include an analysis of grade and subject specific test score distributions for evidence of floor and ceiling effects, an analysis of common item design used as basis for vertical scales, separation of the across grade within subject score distributions implied by calibration of vertical scale, and evidence that the property of parameter invariance holds.

9
Evaluators will seek the statistical data for all of the assessments, as well as for the subsets of item selected as the operational tests for 2015. Reviews will focus on item‐level and overall results for each content area across grade levels. Written documentation provided by the contractor (e.g., summaries of data, data tables, sections intended for technical reports) will also be sought and reviewed. The goal of the review will be to summarize the adequacy of the score scales for future growth and progress reporting. Moderate Priority Studies These two studies are important to carry out, but are somewhat less essential to the ISTEP+ program validity than those listed above. We recommend that both of these also be completed. Study 6 Comparability Study of Paper‐Based and Online Assessment—A key issue for states that use online assessments for most but not all students is how comparable are the results of the assessments given on paper to those administered online? This is important to study both for considering the policy issue of whether universal online assessment should be used, as well as whether any adjustments to students’ scores should be made since the ISTEP+ test results are used in school and in educator accountability. Methodology—The IDOE plans presented to the ISBE in May 2015 included “Paper/pencil and online comparability studies” for completion in August 2015. We suggest that DB review the plans for the study or studies, and provide his reactions to them this summer, and then monitor the conduct of the study or studies over the summer, and finish this by reviewing the results of the study or studies. Study 7 Assessment of Special Needs Students—An important issue for students, parents, and local educators is whether students with disabilities (SWDs) and English language learners (ELLs) were able to able to access the ISTEP+ assessments in a manner that gave them the opportunity of using all of the accommodations that their IEP or planning teams felt were necessary for the students to participate in the best manner possible. However, it is too late to carry out surveys of parents or educators for the 2015 program. Hence, our planning is more future‐orientated. Methodology—We propose to review any formal survey data or informal data (e.g., complaints, e‐mails, issue logs) that would shine light on any issues related to test administration training and materials, as well as student access and use of the online test system should be reviewed by the evaluators We propose to create three types of online surveys for use in 2016 and the future: 1) test administrators, 2) teachers of SWDs and ELLs, and 3) parents. The educator surveys could be sent to all schools, or a sample of school corporations could first be drawn to focus the survey on school corporations with more ELL and SWD students. The parent survey could be disseminated to IN school corporations for inclusion on the schools’ websites. Study 8 Quality of the Scoring of Open‐Response Items (Placed on Hold)—One question often raised by educators and others when a considerable number of open‐ or written‐response items are used is whether the scoring was carried out in a reliable and valid manner. Data that would support assertions that the data that results from the use of such assessments can be trusted is typically available from contractors that carry out this sort of work. Methodology—The evaluators propose to examine the data from training, certification, and on‐going reliability and validity of scoring provided by the contractor, since this work will likely have been completed by the time that the validity study is under way.

10
Lower Priority Studies The two studies listed below are not unimportant. Instead, they are indicated as lower priority because data to conduct them well is not currently available, but they are areas that should be built into future validation efforts for the ISTEP+ program. Study 9 Assessment Administration in 2015 (Placed on Hold)—There are a number of aspects of the 2015 assessment administration that are important, but may now be too late to study directly. For example, how satisfied were test coordinators and test administrators with the training they received about administering the 2015 tests, the quality and adequacy of the assessment administration manuals and directions, how easily students were able to take the assessments online, and the availability and stability of the online testing system when needed. Unless the IDOE has already collected data for 2015, it is too late to do so now. However, we feel that it is important to study such aspects of a large‐scale assessment program on an ongoing basis. Methodology—We feel that any formal surveys or informal data that would shine light on any issues related to test administration training and materials, as well as student access and use of the online test system should be reviewed by the evaluators, since these types of data may shed light on the quality of the assessment data collected. We also propose to create several types of online surveys for use in 2016 and the future: 1) test coordinators, 2) test administrators, 3) students, and 4) parents. We propose that the student survey be embedded in the online assessment experience, at the conclusion of testing, so that data could easily be collected on an on‐going basis. The parent survey could be disseminated to IN school corporations for inclusion on the schools’ websites. Kickoff Meeting – We propose to kick off this activity with a two‐day meeting in Indianapolis with Indiana State Board of Education (ISBE), then with ISBE and Indiana Department of Education (IDOE) staff together, and then finally, a meeting with ISBE staff. Preparation and Presentation of Final Report – It is anticipated that additional days per evaluator result will be required for the preparation of the final report, the review of the report by ISBE staff, and updates to the report. It is anticipated that additional days will be required for presentation of the report to the ISBE and ISBE staff. Overall Contract Management – A study of this scope will require considerable consultation with ISBE staff, IDOE staff, and the outgoing ISTEP+ contractor. Although anticipated time and other expenses are outlined above, there is additional management time that is necessary to successfully carry out the activities listed. Therefore, we add to the plan one mid‐study face‐to‐face meeting (ER) in addition to the kick‐off meeting and the presentation of the study results at the conclusion of the study.

11
Appendix B Timeline of Requests for Documentation
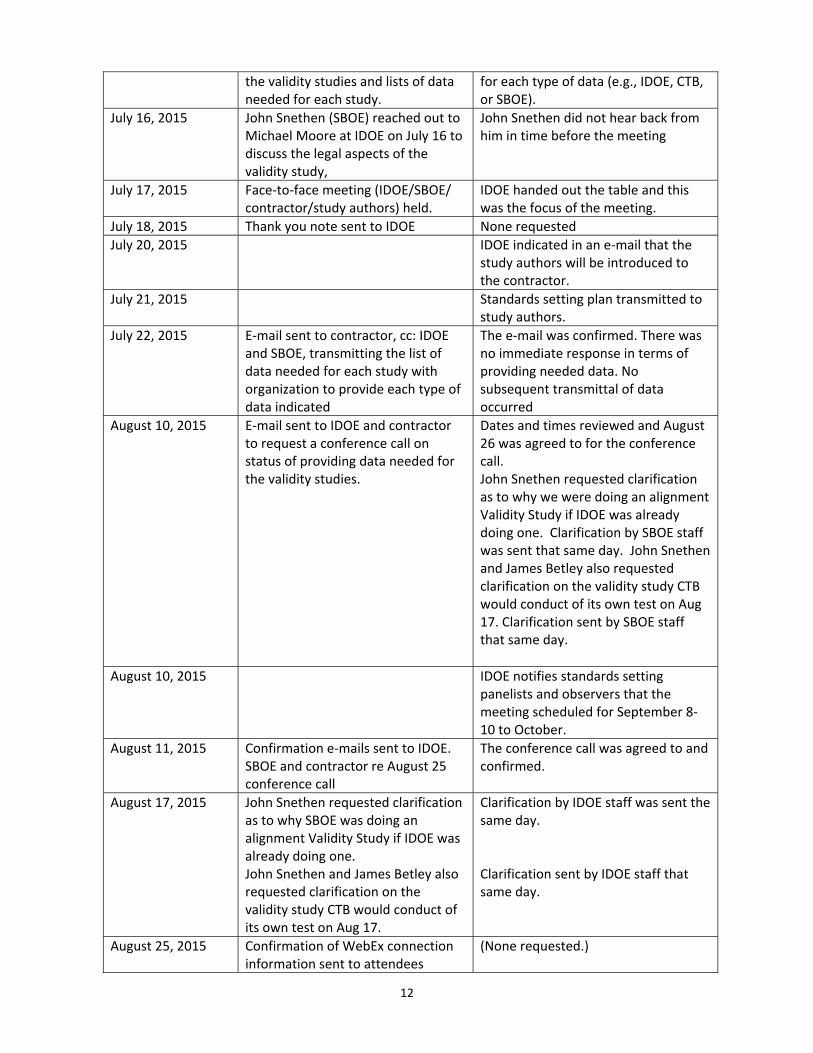
For each proposed validity study, a series of questions or prompts that if answered would lend support to inferences that could be drawn about the validity of different aspects of the 2015 ISTEP+ program were identified. Then, potential data sources were identified to respond to each question or prompt, and the provider of the data – the SBOE, Indiana Department of Education (IDOE), or CTB/McGraw‐Hill, the vendor for the 2015 ISTEP+ program – was also identified. The consultants sought to obtain the information from the identified source. The information desired was not always available, due to it never having been prepared, not having been retained, or unavailable in the desired format. This is not unusual since the information desired was not identified until after the conclusion of the 2015 ISTEP+ program and thus was not built into the operational plans for program. The lack of available information did hamper arriving at definitive conclusions for some of the validity studies, however. A record of the steps taken to discuss data needs with IDOE, SBOE staff, and contractors is shown in Figure 2. The available data was reviewed by the study authors. Figure 2. Schedule of Requests and Responses to Indiana Validity Study Data Requests
Date(s) Request/Action by Study Authors/SBOE Staff
Response from IDOE/Contractor
May 27, 2015 Initial design papers on IN Validity Studies prepared
SBOE was determining the second researcher and working through internal logistics of contracts etc, before looping in IDOE. Also, new Board members were starting with the June 3rd meeting and needed to brief them on what was going on, including the resolution to do the validity study that was passed by the former board during the April mtg. Derek Briggs agreed to participate in study on June 10. Materials sent to him at that time.
June 11, 2015 E‐mail from SBOE transmitting the IN validity study design and data needs
SBOE indicates the reasonableness of the study designs and data needs.
June 15, 2015 Specific data needed for each IN validity study identified
Data requirements needed to be reviewed internally before being sent to IDOE. Edits were sent for review internally to the SBOE staff on June 23rd. Final edits were not completed until July 2nd and were shared by SBOE staff with Drs. Roeber and Briggs.
July 3, 2015 Study authors (Roeber/Briggs) complete the Indiana Validity Study designs, information needed, schedule, and budget.
The study design paper was sent to IDOE.
July 9, 2015 Confirmation of face‐to‐face meeting to review the data needed for the IN Validity Study. Attached is the narrative overview of
SBOE scheduled the meeting in the IDOE offices. IDOE took the data requested lists and produced tables of requested data, indicating the source
12
the validity studies and lists of data needed for each study.
for each type of data (e.g., IDOE, CTB, or SBOE).
July 16, 2015 John Snethen (SBOE) reached out to Michael Moore at IDOE on July 16 to discuss the legal aspects of the validity study,
John Snethen did not hear back from him in time before the meeting
July 17, 2015 Face‐to‐face meeting (IDOE/SBOE/ contractor/study authors) held.
IDOE handed out the table and this was the focus of the meeting.
July 18, 2015 Thank you note sent to IDOE None requested
July 20, 2015 IDOE indicated in an e‐mail that the study authors will be introduced to the contractor.
July 21, 2015 Standards setting plan transmitted to study authors.
July 22, 2015 E‐mail sent to contractor, cc: IDOE and SBOE, transmitting the list of data needed for each study with organization to provide each type of data indicated
The e‐mail was confirmed. There was no immediate response in terms of providing needed data. No subsequent transmittal of data occurred
August 10, 2015 E‐mail sent to IDOE and contractor to request a conference call on status of providing data needed for the validity studies.
Dates and times reviewed and August 26 was agreed to for the conference call. John Snethen requested clarification as to why we were doing an alignment Validity Study if IDOE was already doing one. Clarification by SBOE staff was sent that same day. John Snethen and James Betley also requested clarification on the validity study CTB would conduct of its own test on Aug 17. Clarification sent by SBOE staff that same day.
August 10, 2015 IDOE notifies standards setting panelists and observers that the meeting scheduled for September 8‐10 to October.
August 11, 2015 Confirmation e‐mails sent to IDOE. SBOE and contractor re August 25 conference call
The conference call was agreed to and confirmed.
August 17, 2015 John Snethen requested clarification as to why SBOE was doing an alignment Validity Study if IDOE was already doing one. John Snethen and James Betley also requested clarification on the validity study CTB would conduct of its own test on Aug 17.
Clarification by IDOE staff was sent the same day. Clarification sent by IDOE staff that same day.
August 25, 2015 Confirmation of WebEx connection information sent to attendees
(None requested.)

13
August 26, 2015 Re‐transmittal of the IN Study Design and list of data needed for each study to contractor/IDOE/SBOE
Reminder of the data needed acknowledged.
Conference call conducted The need for data and the assignments to provide the data was agreed to.
September 11, 2015 Contractor sends validity study authors contact information for contractor staff.
September 14, 2015 IDOE sends the data lists with contact information.
September 17, 2015 SBOE contacts IDOE about the cancellation of the Sept 17 meeting, which was sent on Sept 17th, and expressed concern over the potential delay it could cause to the ability to complete the different validity studies. SBOE staff met with IDOE staff to discuss the delays on the afternoon of Sept 17. SBOE staff internally discussed reaching out to Ellen Haley, CTB president about the delays and the impact.
IDOE sends note to SBOE and study authors suspending work on the validity study due to prep for standards setting. The e‐mail contained this note: “The IDOE has asked CTB to prioritize preparations for cut score setting and deliverables to Pearson over the next three weeks, so we will need to suspend our ISTEP+ Validity work until the week of October 12.”
September 30, 2015 IDOE sends e‐mail that a FTP site has been set up and will be used to provide needed data/materials. Information posted in subsequent batches during October. IDOE was contacted on September 21st about getting the FTP site set up.
October 26, 2016 Note from SBOE indicates that IDOE and contractor report that pulling together the needed data is delaying their efforts to report statewide assessment results.
SBOE staff also requested information about which studies must be completed before the release of results to try and triage the impact of the delays. Requested information was received from contractors the same day and shared with both SBOE and IDOE staff. October IDOE staff

14
again reminded, and SBOE staff copied, about which studies to prioritize for the release of ISTEP+ results.
October 26, 2015 E‐mail sent to IDOE/contractor/ SBOE reminding everyone which data had been provided, organized by validity study and data elements requested. Showed which data elements for which no data had been provided. Indicated that the data uploaded in early October had now been taken down, and which studies there was much data made available and those with little or no data. Requested that the data be re‐loaded.
IDOE responded by indicating that a discussion with the contractor would take place, but also asking which data had been received and which was still needed Data previously uploaded on FTP site was re‐loaded.
November 3, 2015 Confirmation e‐mails sent to IDOE indicating that the requested re‐posts of previously uploaded materials had occurred. Study authors indicated that the number of pieces of data provided is not overwhelming in number, with many coming from SBOE not IDOE or the contractor.
(No response requested.)
November 20, 2015 E‐mail sent regarding validity study 9 (assessment of special needs students) sent to IDOE/SBOE/ contractor asking if a record of assessment issues or an issues log was used for the 2015 ISTEP+ assessments.
No response from IDOE or the contractor.
November 30, 2015 Reminder e‐mail sent regarding a record of assessment issues or a issues log being used for the 2015 ISTEP+ assessments.
Response from IDOE and from the contractor indicated that no records of issues that arose during the assessment had been kept and there was no issue logs used.
December 28, 2015 Email sent to CTB requesting clarifications and additional information regarding design and calibration of ISTEP+ vertical scales
No response to this request as of 1/17/16
December 30, 2015 The emails about the delay in the Tech report along with the request for the draft occurred on Dec 30th.
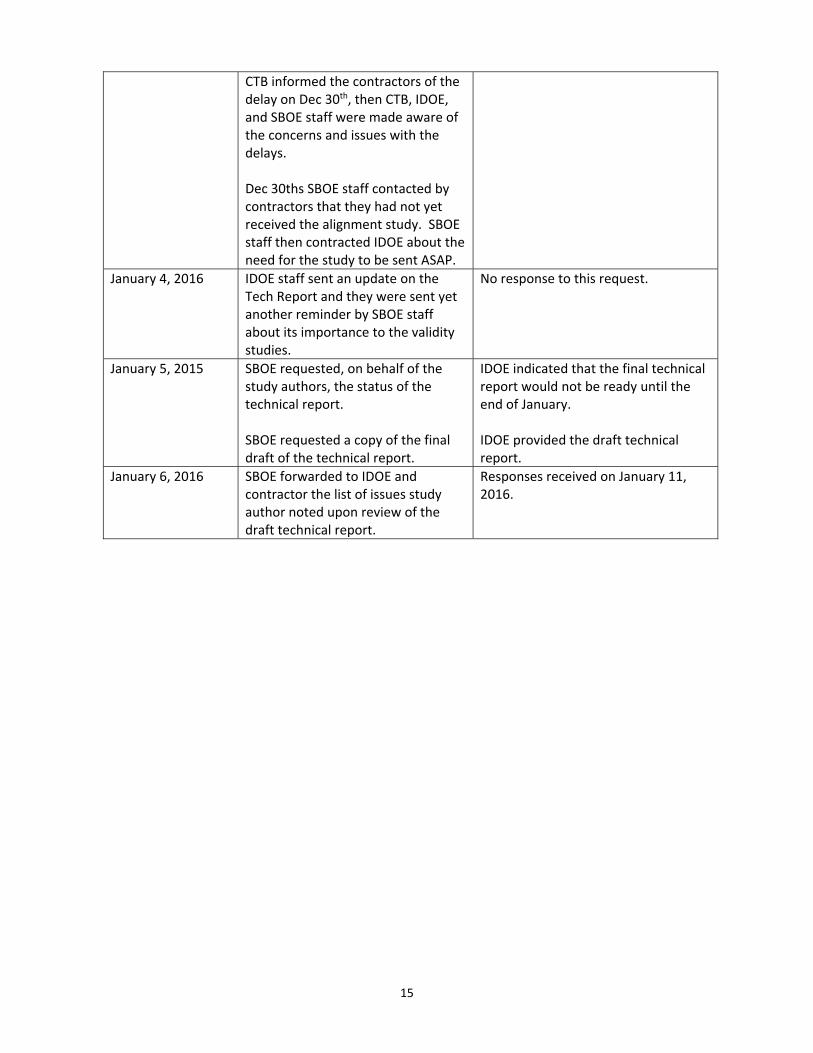
15
CTB informed the contractors of the delay on Dec 30th, then CTB, IDOE, and SBOE staff were made aware of the concerns and issues with the delays. Dec 30ths SBOE staff contacted by contractors that they had not yet received the alignment study. SBOE staff then contracted IDOE about the need for the study to be sent ASAP.
January 4, 2016 IDOE staff sent an update on the Tech Report and they were sent yet another reminder by SBOE staff about its importance to the validity studies.
No response to this request.
January 5, 2015 SBOE requested, on behalf of the study authors, the status of the technical report. SBOE requested a copy of the final draft of the technical report.
IDOE indicated that the final technical report would not be ready until the end of January. IDOE provided the draft technical report.
January 6, 2016 SBOE forwarded to IDOE and contractor the list of issues study author noted upon review of the draft technical report.
Responses received on January 11, 2016.

16
Appendix C Detailed Study Reports
The more detailed report of each of the seven studies is shown in this appendix. This includes the reports for the following studies:
Study Number Study Title
1 Standards Alignment
2 Assessment Design
3 Psychometric Evidence
4 Standard Setting
5 Statistical Support for ISTEP+ Growth Reporting
6 Comparability of Paper‐Based and Online Assessment
7 Assessment of Special Needs Students

1
Indiana Validity Study Report Outline V. 1.1
Validity Study Number: 1 Short Title: Standards Alignment Lead Author: Roeber Key Study Findings: We found several shortcomings in the design and development of the 2015 ISTEP+ program. In particular, while the Indiana Academic Standards have been characterized as rigorous and focusing on college‐ and career‐readiness, the independent alignment study carried out by WestEd did not measure the rigor of the Indiana Academic Standards. The alignment study does provide equivocal evidence in support of the alignment of the ISTEP+ math and ELA test items. The alignment study indicated that a preponderance of the items used in mathematics and English/language arts were only at the recall or basic application levels, not the higher levels of strategic thinking or extended thinking. This raises questions about whether the ISTEP+ is eliciting adequate information about student’s higher order thinking skills. Study Overview: It is essential to study alignment within the IN content standards overall, the content standards selected for assessment, the ISTEP+ assessments, performance level descriptors (PLDs), scoring, and reporting. This study examines the following: (a) the rigor of the IN content standards, (b) the representativeness of the subset chosen for assessment, (c) the alignment of the performance level descriptors (PLDs), and (d) the alignment of the ISTEP+ assessments and the IN content standards. Methodology—Ideally, the IN Department of Education will have conducted a study of alignment such as a Webb alignment study. Thus, the evaluators would be able to review the written results of the study that determine the level of rigor of the IN content standards, the representativeness of the standards that are assessed, and the match of the rigor of the assessments to the rigor of the standards. Our review could focus on the results of the alignment study. If such a study has not yet been carried out, the IDOE is urged to select a vendor for conducting such a study. This is essential to not only evaluate the quality of the 2015 assessments, it is essential to plan how to enhance the ISTEP+ program in 2016 and beyond. The evaluators also sought documentation of the process used to create PLDs (the steps used, the representativeness of the panels used, and the review and approval processes), the alignment of the test scoring processes for written‐response items to the standards, and the statistical support for the score reporting structure for the ISTEP+ test results (using data to be supplied by the IDOE or its contractor).
Study Data Needs and Information Supplied
Documentation Sought Documentation Provided by CTB/IDOE/SBOE
A. Indiana Content Standards document. Their approval, if any, by the SBOE or other entities.
1 ‐ A 2014‐03‐12_9.H.1_resolution_Education_Roundtable_‐‐_Resolution_‐‐_Social_Studies_Standards.pdf
1 ‐ A 2014‐03‐12_OBrien_Support_Resolution.pdf 1 ‐ A 2014‐06‐04_SBOEPPTReadyStds (1).ppt 1 ‐ A SBOE_CCSS_Resolution_07.19.2013.pdf 1 ‐ A sboe‐resolution‐academic‐standards‐adoption‐
proposed‐oliver‐111113.pdf 1 ‐ A sboe‐resolution‐academic‐standards‐adoption‐
proposed‐oliver‐111113(1).pdf 1 ‐ A SBOEPPTReadyStds5‐14‐14mtg.ppt resoultion approving ela and math standards.pdf
B. Documentation of the development of the current set of content standards.
1 ‐ B 2014‐04‐28_State_Board_CCR_standards_presentation.pdf

2
1 ‐ B standards_evaluation_resolution‐updated12‐12‐13.pdf
C. Documentation of strategies employed to establish the rigor of the Indiana Content Standards. Results of the reviews or analyses of the standards to demonstrate their relationship to college and career readiness.
2015 ISTEP+ Alignment Study Final Report_WestEd.pdf
D. A written description of the process used toselect the subset of Indiana Content Standards selected for assessment. The approval, if any, by the SBOE or other entities.
1 ‐ D Process Used to Select IN Tests.docx
E. Documentation of the alignment of the ISTEP+ items to the content standards selected for assessment, including the results of any alignment reviews, whether conducted by committee or using more technical process such as the Webb Alignment Tool.
1 ‐ E Alignment.docx 2015 ISTEP+ Alignment Study Final
Report_WestEd.pdf
F. Documentation of the processes and procedures used to create, edit, review, revise the ISTEP+ Performance Level Descriptors. The approval by the SBOE or other entity.
No information on the process used to create the PLDs was provided. Approval of the PLDs by the SBOE was not provided.
G. The Performance Level Descriptors chosen for each grade/grade range and content area assessed by ISTEP+.
No information was provided
H. Documentation that the scoring of written‐response items is related to the Indiana Academic Standards selected for assessment.
No information was provided
I. Statistical documentation that the reporting structures (e.g., sub‐score reporting) are aligned to the to the Indiana Content Standards structure(s) and are statistically sound.
ISTEP_Spring15_Technical Report_1_4_16_ final _ draft.docx
Summary of Documentation A. Approval of the Indiana Content Standards document by the SBOE or other entities.
Response: Eight documents were provided for review. The documents provided clearly indicate that the Indiana Board of Education (SBOE) has approved the Mathematics, ELA, Science, and Social Studies content standards measured in the 2015 ISTEP+ assessments.
B. Documentation of the development of the current set of content standards.
Response: Two documents were provided to describe the manner in which the content standards that are being measured in the current ISTEP+ assessment were developed. The most pertinent of the two is a pdf of the PowerPoint presentation used to describe the process of development of the academic

3
content standards in ELA and Mathematics to the SBOE on April 28, 2014. The PPT outlines the process used, which appears to be an appropriate and inclusive one, although most of the details about who actually created the academic content standards is missing from the PPT and not provided
C. Documentation of strategies employed to establish the rigor of the Indiana Content Standards. Results of the reviews or analyses of the standards to demonstrate their relationship to college and career readiness.
Response: IDOE contracted with WestEd to conduct an independent alignment study to examine the alignment of the ISTEP+ assessment to the 2014 Indiana Academic Standards in English/Language Arts and Mathematics. The key alignment criterion is the match of the Depth of Knowledge of Indiana’s standards and the items used to measure them. The alignment study did not review the Depth of Knowledge of Indiana’s academic standards, a serious shortcoming in the WestEd alignment methodology. Without the information on the standards, the actual alignment of the ISTEP+ tests to the Indiana Academic Standards cannot be determined. The alignment study did show that almost all ISTEP+ items are aligned fully or partially to most of the IN Academic Standards in each grade and content area. However, the alignment of items to at least one standard is not a particularly high bar to meet for the assessment items like those used in ISTEP+. Nonetheless, the alignment study did show that there are a few Indiana Academic Standards for which no assessment items were used. Table 31 from the WestEd report (p. 65) shows the results of the alignment analyses.
The WestEd alignment study also measured the Depth of Knowledge of the items used in the ISTEP+ tests (even though these could not be compared to the Depth of Knowledge of the Indiana Academic Standards). The results of these analyses are not encouraging, however. The alignment study showed, in E/LA that: “[a]lthough depth of knowledge (DOK) was distributed across all four levels, the majority of the E/LA items were assessed at a DOK Level 2: Basic Application. In general, DOK Level 1: Recall was emphasized slightly more than DOK Level 3: Strategic Thinking, and only 1–3% of all E/LA items across grade levels were assessed at a DOK Level 4: Extended Thinking” (WestEd, page 3). The alignment study indicated for Mathematics that “[w]hile there was a fairly strong representation of standards across the Mathematics assessment alignments, they were only assessed at the lowest levels of depth of knowledge. In grade 6, over two‐thirds of the assessment items were rated at a DOK Level 1” (WestEd, page 3). This finding from WestEd’s alignment study shows a considerable mismatch between the rigor of the ISTEP+ assessment items and the intended rigor of the Indiana Academic Standards, as currently
4
expressed on the IDOE website: “In April of 2014, the Indiana State Board of Education approved the adoption of new standards for English/Language Arts and Mathematics. These new standards are the result of a process designed to identify, evaluate, synthesize, and create high‐quality, rigorous standards for Indiana students. They have been validated as college and career ready by the Indiana Education Roundtable, the Indiana Commission for Higher Education, the Indiana Department of Education, the Indiana State Board of Education, and the Indiana Center for Education and Career Innovation. This means that students who successfully master these objectives for what they should know and be able to do in Math and English/Language Arts disciplines by the time they graduate from high school will be ready to go directly into the workplace or a postsecondary educational opportunity without the need of remediation.” (retrieved from http://www.doe.in.gov/standards, 1/18/16).
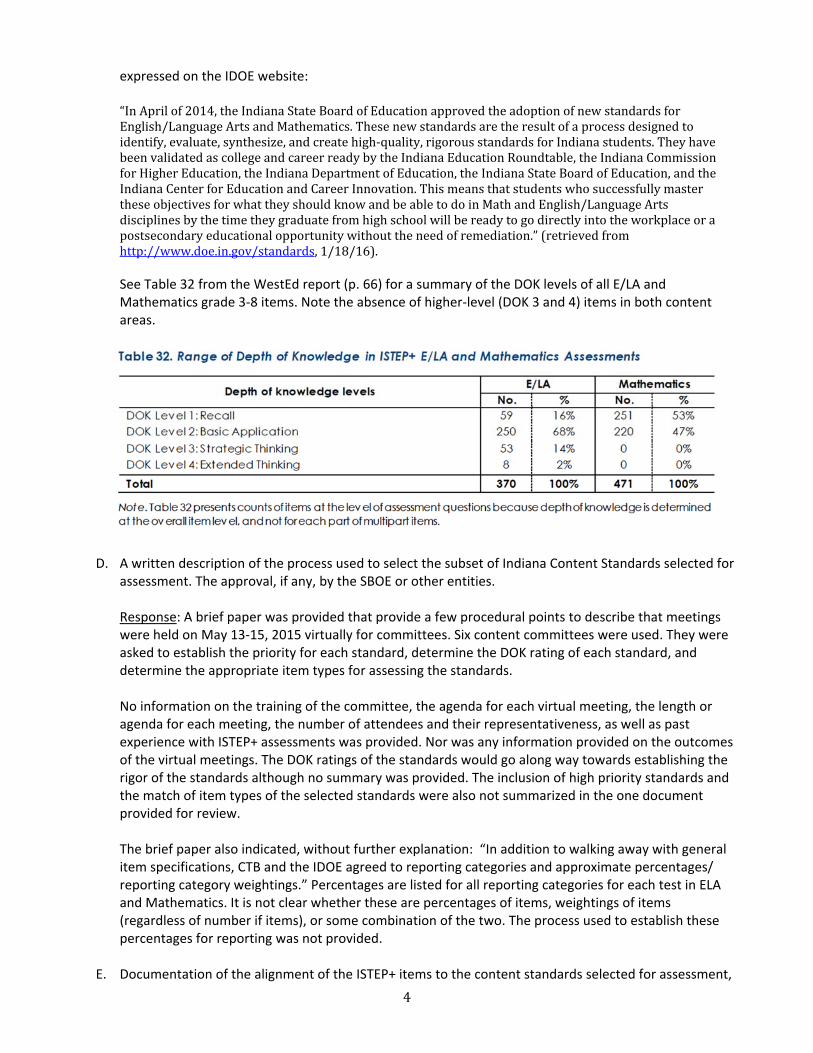
See Table 32 from the WestEd report (p. 66) for a summary of the DOK levels of all E/LA and Mathematics grade 3‐8 items. Note the absence of higher‐level (DOK 3 and 4) items in both content areas.
D. A written description of the process used to select the subset of Indiana Content Standards selected for assessment. The approval, if any, by the SBOE or other entities.
Response: A brief paper was provided that provide a few procedural points to describe that meetings were held on May 13‐15, 2015 virtually for committees. Six content committees were used. They were asked to establish the priority for each standard, determine the DOK rating of each standard, and determine the appropriate item types for assessing the standards. No information on the training of the committee, the agenda for each virtual meeting, the length or agenda for each meeting, the number of attendees and their representativeness, as well as past experience with ISTEP+ assessments was provided. Nor was any information provided on the outcomes of the virtual meetings. The DOK ratings of the standards would go along way towards establishing the rigor of the standards although no summary was provided. The inclusion of high priority standards and the match of item types of the selected standards were also not summarized in the one document provided for review. The brief paper also indicated, without further explanation: “In addition to walking away with general item specifications, CTB and the IDOE agreed to reporting categories and approximate percentages/ reporting category weightings.” Percentages are listed for all reporting categories for each test in ELA and Mathematics. It is not clear whether these are percentages of items, weightings of items (regardless of number if items), or some combination of the two. The process used to establish these percentages for reporting was not provided.
E. Documentation of the alignment of the ISTEP+ items to the content standards selected for assessment,

5
including the results of any alignment reviews, whether conducted by committee or using more technical process such as the Webb Alignment Tool.
Response: Documentation of two content and bias review meetings conducted in August 2014 was provided. The first meeting was an in‐person meeting conducted in Indianapolis, while the second was a virtual meeting conducted later in the month. The purpose of the meeting was for “teacher committees (to) review items for 1) alignment to IN CCR Standards, 2) grade‐level appropriateness, 3) DOK assignment.” The number of in‐person and virtual reviewers, and their representativeness, was not provided. The documentation provided included the instructions provided to reviewers, as well as summaries of the review results by content area and grade level. The item acceptance rates for Mathematics ranged from 97% to 100%, which is excellent. The item acceptance rates for ELA were a bit lower, ranging from 88% to 100%, still quite good. The report did not indicate the percentage of items rejected due to content alignment or DOK assignment. Thus, two of the three purposes of the review remain unanswered by this document.
F. Documentation of the processes and procedures used to create, edit, review, and revise the ISTEP+ Performance Level Descriptors. The approval by the SBOE or other entity.
Response: No information was provided about this element; thus no analysis is possible.
G. The Performance Level Descriptors chosen for each grade/grade range and content area assessed by ISTEP+.
Response: No information was provided about this element; thus, no analysis is possible
H. Documentation that the scoring of written‐response items is related to the Indiana Academic Standards selected for assessment. Response: No information was provided about this element; thus, no analysis is possible.
I. Statistical documentation that the reporting structures (e.g., sub‐score reporting) are aligned to the to
the Indiana Content Standards structure(s) and are statistically sound. Response: Subject‐specific sub‐scores are provided by CTB in accordance with reporting categories established by IDOE in consultation with IN teachers and other relevant stakeholders. Although the reliability of these sub‐scores can range anywhere from a low of .23 (grade 6 Writing: Conventions of Standard English) to a high of .84 (grade 3 Algebraic Thinking & Data Analysis), CTB reports these scores using an index approach (the ISI) that attempts to adjust for differences in sub‐score reliability.
Discussion The issues identified for this study were reviewed, given the data provided by CTB/IDOE/SBOE. The information provided, especially the alignment study conducted for the IDOE by WestEd (“ISTEP_Spring15_Technical Report_1_4_16_ final _ draft.docx”) seems to indicate that the Mathematics tests in particular measure the Indiana Academic Standards at a relatively low‐level (defined as Level 1 – Recall ‐ and to some extent Level 2 – Basic Application – of the Webb alignment methodology). While an emphasis on basic procedural knowledge is important, there are other, more challenging aspects to mathematics that appear to be under‐represented or missing.
6
The WestEd alignment study seemed to show a bit more balance of the level of skills assessed in the E/LA assessments, with the preponderance of items at Level 2 Basic Application and Level 1 Recall, and fewer at Level 3 Strategic Thinking. Although not so basic as in Mathematics, the E/LA assessments also tilt to the basic level of depth of knowledge. Conclusions The development and approval of the Indiana Academic Standards in English/Language Arts and Mathematics by the SBOE is well documented. The alignment study carried out by WestEd did not measure the rigor of the Indiana Academic Standards, using Depth of Knowledge (DOK) as the metric for measuring rigor. Thus key evidence of the rigor of the standards is missing. The alignment study did measure the DOK of the ISTEP+ items. The study indicated that the ISTEP+ mathematics tests contain only Recall and Basic Application standards (DOK Levels 1 and 2) and no items measuring Strategic Thinking or Extended Thinking standards (Levels 3 and 4). For example, over two‐thirds of the Grade 6 mathematics test items were rated at Level 1 (Recall). The results for E/LA are similar although not quite as dire. Two‐thirds of the ISTEP+ E/LA items were rated at DOK 2, followed by an equally small percent at DOK 1 and a few items measuring DOK 4. The alignment study suggests that there is some mismatch between the depth of the knowledge described in Indiana’s academic content standards and what students are expected to demonstrate on the ISTEP+ tests. The preponderance of DOK 1 and 2 items could raise questions about how and in what sense the ISTEP+ test is a more “rigorous” test than its predecessor. Recommendations
1. The imbalance in DOK 1, 2, 3 and 4 items suggests a possible lack of alignment needs to be directly addressed. This could be done by clarifying which of Indiana’s standards (below reporting category level) are measureable by the ISTEP+ and which are not.
2. More DOK 2 (and hopefully DOK 3) items should to be written to populate the ISTEP+ math tests. 3. The 2015 ISTEP+ items should be compared to the 2014 items in terms of both difficulty and DOK
level to make a better case that the ISTEP+ is more rigorous than the ISTEP.

Indiana Validity Study Report Outline V. 1.2
Validity Study Number: 2 Short Title: Assessment Design Lead Author: Roeber Key Study Findings: The ISTEP+ tests were assembled quickly, a result of the last‐minute policy changes at the state level. The tests were developed and implemented without the benefit of a comprehensive test blueprint to describe the manner in which items would be developed to match the rigor of the academic standards, with a design to achieve its intended purposes. This remains a need for the program going forward. Study Overview: Because the 2015 ISTEP+ assessment was an operational field test, with the actual assessment to be reported consisting of a subset of the item that were field tested, it is essential to study how the actual 2015 operational test was determined. This subset will presumably serve as the basis of future ISTEP+ assessments. The evaluators are concerned that the “intended test” be described in advance, that a reasonable process be used to determine the fit of the assessments to this conceptual model, that the numbers of items selected for each standard have been identified and are supported by the importance of the standards, and that in the end, a written assessment blueprint and assessment plan has been created. Some of these are activities that according to IDOE are slated to occur this summer and therefore might be observed as they occur. Methodology—The evaluators proposed to interview IDOE staff and contractor staff to determine the current status of any written documentation of the intended assessment, an assessment blueprint, and/or written assessment design. The evaluators will review any written documentation that has been created and plan structured interviews of key IDOE and contractor staff. If the selection of the actual items occurs in one or more meetings, as an optional activity, the evaluators could attend such a meeting and look at the process of item selection as it occurs.
Study Data Needs and Information Supplied
Documentation Sought Documentation Provided
A. Documentation of whether an assessment blueprint was created, either for use in 2015 as the basis for the “intended test,” or in 2016 and beyond to describe the parameters of future ISTEP+ assessments.
2 ‐ A 2014‐06‐04_ELA_resource_guide.pdf 2 ‐ A 2014‐07‐09_IER_‐_Assessment_Resolution‐
APPROVED.pdf
B. Documentation of how the intended assessment used in 2015 is the same or different from the operational forms to be used in 2016 and beyond.
No “intended test” was created, or if it was, documentation about it was not provided to the evaluators.
C. The assessment blueprints used to go from content standards to operational forms of ISTEP+ tests, by grade and content area.
Specifications s15_ELA_G3‐4_CCRA Standards_Specs_ET
Approved.xls s15_ELA_G5‐6_CCRA Standards_Specs_ET
Approved.xls s15_ELA_G7‐8_CCRA Standards_Specs_ET
Approved.xls 2 ‐ C M s15_Mathematics 6‐8
Standards_Specs_JM_FNL_5‐19‐14_2.xls 2 ‐ C M s15_Mathematics_G3‐5_CCRA
Standards_Specs_BK Approved.xls Blueprints

grade‐3‐ela‐blueprint.pdf grade‐3‐math‐blueprint.pdf grade‐4‐ela‐blueprint.pdf grade‐4‐math‐blueprint.pdf grade‐5‐ela‐blueprint.pdf grade‐5‐math‐blueprint.pdf grade‐6‐ela‐blueprint.pdf grade‐6‐math‐blueprint.pdf grade‐7‐ela‐blueprint.pdf grade‐7‐math‐blueprint.pdf grade‐8‐ela‐blueprint.pdf grade‐8‐math‐blueprint.pdf
D. Documentation of process used to create and implement the assessment blueprint.
No information was provided.
E. The actual assessment blueprint. 2 ‐ E Actual Blueprint.docx
F. More specifically—documentation of the number of test sessions, the number and types of items to be used in each, and session and total testing times has been created.
2 ‐ F More Specific Test Documentation.docx
G. Documentation of the process used to create the “intended test” and the persons involved in determining the “intended assessment.” Statistical documentation of how the subset of operationally‐field tested items used for the actual operational form were selected. Statistical documentation of the results of the item selection procedures for reporting in 2015.
2 ‐ G "Intended Test" Devel Process.docx 2 ‐G ISTEP2015_OP_Selection_GuideLines_V4_ Aug24.docx 2 ‐ G Spring 2015 ISTEP+ Part 1_Forms 1 and 2
Examiner's Manual Supplement_FINAL 2‐20‐15.pdf
Summary of Documentation Many documents were provided by the IDOE or SBOE. These were organized by the aspects listed by the evaluators and reviewed below. A. Documentation of whether an assessment blueprint was created, either for use in 2015 as the basis for
the “intended test,” or in 2016 and beyond to describe the parameters of future ISTEP+ assessments. Response: A resource guide for the ELA standards, which included a glossary of key terms and a guide
to text complexity, was provided. Also provided was a resolution from the IN Education Roundtable adopted in June 2014 related to the nature and types of assessments to be used in the IN statewide assessments.
Neither of these documents provided information about whether assessment blueprints were or are to
be created. B. Documentation of how the intended assessment used in 2015 is the same or different from the
operational forms to be used in 2016 and beyond. Response: No information was provided about this element, perhaps because no “intended test” was
ever created; thus, no analysis of this element is possible.
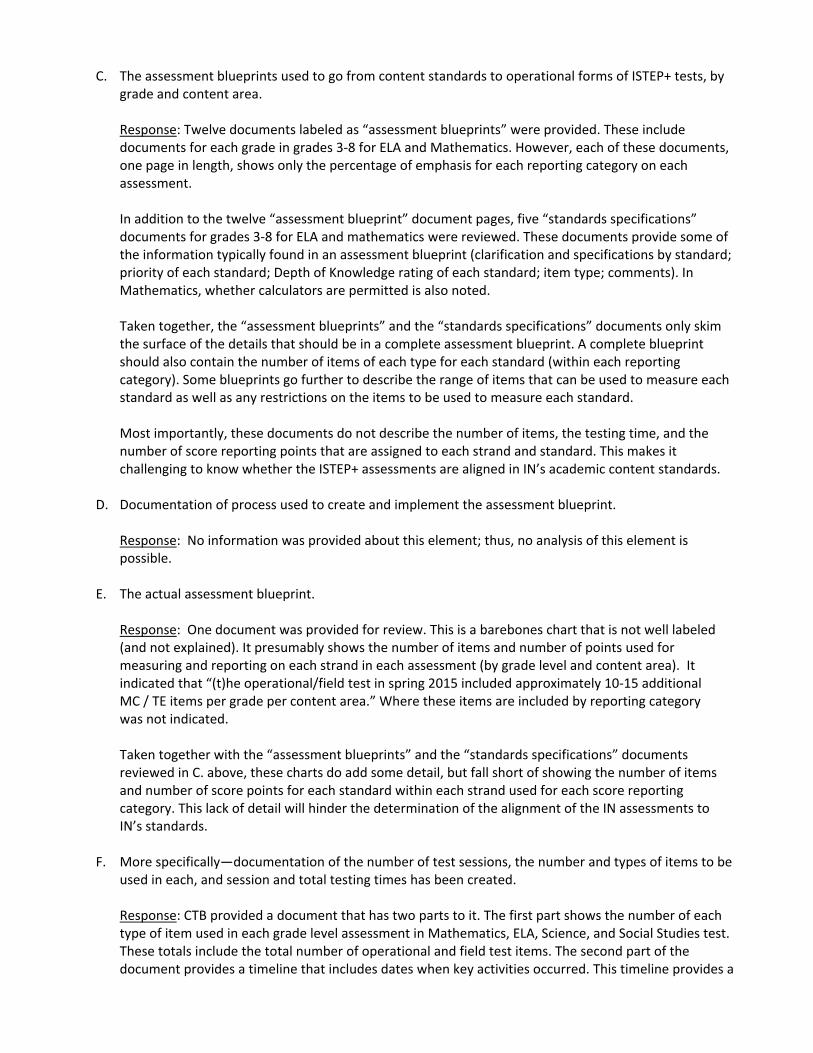
C. The assessment blueprints used to go from content standards to operational forms of ISTEP+ tests, by grade and content area.
Response: Twelve documents labeled as “assessment blueprints” were provided. These include
documents for each grade in grades 3‐8 for ELA and Mathematics. However, each of these documents, one page in length, shows only the percentage of emphasis for each reporting category on each assessment.
In addition to the twelve “assessment blueprint” document pages, five “standards specifications”
documents for grades 3‐8 for ELA and mathematics were reviewed. These documents provide some of the information typically found in an assessment blueprint (clarification and specifications by standard; priority of each standard; Depth of Knowledge rating of each standard; item type; comments). In Mathematics, whether calculators are permitted is also noted.
Taken together, the “assessment blueprints” and the “standards specifications” documents only skim
the surface of the details that should be in a complete assessment blueprint. A complete blueprint should also contain the number of items of each type for each standard (within each reporting category). Some blueprints go further to describe the range of items that can be used to measure each standard as well as any restrictions on the items to be used to measure each standard.
Most importantly, these documents do not describe the number of items, the testing time, and the
number of score reporting points that are assigned to each strand and standard. This makes it challenging to know whether the ISTEP+ assessments are aligned in IN’s academic content standards.
D. Documentation of process used to create and implement the assessment blueprint. Response: No information was provided about this element; thus, no analysis of this element is
possible. E. The actual assessment blueprint.
Response: One document was provided for review. This is a barebones chart that is not well labeled (and not explained). It presumably shows the number of items and number of points used for measuring and reporting on each strand in each assessment (by grade level and content area). It indicated that “(t)he operational/field test in spring 2015 included approximately 10‐15 additional MC / TE items per grade per content area.” Where these items are included by reporting category was not indicated. Taken together with the “assessment blueprints” and the “standards specifications” documents reviewed in C. above, these charts do add some detail, but fall short of showing the number of items and number of score points for each standard within each strand used for each score reporting category. This lack of detail will hinder the determination of the alignment of the IN assessments to IN’s standards.
F. More specifically—documentation of the number of test sessions, the number and types of items to be
used in each, and session and total testing times has been created.
Response: CTB provided a document that has two parts to it. The first part shows the number of each type of item used in each grade level assessment in Mathematics, ELA, Science, and Social Studies test. These totals include the total number of operational and field test items. The second part of the document provides a timeline that includes dates when key activities occurred. This timeline provides a

bit more detail about the design of ISTEP+ Part 1 and 2 assessments. The timeline indicated that on January 16, 2015, “IDOE/CTB explored options for testing times, including a discussion of each item type and the number of minutes recommended based on research‐related data The information provided did not include the number of test sessions, or the testing time by session and total.
G. Documentation of the process used to create the “intended test” and the persons involved in
determining the “intended assessment.” Statistical documentation of how the subset of operationally field tested items used for the actual operational form were selected. Statistical documentation of the results of the item selection procedures for reporting in 2015.
Response: A specially developed response (2 ‐ G "Intended Test" Devel Process) that described the process used to create the “intended test” was provided by CTB to respond to this element. In addition, two other documents (G ISTEP2015_OP_Selection_GuideLines_V4_Aug24; G Spring 2015 ISTEP+ Part 1_Forms 1 and 2 Examiner's Manual Supplement_FINAL 2‐20‐15) were also provided. The first document shows a brief description of the test sessions and testing time as determined post‐February based on the recommendations for reducing testing provided by the two external consultants (Roeber and Auty). It also shows that intended design decisions were still being made in July 2015. For example:
“July 2015: The IDOE eliminated “Reading: Vocabulary” as a Reporting Category for ELA. Vocabulary items would be realigned under “Reading: Literature” or “Reading: Nonfiction.”
July 2015: The IDOE eliminated the ER from the ELA design. (This reduced the anticipated ELA point total by eight points.)
July 2015: The IDOE asked CTB to drop one intended passage from ISTEP+ Part 2. Instead of five to six passages for Part 2, student scores would be based on four to five passages. (This reduced the anticipated ELA point total by six to ten points, depending on the grade/passage dropped.)”
The rationale for these and other changes was not provided in the document. The second document (G ISTEP2015_OP_Selection_GuideLines_V4_Aug24) is a much more detailed description of the steps taken to select the M‐C for both paper‐and‐pencil and online assessment items. The document includes the item flag criteria, and item selection priorities. This level of detail was not provided in the Technical Report. A point‐bi‐serial level of 0.05 is acceptable for inclusion in the ISTEP+ tests (this is a very low point‐bi‐serial level). The level indicated in the Technical Report is .25, a more reasonable level. In addition, the document indicates that the OL and PP versions of the Part 2 tests do not need to be the same. The document describes in detail how the "intended" operational test item selection occurred from the full operational test forms. This raised several red flags. In “1. Paper‐Pencil Item Selection,” steps 3, 4, 6, and 7 in ”2. Online Item Selection,” steps 3 and 4, all appear to show the list of items where matching wasn't possible. A couple of excerpts are shown below: “1. Paper‐Pencil Item Selection
3) Note that selected Part 1 items will be the same for OL forms unless item statistics for OL items are bad. Also, please note that we want to use the same common MC items between PP form and OL form if possible. Any PP MC items, which are converted from OL TE items, can be selected for PP form if the items are good.

4) Although we want include the same items for both modes, it is OK to select different Part 2 items for PP form and OL form if you cannot find any alternative item(s).”
“2. Online Item Selection
4) Although we want include the same items for both modes, it is OK to select different Part 2 items for PP form and OL form if you cannot find any alternative item(s).”
A table attached to this document titled “Appendix A Not Matched OL/PP Items” seems to show that there were a number of items that were not used in both the OL and PP tests. However, no summary information to explain the table was provided. No information was provided on why items would not work in both modes. The third document, G Spring 2015 ISTEP+ Part 1_Forms 1 and 2 Examiner's Manual Supplement_FINAL 2‐20‐15, is a memorandum from CTB to school corporation superintendents, principals, and test coordinators describing the revised testing time and form assignments following IBOE action in February 2015.
Discussion
Although many documents were provided to the evaluators, most of them did not fully respond to the elements of this study, either individually or collectively. A coherent and comprehensive set of assessment blueprints was not provided and likely does not exist. Instead, several different documents, each containing a portion of what would typically be found in a comprehensive assessment blueprint, now exist. The use of the different documents requires considerable coordination (as well as understanding of what is contained in each document). A single comprehensive document is needed, and it should include the process for developing the blueprint (who created it and what steps were taken to develop the blueprint). The manner in which the “intended” test was drawn from the operational field test forms was outlined in the seminal document G ISTEP2015_OP_Selection_GuideLines_V4_Aug24. However, even here, the information is not complete. While the document provided step‐by‐step instructions for item selection, the rationale for several of the steps was not provided—for example, what are the reasons why the PP and OL forms for Part 2 would be different? How many substitutions of a different OL item for a PP item occurred? These types of information were not provided. In the end, the steps seem to raise significant questions about the parallel nature of the PP and OL Part 2 test forms and how “clean” the mode study (Study 6) can be given actual differences between the PP and OL Part 2 tests. Conclusions A coherent and comprehensive set of assessment blueprints likely does not exist. Instead, a number of different documents, each containing a portion of what would typically be found in an assessment blueprint, now exist. The use of the different documents requires considerable coordination (as well as understanding of what is contained in each document). Taken together, the “assessment blueprints” and the “standards specifications” documents only skim the surface of the details that should be in a complete assessment blueprint. As a result, it is a bit difficult to see the steps taken to select the items used in the operational tests.

A complete blueprint should also contain the number of items of each type for each standard (within each reporting category). Some blueprints go further to describe the range of items that can be used to measure each standard as well as any restrictions on the items to be used to measure each standard. A single comprehensive document is needed, and it should include the process for developing the blueprint (who created it and what steps were taken to develop the blueprint). It would still be helpful for the state to create such a comprehensive assessment blueprint, pulling together the information now contained in the “assessment blueprints” and the “standards specifications” documents as well as detailed information about the number of items, number of score points, time, and other metrics for each type of assessment for each standard within each strand. It will serve both as a communication tool about the tests and a planning tool in the future. Some of this information should also be provided in the technical report as well as a freestanding assessment blueprint.
1
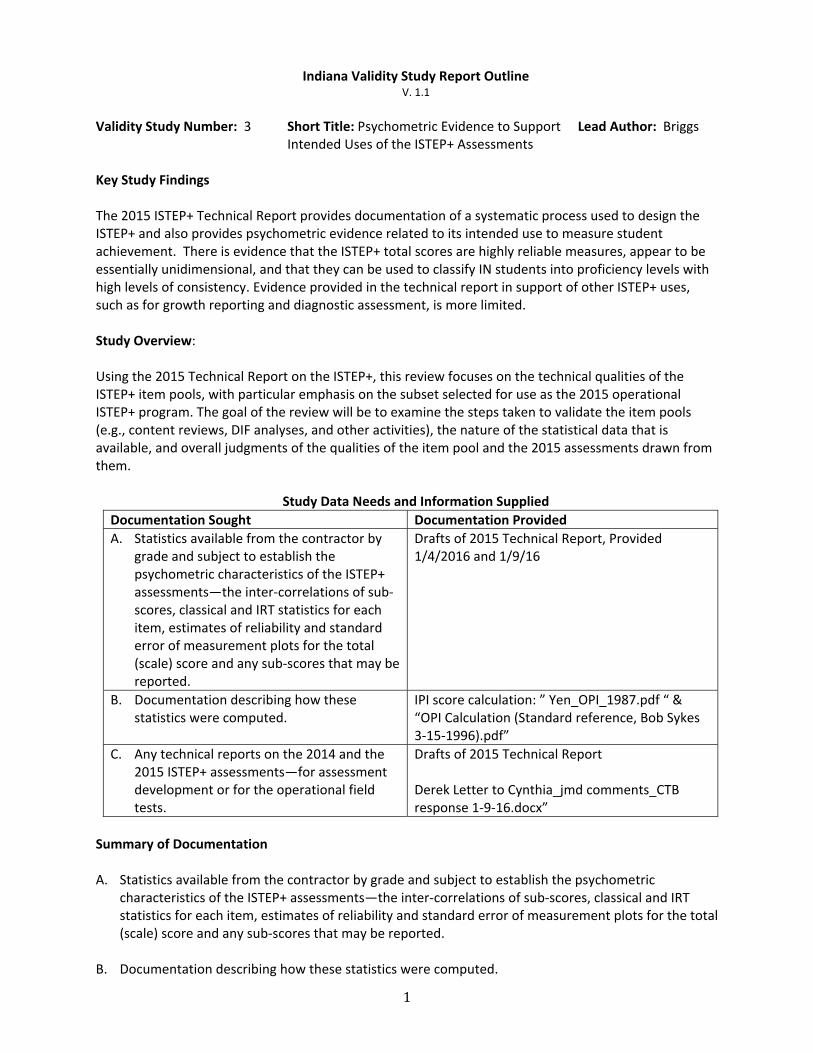
Indiana Validity Study Report Outline V. 1.1
Validity Study Number: 3 Short Title: Psychometric Evidence to Support Lead Author: Briggs Intended Uses of the ISTEP+ Assessments Key Study Findings The 2015 ISTEP+ Technical Report provides documentation of a systematic process used to design the ISTEP+ and also provides psychometric evidence related to its intended use to measure student achievement. There is evidence that the ISTEP+ total scores are highly reliable measures, appear to be essentially unidimensional, and that they can be used to classify IN students into proficiency levels with high levels of consistency. Evidence provided in the technical report in support of other ISTEP+ uses, such as for growth reporting and diagnostic assessment, is more limited. Study Overview: Using the 2015 Technical Report on the ISTEP+, this review focuses on the technical qualities of the ISTEP+ item pools, with particular emphasis on the subset selected for use as the 2015 operational ISTEP+ program. The goal of the review will be to examine the steps taken to validate the item pools (e.g., content reviews, DIF analyses, and other activities), the nature of the statistical data that is available, and overall judgments of the qualities of the item pool and the 2015 assessments drawn from them.
Study Data Needs and Information Supplied
Documentation Sought Documentation Provided
A. Statistics available from the contractor by grade and subject to establish the psychometric characteristics of the ISTEP+ assessments—the inter‐correlations of sub‐scores, classical and IRT statistics for each item, estimates of reliability and standard error of measurement plots for the total (scale) score and any sub‐scores that may be reported.
Drafts of 2015 Technical Report, Provided 1/4/2016 and 1/9/16
B. Documentation describing how these statistics were computed.
IPI score calculation: ” Yen_OPI_1987.pdf “ & “OPI Calculation (Standard reference, Bob Sykes 3‐15‐1996).pdf”
C. Any technical reports on the 2014 and the 2015 ISTEP+ assessments—for assessment development or for the operational field tests.
Drafts of 2015 Technical Report Derek Letter to Cynthia_jmd comments_CTB response 1‐9‐16.docx”
Summary of Documentation A. Statistics available from the contractor by grade and subject to establish the psychometric
characteristics of the ISTEP+ assessments—the inter‐correlations of sub‐scores, classical and IRT statistics for each item, estimates of reliability and standard error of measurement plots for the total (scale) score and any sub‐scores that may be reported.
B. Documentation describing how these statistics were computed.

2
C. Any technical reports on the 2014 and the 2015 ISTEP+ assessments—for assessment development or
for the operational field tests.
Response: This information was provided in the 2015 Technical Report, but was also provided in a draft version “ISTEP_Spring15_Technical Report_1_4_16_final_draft.docx” on January 5, 2016. (Note that this was five days later than the December 31, 2015 deadline that had been expected.) After reviewing this version, an email request for clarification and additional information was sent to CTB the same day (January 5). A response to the questions and comments in this email was provided on January 11, 2016 along with a new version of the technical report: “Derek Letter to Cynthia_jmd comments_CTB response 1‐9‐16.docx” and “ISTEP_Spring15_Technical Report_1_9_16_final draft.docx.”
Discussion of 2015 Technical Report The ISTEP+ 2015 Technical Report (referred to as the “TR” from here on) consists of an Introduction and Overview, eight sections, and three appendices. Supporting tables and figures for the narrative in the eight sections of the TR are included after the appendices. In addition to technical information related to issues of scale calibration and measurement precision, the TR also contains a great deal of important information on the design, administration and scoring of the ISTEP+ tests in science, social studies, math and ELA. The structure of the TR is summarized below.
Introduction and Overview
Section 1: Standards
Section 2: Item and Test Development
Section 3: Administration
Section 4: Scoring
Section 5: Data: Population & Sample
Section 6: Methods
Section 7: Results
Section 8: Summary of Reliability and Validity
Appendix A: Handscoring and Operation Procedures
Appendix B: Raw Score Adjustment Tables
Appendix C: Raw Score to Scale Score Adjustment Tables The motivation for the TR is provided on p. 2 where CTB writes “The purpose of the assessment was to evaluate Indiana student performance against the Indiana Academic Standards for SS, against the new Academic Standards for SC, and against the new Indiana College and Career Readiness Standards for English/Language Arts and Mathematics; specifically, the purpose was to evaluate the extent to which students, classes, schools, or corporations have mastered the current Academic Standards and how students are doing in relation to the proficiency levels set forth for the ISTEP+.” Given this, the TR was scrutinized for evidence that supports—or fails to support—this intended use of ISTEP+ scores, with particular focus on CTB’s presentation of relevant psychometric analyses. Sections 1 and 2 of the TR provide the reader with a sense for evolution of IN content standards and testing program over the past five years. Importantly, these sections document the involvement of IDOE and IN stakeholders in the item development and review process. Tables 3‐10 document the alignment between the different items (and item formats) included on operational ISTEP+ test forms and the targeted proportion of items by reporting category established by CTB and IDOE in creating grade‐by‐subject test blueprints. As shown in Tables 8‐10, for each subject and grade combination, the observed percentage of points by reporting category tends to be close to the percentage targeted by the test blueprint.

3
There are a few instances when the difference is 5% or larger. In ELA, this happens quite often for Standard 1 (“Reading Literature” in all grades except grade 5) but sometimes there are too many points for Standard 1 and sometimes too few. In math, the mismatch is most pronounced for Standard 5 (“Math Processes” in all grades the available score points are less than the target from blueprint). However, it is important to note that these are still small differences, and at the level of reporting category, there appears to be good alignment between items and test blueprint. All of this assumes that the content of items labeled by reporting category have been vetted as part of an independent alignment study (see Study 1–Alignment by Roeber), and that the blueprint to which items have been written is itself well‐aligned to Indiana’s content standards in terms of both breadth and depth of knowledge being represented. What can be concluded from Sections 1 and 2 analysis of Tables 3‐10 is that there are no red flags to suggest the items included on ISTEP+ test forms diverge greatly from what was intended by reporting categories. However, the TR only provides a relatively superficial look at this issue. Sections 3 and 4 provide evidence of what we might call “procedural validity” in administration and scoring of the ISTEP+ tests. To this end Tables 11‐12 provide evidence in regard to inter‐rater reliability for hand‐scored constructed‐response test items in ELA, math and science. Inter‐rater reliability statistics in ELA tends to be much lower than the corresponding statistics for math and science. Later in Section 8 of the TR CTB writes: “Table 11–Table 13 provide the relevant inter‐rater reliability statistics for all items in the ELA and MA operationalized field test and the SC operational test. In general, the values are within acceptable range. The lowest statistics for the final operational (OP) items in ELA fall on one item from Grade 7 Form 1, which presents an intraclass correlation of 0.74 and kappa of 0.47. Intraclass correlations for all ELA operational items range from 0.74 to 0.95 with a mean of 0.86 in ELA, from 0.87 to 0.99 with a mean of 0.95 in MA, and from 0.86 to 0.98 with a mean of 0.92 in SC. Kappa statistics range from 0.47 to 0.90 with a mean of 0.72 in ELA, from 0.75 to 0.99 with a mean of 0.90 in MA, and from 0.72 to 0.96 with a mean of 0.84 in SC. The operational items and most of the field test (FT) items values presented in Table 11–Table 13 are within an acceptable range.” (TR, p. 44). It is not clear on what basis CTB is concluding that these values are in an acceptable range. It is true that there is no hard and fast rule for an acceptable intraclass correlations or Kappas. However, it is unequivocal that these values are substantially lower for ELA items. Although this is likely a problem in any testing program (since essays are more challenging to score consistently than mathematics problems), it does suggest limitations on the ability to make generalized inferences about the quality of student writing on the ISTEP+. That is, given the same writing item and a different rater, it would not be that uncommon for a student to get a score that is +/‐ 1 point on a 6‐point rubric. And, given a different writing item and a different rater, there is even greater uncertainty. Section 5 of the TR provides some detail on the approach taken to administer different ISTEP+ test forms to a stratified‐random sample of schools. Table 14 compares the demographics of all students “available for analysis” and the demographics of all students enrolled in IN public schools. This section and its associated tables are hard to interpret because it isn’t clear how demographic percentages are being computed—is it overall unique students who took any one of the ISTEP+ tests? Those who took all four? Also, important information is missing about the demographic breakdown of students in schools who received different forms of ISTEP+ for math and ELA. This information is relevant to evaluating the approach CTB took to estimate mode effects using propensity score matching techniques (see Study 6–Mode of Assessment, by Briggs).
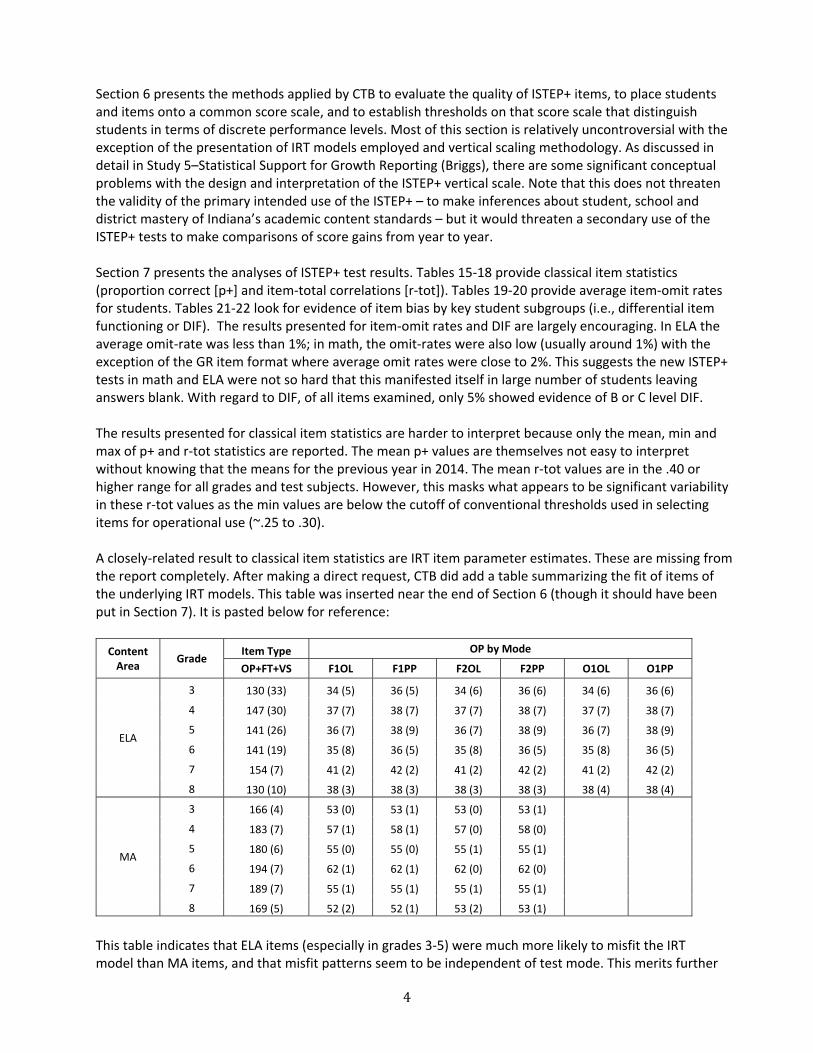
4
Section 6 presents the methods applied by CTB to evaluate the quality of ISTEP+ items, to place students and items onto a common score scale, and to establish thresholds on that score scale that distinguish students in terms of discrete performance levels. Most of this section is relatively uncontroversial with the exception of the presentation of IRT models employed and vertical scaling methodology. As discussed in detail in Study 5–Statistical Support for Growth Reporting (Briggs), there are some significant conceptual problems with the design and interpretation of the ISTEP+ vertical scale. Note that this does not threaten the validity of the primary intended use of the ISTEP+ – to make inferences about student, school and district mastery of Indiana’s academic content standards – but it would threaten a secondary use of the ISTEP+ tests to make comparisons of score gains from year to year. Section 7 presents the analyses of ISTEP+ test results. Tables 15‐18 provide classical item statistics (proportion correct [p+] and item‐total correlations [r‐tot]). Tables 19‐20 provide average item‐omit rates for students. Tables 21‐22 look for evidence of item bias by key student subgroups (i.e., differential item functioning or DIF). The results presented for item‐omit rates and DIF are largely encouraging. In ELA the average omit‐rate was less than 1%; in math, the omit‐rates were also low (usually around 1%) with the exception of the GR item format where average omit rates were close to 2%. This suggests the new ISTEP+ tests in math and ELA were not so hard that this manifested itself in large number of students leaving answers blank. With regard to DIF, of all items examined, only 5% showed evidence of B or C level DIF. The results presented for classical item statistics are harder to interpret because only the mean, min and max of p+ and r‐tot statistics are reported. The mean p+ values are themselves not easy to interpret without knowing that the means for the previous year in 2014. The mean r‐tot values are in the .40 or higher range for all grades and test subjects. However, this masks what appears to be significant variability in these r‐tot values as the min values are below the cutoff of conventional thresholds used in selecting items for operational use (~.25 to .30). A closely‐related result to classical item statistics are IRT item parameter estimates. These are missing from the report completely. After making a direct request, CTB did add a table summarizing the fit of items of the underlying IRT models. This table was inserted near the end of Section 6 (though it should have been put in Section 7). It is pasted below for reference:
Content Area
Grade Item Type OP by Mode
OP+FT+VS F1OL F1PP F2OL F2PP O1OL O1PP
ELA
3 130 (33) 34 (5) 36 (5) 34 (6) 36 (6) 34 (6) 36 (6)
4 147 (30) 37 (7) 38 (7) 37 (7) 38 (7) 37 (7) 38 (7)
5 141 (26) 36 (7) 38 (9) 36 (7) 38 (9) 36 (7) 38 (9)
6 141 (19) 35 (8) 36 (5) 35 (8) 36 (5) 35 (8) 36 (5)
7 154 (7) 41 (2) 42 (2) 41 (2) 42 (2) 41 (2) 42 (2)
8 130 (10) 38 (3) 38 (3) 38 (3) 38 (3) 38 (4) 38 (4)
MA
3 166 (4) 53 (0) 53 (1) 53 (0) 53 (1)
4 183 (7) 57 (1) 58 (1) 57 (0) 58 (0)
5 180 (6) 55 (0) 55 (0) 55 (1) 55 (1)
6 194 (7) 62 (1) 62 (1) 62 (0) 62 (0)
7 189 (7) 55 (1) 55 (1) 55 (1) 55 (1)
8 169 (5) 52 (2) 52 (1) 53 (2) 53 (1)
This table indicates that ELA items (especially in grades 3‐5) were much more likely to misfit the IRT model than MA items, and that misfit patterns seem to be independent of test mode. This merits further

5
investigation, because these rates of misfit are quite high given CTB’s use of the 3PL and 2PPC, models that do not impose many constraints on the parametric form of item response functions. The biggest weakness of Section 7 is that it does not provide a detailed accounting of which items were used for operational scoring, which items were excluded, and why. Upon request, CTB provided the following table in the document “Derek Letter to Cynthia_jmd comments_CTB response 1‐9‐16.docx.”
This table communicates two important things not shown in the TR. First, many items that were administered to IN students as part of the operational field test were not ultimately used in the final operational calibration and in generating student scale scores. For example, 130 ELA grade 3 items were administered, but only 76 (58%) were used to generate student scores. (This is largely what one would expect given that this was an “operational field test.”) Second, not all items flagged as misfitting the IRT model were excluded from the final operational item set. This is especially pronounced in ELA. It is not necessarily bad practice to include some misfitting items on an operational exam if the magnitude of misfit is small and if removal of the items would threaten the test’s content alignment to the blueprint. However, the specific process used to make this decision is not provided. Instead, CTB writes (p. 30) “For ELA and MA, problematic flagged items (e.g., items with negative item–test correlation, poor fit, extremely low p‐value, and/or large DIF) found in the operationalized field test were avoided as much as possible in the selection of the Spring 2015 final operational forms.” A detailed accounting of the decisions used to create the operational set of items is important to both maintaining and improving a testing program, especially in the first year with new content standards. Section 8 of the TR provides psychometric evidence that (1) ISTEP+ total scores are highly reliable measures (Table 42), (2) that they appear to be essentially unidimensional (Table 43), and (3) that they can be used to classify IN students into performance levels with high levels of consistency (Tables 44‐45). From the standpoint of supporting the validity of the ISTEP+ tests primary use, this is the best and most unequivocal news in the TR. With that said, a closer inspection of SEM plots by grade (Figures 17‐32)

6
shows that measurement error can be extremely large for students at the tails of the distributions. This should not cause serious problems for performance level classifications (because measurement error is smallest at the PASS and PASS+ thresholds for each grade), but could create problems for growth inferences. Critique The TR only focuses on a single intended use of the ISTEP+ (measuring student mastery of content standards) when in actuality there are at least two other secondary intended uses:
1. measuring student growth, and 2. providing diagnostic information.
For reasons described in Study 5, the TR does not provide sufficient evidence in support of using ISTEP+ scores to make inferences about student growth—if such inferences are to be supported through an examination of adjacent grade score gains. This does not mean ISTEP+ scores can’t be used for this purpose, only that the warrant behind such use is currently unavailable. With regard to diagnostic information, here the question is whether there is evidence to support the reporting of scores by reporting categories. Tables 23 and 24 would suggest caution in this regard since reliability by reporting category varies. The reliability of these subscores can range anywhere from a low of .23 (grade 6 Writing: Conventions of Standard English) to a high of .84 (grade 3 Algebraic Thinking & Data Analysis). CTB reports these scores using an index approach (the IPI) that attempts to adjust for differences in sub‐score reliability. It is somewhat of an open question whether the approach being used to create the IPI is appropriate in that it was developed under the assumption of tests comprised solely of dichotomously scored selected‐response items. This is something that should be considered more carefully in the future. Missing from the TR is any analysis of the add‐value of reporting scores by reporting category using methodology described by Haberman, Sinharay and colleagues. As a final comment, although the TR contains a great deal of useful information, it has not been written in a manner that provides a coherent or comprehensive account of the ISTEP+ design, administration and analysis. For example, the TR provides a crosswalk to the 2014 Standards for Educational and Psychological Testing, but there is no rationale provided for which standards are referenced, which are not, and what this has to do with building an argument for the validity of the ISTEP+. The discussion of test validity in the final section is inadequate. Conclusions
A review of CTB’s Technical Report for the 2015 ISTEP+ Tests found no psychometric evidence that fundamentally undermines the validity of using ISTEP+ test scores to evaluate the extent to which students, classes and schools have mastered Indiana’s academic content standards.
The TR provides evidence that the ISTEP+ tests were systematically designed to match blueprints established by the IDOE with Indiana stakeholder input.
The TR provides evidence that ISTEP+ total scores are highly reliable measures, that they appear to be essentially unidimensional, and that they can be used to classify IN students into proficiency levels with high levels of consistency (Tables 44‐45).
Evidence in support of other ISTEP+ uses for growth reporting and diagnostic assessment is more limited.

7
Recommendations
A request should be made to CTB for a more detailed accounting of the decisions used to create the operational set of items. Having this documented will be important to both maintaining and improving a testing program.
Going forward, more explicit consideration should be given to the presentation of scores by reporting category. The IPI represents one possibility, but it is not certain that it is ideal for the mix of ISTEP+ item formats and there many be other approaches for subscore reporting that are better.
In the future years, Indiana’s standing TAC should work with the test vendor to discuss the contents and structure of the technical report with an eye toward how it can document steady improvements being made to the testing program over time.

Indiana Validity Study Report Outline V. 1.3
Validity Study Number: 4 Short Title: Standard Setting Lead Author: Roeber Key Study Findings—The procedures used to determine cut scores for the 2015 ISTEP+ tests were carried out well, with a couple of minor exceptions. The resultant achievement standards were presented to the SBOE, and these achievement standards and the related performance level desciptors were formally approved by the SBOE at its October 28th special meeting, a necessary step as IN seeks peer review approval of the ISTEP+ assessments. Study Overview: Because the ISTEP+ assessments are being built out of the operational field tests administered in spring 2015, IDOE needed to carry out standard setting activities to determine different levels of performance on each of the ISTEP+ measures. It was essential that the process be carried out well so that recommended cut scores can be given to the IN State Board of Education for its approval (a step necessary before score reports can be produced). The procedures used and the data that results need to be well documented. Methodology—The evaluators reviewed both the standard setting procedures (from reports of observers who observed the standard setting procedures) and the statistical nature of the standard setting process and outcomes (from statistical data produced by the conclusion of the standard setting activities) and prepare a summary of this information for the written report.
Study Data Needs and Information Supplied
Documentation Sought Documentation Provided
A. Written descriptions of the standard setting procedures to be employed, including script(s) for standard setting
Cut Score Setting Agenda_ISTEP+_Comprehensive Version (October 2015).pdf
Cut Score Setting Agenda_ISTEP+_Observer Version (October 2015).pdf
Cut Score Setting Design_ISTEP+ (October 2015) FINAL.pdf
B. Reports from external observers who observed the standard setting processes
Egan indiana ISTEP+ standard setting memo–final Roeber IN DOE Standard Setting Observations
C. Technical reports from standard setting prepared by the contractor
Included in the Preliminary Cut Score Setting Technical Report, provided to IDOE
D. Statistical data to support the final standards that were set
Included in the Preliminary Cut Score Setting Technical Report, provided to IDOE
E. Panelists’ evaluations of the final standards set, as well as their evaluations of the overall standard setting process by observers.
Included in the Preliminary Cut Score Setting Technical Report, provided to IDOE
F. Evidence that the final standards have been approved by the ISBE or other entity.
http://www.in.gov/sboe/files/SBOE_Special_ Meeting_Minutes_10_28_15.pdf
Summary of Documentation A. Written descriptions of the standard setting procedures to be employed, including script(s) for
standard setting
Response – The contractor provided, via the Indiana Department of Education (IDOE), a written overview of the standard setting process that would be used to set standards on the ISTEP+ tests. Although suitable for describing standard setting for general, non‐technical audiences, this descriptive

material did not provide a script to be used by standard setting panel facilitators. A standard PowerPoint presentation was provided to each facilitator, and this provided some standard steps and language used by each panel. This lack of standardization was a bit surprising. Observers saw some differences in the language used to describe panelist actions or results in standard‐setting rounds in different groups.
B. Reports from external observers who observed the standard setting processes
Response – Two external reports of results are available: 1) Ed Roeber, an observer who served on the IDOE Technical Advisory Committee (TAC) and 2) Karla Egan, an observer for the SBOE. Dr. Egan’s report incorporated the report from Ed Roeber and Karen Barton, and thus this one is used as the report of the standard setting technical advisory committee here. The findings from the TAC report are excerpted as follows.
Panelist Selection – “…the Indiana Department of Education (IDOE) purposefully selected panelists to reflect three factors: geographic region, school type (urban, suburban, rural), and poverty level. The IDOE provided a summary of the panelists’ demographics…. The evidence in these tables shows that the panelists represented diverse backgrounds that reflect the factors deemed important by IDOE” (Egan, et al, 2015, p. 1). Standard Setting Procedures – “The bookmark standard setting procedure was implemented for the ISTEP+ grades 3 through 8 ELA and mathematics assessments…. Bookmark is a content‐based process that utilizes an ordered item booklet (OIB), in which the test questions are ordered from easiest to most difficult. Guided by preliminary performance level descriptors (PLDs), which were written by IDOE content‐area specialists, panelists study the ordered test questions and place a cut score that separates the content students should know to enter a performance level (i.e., Does Not Pass, Pass, Pass+) from the content that is more than enough” (Egan, 2015, et al, p. 2‐3). Panelists engage in three rounds of activities during a bookmark standard setting. At a high‐level, the following occurs in each round of activity:
“Round 1: Panelists review, discuss, and edit the PLDs; take the test; review the OIB, and recommend bookmarks. (Bookmarks are translated to cut scores by the vendor staff.)
Round 2: Within four table groups per room and led by table leaders, panelists discuss the range of individual bookmark placements and recommend bookmarks.
Round 3: As a large group and led by room facilitators, panelists review the range of bookmark placements for their grade/content area, review impact data (the percentage of Indiana students in each performance level) based on the Round 2 median bookmarks, and recommend final bookmarks” (Egan, et al, 2015, p. 3).
Implementation of Standard Setting – “The 110 panelists were separated into six groups based on their experience…” (Egan, et al, 2015, p. 3). Each panel set standards for two adjacent grades (e.g., grades 3 and 4) in either ELA or mathematics. “Within each group, panelists recommended cut scores for the lower grade followed by the upper grade in each grade pair…. Each group was sub‐divided into four groups of four to five panelists to facilitate active engagement of all panelists. Three or four panelists from each grade group were selected to serve as table leaders for the process. In this role, they facilitated the small group discussions that occurred during Rounds 1 and 2. These panelists received additional training over the lunch hour that immediately followed the initial training” (Egan, 2015, et al, p. 3). Opening Session – Dr. Walker (IDOE) and Mr. Mercado (DRC/CTB) conducted the opening session to provide an overview of the ISTEP+ assessment program as well as the task of standard setting.

Round 1 – The opening session was followed breakout sessions in which the panelists reviewed the PLDs that had been written for each grade and content area. The focus of the PLD discussion was on the just‐barely entering each performance level. They reviewed the OIB, and were trained in placing a bookmark. Then each panelist place their bookmarks in the OIBs. Bookmark Training – Next, in‐depth training was provided on the bookmarking procedure in a large group session, led by Dr. Mercado. “Mr. Mercado spent about an hour training panelists on the mechanics of bookmark placement as well as the relationship between items and students“ (Egan, 2015, p. 3). Over 90% of the panelists felt that the bookmark training helped them better understand the task. Rounds 1 and 2 – During the second, panelists discussed their bookmark placements at each table within each grade level group. After this discussion, each panelist determined his or her recommended Round 2 bookmarks. Round 3 – The grade level facilitator led panelists through a discussion of their Round 2 bookmarks. Then panelists were shown the impact data, based on their Round 2 recommendations. Mr. Mercado presented the impact data, and Dr. Walker answered process questions related to the impact data. Closing Session – At the conclusion of Round 3 bookmark activities, all panelists gathered together in an overall general session. At this session, Mr. Mercado presented the Grade 3‐8 results for each content area. Panelists were urged to carefully look at the results in their content area, and then in subsequent discussion, provide a “range of comfort” for modifications to the standards that each group had set. This was presented as a range that their table leaders could use in the subsequent cut‐score adjustment discussion scheduled for the next day. This cross‐grade examination of consistency in the standards set was intended to “promote the cross‐grade coherence of results and reflect their content‐based recommendations” (Egan, et al, 2015, p. 5). Articulation Process – On Day 4 of the standard setting workshop, CTB gathered the 22 table leaders across the six grade‐level pairs and led them though a process of looking at the tentatively‐set standards across the six grade levels within each content area (first in ELA and then in mathematics). This vertical articulation process resulted in minor changes to the standards that had been set, most often within the parameters set by each table within each grade/content area group. TAC Review of the Standard Setting Process – Immediately following the articulation session, the TAC reviewed the standards that had been set by panelists, as articulated by the table leaders. “The TAC considered the coherence of the system of cut scores and the conversations of the table leaders. The TAC recommended a few adjustments in the cut scores to address a couple of areas of remaining disarticulation. These adjustments were within one combined standard error of the panelist‐set cut scores. The combined standard error accounts for the standard error of the assessment and of the Bookmark process” (Egan, et al, 2015, p. 5‐6). Expert commentary and evaluation of the standard setting processes and outcomes is provided in D. below.
C. Technical reports from standard setting prepared by the contractor
Response – A preliminary technical report on standard setting (Preliminary Cut Score Setting Technical Report) was provided to the IDOE by CTB/DRC.
D. Statistical data to support the final standards that were set.
Response – CTB/DRC provided a preliminary technical report to the IDOE that was made available to the reviewers. The Table of Contents in this preliminary technical report indicates that the Executive Summary and the Cut Score Setting Methodology will be available in the Final Report. The agenda, training presentations, training materials, performance levels descriptors, detailed reports of panelist’s judgments, standard errors associated with the cut scores, participants’ evaluations of the cut score setting, and cut scores and impact data are presented in the preliminary report. Several observations about the preliminary technical report: o The report does not describe the steps that CTB/DRC took to prepare for the standard setting
meeting (e.g., the development of the training materials, presentations, and handouts). o The preliminary report also does not describe activities that had occurred prior to the meeting,
such as how the performance level descriptors were prepared, who wrote them and how (if at all) they were reviewed.
o Substantial information is provided on pages 77‐259. This includes individual panelist bookmark placements for Pass and Pass+, cut scores for Pass and Pass+, summary of bookmark placements for Pass and Pass+, summary of cut scores for Pass and Pass+, median bookmark summary for Pass and Pass+ by standard setting table and overall. This information is available for Round 1, Round 2, and Round 3 for each grade level and both content areas.
o Graphical presentations are shown on page 260‐298 of the frequency of different bookmark placements for the Pass and Pass+ levels is shown for Round 1, Round 2, and Round 3 for each grade level and both content area. Note: while the graphical summary of bookmark placements for Pass and Pass+ set in Round 1 was prepared, this chart was not shown to the panelists. The Round 2 and Round 3 summary charts were shown to panelists. In general, these charts show greater confluence of panelists’ ratings from Round 1 to Round 2 to Round 3. They show increased agreement for the Pass and Pass+ as panelists moved from Round1 to Round 2 to Round 3.
o The standard errors associated with cut scores are shown on pages 299‐302. o The next section of the Preliminary Technical Report provides the survey that panelists were asked
to complete at the conclusion of the standard setting process, along with the results of the surveys, summarized by ELA and Mathematics panels. The panelists indicated their understanding of the directions, the standard setting processes, and their part of the standard setting process. Unfortunately, the one question often asked at the conclusion of standard setting – whether panelists’ supported the standards that they have set – was not asked of the panelists.
o The survey to collect comparable survey and survey data collected from the Table Leaders is shown on p. 316‐323. The survey did ask the following summary question of the Table Leaders: “12. I feel the recommendations that resulted from this process are reasonable.” The survey data for ELA Table Leaders indicates that all 12 Table Leaders agree that their final recommendations are reasonable. The data from the Mathematic Table Leaders is not so positive. Only 7 of the 10 Mathematics Table Leaders agreed that their final recommendations were reasonable (none strongly). Two of the ten checked the “neutral” whether the standards that were set were reasonable, while one of the ten check “strongly disagree” to the reasonableness question.
o The recommendations from Round 3 ratings are displayed graphically on p. 324‐329. o The recommendations from the Table Leader articulation session the day after standard setting
concluded is shown on p. 330‐334. o Finally, the recommendations that resulted from the TAC discussion of the standards articulated by
the Table Leaders is shown on p. 335‐339.
E. Panelists’ evaluations of the final standards set, as well as their evaluations of the overall standard setting process by observers.

Response – Because Mr. Mercado and Dr. Walker conducted Round 3 with each of the six groups, but the six groups were not ready for the impact data on such a staggered schedule, the presentation of impact data based on Round 2 bookmarks occurred after Round 3 activities (e.g., discussion of Round 2 cuts) had begun in some of the panels. The impact of the different schedules for presentation of impact data and discussion of Round 2 bookmarks on Ro0und 3 ratings then already under way by some panels is not known; however, in at least a couple of cases, grade level panels had conducted their discussion of Round 2 bookmarks before learning of the potential impacts of those bookmarks from the impact data. The evaluation data made available to the external evaluators shows that panelists felt they understood the standard setting process (Table 6). Table Leaders indicated their understanding of the articulation process and their overwhelming support for the final recommended standards (Table 7).
Table 6. Panelist Evaluations of Bookmark Training*
ELA (n=56) Disagree Agree
Mathematics (n=54) Disagree Agree
The training on bookmark placement helped me understand what we were preparing to do.
5.4% 92.9% 1.9% 90.7%
After the training, I felt confident I was prepared to complete the cut score setting task.
7.2% 91.1% 1.9% 90.8%
I understood how to place my bookmarks. 3.6% 94.6% 1.9% 94.4%
*The percent selecting the neutral category is not included here. Table 7. Table Leader Evaluations of Articulation Process*
ELA (n=12) Disagree Agree
Mathematics (n=10) Disagree Agree
I understood the benefits of well‐articulated performance standards
0% 100% 0% 100%
The final recommendations represent the work of the standard setting committee.
0% 100% 30% 70%
I feel the recommendations that resulted from this process are reasonable.
0% 100% 30% 70%
In general, the impact data form an explainable pattern across grades.
0% 100% 10% 90%
*The percent selecting the neutral category is not included here. (Data shown in Tables 6 and 7 is taken from Egan, et al, 2015, p. 4 and p. 5 respectfully.)
No survey data from the panelists about their satisfaction with the standards that they set were collected (or if collected, were not made available to external reviewers. Attachment A shows two additional tables. Table 8 indicates the TAC’s assessment of the adherence of the CTB/DRC standard setting process to best practice in standard setting. This table indicates the adherence of the standard setting processes used to best standard practice. However, some suggestions for improvement of future standard settings: “While the standard setting process followed best practices in standard setting implementation, there is room for improvement in future standard settings. It is suggested that panelists be provided feedback following each round. In addition, multiple teams should be available to present impact

data so that panelists do not have unnecessary downtime and all panels carry out their tasks in a timely manner” (Egan, et al, 2015, p. 9). Table 9 shows the adherence of the CTB/DRC standard setting process to AERA/APA/NCME Standards. This table indicates the adherence of the CTB/DRC standard setting process to the prevailing standards in the field of measurement.
F. Evidence that the final standards have been approved by the SBOE or other entity.
Response – The SBOE approved both the performance standards for the 2015 ISTEP+ program and the related performance level descriptors at its October 28, 2015 meeting at which the standards were proposed were presented.
Discussion The standard setting process was carried quite well, although there were several aspects of it that could have been improved. The panelists were carefully selected and the training of them was thorough. The use of four small groups within each panel provided ample opportunity for each panelist to actively participate. Observers noted that panelists were highly engaged in the process (even though the meeting occurred over several days). Panelists did not radically revise their ratings after Round 2 (indicating that the influence of actual results was moderate, which is to be expected). The standards set by the panelists were not substantially different across grade‐range panels, but some articulation was necessary in both ELA and mathematics. The Table Leaders provided some recommendations for minor changes in cut scores. The TAC reviewed these recommendations and suggested a few additional minor changes to the cut scores. Both the Table Leader and TAC review occurred on the same day, so final recommended cut scores were available quickly and as needed. The surveys of the Table Leaders were the only ones that asked about the reasonableness of the standards that were articulated by the Table Leaders. As noted above, the survey of ELA Table Leaders indicated strong agreement about the reasonableness of the ELA standards as articulated. The comparable survey of the Mathematics Table Leaders showed more disagreement. Seven Table Leader indicated their agreement with the reasonableness of the standards, two were neutral, and one strongly disagreed about the reasonableness of the articulated standards. The draft achievement standards and the impact data that would result from using them were presented to the State Board of Education at its October 28, 2015 meeting. During this meeting, the issue of the impact of online assessment on student performance was raised by a SBOE member. This led to a discussion of the effect of mode of administration. This resulted in a paper that is summarized in Validity Study 6 – Comparability of Paper‐Based and Online Assessment. However, the SBOE did unanimously approve both the achievement standards and the related performance level descriptors. Conclusions From all evidence reviewed, standard setting was carried out well, and the resultant standards can be trusted. There were, however, several aspects that could be improved or standardized in future standard setting activities. These include: o Create a script for the use of the room leaders for each standard setting panel, so that each group
receives the same instructions at each step of the process. o Institute a more formal process of review of panelists’ ratings at the end of Round 1. In this standard
setting project, panelists reviewed their Round 1 ratings informally. This, however, could be misleading,

since panelists who gave more extreme ratings in either direction from the others in their panel may be reluctant to say this to their group. Typically, panelists’ ratings for each cut are shown in a graph that indicates the range of panelist Round 1 ratings for all panelists in the group (in this case, for the panelists in all four sub‐groups in each panel).
o Make sure that impact data based on Round 2 ratings are presented to panelists at the same time. This means either entrusting this message to the room leaders (with appropriate preparation and scripts) or having more IDOE/contractor staff pairs so as to be able to cover more rooms simultaneously.
o Collect panelist evaluation data, especially their support for the standards that they had set (given their knowledge of the impacts of setting their standards).
References Egan, Karla, Roeber, Edward, and Barton, Karen. Indiana ISTEP+ standard setting memo‐final.
Memorandum to Cynthia Roach and Michele Walker, dated October 13, 2015. Roeber, Edward. Roeber IN DOE Standard Setting Observations. Memorandum to Michele Walker, dated
October 10, 2015 Author. ISTEP+ Preliminary Cut Score Setting Tech Report. Monterey, CA: CTB/McGraw‐Hill (Data
Recognition Corporation). 2015.

ATTACHMENT A The summaries shown in Table 8 and Table 9 were prepared by the TAC for the evaluation of the ISTEP+ standard setting process (Egan, et al, 2015, p. 8‐10). Table 8. Adherence of the DRC|CTB Standard Setting Process to Best Practices
Best Practice ISTEP+ Standard Setting Evaluation
Panels Panels should be recruited so that they are representative of important demographic groups, and they should be knowledgeable of the content area and of students. Panels should also be sufficiently large.
Serious attention was given to create panels that were representative of Indiana based on three factors: geographic region, school type (urban, suburban, rural), and poverty level. The six panels consisted of approximately 20 panelists divided into four groups. Each group consisted of four to six panelists. This provides a mechanism for checking generalizability of the performance standards (Hambleton, Pitoniak, & Copella, 2012). Observations confirmed that all of the panelists were knowledgeable of the content and were diligent in setting the standards.
Method The standard setting method should be appropriate for the type of test administered and the understandability of the judgment task.
The Bookmark method was appropriate for use with the ISTEP+, which was a mixture of item types. DRC|CTB was diligent in their training for the judgment task, spending an hour on this training. They also checked for understanding by administering check sets. The DRC|CTB facilitators and psychometricians regularly checked with panelists to ensure understanding.
Implementation There are various aspects of implementation that must be considered when evaluating a standard setting. These include: (a) training; (b) using PLDs, (c) taking the test; (d) using an iterative process; (e) providing opportunity for discussion; and (f) presenting impact data. In addition, the method should be efficient, allow transparency in the computation of cut scores, and provide time for evaluations.
The purpose of the assessment and the uses of the test scores were explained to panelists during the opening session. Panelists were exposed to the assessment and how it was scored. The panelists engaged in an iterative process and used the descriptions of the performance levels effectively. They were shown impact data following the second round and again following the final round. The method was implemented efficiently, and panelists completed evaluations. Following the standard setting, an articulation committee comprised of the 24 table leaders and the TAC met separately to examine the coherence of the system of cut scores. This is an important component of modern standard setting where cut scores are set in contiguous grades. This provides panelists with an opportunity to examine the consistency of recommendations across grades.

Best Practice ISTEP+ Standard Setting Evaluation
While the standard setting process followed best practices in standard setting implementation, there is room for improvement in future standard settings. It is suggested that panelists be provided feedback following each round. In addition, multiple teams should be available to present impact data so that panelists do not have unnecessary downtime and all panels carry out their tasks in a timely manner.
Table 9. Adherence of the DRC|CTB Standard Setting Process to AERA/APA/NCME Standards
Standard Text of Standard ISTEP+ Standard Setting Evaluation
5.21 When proposed score interpretation involves one or more cut scores, the rationale and procedures used for establishing cut scores should be documented clearly.
Standard 5.21 was fulfilled through DRC|CTB standard setting design in which the rationale and procedures were first documented. During the opening session, the rationale and procedures were explained to panelists.
5.22 When cut scores defining pass‐fail or proficiency levels are based on direct judgments about the adequacy of an item or test performances, the judgmental process should be designed so that the participants providing the judgments can bring their knowledge and experience to bear in a reasonable way.
As explained in the previous section, the Bookmark procedure provided a reasonable means for panelists to share their knowledge and experience through group discussions and to make judgments in an intuitive manner. Almost all of the panelists agreed that they understood how to place their bookmarks.
5.23 When feasible and appropriate, cut scores defining categories and distinct substantive interpretations should be informed by sound empirical data concerning the relation of test performance to the relevant criteria.
Empirical data was presented to panelists based on Round 2 recommendations. This data was based on the Spring 2015 implementation of the ISTEP+. Panelists were again shown impact data based on their final cut scores.

Attachment B Screen Shot of IN SBE Website, November 16, 2015

1
Indiana Validity Study Report Outline V. 2
Validity Study Number: 5 Short Title: Statistical Support for ISTEP+ Growth Reporting Lead Author: Briggs Key Study Findings This study examined evidence relevant to two different ways that ISTEP+ test scores in math and ELA could be used to support inferences about student growth. The first way to support growth inferences, currently used as part of Indiana’s accountability system is to compute student growth percentiles (SGPs). There is limited evidence available at present for any comprehensive evaluation of the ISTEP+ scores for this use. The distributions of ISTEP and ISTEP+ raw scores by grade and test subject were compared from 2014 to 2015 to look for evidence of possible floor or ceiling effects that might bias the computation of SGPs. The available evidence indicates that floor and ceiling effects do not appear to pose a problem for the ISTEP+. This lends some support to the continued use of SGPs as part of Indiana’s accountability system. A second way to support growth inferences would be to examine changes (i.e., gains) in student scores directly by comparing the score a student receives in a lower grade to the score the same student receives in the next grade. This sort of inference is, in principle, facilitated by the creation of a vertical score scale. Because there is good documentation available with regard to the approach taken by CTB to create vertical scales for the ISTEP+, there is evidence that can be examined in evaluating the quality of the vertical scales. The steps taken by CTB to create the ISTEP+ vertical scales via separate calibration are consistent with conventional psychometric practices. However, an important preceding step appears to have been skipped in establishing what was the intended operationalization of growth within the math and ELA domains. Because of this and some other technical concerns, it is difficult to make the case that ISTEP+ scale scores can be used to make direct inferences about student growth in terms of gain scores.
Study Data Needs and Information Supplied
Documentation Sought Documentation Provided
A. Documentation regarding the growth definition used as basis for selection of common items across adjacent grades.
In the Vertical Scaling memo by November 20
B. Documentation of the analyses that common items were representative of some target domain
In the Vertical Scaling memo by November 20
C. Documentation of the analyses showing that the property of parameter invariance holds for IRT parameters associated with common items
In the Vertical Scaling memo by November 20
D. Document with estimated linking constants for adjacent grades (if Stocking‐Lord type of separate calibration approach was used).
In the Vertical Scaling memo by November 20
E. Documentation of the evidence of grade to grade separation with respect to (1) test characteristic curves and (2) grade to grade effect sizes
In the Vertical Scaling memo by November 20

2
F. Provide for each grade and test subject, for 2015 and 2014 total (raw) scores as .csv file. (Rows = students; column = unique grade/subject)
Excel files provided November 20
G. Results from any analyses conducted to establish essential unidimensionality with no construct shift across grades of vertical scale.
Scree plots in “CTB Response for IDOE 10.20.15_FINAL.pdf”
H. Other technical analyses that support the use of ISTEP+ scores for reporting student growth.
In the Vertical Scaling memo by November 20
Summary of Documentation/Evidence Provided A. Documentation regarding the growth definition used as basis for selection of common items across
adjacent grades.
Response: As noted in the 11/30/15 Vertical Scaling Memo (p. 2) “No clear growth definition has been applied to select the vertical scaling common items. In general, most vertical scaling common items were selected if their item difficulty (i.e. item p‐value) in the upper grade was higher or equal to the p‐value in the adjacent lower grade. Selecting the vertical scaling common items was restricted in order to meet the test blueprint.”
B. Documentation of the analyses that common items were representative of some target domain.
Response: Common items were selected in two stages. Stage 1. An initial pool was selected from the full pool of items administered as part of the 2015 operational field test. There is no documentation for how this initial pool was selected, but it appears that they were chosen to be loosely representative of major “reporting categories” in ELA and Math. Grade 3‐8 ELA Reporting Categories 1. Reading: Vocabulary 2. Reading: Literature 3. Reading: Nonfiction and Media Literacy 4. Writing: Genres, Writing Process, Research Process 5. Writing: Conventions of Standard English Note that although it is a reporting category, there were no common items from “Writing: Genres, Writing Process, Research Process.” In Math there are always five reporting categories by grade, but the nature of some of these reporting categories can change, particularly in the transition from 5th grade to 6th grade. Grade 3‐5 Reporting Categories
1. Number Sense 2. Computation 3. Algebraic Thinking and Data Analysis

3
4. Geometry and Measurement 5. Mathematical Process
Grade 6‐8 Reporting Categories
1. Number Sense & Computation 2. Algebra & Functions 3. Geometry and Measurement 4. Data Analysis and Statistics 5. Mathematical Process
The number of common items by grade, subject and reporting category is shown in tables found in Appendix A and B of the CTB Vertical Scaling report. Stage 2. A final set of common items was selected according to the following criteria (p. 5) [Note: the term “VAI” stands for vertical anchor item and can be used interchangeably with the term “common item.”]
Score point percent for each reporting category for two adjacent grades, such as grades 3 and 4, were considered. That is, each score point percent for total items in one form was compared with that for VAIs. Online Form 1 was selected for this purpose.
Students’ performance (i.e. average item p‐value) for each reporting category for two adjacent grades needs to be similar between total items and VAIs.
If an item p‐value for a higher grade is much lower than that for a lower grade, CTB tried not to include this item.
Around 15 items was the minimum number of vertical anchor items as any adjacent grade combination.
Evidence with respect to the representativeness of the final set of common items is presented in Appendix B of the CTB report.
C. Documentation of the analyses showing that the property of parameter invariance holds for IRT parameters associated with common items. Response: Scatterplots of the slope (i.e., discrimination) and intercept (i.e., difficulty or location) parameters for common items administered to students in adjacent grades are provided in Appendices D and E for ELA and Math respectively of the report. Comparisons of TCCs based on common items in adjacent grades for each subject can be found in Appendix F of the report. No information was provided with regard to the stability of the estimates for the pseudo‐chance guessing parameter for selected response items.
D. Document with estimated linking constants for adjacent grades (if Stocking‐Lord type of separate calibration approach was used).

4
Response: Linking constants by subject and grade were provided in Appendix C of report.
E. Documentation of the evidence of grade to grade separation with respect to (1) test characteristic
curves and (2) grade to grade effect sizes Response: This evidence was provided graphically in Figures 1‐8 and numerically in Tables 4‐7.
Table 4. Effect Size Measure for ELA Separate Calibration
Content Grade N of Students Mean SD Mean Difference
ES
H L H L H L H L
ELA 4 3 72236 74896 481.25 455.30 53.13 49.54 25.95 0.51
ELA 5 4 73702 72236 500.02 481.25 51.92 53.13 18.77 0.36
ELA 6 5 73122 73702 518.40 500.02 57.67 51.92 18.37 0.33
ELA 7 6 74916 73122 532.50 518.40 59.67 57.67 14.10 0.24
ELA 8 7 76880 74916 549.82 532.50 67.59 59.67 17.32 0.27
H: Higher Grade; L: Lower Grade
ELA Slope Intercept
Grade 3 43.82 458.29
Grade 4 46.30 485.59
Grade 5 45.96 502.30
Grade 6 51.68 521.55
Grade 7 54.37 532.79
Grade 8 60.46 552.51
MATH Slope Intercept
Grade 3 47.34 443.58
Grade 4 45.69 475.86
Grade 5 46.51 500.47
Grade 6 45.33 521.94
Grade 7 43.83 537.62
Grade 8 44.06 556.92

5
Table 6. Effect Size Measure for MA Separate Calibration
Content Grade N of Students Mean SD Mean Difference
ES
H L H L H L H L
MA 4 3 73992 76623 471.91 438.95 52.09 54.78 32.96 0.62
MA 5 4 75485 73992 500.01 471.91 52.08 52.09 28.10 0.54
MA 6 5 74227 75485 519.99 500.01 51.44 52.08 19.98 0.39
MA 7 6 76111 74227 533.91 519.99 52.09 51.44 13.92 0.27
MA 8 7 78936 76111 553.74 533.91 51.45 52.09 19.83 0.38
H: Higher Grade; L: Lower Grade
F. Provide for each grade and test subject, for 2015 and 2014 total (raw) scores as .csv file. (Rows = students; column = unique grade/subject.)
Response: Frequency distributions for 2014 and 2015 raw scores provided in csv files by subject and grade.
G. Results from any analyses conducted to establish essential uni‐dimensionality with no construct shift
across grades of vertical scale. Response: Results from Parallel Analyses were supplied as part of a different request as part of the document “CTB Response for IDOE 10.20.15_FINAL.pdf.” These plots are indicative of a single dominant factor that explains a preponderance of the co‐variation among test items in the sense that the first eigenvalue is consistently 4 or more times larger than the second. However, in both subjects there is evidence of at least one secondary factor that could be considered statistically significant, and this may lead of violations of the local independence assumption for certain item pairings. No evidence was provided to evaluate the possibility of construct shift—that is, the possibility that the composition/meaning of the first factor identified in each parallel analysis may be changing substantively across grades.
H. Other technical analyses that support the use of ISTEP+ scores for reporting student growth.
Response: Figures 9‐12 provide cumulative distributions functions by grade and subject.

6
Critique/Analysis/Discussion Use of ISTEP+ for Computation of SGPs One concern about the use of ISTEP+ scores in the computation of SGPs is the possibility that the tests may be too hard since IN teachers are only beginning to incorporate the new standards into their curricula. If so, this could lead to “floor effects”—student scores that bunch up at the low end of the raw score distribution. To examine this, histograms of ISTEP/ISTEP+ raw scores were plotted by subject, grade and year (see appendix). What is evident is a clear leftward shift in most distributions from 2014 to 2015. It is a little bit tricky to evaluate the degree to which floor effect are a greater problem in 2015 than in 2014 without knowing the minimum number of raw score points one would expect to see if a student became demoralized and simply guessed on MC items and gave no responses or no effort to constructed response items. One way to think about this is that if at least half the points on every test were attributable to MC items (35 out of 70 points), and if students guessed on these questions, then the lowest score we would expect by chance is about 10. Hence the area below 10 on the histogram might be taken as representing students for whom it will be difficult to make inferences about growth because the “floor” of the 2015 test was too high for them. In sum, there appears to be minimal evidence of floor effects on the ISTEP+. In fact, when comparing 2014 to 2015 scores in the same grade and subject, we actually see a decrease in what appeared to be ceiling effects in 2014. One reason why floor effects may not be a problem at present, especially in math, is that the ISTEP+ contains mostly DOK 1 and 2 items. To the extent that DOK is positively correlated with item difficulty, if future versions of the ISTEP+ feature higher DOK items, floor effects might become more of an issue. A more detailed investigation into planned uses of ISTEP+ test scores to compute and aggregate SGPs is outside the scope of the present study. Use of ISTEP+ for Grade to Grade Score Comparisons Using Vertical Scale There are two purposes for having a vertical score scale. The first is to support inferences about the magnitude of student growth in subject‐specific achievement across two or more grades. The second is to make it possible, in a computer adaptive testing (CAT) context, to administer below or above grade items to students that would otherwise be outside of a grade‐specific item bank. At present, the ISTEP+ is not a CAT so the second of these purposes is less relevant in the short‐term (although having a bank of vertically scaled items makes the transition to CAT easier). Therefore, in evaluating the validity of the ISTEP+ vertical scales in ELA and math, my focus will be on whether the resulting scales can be validly used in support of making inferences about student growth magnitudes. Note that this is a different question than asking whether ISTEP+ scores can be used to make normative inferences about growth using SGPs. There are three interrelated big picture questions that need to be considered when a vertical scale is being created.
1. DESIGN: Does the vertical scale have a coherent and theoretically grounded design? 2. CALIBRATION: Has the vertical scale been calibrated appropriately? 3. INTERPRETATION: Are the properties of the resulting vertical scale plausible? Are they consistent
with the design?

7
Design The starting point for any vertical scale in a large‐scale assessment context is to establish an operational definition of growth. Kolen & Brennan (2014) distinguish between domain vs. grade‐to‐grade growth definitions. Briggs & Peck (2015) introduce a learning progression growth definition. In the context of the ISTEP+, no formal definition of growth has been made explicit. However, because the calibration design is based on common linking items in adjacent grades, this is most consistent with a grade‐to‐grade growth definition. When adopting such a definition, the academic content over which growth is defined is allowed to change for each adjacent grade pair. Given the use of a common item design, a critical decision is with the selection of the set of linking items that will be administered to students across two or more adjacent grade levels. Linking items stand in contrast to unique items, which are only administered to students in any single grade. When items span adjacent grades, one must decide whether the linking items overlap across grades in a “backward” direction, a “forward” direction, or both. When linking items overlap in backward direction, students in an upper grade are taking items with content most directly targeted to instruction from the lower grade. This is illustrated in Figure 1. In the figure (and the one that follows), hypothetical linking items for grades 4 and 5 are used as an example. The “O” stands for the outcome that would be observed when a student answers a set of linking items, and this outcome could be expressed for each student as the proportion of items answered correctly. The subscript 4 indicates that the outcome is based on items written to correspond to grade 4 content. This is called a “backward” linking design because grade 5 students take items that were written for grade 4 students. The backward linking approach makes it possible answer one specific question relevant to inferences about growth that is typically not asked in a testing context: “How would the average grade 5 student perform if they were tested on grade 4 content?” When this performance by grade 5 students is compared to the performance of current grade 4 students on the same items it becomes possible to make an inference about growth on what amounts to a delayed post‐test: grade 4 students take a post‐test on grade 4 content after a year of instruction (during grade 4), and this is contrasted to the same post‐test given again to grade 5 students after two years of instruction (during grades 4 and 5). Notice that in this design there is no pre‐test being given on grade 4 content before a student has been exposed to grade 4 instruction. Figure 1 includes the experimental design implied by this linking structure, where an “X” indicates exposure to grade‐specific instruction and neither group has been randomly assigned. FIGURE 1. A “Backward” Item Linking Design and the Implied Experiment
Grade Level to which Items have been Written
Grade 4
Grade Level in which Items are Administered
Grade 4 O4
Grade 5 O4
Implicit Experimental Design: Grade 4 Students: X4 O4 Grade 5 Students: X4 X5 O4
When linking items overlap in a forward direction, students in a lower grade are taking items with content targeted to the curriculum and instruction students are anticipated to receive in the upper grade. As illustrated in Figure 2, this is called a “forward” linking design because grade 4 students take items that were written for grade 5 students. The forward linking approach makes it possible answer a different question that is typically not possible to ask in a testing context: “How would the average grade 4 student

8
perform if they were tested on grade 5 content?” In this sense, the scores of grade 4 students amounts to a pre‐test that occurs prior to grade 5 instruction. When compared to the performance of current grade 5 students on the same items after a year of instruction, it becomes possible to make an inference about growth in grade 5 using what amounts to pre‐post design. FIGURE 2. A “Forward” Item Linking Design and the Implied Experiment
Grade Level to which Items have been Written
Grade 5
Grade Level in which Items are Administered
Grade 4 O5
Grade 5 O5
Implicit Experimental Design: Grade 4 Students: X4 O5 Grade 5 Students: X4 X5 O5
Unfortunately, in the case of the calibration of the ISTEP+ vertical scales, the direction of linking item overlap is inconsistent from grade to grade. In grade 3 linking items are solely in a forward direction, in grades 4‐7 they are in both forward and backward direction, and in grade 8 they are solely in a backward direction. This means that irrespective of the technical approach taken to calibrate the vertical scale, the resulting interpretations will be equiviocal. Not surprisingly, observed growth from grade 3 to 4 will be largest in magnitude because it is based on a purely forward linking design—grade 3 students are given grade 4 items. And observed growth from grade 7 to 8 is lowest because it is based on a purely backward linking design: grade 8 students are given grade 7 items. Growth from grade 4 to 7 is a mixture of the two designs. In the latter case it is almost impossible to say what question about growth the scale is answering as it represents the average of answers to two fundamentally different quasi‐experimental designs. To provide a concrete example relevant to ISTEP+ content, consider one of the four ELA reporting categories “Reading: Literature”. Figure 3 below shows how the description of what a student is expected to be able to demonstrate in his/her ability to read literature changes from grade 3 to 8. Following grade 3, I indicate the new abilities expected of students in bold. Some expectations in earlier grades are no longer present in later grades.

9
Figure 3. ISTEP+ ELA Blueprint Reading: Literature Reporting Category
8 New:
Comparing and contrasting structures of literary texts and analyzing how literature draws on and transforms earlier texts.
7 New:
using knowledge of literary structure and point of view to provide analysis of literature, and making connections between historical fiction and nonfiction historical accounts
6 New:
using knowledge of literary structure and point of view to provide explanation and analysis of literature
Gone:
analyzing how sensory tools (e.g., pictures) impact meaning
5 New:
summarizing the text
analyzing how sensory tools (e.g., pictures) impact meaning
4 New:
identifying, describing, and making inferences about literary elements and themewhile using explicit and inferential textual support
3 Questions are based on a range of grade‐level literature and may include 1. identifying, describing, and making inferences about literary elements and themes
while using explicit textual support; 2. using knowledge of literary structure and point of view; connecting literary elements
and themes; and 3. explaining how sensory tools (e.g., pictures) impact meaning
Consider student growth in reading: literature from grade 5 to 6. If one wants to know whether grade 6 students are showing growth “using knowledge of literary structure and point of view to provide explanation and analysis of literature” then it would be necessary to give grade 5 students items in which they are expected to be able to apply this skill before it has become a focus of their curriculum. This would require a forward linking design. If, in contrast, one wants to know whether grade 6 students have demonstrated growth with respect to skills that had been emphasized in the previous grade (such as “analyzing how sensory tools impact meaning”) then it would be important to give grade 6 students the relevant grade 5 items. This would be a backward linking design. If we do both at the same time, as is the case for the ISTEP+ then the resulting inference about growth becomes equivocal. Finally, on top of the concerns raised above, no information has been provided that details how the initial pool of candidate common linking items was chosen from the full item pool. Calibration
On p. 5 of the CTB report, it is established that one of the criteria used to choose the final set of common linking items for use in calibrating math and ELA vertical scales was “If an item p‐value for
10
a higher grade is much lower than that for a lower grade, we tried not to include this item.” Although this approach is understandable given the nature of the design, it introduces an upward bias to growth inferences. If, in fact, the average student who takes a grade 4 item in grade 5 is less likely to answer the item correctly then he/she would have been in grade 4, this represents important information because it suggests that what was taught in 4th grade did not “stick” in 5th grade. See Briggs & Dadey (2015) for a comprehensive investigation into the removal of linking items with p+ reversals across grades.
The ISTEP+ vertical scales are calibrated using a combination of the 3PL and 2PPC IRT models. This is problematic to the extent that there is a desire for a scale with interval properties such that changes in magnitudes mean the same thing irrespective of starting point. Interval scale properties are very hard to justify in any circumstance, but is virtually impossible to do so when applying the 3PL. Hence the choice of 3PL/2PPC is inconsistent with the desire to use the vertical scale to support inferences about growth magnitudes. For more on this issue see Briggs (2013).
Interpretation Growth interpretations for the ISTEP+ math and ELA vertical scales are hampered by the design and calibration issues summarized above. Figures 1‐8 and Tables 4‐7 in the CTB report show that there is significant separation in mean scale scores from grade to grade. However it is important to appreciate that this separation appears quite small and as a consequence it would be easy for people to come to the erroneous conclusion that many grade 4 students had performed better than grade 7 students and that many grade 7 students had performed worse than grade 4 students. This conclusion is erroneous because the vertical scale was not designed to support these kinds of linkages and inferences. To put this in sharper relief, consider the “TCC Plot” for ELA (Figure 1, p. 9 of the CTB report). I have superimposed a vertical black line at a scale score of 500, and horizontal black lines where a scale score of 500 intersects each grade’s TCC. By following the horizontal line back to the y‐axis, we can see that a student with a scale score of 500 would be expected to earn a little over 70% of the available score points on the grade 3 test, about 65% of the available points on the grade 4 test, and so on. These are rather small grade to grade differences, typically never more than an increase in 5% points. Notice also that many of the curves begin to cross below a value of about 450 and above a value of about 650. This is an undesirable property, very difficult to explain conceptually, that is a consequence of the use of the 3PL IRT model for scale calibration.

11
Figure 4. ELA TCC Plots (Figure 1, p. 9 of CTB Report)
Finally, it is worth noting that there is evidence of considerable scale expansion on the ELA vertical scale. The SD of scale score from grades 3 to 8 is as follows: 49.54, 53.14, 51.92, 57.67, 59.67 and 67.59. No similar scale expansion is evident in math. There is not necessarily anything “wrong” with this but it is unusual. In a review of vertical scales from 16 states, Dadey & Briggs (2012) only found one example of a state in showing a consistent increase in variability across grades. Interestingly, that state also had used the 3PL to calibrate its vertical scale, so there might be a possible relationship. Recommendations
1. A separate study should be conducted related to the impact of the transition from ISTEP to ISTEP+ on SGP computation for accountability decisions. During the development of the ISTEP+, an equipercentile concordance approach was proposed as a way of generating SGPs with only a single year of ISTEP+ data. Now that empirical data is available, this approach should be revisited.
2. A benefit of SGPs is that they do not require a vertical score scale. A weakness of SGPs is that they can be harder for educators to interpret and explain. If growth reporting on the basis of changes in magnitude along the ISTEP+ vertical scales is of long‐term interest, then it would be wise to revisit vertical scale design and calibration for the 2017 adminstration. Importantly, much more conscious and deliberative choices need to be made about the nature of the common item linking design and the interpretations about student growth this is intended to support.
References Briggs, D. C. & Peck, F. A. (2015). Using learning progressions to design vertical scales that support coherent inferences about student growth. Measurement: Interdisciplinary Research & Perspectives, 13, 75‐99. Briggs, D. C. & Dadey, N. (2015). Making sense of common test items that do not get easier over time:
12
Implications for vertical scale designs. Educational Assessment, 20(1), 1‐22. Briggs, D. C., & Domingue, B. (2013). The gains from vertical scaling. Journal of Educational and Behavioral Statistics, 38(6), 551‐576. Briggs, D. C. (2013). Measuring growth with vertical scales. Journal of Educational Measurement, 50(2), 204‐226. Dadey, N. & Briggs, D. C. (2012). A meta‐analysis of growth trends from vertically scaled assessments. Practical Assessment, Research & Evaluation, 17(14). Available online: http://pareonline.net/getvn.asp?v=17&n=14 Kolen, M. J., & Brennan, R. L. (2004). Test equating, scaling, and linking: Methods and
practices. New York, NY: Springer.

13
Histograms of ISTEP+ Raw Score Distributions for 2014 and 2015
Math and ELA

14

15

16

17

18

19

20

21

22
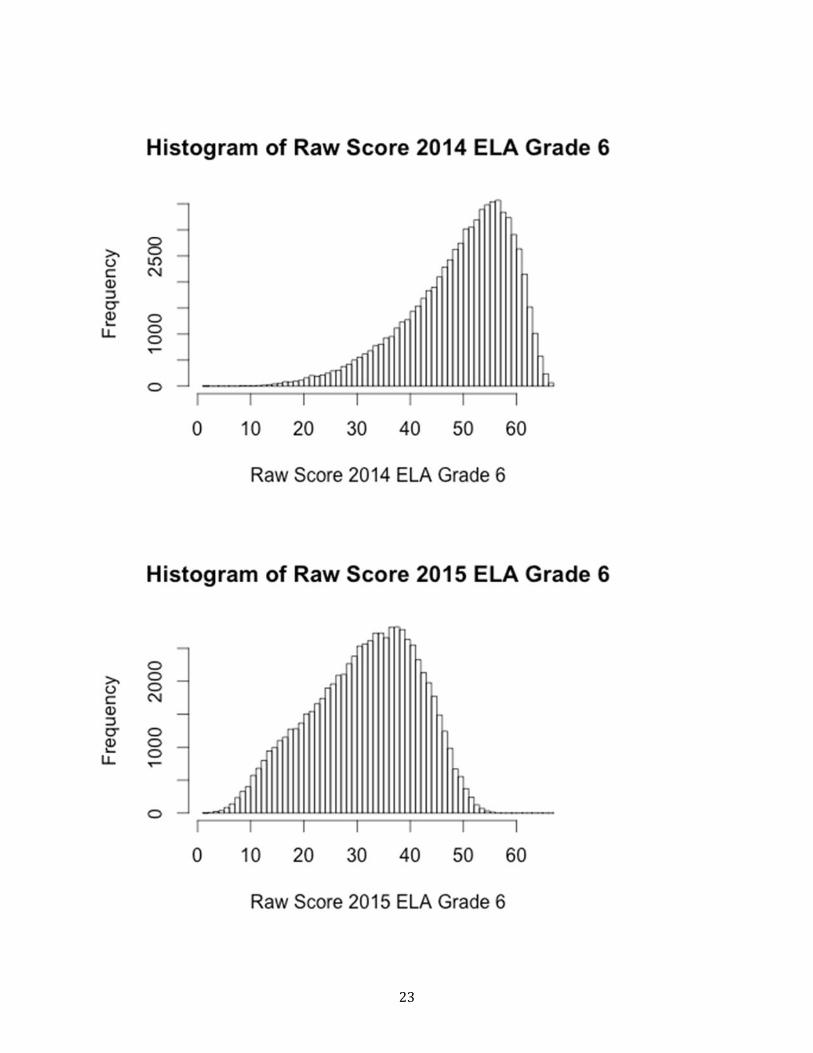
23

24

25

Indiana Validity Study Report Outline V. 1.2
Validity Study Number: 6 Short Title: Comparability of Paper‐Based and Online Assessment Lead Author: Briggs Key Study Findings The ISTEP+ was administered in two different modes with both online (OL) and paper‐and‐pencil (PP) versions. Statistical investigations of performance differences between students given the ISTEP+ tests OL versus PP showed small differences, usually favoring PP‐based testing. Based on the recommendation of the external experts, the SBOE approved slightly revised student scores to account for these mode differences. These revised scores have been implemented. Study Overview A key issue for states that use online assessments for most but not all students is how comparable are the results of the assessments given on paper to those administered online? This is important to study both for considering the policy issue of whether universal online assessment should be used, as well as whether any adjustments to students’ scores should be made since the ISTEP+ test results are used in school and in educator accountability. Study Data Needs and Information Supplied
Documentation Sought Documentation Provided
A. Information on the design of the comparability studies planned or conducted.
CTB Response for IDOE 10.20.15_FINAL.pdf 2015 ISTEP+ vertical scaling Memo Sep 11.pdf
B. Documentation of results from comparability studies conducted.
Mode_Study_Draft_10 02 2015v2.pdf CTB Response for IDOE 10.20.15_FINAL.pdf Mode_Study_2015_ISTEP_Oct_23.pdf
Analysis The initial review began with the document “Mode_Study_Draft_10 02 2015v2.pdf” that was sent by Cynthia Roach on 10/13/15. This draft document was missing a considerable amount of important information about the design that supported CTB’s evaluation of mode effects. It also contained some information that raised some flags about the process that CTB used to estimate the magnitude of mode effects. I provided feedback about this over email on the evening of 10/13/15. This led to a conference call with SBOE staff along with Ed Roeber and Wes Bruce on 10/15/15. Concerns were relayed to CTB and IDOE that same day (see below), and the expert panel received the document “CTB Response for IDOE 10.20.15_FINAL.pdf” on Tuesday, 10/20/15. Lastly, we received the document Mode_Study_2015_ISTEP_Oct_23.pdf on Friday, October 23rd.
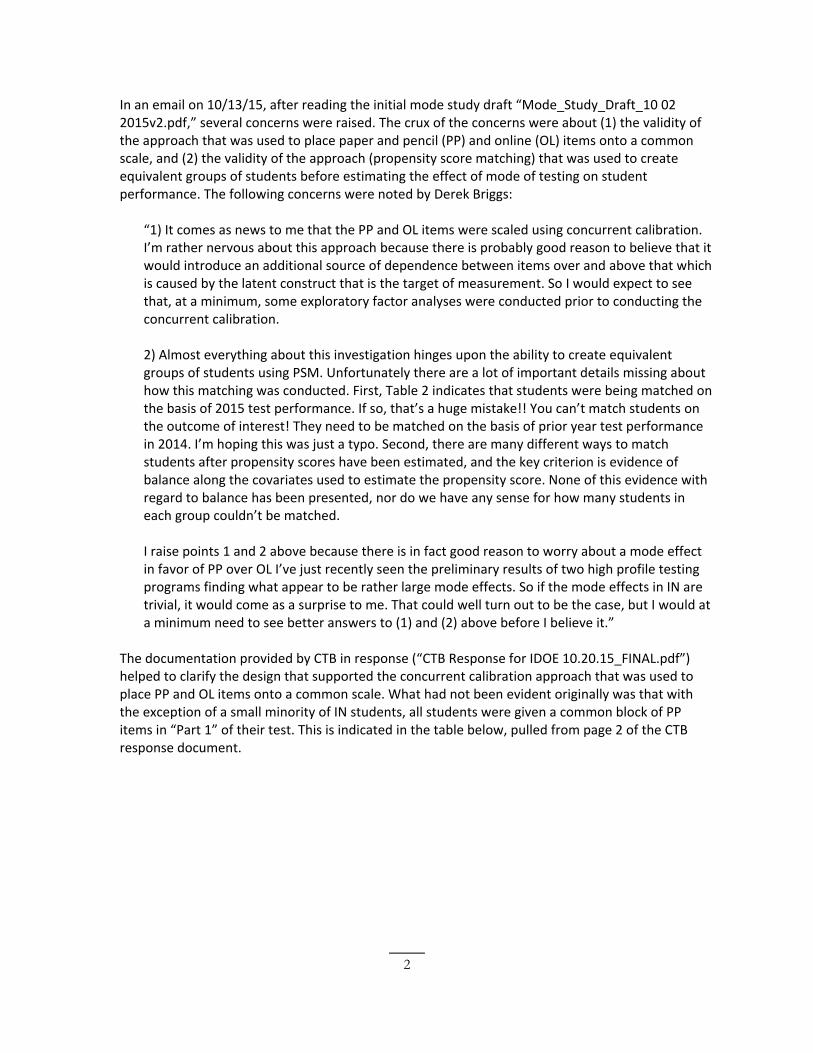
2
In an email on 10/13/15, after reading the initial mode study draft “Mode_Study_Draft_10 02 2015v2.pdf,” several concerns were raised. The crux of the concerns were about (1) the validity of the approach that was used to place paper and pencil (PP) and online (OL) items onto a common scale, and (2) the validity of the approach (propensity score matching) that was used to create equivalent groups of students before estimating the effect of mode of testing on student performance. The following concerns were noted by Derek Briggs:
“1) It comes as news to me that the PP and OL items were scaled using concurrent calibration. I’m rather nervous about this approach because there is probably good reason to believe that it would introduce an additional source of dependence between items over and above that which is caused by the latent construct that is the target of measurement. So I would expect to see that, at a minimum, some exploratory factor analyses were conducted prior to conducting the concurrent calibration. 2) Almost everything about this investigation hinges upon the ability to create equivalent groups of students using PSM. Unfortunately there are a lot of important details missing about how this matching was conducted. First, Table 2 indicates that students were being matched on the basis of 2015 test performance. If so, that’s a huge mistake!! You can’t match students on the outcome of interest! They need to be matched on the basis of prior year test performance in 2014. I’m hoping this was just a typo. Second, there are many different ways to match students after propensity scores have been estimated, and the key criterion is evidence of balance along the covariates used to estimate the propensity score. None of this evidence with regard to balance has been presented, nor do we have any sense for how many students in each group couldn’t be matched. I raise points 1 and 2 above because there is in fact good reason to worry about a mode effect in favor of PP over OL I’ve just recently seen the preliminary results of two high profile testing programs finding what appear to be rather large mode effects. So if the mode effects in IN are trivial, it would come as a surprise to me. That could well turn out to be the case, but I would at a minimum need to see better answers to (1) and (2) above before I believe it.”
The documentation provided by CTB in response (“CTB Response for IDOE 10.20.15_FINAL.pdf”) helped to clarify the design that supported the concurrent calibration approach that was used to place PP and OL items onto a common scale. What had not been evident originally was that with the exception of a small minority of IN students, all students were given a common block of PP items in “Part 1” of their test. This is indicated in the table below, pulled from page 2 of the CTB response document.

3
This common block of PP items supports the use of concurrent calibration to place PP and OL items on a common scale. Furthermore, CTB was able to show that the OL item parameters estimated from either a separate or concurrent calibration are almost perfectly correlated. A lingering threat to the validity of a concurrent calibration is the possibility of secondary and tertiary dimensions that correspond to PP and OL item formats. Results from exploratory factor analyses conducted by CTB in response to this concern indicate some evidence of multidimensionality, particularly for the ELA tests. However, the first dimension plays the dominant role in explaining inter‐item covariation, and the results from this EFA are not far outside of what I have seen on other state tests. Hence while this is something that might be important to monitor as a possible source of item level bias (i.e., DIF), it probably does not present a problem that fundamentally undermines the evaluation of mode comparability. One important comment in regard to a statement made in the CTB document. On p. 1, they write that “the equating design allowed for student scores in Math and ELA to be made equivalent across paper/pencil and online modes.” I think this is a potentially misleading statement because it implies that mode effects have been removed in the equating process. But as seen below, this is not the case because when we form equivalent groups of students on the basis of 2014 test performance, we see instances of significant differences in test performance by mode, typically favoring students in the PP condition. It would be more accurate to say that the “equating” design makes it possible to place all OL and PP items onto a common scale, which is in itself no small feat. The CTB response also helped to establish more comprehensively the approach that was taken to create equivalent groups of students by mode condition. Doing so is important because in their response document, it is clear that in general (“II.C S2014 Test Performance Summary” on p. 103), students who took the test in OL mode (i.e., PP1OL, PP2OL, OL1OL, OL1PP) tended to be have significantly higher mean scores on tests taken the previous year in 2014. Because of this, in order to estimate a mode effect by grade and subject, it is necessary to make a statistical adjustment to ensure that the two groups of students have a similar profile in terms of variables such as prior academic achievement, socioeconomic status, race/ethnicity, etc. before we compare their 2015 ISTEP+ test scores.

4
In their initial draft document, CTB indicated (see Table 2, page 3) that they had used 2015 test scores as covariates in a logistic regression used to estimate the propensity (probability) of each student taking a test in a particular mode. This would represent a serious flaw, because 2015 test scores are the outcome to be compared. It is critical to estimate propensity scores on the basis of variables collected prior to the outcome of interest, since the outcome of interest could be influenced by the testing mode. Furthermore, it was not made clear in the draft document how students in each grade/subject/mode were matched according to their estimated propensity scores. In their response and in the final version of their mode comparability report, CTB has clarified that (with the exception of grade 3) they are using 2014 test scores to predict the propensity of taking the test in an OL mode. (Whether it was always the case that 2014 scores were being used or whether this was done in response to the concern I raised is not clear.) They have also clarified the approach taken to match students—they use a nearest neighbor method with replacement, the default option in the MatchIt procedure available in the R computing environment. PSM is a complex approach, and its use as a way to estimate a causal effect (the effect of mode of test performance) depends upon the specification of the underlying logistic regression used to compute propensities, evidence that covariate balance has been obtained, and the way that subjects are matched by propensity scores. It could be argued that many variables that would help to predict why students do or do not end up taking the test in an OL mode are missing from CTB’s specification: in particular, school‐level variables such as mode of test taken in previous year, demographic composition and achievement profile seem highly relevant. It could also be argued that nearest neighbor matching with replacement is not the best approach to take—we have no sense for the sensitivity to the finding to choice of matching approach. And as is noted in the report, the matching approach was not always successful in producing acceptable balance among the covariates that were used to estimate propensities (see “Summary and Discussion” on page 13 of final report). However, on the whole, the approach CTB took to create equivalent groups of students by subject in grades 4 through 8 is defensible, and serves as a reasonable first order approximation of the magnitude of mode effects in these grades and subjects. We see that for ELA, the mode effects (PP‐OL) are consistently positive (though often rather small when expressed in effect size units). In Math, the mode effects in grades 4‐8 do not always favor PP—though small, the effects favor the OL mode in grades 5 and 7. The relevant tables with results provided in CTB’s final mode comparability report are pasted below. Mode effects by grade for each subject are shown in effect size units in the last column.
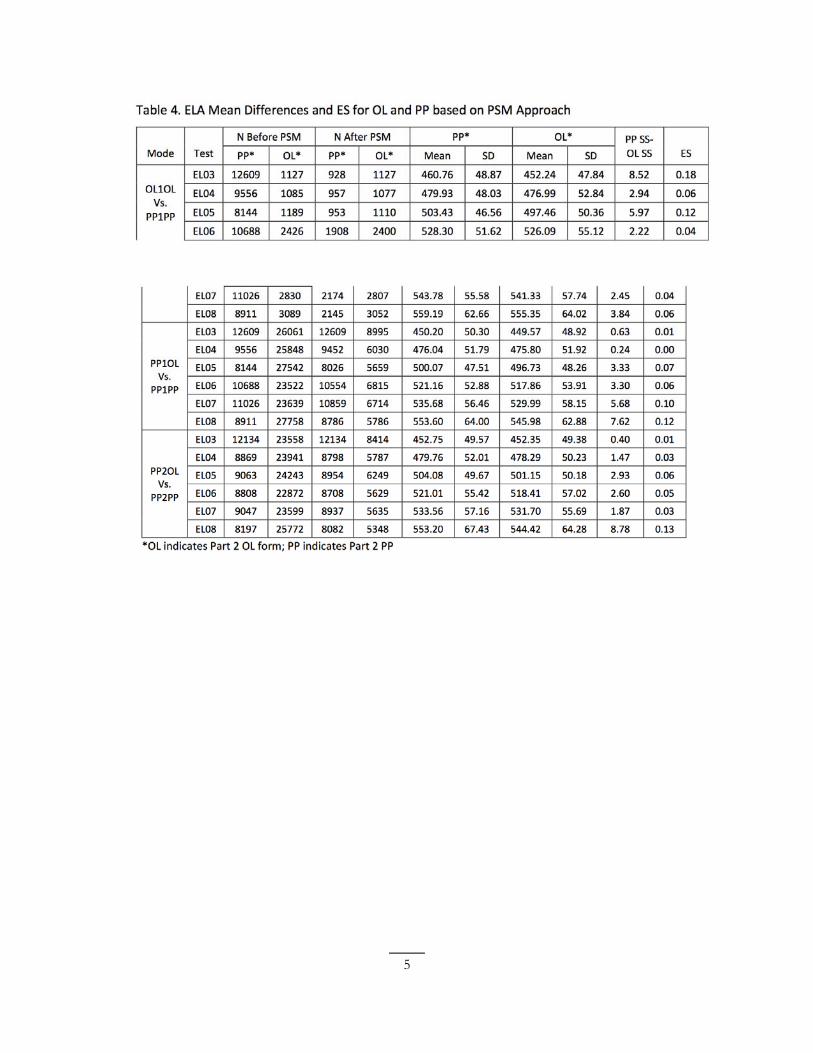
5

6
Of greatest concern is the validity of the mode effects estimated for grade 3 MA. Here because there are no prior grade test scores available (since no tests are given to students in grade 2), CTB instead used 2015 IREAD3 scores as a covariate in the estimation of propensity scores for both ELA and MA. As can be seen in Table 3 (page 4), the correlation of IREAD3 scores with ELA and MA 2015 ISTEP+ scores is .78 in ELA, but only 0.67 in MA. In contrast, for all other grades the correlation of ISTEP+ with prior year math scores is 0.80 or higher. Because of this, it is recommended to take the findings of mode effects favoring OL for grade 3 MA with a huge grain of salt. This may be an artifact of not successfully creating equivalent groups via PSM. Unfortunately, there isn’t much more that can be done to create more equivalent groups in MA. This author disagrees with the CTB’s conclusion stated on p. 13 that “In summary, no evidence of mode effects or issues with comparability across modes was found across contents and grades.” The tables shown above do indeed indicate the presence of small mode effects. CTB argues that

7
the effect sizes are small and hence not practically significant in the sense that none are greater than 0.2 and few are greater than 0.1. According to Cohen’s conventions, these are small effects. But this interpretation is not so sensible in the present context. Even a small effect could matter to a student near the threshold between two different achievement levels. Furthermore, in the way these test scores are being used in support of accountability decisions, even very small effects could have a big impact. It is important to appreciate that the current consensus definition of validity found in the 2014 edition of the AERA/APA/NCME Standards for Educational and Psychological Testing reads as follows “Validity refers to the degree to which evidence and theory support the interpretations of test scores for proposed uses of tests.” It follows from this that the validity of the ISTEP+ is very much related to its intended use. So if a student is differentially classified into achievement levels OR a school is differentially classified into an accountability category on the basis of testing mode, this bears directly on the validity of the test. It is true that we have uncertainty about the true magnitude of these mode effects for some of the reasons posed above about the PSM approach that was employed and the availability of key covariates for use in the PSM approach. But in the end, CTB has to stand behind their best possible estimate of grade by subject mode effects and make recommendations on this basis. This author also disagrees with the statement on p. 14 of CTB’s report that “Although there are some items that showed mode differences for ELA and MA, this is not an issue for reporting scores, including students’ scale scores and IPI scores. This is because the scale scores and IPI scores are based on the equated (mode‐specific) item parameters, which account for the potential mode effects through the calibration design.” This may be incorrect in the sense that if the forms had been successfully equated, then students (and schools) should be indifferent as to which mode was used to administer the ISTEP+. (This is central to the definition of what it means for two forms of the same test to be ‘equated.’) It follows that if randomly equivalent groups of students took the ISTEP+ in each mode, we should expect to observe the same mean score beyond differences due to chance variability in random assignment. The point of conducting a PSM is to approximate random assignment. To the extent this was successful, it does not appear that students/schools would consistently be indifferent to the mode in which the test was administered. Now to be sure, some of the observed differences in means are small enough that it is plausible that they could be explained by chance. But obtaining unbiased standard error estimates in PSM is not straightforward, and none have been provided by CTB in their analysis, so we can’t evaluate this formally at the present time. And other observed mean differences are clearly of practical and statistical significance given the magnitude of effect size and relative sample sizes for each group (i.e., EL05, EL07, EL08). From a policy perspective it seems important to communicate to students, schools and the IN public that no one will be disadvantaged because they were “early adopters,” even if it is true that some of the adjustments in questions are incredibly small and could be explained by chance.

8
Recommendations The short‐term recommendation is to, at a minimum, examine the potential consequences of mode effects on student achievement level classifications. This could be done rather easily by adding the mode effect to the scale scores of each student to see how many would now cross an achievement level threshold. If any student’s achievement level shift upwards, it would seem wise to give them the benefit of the doubt. As a concrete example, for students taking the test in the OL1OL condition for EL05, the mode effect is 5.97 scale score points (for an effect size of 0.12). So for every student taking the test in the OL1OL condition, the recommendation is to add 6 scale score points to their scores, re‐computing their associated achievement levels and using this adjusted data set to feed into the state’s growth model to examine the impact on school‐level accountability classifications. With respect to grade 3 MA and ELA, the recommended adjustment is to use on the average mode effect detected in grades 4‐8 where a stronger case can be made for successfully creating equivalent groups. So for example, in the PP1OL mode, the average effect for grades 4‐8 MA was .068 favoring PP, which could be translated into scale score units for grade 3. Then apply the same scale score adjustment as described above. A policy decision will need to be made about whether it would be sensible to apply the same adjustment approach to the few remaining grades/subjects in which there is a mode effect in favor of OL A good case could be made for always making an adjustment based on estimated mode effect (whether it favors PP or OL), or for only making an adjustment when students/schools would be disadvantaged by taking the OL mode. The latter policy creates an incentive for more schools to move to the OL format in the future. Over time, one might assume that the PP advantage, to the extent that one exists, will dissipate as students become more comfortable and familiar with taking the ISTEP+ (and other tests) in a digital format.

1
Indiana Validity Study Report Outline V. 1.1
Validity Study Number: 7 Short Title: Assessment of Special Needs Students Lead Author: Roeber Key Study Findings: There are potential concerns about the fairness of the ISTEP+ for students with disabilities and English learners. One issue noted was that the practice online test and the actual online test engines were different – students practiced on a different testing system than was actually used. A more serious issue was that students who needed to use two or more accommodations simultaneously were unable to do so. This is an issue that will need to be addressed with the new ISTEP+ vendor. Study Overview: An important issue for students, parents, and local educators is whether students with disabilities (SWDs) and English language learners (ELLs) were able to able to access the ISTEP+ assessments in a manner that gave them the opportunity of using all of the accommodations that their IEP or planning teams felt were necessary for the students to participate in the best manner possible. However, it is too late to carry out surveys of parents or educators for the 2015 program. Hence, our planning is more future‐orientated. Methodology—We propose to review any formal survey data or informal data (e.g., complaints, e‐mails, issue logs) that would shine light on any issues related to test administration training and materials, as well as student access and use of the online test system should be reviewed by the evaluators We propose to create three types of online surveys for use in 2016 and the future: 1) test administrators, 2) teachers of SWDs and ELLs, and 3) parents. The educator surveys could be sent to all schools, or a sample of school corporations could first be drawn to focus the survey on school corporations with more ELL and SWD students. The parent survey could be disseminated to IN school corporations for inclusion on the schools’ websites.
Study Data Needs and Information Supplied
Documentation Sought Documentation Provided
A. Assessment administration manuals at the school corporation, school, and assessment administrator levels.
2706511w_13AS_exm_s15IN_PR.pdf 2706574w_13MC_exm_s15IN_PR.pdf Appendix C (Accessibility and Accommodations Guidance)_2014‐2015_FINAL
B. Assessment accommodations lists for ISTEP+ assessments for students with disabilities and English language learners for either paper‐based or online assessment.
Appendix C (Accessibility and Accommodations Guidance)_2014‐2015_FINAL
C. Issue logs from IDOE, SBOE, and the contractors about assessment participation of students with disabilities and English language learners.
IDOE, SBOE, and CYB indicated that they kept no log of issues about any aspect of the 2015 ISTEP+ program.
D. E‐mails from parents, teachers, administrators, and other citizens regarding the 2015 assessment administration for students with disabilities and English language learners.
ISTEP+ Update (Online Tools and Selecting Responses) April 20, 2015.pdf
E. Any data from ISDE or contractor surveys used at the state or local levels to collect feedback from students, educators, and/or parents about assessment accommodations
No surveys were used to collect information from students, educators, and/or parents about assessment accommodations and/or the participatioof students with disabilities and English language

2
and/or the participation of students with disabilities and English language learners in either the paper‐based or online assessments.
learners in either the paper‐based or online assessments.
F. Online surveys from other states regarding the assessment administration and assessment accommodations for students with disabilities and English language learners designed for parents, teachers, and administrators, to be used to craft surveys for use in 2016 and beyond.
Michigan’s surveys are available. The surveys are of students, educators, and/or parents about assessment accommodations and/or the participatioof students with disabilities and English language learners in either the paper‐based or online assessments.
Summary of Documentation This issue was added to the list of proposed validity studies due to a series of communications forwarded to the author in April 2015. These communications included the following from the IDOE. Unfortunately, no logs of issues that arose during the assessment were kept or maintained, according to both the IDOE and the contractor. Thus, the author had to rely on e‐mail communications between IDOE and the field, as well as between the author and SBOE staff to determine if issues existed and the possible extent of them.
A communication between a SBOE staff and a local educator raised the issue of the participation of students with disabilities in the Spring 2015 ISTEP+ assessment. These communications indicate that there was some confusion among local educators and their students with disabilities about the use of technology‐enhanced accommodations during ISTEP+ assessment. As described in the Michele Walker message to the field dated on April 20, 2015, students may use only one of the online accommodation tools at a time. This means that if the student requires the use of two or more tools (e.g., text highlighter and option elimination), they must turn off the first accommodation before they can use the second (or any subsequent) accommodation.

3
This situation was apparently different from learning to use online accommodations that occurred with the practice test, as noted in a communication from Cynthia Roach to the author dated April 24, 2015. At the time of these communications by the IDOE, the IBOE staff, and local educators, this author indicated the following in response to these communications.

4
Discussion The practice test provided to student prior to the actual assessment apparently did provide the opportunity for students with disabilities to use two or more online accommodations simultaneously. However, the practice test assessment engine was different from the online assessment engine actually used in the ISTEP+ assessment. This is inappropriate for a couple of reasons. First, both the practice test and the operation assessment engine was provided by the same vendor (CTB/McGraw‐Hill). Second, the intent of using a practice test is to provide students with the opportunity of practicing on the same assessment engine as they will actually use in the assessment. It is not just practice in test‐taking; instead, it is the opportunity for students to learn the nuances of using the various assessment accommodations that they will use in the actual assessment. It is not appropriate to change the assessment engine between the practice test and the actual online assessment situation (if this did, in fact, occur), since this would not provide students with disabilities and their instructors the opportunity to learn the new system. Apparently was the case, however. The rationale for the use of a different online assessment system from what students had practices on was not provided in the April 20, 2015 communication from Michele Walker to local educators. Conclusions The practice test provided to student prior to the actual assessment apparently did provide the opportunity for students with disabilities to use two or more online accommodations simultaneously. However, the practice test assessment engine was different from the online assessment engine actually used in the ISTEP+ assessment. This is inappropriate for a couple of reasons. First, both the practice test and the operation assessment engine was provided by the same vendor (CTB/McGraw‐Hill). Second, the intent of using a practice test is to provide students with the opportunity of practicing on the same assessment engine as they will actually use in the assessment. It is not just practice in test‐taking; instead, it is the opportunity for students to learn the nuances of using the various assessment accommodations that they will use in the actual assessment. It is not appropriate to change the assessment engine between the practice test and the actual online assessment situation (if this did, in fact, occur), since this would not provide students with disabilities and their instructors the opportunity to learn the new system. Apparently this was the case, however. The explanation for the use of a different online assessment system from what students had practices on was not provided in the April 20, 2015 communication from Michele Walker to local educators. With the switch in vendors that will administer the ISTEP+ 2016 assessment, it will be essential for the IDOE and SBOE to review the availability and use of accommodations by students with disabilities and English learners during the assessment. This review should assure that the range of accommodations needed is available to these students (and their educators), that the same accommodations are available and can be used in both the practice tests and the actual assessments, and that multiple accommodations can be used as needed by students in both the practice tests and the actual assessments. IDOE and the new vendor (Pearson) should establish an issues log kept jointly by both organizations (and the SBOE as well) so as to be able to document the occurrence of issues and their resolution. This will be useful in preparing updated Q & A’s that can be provided to local educators, as well as spotting issues that need to be addressed during the current and subsequent assessment years. If this log is kept online, each party can add issues as they occur (e.g., telephone calls or e‐mails sent to each agency) and can code them such that the total incidence of issues of different types can be readily ascertained for planning purposes. Finally, the IDOE and/or its vendor (Pearson) should provide surveys of students, teachers, and school

5
corporation test coordinators available immediately following testing in order to gather direct information from them about the testing experience. This is especially important to do for students testing online, and such students could be asked a few questions about their online testing experience at the conclusion of testing. School corporations could be asked to post a parent survey online on their corporation websites and then let parents know that it is there for them to complete as well. The data gathered can be very useful for program planning purposes in the future. Sample surveys that IN may wish to consider are available from the Michigan Department of Education.