an of consumers’ preferences for differentiated beef … report... · an examination of...
TRANSCRIPT

An Examination of Consumers’ Preferences for Differentiated Beef Products
by
Agri‐Industry Modeling & Analysis Group (AIMAG)*, Department of Agriculture and Resource Economics,
The University of Tennessee
Prepared for The Center for Profitable Agriculture
Funding for this report was provided in part by the
Tennessee Department of Agriculture
June 2012
*Jamey Menard, Research Associate; Kim Jensen, Professor; and Burton C. English, Professor
ii
Forward This report was developed in an effort to review data and research available related to the market for local beef in Tennessee. While not meant to serve as a publication for use directly “as is” for most Extension audiences, the information in this report will be used in several ways. First, the report will assist Tennessee Value‐Added Beef Program partners in understanding the market for local beef and developing educational presentations and materials to help producers analyze the market for their potential products. In addition, the report is helpful in identifying needs for additional market research to support educational programs and technical assistance efforts for value‐added beef enterprises. I am grateful to the Agri‐Industry Modeling and Analysis Group (AIMAG) and especially Jamey Menard and Kim Jensen for their willingness to conduct a review and develop this report. Megan L. Bruch Marketing Specialist Center for Profitable Agriculture

iii
Table of Contents
Page List of Tables iii List of Figures iii Background 1 National Market Trends 4 Willingness‐to‐Pay Studies 5 Grass‐fed 7 Domestic Grain‐fed vs. International Grass‐fed 7 Grass‐fed, Hormone‐Free, and Traceable 7 Environmentally Friendly 8 No Growth Hormones or Antibiotics 8 Branding and Value‐Added Attribute Bundling 9 Locally Produced 10 Altruism Influences on Natural and Regionally Produced 10 Humane Treatment 11 Targeted Consumer Profile for Tennessee 12 Tennessee USDA Meat Slaughtering Facilities 14 Direct to Consumer Sales 18 Tennessee Meat Producers’ Implications 20 References 22
List of Tables Page Table 1. Consumers’ Preferences and Willingness‐to‐Pay Socio‐Demographics for
Differentiated Beef Product Segments 5 Table 2. Tennessee’s USDA Inspected Slaughtering Facilities Contacted, 2012 15 Table 3. Number and Types of Animals Slaughtered by Region by Tennessee’s USDA
Inspected Facilities Contacted, 2012 17 Table 4. Annual Averages of Choice Beef Values 19 Table 5. Price of Rib‐Eye and Ground Beef Sold Directly to Consumers by Tennessee
Producers Marketing a Differentiated Beef Product Attribute 19
List of Figures
Page Figure 1. Location of Beef Cattle by County in Tennessee, 2007 2 Figure 2. U.S. Average Annual Per Capita Consumption of Leading Meats (Boneless Weight),
1909‐2009 4 Figure 3. U.S. Average Annual Per Capita Expenditures for Leading Meats, 1980‐2009 4 Figure 4. Population by County, 2010 12 Figure 5. Female Population by County, 2010 12 Figure 6. Median Age of Females by County, 2010 13 Figure 7. Persons with Bachelor’s Degree or Higher by County, 2010 13 Figure 8. Person Per Household by County, 2010 13
iv
List of Figures (Cont.) Figure 9. Median Household Income by County, 2010 13 Figure 10. Counties Matching the “Targeted Consumer” Profile Socio‐Demographics, 2010 14 Figure 11. Location of USDA Inspected Slaughtering Facilities in Tennessee, 2012 15 Figure 12. Number of Farms Selling Agricultural Products Directly to Individuals for
Consumption by County, 2007 18 Figure 13. Volume of Sales for Agricultural Products Sold Directly to Individuals for
Consumption by County, 2007. 18
1
Background
In Tennessee, the beef cattle industry contributes $988.7 million (2010$) in direct and indirect
economic activity to the state’s economy, which supports 16,541 jobs1 (MIG, 2010). In 2010, the
number of cattle and calves in Tennessee totaled just over two million, with 5 thousand cattle and
calves on feed (USDA/NASS, 2011; USDA/NASS, 2010). Based on the number of head, Tennessee’s beef
cattle industry is ranked 9th and for all cattle and calves is ranked 15th in the United States (TDA, 2011).
According to the Census of Agriculture, in 2007 there were 42,344 farms with beef cows totaling
1,927,638 cattle making the typical herd size 45.5 head per farm (USDA/NASS, 2007). Beef cattle
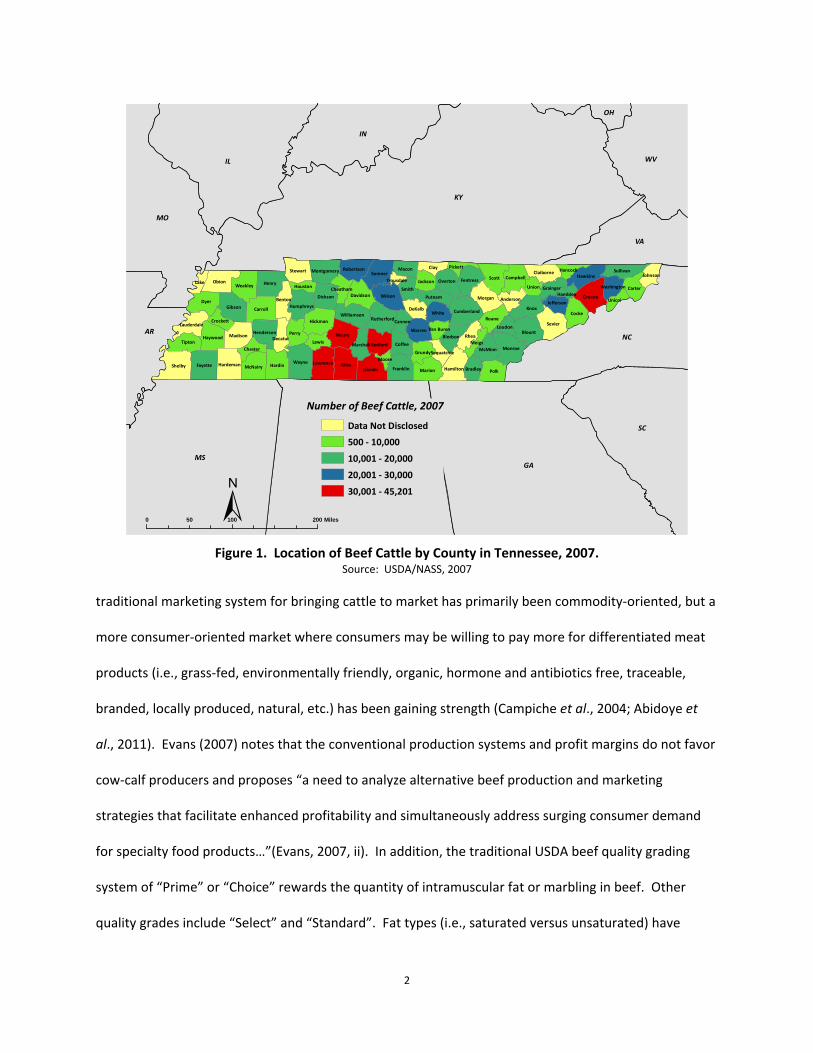
production occurs in every county of the State, with middle and eastern Tennessee having the greatest
numbers (Figure 1). For agricultural operations, raising cattle is the leading agricultural enterprise in
which Tennesseans are involved. Most of the state’s beef operations are cow‐calf (88 percent) with the
remaining 10 percent being backgrounding or stockering2 operations.
Tennessee does not have large‐scale3 slaughtering. Most of the beef produced is shipped to
feedlots out of state or to smaller slaughtering facilities. According to the Tennessee Department of
Agriculture in 2010, there were 14 federally inspected beef slaughter facilities that processed 40,500
head (TDA, 2011). It is estimated that 750,000 feeder calves in Tennessee are marketed to
backgrounding operations and feedlots in the Midwest and High Plains annually (Neel, 2010). This
1 Includes both full‐ and part‐time jobs as well as self‐employed. 2 Stocker operations purchase young, lightweight calves and are fed on pasture until a desired weight is achieved to move to a feedlot or used as replacements. Backgrounding is the preparation of young cattle for feedlots feeds (McKinley et al., 2004; Lardy, 1998). 3 The definition of “large‐scale” changes with time. Slaughter facilities are now more concentrated and in close proximity to where cattle are fed. In 2007, Kansas, Texas, Nebraska, Oklahoma, and Colorado had the largest proportion of custom fed cattle shipped directly for slaughter, accounting for close to 80 percent of the U.S. total (USDA/NASS, 2007). According to USDA’s Food Safety and Inspection Service (FSIS) 1996 Pathogen Reduction/Hazard Analysis and Critical Control Point (PR/HACCP) rule, large plants have 500 or more employees, small plants have 10 to 499 employees, and very small plants have fewer than 10 employees or annual sales less than $2.5 million (Ollinger et al., 2004).
2
Figure 1. Location of Beef Cattle by County in Tennessee, 2007. Source: USDA/NASS, 2007
traditional marketing system for bringing cattle to market has primarily been commodity‐oriented, but a
more consumer‐oriented market where consumers may be willing to pay more for differentiated meat
products (i.e., grass‐fed, environmentally friendly, organic, hormone and antibiotics free, traceable,
branded, locally produced, natural, etc.) has been gaining strength (Campiche et al., 2004; Abidoye et
al., 2011). Evans (2007) notes that the conventional production systems and profit margins do not favor
cow‐calf producers and proposes “a need to analyze alternative beef production and marketing
strategies that facilitate enhanced profitability and simultaneously address surging consumer demand
for specialty food products…”(Evans, 2007, ii). In addition, the traditional USDA beef quality grading
system of “Prime” or “Choice” rewards the quantity of intramuscular fat or marbling in beef. Other
quality grades include “Select” and “Standard”. Fat types (i.e., saturated versus unsaturated) have
GilesShelby
Dyer
Scott
Knox
Wayne
Polk
Sevier
Henry
Fayette
Obion
Maury
CarrollGibson
Hardin
Greene
Blount
Wilson
Monroe
Lincoln
Cocke
Perry
Sumner
Hickman
MarionFranklin
Tipton
Weakley
Rhea
Morgan
Coffee
Stewart
LawrenceMcNairy
Madison
Clay
Hamilton
Dickson
Hardeman
WhiteRoane
Fentress
Warren
Bedford
Carter
Hawkins
Davidson
Haywood
Cumberland
Rutherford
Sullivan
Smith
OvertonCampbell
Putnam
Williamson
McMinn
Lewis
Grundy
Humphreys
RobertsonClaiborne
Henderson
DeKalb
MaconMontgomery
JacksonUnion
JeffersonBenton
Bledsoe
Lauderdale
Decatur
Lake
Bradley
Marshall
Johnson
Chester
Anderson
Meigs
Grainger
LoudonCannon
Unicoi
Crockett
Cheatham Washington
PickettHancock
Houston
Van Buren
Sequatchie
Hamblen
Moore
Trousdale
KY
ALGA
IL
MS
SC
NC
IN
MO
WV
VA
AR
OH
±0 100 20050 Miles
Number of Beef Cattle, 2007
Data Not Disclosed
500 ‐ 10,000
10,001 ‐ 20,000
20,001 ‐ 30,000
30,001 ‐ 45,201
3
become a major health concern to some consumers over the years. However, some consumers,
including the grain‐fed beef industry, believe fat contributes to flavor, juiciness and tenderness of the
meat, which are also important characteristics to consumer preferences in meat. The current beef
grading system is based on saturated or unhealthy fat (McCluskey et al., 2005).
Various methods exist for getting beef in the marketplace for human consumption. One
method is via using USDA inspected facilities where meat entering commerce may be sold across state
lines, via the Internet or mail order. In some states, state inspected processing plants are available but
the meat can only be sold within the state, which would include online sales, mail orders and other sales
method for meats too. However, since 1971, Tennessee state inspection of meats has not been
available. Tennessee relies on federal inspection instead. Some meat producers may keep ownership of
the meat and sell directly to individual consumers, grocery stores, and restaurants or other venues.
Custom processing facilities are available for producers wishing to sell live animals to consumers for
their use. In addition, the Tennessee Department of Agriculture (TDA) permits custom meat processing
for meat not for sale or for personal use (Bruch, 2010; Dalton et al., 2003; Dunlap et al., 2008).
The objective of this analysis is to provide information on the potential for Tennessee beef cattle
producers selling locally produced and/or differentiated beef products in Tennessee. In order to
accomplish this objective a review of the literature concerning consumers’ acceptability/preferences
and willingness‐to‐pay (WTP) for differentiated meat products will be presented. From these studies, a
“target consumer” profile will be constructed based on socio‐demographic factors influencing
consumers’ purchases of these products. Once the “target consumer” profile has been developed, a
spatial representation of the counties in Tennessee which match these socio‐demographic attributes will
be created to identify most likely markets. Next, a review of Tennessee’s USDA meat slaughtering
facilities will follow along with information derived from contacting the facilities concerning number and
type of animals slaughtered. A discussion of direct‐to‐consumer sales will ensue next with price
4
information given for Tennessee producers marketing and selling a differentiated beef product attribute
directly to consumers. And finally, a discussion focusing on potential implications for Tennessee’s meat
producers will follow.
National Market Trends
The beef cattle industry contributes over $172.3 billion (2010$) in direct and indirect economic
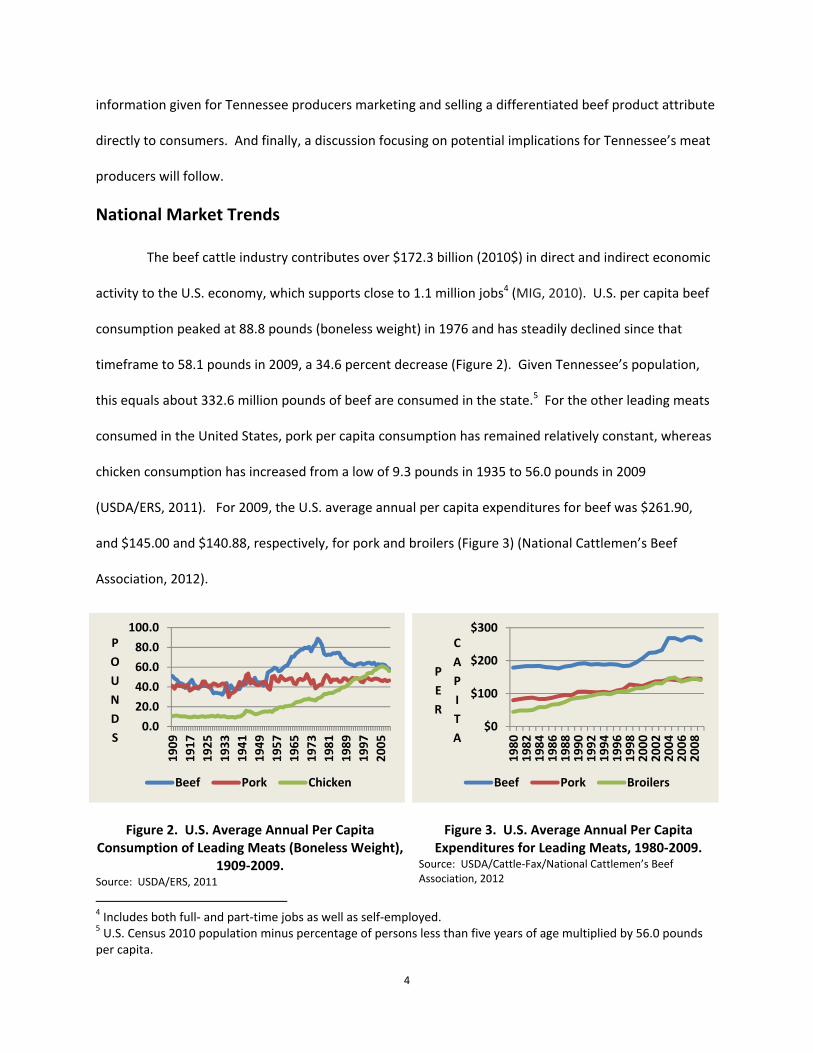
activity to the U.S. economy, which supports close to 1.1 million jobs4 (MIG, 2010). U.S. per capita beef
consumption peaked at 88.8 pounds (boneless weight) in 1976 and has steadily declined since that
timeframe to 58.1 pounds in 2009, a 34.6 percent decrease (Figure 2). Given Tennessee’s population,
this equals about 332.6 million pounds of beef are consumed in the state.5 For the other leading meats
consumed in the United States, pork per capita consumption has remained relatively constant, whereas
chicken consumption has increased from a low of 9.3 pounds in 1935 to 56.0 pounds in 2009
(USDA/ERS, 2011). For 2009, the U.S. average annual per capita expenditures for beef was $261.90,
and $145.00 and $140.88, respectively, for pork and broilers (Figure 3) (National Cattlemen’s Beef
Association, 2012).
Figure 2. U.S. Average Annual Per Capita
Consumption of Leading Meats (Boneless Weight), 1909‐2009.
Source: USDA/ERS, 2011
Figure 3. U.S. Average Annual Per Capita Expenditures for Leading Meats, 1980‐2009.
Source: USDA/Cattle‐Fax/National Cattlemen’s Beef Association, 2012
4 Includes both full‐ and part‐time jobs as well as self‐employed. 5 U.S. Census 2010 population minus percentage of persons less than five years of age multiplied by 56.0 pounds per capita.
0.0
20.0
40.0
60.0
80.0
100.0
1909
1917
1925
1933
1941
1949
1957
1965
1973
1981
1989
1997
2005
P
O
U
N
D
S
Beef Pork Chicken
$0
$100
$200
$300
1980
1982
1984
1986
1988
1990
1992
1994
1996
1998
2000
2002
2004
2006
2008
P
E
R
C
A
P
I
T
A
Beef Pork Broilers

5
Willingness‐to‐Pay Studies
There are numerous studies focusing on consumers’ acceptability/preferences and willingness
to pay (WTP) for differentiated beef products. Many provide socio‐demographic information for the
consumer most likely to purchase these products. The value‐added or differentiated meat product
attributes this study will focus on are either single or a combination of meat attribute segments such as
grass‐fed, hormone/antibiotics free, traceable, environmentally friendly, branding, bundling of
attributes, locally produced, natural and regionally produced, and humane treatment. A summary table
outlining the various socio‐demographic variables for the studies reviewed in this section is presented in
Table 1.
Table 1. Consumers’ Preferences and Willingness‐to‐Pay Socio‐Demographics for Differentiated Beef Product Segments
Product Age Education Gender (Female) Income
HouseholdSize Other
Determining Consumer Perceptions of and WTP for Appalachian Grass‐fed Beef: An Experimental Economics Approach (Evans, 2007)
+ + + ‐ +
Previously purchased grass‐fed beef (+); health concerns (+);
price important in beef purchases (‐); outlet meat purchases (+); in‐home prep
frequency (+); local production ranking (+); surveyed in urban area vs. urbanizing area (+);
typically look for Choice grades or higher (‐)
WTP for Branded Fresh Beef Products in Canada (Carlberg, Freohlich, and Ward, 2007)
+ + + In‐home prep frequency (+);
Product’s name (+)
U.S. Consumer Preference and WTP for Domestic Corn‐fed Beef Versus International Grass‐fed Beef Measured Through an Experimental Auction (Umberger, Feuz, Calkings, and Killinger‐Mann, 2002)
Flavor (+)

6
Table 1. Consumers’ Preferences and Willingness‐to‐Pay Socio‐Demographics for Differentiated Beef Product Segments (Cont.)
Product Age Education Gender (Female) Income
HouseholdSize Other
WTP for Environmentally Friendly Beef in Georgia (Wong, 2009)
+
Previous purchases of branded/Labeled Goods
(+); environmentally concerned (+)
Forage‐Fed Beef Attributes: Customer Preferences and WTP (Fields, Prevatt, Lusk, and Keith, 2006)
+ + Free from growth hormones or antibiotics and traceability back to the farm (+); small cuts (+)
Consumers’ WTP for Locally Produced Ground Beef: A Case Study (Chang, Underwood, Langelett, and Xu, 2012)
Grass‐fed & Organic
(‐); beef cuts (‐); brand differences/leanness (+)
Impacts of Consumer Characteristics and Perceptions on WTP for Natural Beef in the Southern Plains (Campiche, Holcomb, and Ward, 2004)
Previous meat purchasing behavior & perceptions (+);
purchased other natural/organic foods
(+); positive attitude toward natural beef after reading a
description (+); not affected by brand (‐); checks labels (+)
Consumers’ WTP for Retail Branded Products with Bundled Attributes (Franken, Parcell, and Tonsor, 2011)*
+ + +
Health concerns (+); U.S. produced Choice grades or
higher (+); moderate likelihood seek more information about grassland management and nature friendly beef or
purchase nature friendly beef (+)
Does Altruism Play a Role in Determining US Consumer Preferences and WTP for Natural and Regionally Produced Beef? (Umberger, McFadden, and Smith, 2009)
+ + ‐
Natural beef safer than conventional beef (+); quality, perceptions, nutrition, and safety (+); antibiotic and
hormone usage (+); humane treatment of animals (+)
Note: To denote whether the socio‐demographic variables in the studies positively or negatively influence preferences for the differentiated beef products investigated, the symbols + or – are used. *For branding to be successful, animal welfare traits in combination with other attributes may be required; potential successful bundling strategies noted by the authors include organic, all natural, and low carbon footprint and grass‐fed/lean and locally and US produced; or natural friendly, low carbon footprint, organic, all natural, and grass‐fed/lean or locally and US produced and possibly all natural and grass‐fed lean (Franken, Parcell, and Tonsor, 2011).

7
Grass‐fed
Evans (2007) studied consumers’ perceptions and WTP for grass‐fed beef in the Appalachian
region, hypothesizing “grass‐fed” brings certain quality attributes appealing to consumers. Of the
consumers’ sampled, a majority of the consumers preferred grass‐fed steaks and ground beef used in
the study noting leanness and favorable fatty acid composition traits more importantly rated than the
production process. Consumer characteristics that positively influenced consumers’ preferences for
grass‐fed steaks included age, educational attainment, being female, household size, has previously
purchased grass‐fed products, concerned about health, tendency to purchase meat products in outlets,
and frequency of in‐ home meat preparation. Consumers’ income and price were found to be negatively
associated with meat purchases.
Domestic Grain‐fed vs. International Grass‐fed
Umberger et al. (2002) analyzed consumers’ preferences and WTP for domestic corn‐fed beef
versus international grass‐fed beef. Because of international trade, there is a greater selection of
products from which consumers can choose are becoming available. Noting that flavor in beef products
as an important consumer preference, a study would be of interest to compare consumers’ preferences
for beef products from countries that finish cattle on grass instead of corn. In this study, grass‐fed
steaks imported from Argentine were compared with corn‐fed USDA Select steaks. The results indicate
that consumers can differentiate between the two and are WTP a premium for their preferred steak.
Grass‐fed, Hormone‐Free, and Traceable
Fields et al. (2006) conducted an Alabama forage‐fed beef study to evaluate consumers’
demand for pasture‐fed, hormone‐free, traceable beef. Noting the limited data on the subject matter
and believing consumers’ prefer in most cases a WTP for healthier products, the results indicate that
individuals prefer pasture‐grazed, growth hormone or antibiotic free, and beef traceable back to the
farm. Preferences for pasture‐fed beef increased along with the WTP premium when information was
8
provided on its health benefits. With no health information, the WTP premium declined. Consumers
with the stronger preferences included females with higher income preferring no added hormones and
traceability back to the farm.
Environmentally Friendly
In a survey study looking at consumers’ preferences and WTP for environmentally friendly beef
in Georgia, Wong (2009) notes that organic, grass‐fed, and environmental friendly are the three main
niche markets affecting beef producers. Because of increase economic pressure from the pork and
poultry industries as a result from promoting their health benefits, certification labels and brands
differentiating beef product segments have increased because of economic pressures forcing beef
producers to re‐evaluate production and marketing techniques. For this study, environmental friendly
certification entails environmental stewardship, farm profitability, and prosperous farming
communities. More specifically, environmental friendly in the study entailed ground and underground
water contamination protection, erosion reduction via land management practices, and air pollutant
reduction. The majority of those surveyed (53 percent) were WTP for environmental friendly beef.
Education, previous purchases of branded/labeled goods, and how concerned they were for the
environment positively affected consumers’ preferences.
No Growth Hormones or Antibiotics
Campiche et al. (2004) studied consumer characteristics and perceptions on WTP for natural
beef (no growth hormones or antibiotics used) in the Southern Plains (Kansas, Oklahoma, and Texas).
The authors note that natural beef producers need higher returns to offset the increased production
costs that entails from not using antibiotics and growth hormones (decline in average daily gains), less
efficiency in feed conversion, increase marketing, and time. In addition, the labels and packaging used
to market their product need to capture consumers’ attention. From this study, factors influencing
consumers’ purchases of natural beef include previous meat purchasing behavior and perceptions,

9
previous other natural/organic food purchases, positive attitude toward natural beef after reading a
description, and those consumers that check labels. Brand in this study did not significantly influence
meat purchasing behavior. The authors further note that in order to increase natural beef purchases,
marketing strategies may be required for various respondent groups including contracting with stores
before using this type of production method.
Branding and Value‐Added Attribute Bundling
Two studies look at consumers’ WTP for branded fresh beef products (Carlberg et al., 2007;
Franken, 2011). According to the National Cattlemen’s Beef Association, branded beef promises the
consumer a consistency of attributes (i.e., taste consistency, tenderness, flavor, etc.) and is comprised of
the three categories breed specific (i.e., Certified Angus Beef™), company specific (i.e., Laura’s Lean
Beef™), and store branded (National Cattlemen’s Beef Association, 2012). Carlberg et al. (2007) notes a
product’s name positively influences consumers’ WTP for branded beef. Age had a negative influence
on premiums, whereas frequency of beef eaten per week, confidence in choosing beef products,
gender, and income only sporadically influenced premiums. Franken et al. (2011) investigated bundling
value‐added attributes to influence consumers’ perceptions and WTP for beef steaks. Information was
gathered in 2010 via an online survey in the Kansas City and St. Louis, Missouri area. An example
attribute bundle included U.S. produced, locally6 produced, all natural, grass‐fed/lean, nature friendly
(habitat conserving), and low carbon footprint. Findings from their results suggest that consumers’
perceive nature friendly, organic, all natural, low carbon footprint, and grass‐fed/lean similarly, including
locally and US produced and all natural and grass‐fed/lean attributes. One potential branding strategy
recommended by the authors is to combine nature friendly with organic or all natural and possibly
6 USDA is currently involved in a Know Your Farmer, Know Your Food campaign commitment originated by President Obama to strengthen local and regional food systems. With food dollars and other monies spent locally, not only do monies stay within the community but as a result of the multiplier effect greater economic benefits accrue to the area. For this program, local is defined as within 400 miles or within the state in which a commodity was grown or raised (USDA, 2012).

10
grass‐fed/lean attributes. Positive socio‐demographic influences on WTP premiums included high
income, young females, with concerns for health.
Locally Produced
Chang et al. (2012) studied consumers’ WTP for locally produced ground beef in rural South
Dakota. The authors note that the Midwest has the highest beef consumption and, among all beef cuts,
ground beef has the largest market share—a niche market suitable for local small‐ and medium‐scale
producers. Attributes considered were brand difference, price, leanness, cut difference, grass‐fed, and
organic. Brand difference and leanness were the most influential in determining consumers’
preferences. The remaining attributes—cut difference, grass‐fed, and organic—were less influential.
Other product attributes not influencing WTP premiums included cut difference (sirloin vs. chuck), grass‐
fed, and organic leading the authors to conclude that local small‐ and medium‐scale producers may
need to reconsider switching from conventional to organic or grass‐fed meat production since price
premiums can be minimal.
Altruism Influences on Natural and Regionally Produced
Umberger et al. (2009) also conducted a study looking at how altruism influences U.S. consumer
preferences and WTP for natural and regionally produced beef. From a national online survey, an
attempt was made to identify factors explaining consumers’ WTP higher premiums for natural and
regionally produced ground beef and USDA Choice rib‐eye steaks. According to the authors, consumer
preferences were motivated by a combination of perceptions of personal benefits and altruistic factors.
The study’s purpose was to investigate the relationship between altruism versus other factors
determining meat purchasing behavior by consumers related to a specific meat attribute. Increased
disposable incomes, food safety issues, and environmental concerns are some of the causal factors
influencing consumers’ particularities of meat production processes. Socio‐demographic factors
positively influencing WTP a premium for regionally produced, natural beef include young consumers,

11
no children living at home, and high incomes. A negative factor included the importance of price in their
purchasing decision. Altruistic factors positively influencing consumers’ WTP a higher premium included
perceptions that natural beef was safer than conventional beef; quality, nutrition, and safety
perceptions of natural beef; humane treatment of animals; concerns about antibiotic and hormone
usage in production; and support for local agriculture.
Humane Treatment
Humane treatment and interest in farm animals well‐being was a concern to Ohioans in a survey
conducted by Ohio State University in 2004 (Rauch and Sharp, 2005). For those responding (note only
four percent resided on a farm), 92 percent agreed it was important that animals on farms are well‐
cared for, 85 percent agreed that even though some farm animals are used for meat, the quality of their
lives is important, 81 percent agreed that the well‐being of farm animals are just as important as the
well‐being of pets, and 75 percent agreed that farm animals should be protected from feeling physical
pain. In addition, 59 percent of the respondents were WTP more for meat, poultry, or dairy labeled for
animals that were humanely treated. Of that group, 12.4 percent were WTP 25 percent more, 43.1
percent were WTP 10 percent more, and 40.6 percent were not WTP more. In the 2008 follow‐up Ohio
survey, 56 percent of the respondents agreed that increased regulation of the treatment of farm
animals is needed, a 19.1 percent increase from 2004 survey data (Rauch and Sharp, 2005; Sharp, 2008).
Of interest would be the growth rates of the various differentiated meat products discussed.
Except for the organic foods industry, much of this data is either lacking or discussed only peripherally.
According to Painter (2008) in 2003, the growth rate for organic meat was 78 percent with an expected
growth rate of 43 percent through 2008. Greene et al. (2009) noted that between 1997 and 2008,
organic food sales increased annually between 12 and 21 percent, and of the organic sales made in
2004, 24 percent were made locally. Allan (2002) noted that in 1998 of the total market share of U.S.
beef, 10 to 12 percent were accounted for by producer and processor brands with expectations to be

12
25‐30 percent by the end of 2002. Assuming a conservative 10 percent market share in organic beef and
58.1 pounds per capita beef consumption per person in 2009, 5.8 pounds per capita of organic beef are
consumed per year. Adjusting population for individuals less than five years of age, 5.94 million
individuals live in Tennessee (Census, 2010). Organic beef consumption based on this logic was
estimated at 34.4 million pounds for the state.
Targeted Consumer Profile for Tennessee
For the studies previously discussed, the socio‐demographics of the “targeted consumer” for the
meat attribute products discussed appear, in general, to be young, female, educated, and have high
incomes. Household size may positively or negatively influence preferences (see Evans, 2007 and
Umberger et al., 2009). For Tennessee, the median age for females is 37.2, average female proportion is
51.3 percent, individuals holding a bachelor’s degree or higher is 22.7 percent, persons per household is
2.49, and the average median household income is $43,314 (Census Bureau, 2010; IDcide, 2010). The
maps in Figures 4 through 9 detail these socio‐demographic characteristics spatially by county for the
Figure 4. Population by County, 2010 Figure 5. Female Population by County, 2010
GilesShelby
Dyer
Scott
Knox
Wayne
Polk
Sevier
Henry
Fayette
Obion
Maury
CarrollGibson
Hardin
Greene
Blount
Wilson
Monroe
Lincoln
Cocke
Perry
Sumner
Hickman
MarionFranklin
Tipton
Weakley
Rhea
Morgan
Coffee
Stewart
LawrenceMcNairy
Madison
Clay
Hamilton
Dickson
Hardeman
WhiteRoane
Fentress
Warren
Bedford
Carter
Hawkins
Davidson
Haywood
Cumberland
Rutherford
Sullivan
Smith
OvertonCampbell
Putnam
Williamson
McMinn
Lewis
Grundy
Humphreys
RobertsonClaiborne
Henderson
DeKalb
MaconMontgomery
JacksonUnion
JeffersonBenton
Bledsoe
Lauderdale
Decatur
Lake
Bradley
Marshall
Johnson
Chester
Anderson
Meigs
Grainger
LoudonCannon
Unicoi
Crockett
Cheatham Washington
PickettHancock
Houston
Van Buren
Sequatchie
Hamblen
Moore
Trousdale
KY
ALGA
IL
MS
SC
NC
IN
MO
WV
VA
AR
OH
±0 100 20050 Miles
Population by County, 2010
5,000 ‐ 50,000
50,001 ‐ 100,000
100,001 ‐ 150,000
150,001 ‐ 250,000
250,001 ‐ 500,000
500,001 ‐ 927,644
GilesShelby
Dyer
Scott
Knox
Wayne
Polk
Sevier
Henry
Fayette
Obion
Maury
CarrollGibson
Hardin
Greene
Blount
Wilson
Monroe
Lincoln
Cocke
Perry
Sumner
Hickman
MarionFranklin
Tipton
Weakley
Rhea
Morgan
Coffee
Stewart
LawrenceMcNairy
Madison
Clay
Hamilton
Dickson
Hardeman
WhiteRoane
Fentress
Warren
Bedford
Carter
Hawkins
Davidson
Haywood
Cumberland
Rutherford
Sullivan
Smith
OvertonCampbell
Putnam
Williamson
McMinn
Lewis
Grundy
Humphreys
RobertsonClaiborne
Henderson
DeKalb
MaconMontgomery
JacksonUnion
JeffersonBenton
Bledsoe
Lauderdale
Decatur
Lake
Bradley
Marshall
Johnson
Chester
Anderson
Meigs
Grainger
LoudonCannon
Unicoi
Crockett
Cheatham Washington
PickettHancock
Houston
Van Buren
Sequatchie
Hamblen
Moore
Trousdale
KY
ALGA
IL
MS
SC
NC
IN
MO
WV
VA
AR
OH
±0 100 20050 Miles
Female Population by County, 2010
2,528 ‐ 50,000
50,001 ‐ 100,000
100,001 ‐ 150,000
150,001 ‐ 250,000
> 250,000

13
Figure 6. Median Age of Females by County, 2010 Figure 7. Persons with Bachelor’s Degree or Higher by County, 2010
Figure 8. Person Per Household by County, 2010 Figure 9. Median Household Income by County, 2010
Source: U.S. Census Bureau, 2010
state. The counties most closely matching the socio‐demographics for the “targeted consumer” profile
are shown in Figure 10. For this study, a small household size is assumed to positively influence
preferences for meat attribute products. Davidson County matches all five of the socio‐demographics
characterized for the “targeted consumer”, whereas Shelby, Hamilton, and Knox Counties match four of
the five socio‐demographics characterized.
GilesShelby
Dyer
Scott
Knox
Wayne
Polk
Sevier
Henry
Fayette
Obion
Maury
CarrollGibson
Hardin
Greene
Blount
Wilson
Monroe
Lincoln
Cocke
Perry
Sumner
Hickman
MarionFranklin
Tipton
Weakley
Rhea
Morgan
Coffee
Stewart
LawrenceMcNairy
Madison
Clay
Hamilton
Dickson
Hardeman
WhiteRoane
Fentress
Warren
Bedford
Carter
Hawkins
Davidson
Haywood
Cumberland
Rutherford
Sullivan
Smith
OvertonCampbell
Putnam
Williamson
McMinn
Lewis
Grundy
Humphreys
RobertsonClaiborne
Henderson
DeKalb
MaconMontgomery
JacksonUnion
JeffersonBenton
Bledsoe
Lauderdale
Decatur
Lake
Bradley
Marshall
Johnson
Chester
Anderson
Meigs
Grainger
LoudonCannon
Unicoi
Crockett
Cheatham Washington
PickettHancock
Houston
Van Buren
Sequatchie
Hamblen
Moore
Trousdale
KY
ALGA
IL
MS
SC
NC
IN
MO
WV
VA
AR
OH
±0 100 20050 Miles
Median Age of Females by County, 2010
31.1 ‐ 35.0
35.1 ‐ 38.0
38.1 ‐ 41.0
41.1 ‐ 43.7
GilesShelby
Dyer
Scott
Knox
Wayne
Polk
Sevier
Henry
Fayette
Obion
Maury
CarrollGibson
Hardin
Greene
Blount
Wilson
Monroe
Lincoln
Cocke
Perry
Sumner
Hickman
MarionFranklin
Tipton
Weakley
Rhea
Morgan
Coffee
Stewart
LawrenceMcNairy
Madison
Clay
Hamilton
Dickson
Hardeman
WhiteRoane
Fentress
Warren
Bedford
Carter
Hawkins
Davidson
Haywood
Cumberland
Rutherford
Sullivan
Smith
OvertonCampbell
Putnam
Williamson
McMinn
Lewis
Grundy
Humphreys
RobertsonClaiborne
Henderson
DeKalb
MaconMontgomery
JacksonUnion
JeffersonBenton
Bledsoe
Lauderdale
Decatur
Lake
Bradley
Marshall
Johnson
Chester
Anderson
Meigs
Grainger
LoudonCannon
Unicoi
Crockett
Cheatham Washington
PickettHancock
Houston
Van Buren
Sequatchie
Hamblen
Moore
Trousdale
KY
ALGA
IL
MS
SC
NC
IN
MO
WV
VA
AR
OH
±0 100 20050 Miles
Bachelor's Degree or Higher, 2010(%)
5.2 ‐ 10.0
10.1 ‐ 20.0
20.1 ‐ 30.0
30.1 ‐ 40.0
40.1 ‐ 51.8
GilesShelby
Dyer
Scott
Knox
Wayne
Polk
Sevier
Henry
Fayette
Obion
Maury
CarrollGibson
Hardin
Greene
Blount
Wilson
Monroe
Lincoln
Cocke
Perry
Sumner
Hickman
MarionFranklin
Tipton
Weakley
Rhea
Morgan
Coffee
Stewart
LawrenceMcNairy
Madison
Clay
Hamilton
Dickson
Hardeman
WhiteRoane
Fentress
Warren
Bedford
Carter
Hawkins
Davidson
Haywood
Cumberland
Rutherford
Sullivan
Smith
OvertonCampbell
Putnam
Williamson
McMinn
Lewis
Grundy
Humphreys
RobertsonClaiborne
Henderson
DeKalb
MaconMontgomery
JacksonUnion
JeffersonBenton
Bledsoe
Lauderdale
Decatur
Lake
Bradley
Marshall
Johnson
Chester
Anderson
Meigs
Grainger
LoudonCannon
Unicoi
Crockett
Cheatham Washington
PickettHancock
Houston
Van Buren
Sequatchie
Hamblen
Moore
Trousdale
KY
ALGA
IL
MS
SC
NC
IN
MO
WV
VA
AR
OH
±0 100 20050 Miles
Person's Per Household, 2010
2.1 ‐ 2.4
2.5 ‐ 2.6
2.7 ‐ 2.8
GilesShelby
Dyer
Scott
Knox
Wayne
Polk
Sevier
Henry
Fayette
Obion
Maury
CarrollGibson
Hardin
Greene
Blount
Wilson
Monroe
Lincoln
Cocke
Perry
Sumner
Hickman
MarionFranklin
Tipton
Weakley
Rhea
Morgan
Coffee
Stewart
LawrenceMcNairy
Madison
Clay
Hamilton
Dickson
Hardeman
WhiteRoane
Fentress
Warren
Bedford
Carter
Hawkins
Davidson
Haywood
Cumberland
Rutherford
Sullivan
Smith
OvertonCampbell
Putnam
Williamson
McMinn
Lewis
Grundy
Humphreys
RobertsonClaiborne
Henderson
DeKalb
MaconMontgomery
JacksonUnion
JeffersonBenton
Bledsoe
Lauderdale
Decatur
Lake
Bradley
Marshall
Johnson
Chester
Anderson
Meigs
Grainger
LoudonCannon
Unicoi
Crockett
Cheatham Washington
PickettHancock
Houston
Van Buren
Sequatchie
Hamblen
Moore
Trousdale
KY
ALGA
IL
MS
SC
NC
IN
MO
WV
VA
AR
OH
±0 100 20050 Miles
Median Household Income, 2010
$23,125 ‐ $35,000
$35,001 ‐ $45,000
$45,001 ‐ $55,000
> $55,000

14
Figure 10. Counties Matching the “Targeted Consumer” Profile Socio‐Demographics, 2010
Tennessee USDA Meat Slaughtering Facilities
Should producers desire to increase direct and local sales of meat products by focusing on
consumers’ demand for differentiated meat product attributes, a discussion of meat slaughtering
facilities in the state is warranted. Using USDA’s Food Safety and Inspection Service (FSIS) database, the
locations of slaughtering/processing facilities contacted in Tennessee are revealed in Figure 11. In
addition to slaughtering meat for resale, some of the facilities shown on the map may also slaughter for
personal use (custom). In May 2012, facility representatives were telephoned to verify they were
indeed a USDA inspected slaughtering facility, what kinds of livestock the facility was USDA approved to
slaughter, and quantities of livestock slaughtered. These same questions were asked if the facility
provided custom slaughtering too. Also asked was if the facility slaughtered for individual producers
interested in marketing their own meat products (Table 2). Of the original 31 facilities that offer USDA
slaughter/processing services, 19 responded to the telephone survey (5 no longer slaughtered any
GilesShelby
Dyer
Scott
Knox
Wayne
Polk
Sevier
Henry
Fayette
Obion
Maury
CarrollGibson
Hardin
Greene
Blount
Wilson
Monroe
Lincoln
Cocke
Perry
Sumner
Hickman
MarionFranklin
Tipton
Weakley
Rhea
Morgan
Coffee
Stewart
LawrenceMcNairy
Madison
Clay
Hamilton
Dickson
Hardeman
WhiteRoane
Fentress
Warren
Bedford
Carter
Hawkins
Davidson
Haywood
Cumberland
Rutherford
Sullivan
Smith
OvertonCampbell
Putnam
Williamson
McMinn
Lewis
Grundy
Humphreys
RobertsonClaiborne
Henderson
DeKalb
MaconMontgomery
JacksonUnion
JeffersonBenton
Bledsoe
Lauderdale
Decatur
Lake
Bradley
Marshall
Johnson
Chester
Anderson
Meigs
Grainger
LoudonCannon
Unicoi
Crockett
Cheatham Washington
PickettHancock
Houston
Van Buren
Sequatchie
Hamblen
Moore
Trousdale
KY
ALGA
IL
MS
SC
NC
IN
MO
WV
VA
AR
OH
±0 100 20050 Miles
Targeted Consumer ProfileSocio‐Demographics Match
None
1
2
3
4
5
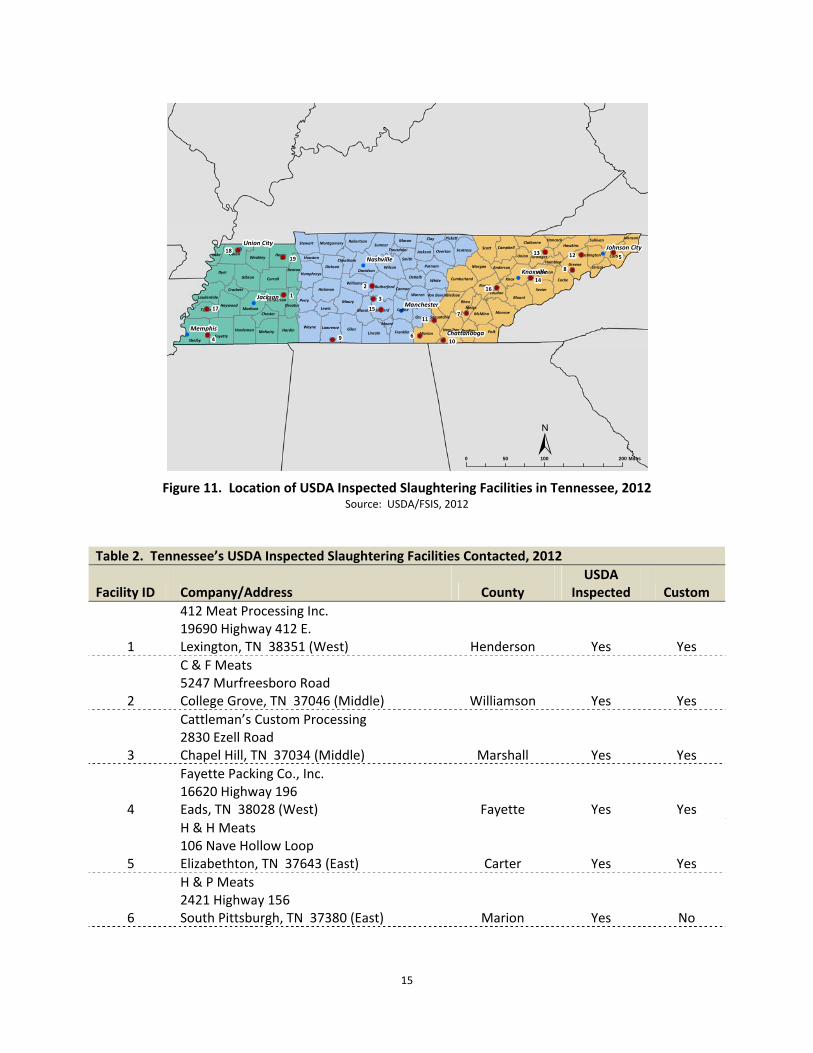
15
Figure 11. Location of USDA Inspected Slaughtering Facilities in Tennessee, 2012 Source: USDA/FSIS, 2012
Table 2. Tennessee’s USDA Inspected Slaughtering Facilities Contacted, 2012
Facility ID Company/Address County USDA
Inspected Custom
1
412 Meat Processing Inc. 19690 Highway 412 E. Lexington, TN 38351 (West) Henderson Yes Yes
2
C & F Meats 5247 Murfreesboro Road College Grove, TN 37046 (Middle) Williamson Yes Yes
3
Cattleman’s Custom Processing 2830 Ezell Road Chapel Hill, TN 37034 (Middle) Marshall Yes Yes
4
Fayette Packing Co., Inc. 16620 Highway 196 Eads, TN 38028 (West) Fayette Yes Yes
5
H & H Meats 106 Nave Hollow Loop Elizabethton, TN 37643 (East) Carter Yes Yes
6
H & P Meats 2421 Highway 156 South Pittsburgh, TN 37380 (East) Marion Yes No
!
!
!
!
!
!
!!Memphis
Jackson
Nashville
Knoxville
Manchester
Union City
Chattanooga
Johnson City
Giles
Shelby
Dyer
Scott
Knox
WaynePolk
Sevier
HenryObion
Fayette
Maury
CarrollGibson
Greene
Blount
Hardin
Wilson
Monroe
Lincoln
Cocke
Perry
Sumner
Hickman
MarionFranklin
Tipton
Weakley
Rhea
Coffee
Morgan
Lawrence
Stewart
McNairy
Madison
Dickson
White
HamiltonHardeman
Roane
Clay
Fentress
Bedford
Warren
Carter
Hawkins
Davidson
Haywood
Cumberland
Rutherford
Sullivan
Smith
OvertonCampbell
Bledsoe
Williamson
Putnam
McMinnLewis
Grundy
Robertson
Humphreys
Claiborne
Henderson
DeKalb
Macon
Lauderdale
Bradley
Montgomery
JacksonUnion
Chester
JeffersonBenton
Decatur
Lake
Marshall
Johnson
Anderson
Meigs
Grainger
LoudonCannon
Unicoi
Crockett
CheathamWashington
Pickett Hancock
Houston
Van Buren
Sequatchie
Hamblen
Moore
Trousdale
±0 100 20050 Miles
1
2
3
4
5
6
7
8
910
11
1213
14
15
16
17
18
19

16
Table 2. Tennessee’s USDA Inspected Slaughtering Facilities Contacted, 2012
Facility ID Company/Address County USDA
Inspected Custom
7
Hampton Meat Processing 216 Breeden Drive Decatur, TN 37322 (East) Meigs Yes Yes
8
Harris Country Meats 480 Twin Barnes Road Greenville, TN 37743 (East) Greene Yes Yes
9
J.C. Peters & Sons 953 Lexington Highway Loretto, TN 38469 (Middle) Lawrence Yes Yes
10
Pilgrim’s Pride Corporation 414 W. 16th Street Chattanooga, TN 37408 (East) Hamilton Yes No
11
R & D Custom Slaughtering 27015 US 127 Dunlap, TN 37327 (East) Sequatchie Yes Yes
12
Snapps Ferry Packing Co. 5900 East Andrew Johnson Hwy. Afton, TN 37616 (East) Greene Yes Yes
13
Southeastern Provision LLC 1617 Helton Road Bean Station, TN 37708 (East) Grainger Yes No
14
Swaggerty Sausage Co., Inc. 2827 Swaggerty Road Kodak, TN 37764 (East) Sevier Yes No
15
Tyson Foods Inc. 901 W. Jackson Shelbyville, TN 37160 (Middle) Bedford Yes No
16
Wamplers Farm Sausage 781 Highway 70 W Lenoir City, TN 37771 (East) Loudon Yes No
17
Wells Processing Plant 711 East Woodlawn Ave. Brighton, TN 38011 (West) Tipton Yes No
18
Williams Sausage Co., Inc. 5132 Old Troy Hickman Rd. Union City, TN 38261 (West) Obion Yes No
19
Yoder Brothers Meat Processing 1650 Briarpatch Rd. Paris, TN 38242 (West) Henry Yes Yes
Source: USDA/FSIS, 2012
animals; 7 could not be contacted). Ten of the facilities contacted were located in East Tennessee, four
in Middle Tennessee, and five in West Tennessee.

17
For USDA inspected slaughters from the telephone survey, poultry was the largest number of
animals slaughtered at 123.5 million followed by hogs (235,492), goats (48,583), cattle (43,924), sheep
(21,544), and other (deer, bison, beefalo, and elk) (11) (Table 3). For custom slaughtering, the greatest
number of animals slaughtered was cattle (5,595), hogs (3,650), other (606), sheep (96), and goats (78).
USDA inspected slaughter facilities in the East Region slaughtered greater numbers of cattle (41,760)
and hogs (165,880) compared to the other two regions in the state. Poultry slaughtered numbers (62.4
million) was greatest in the Middle Region, followed by the East Region (61.1 million). Goat (42,824)
and sheep (19,460) slaughtered numbers were greater in the West Region. Ten of the 19 facilities
contacted slaughter for individual producers (a total of 92 producers across the state) that plan to
market their own meat products. Approximately 52 of these producers were located in the East Region
of the state, 14 in the Middle Region, and 26 in the Western.
Table 3. Number and Types of Animals Slaughtered by Region by Tennessee’s USDA Inspected Facilities Contacted, 2012.
Animal Types and Number Slaughtered*Region Cattle Hogs Goats Sheep Poultry Other**
East 41,760 2,933 165,880 1,534 4,717 24 1,042 40 61,100,000 0 3 603Middle 458 876 2,612 1,292 1,042 49 1,042 51 62,400,000 0 8 3West 1,706 1,786 67,000 824 42,824 5 19,460 5 7,800 0 0 0
Total 43,924 5,595 235,492 3,650 48,583 78 21,544 96 123,507,800 0 11 606Average 3,379 509 15,699 332 4,417 10 1,959 12 41,169,267 0 5.5 151.5
*Highlighted values are for USDA inspected slaughtering/processing; non‐highlighted values are for custom exempt **Other‐deer, bison, beefalo, and elk Source: USDA/FSIS, 2012
Lack of available slaughtering facilities, existing slaughter facilities not operating at capacity, and
length of time waiting for services are just a few of the issues producers face when it comes to meat
slaughtering and processing. Some states have investigated the feasibility of an USDA inspected mobile
slaughtering unit to circumvent some of these issues but the expense and volume of animals required to
justify investing and operating the mobile unit needs careful evaluation (Gardner, 2009; Yorgey, 2008).
18
Direct‐to‐Consumer Sales
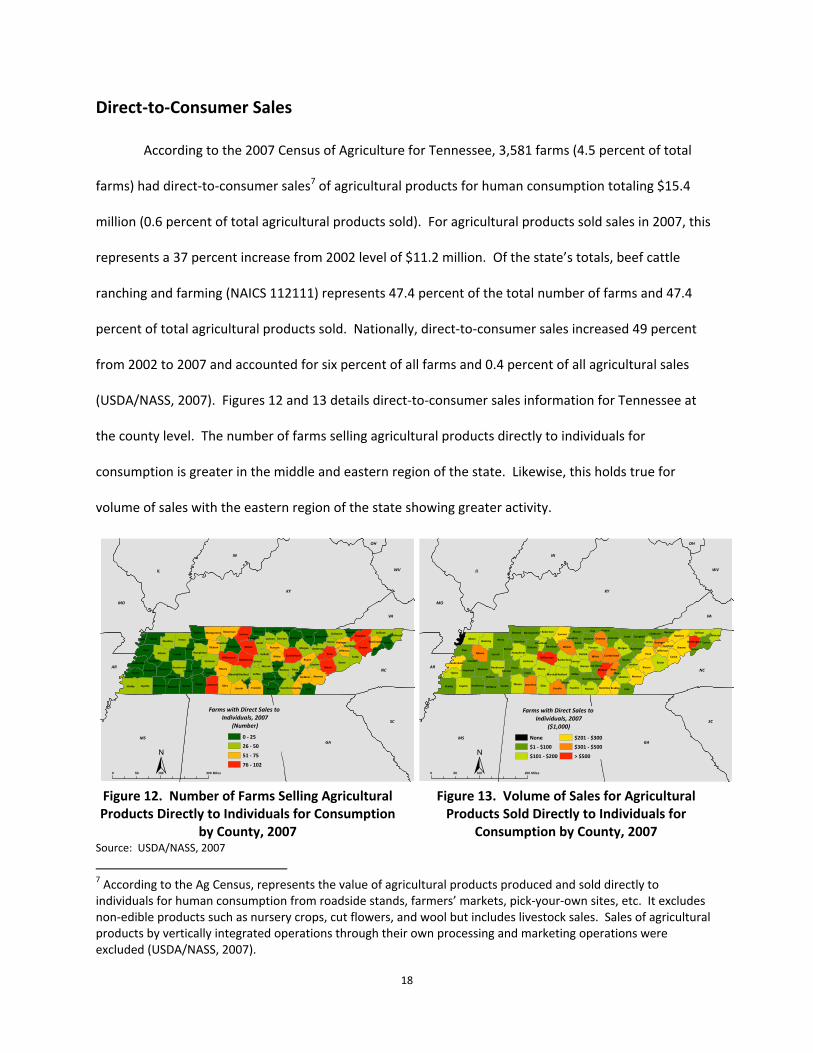
According to the 2007 Census of Agriculture for Tennessee, 3,581 farms (4.5 percent of total
farms) had direct‐to‐consumer sales7 of agricultural products for human consumption totaling $15.4
million (0.6 percent of total agricultural products sold). For agricultural products sold sales in 2007, this
represents a 37 percent increase from 2002 level of $11.2 million. Of the state’s totals, beef cattle
ranching and farming (NAICS 112111) represents 47.4 percent of the total number of farms and 47.4
percent of total agricultural products sold. Nationally, direct‐to‐consumer sales increased 49 percent
from 2002 to 2007 and accounted for six percent of all farms and 0.4 percent of all agricultural sales
(USDA/NASS, 2007). Figures 12 and 13 details direct‐to‐consumer sales information for Tennessee at
the county level. The number of farms selling agricultural products directly to individuals for
consumption is greater in the middle and eastern region of the state. Likewise, this holds true for
volume of sales with the eastern region of the state showing greater activity.
Figure 12. Number of Farms Selling Agricultural Products Directly to Individuals for Consumption
by County, 2007
Figure 13. Volume of Sales for Agricultural Products Sold Directly to Individuals for
Consumption by County, 2007 Source: USDA/NASS, 2007
7 According to the Ag Census, represents the value of agricultural products produced and sold directly to individuals for human consumption from roadside stands, farmers’ markets, pick‐your‐own sites, etc. It excludes non‐edible products such as nursery crops, cut flowers, and wool but includes livestock sales. Sales of agricultural products by vertically integrated operations through their own processing and marketing operations were excluded (USDA/NASS, 2007).
GilesShelby
Dyer
Scott
Knox
Wayne
Polk
Sevier
Henry
Fayette
Obion
Maury
CarrollGibson
Hardin
Greene
Blount
Wilson
Monroe
Lincoln
Cocke
Perry
Sumner
Hickman
MarionFranklin
Tipton
Weakley
Rhea
Morgan
Coffee
Stewart
LawrenceMcNairy
Madison
Clay
Hamilton
Dickson
Hardeman
WhiteRoane
Fentress
Warren
Bedford
Carter
Hawkins
Davidson
Haywood
Cumberland
Rutherford
Sullivan
Smith
OvertonCampbell
Putnam
Williamson
McMinn
Lewis
Grundy
Humphreys
RobertsonClaiborne
Henderson
DeKalb
MaconMontgomery
JacksonUnion
JeffersonBenton
Bledsoe
Lauderdale
Decatur
Lake
Bradley
Marshall
Johnson
Chester
Anderson
Meigs
Grainger
LoudonCannon
Unicoi
Crockett
Cheatham Washington
PickettHancock
Houston
Van Buren
Sequatchie
Hamblen
Moore
Trousdale
KY
ALGA
IL
MS
SC
NC
IN
MO
WV
VA
AR
OH
±0 100 20050 Miles
Farms with Direct Sales to Individuals, 2007
(Number)
0 ‐ 25
26 ‐ 50
51 ‐ 75
76 ‐ 102
GilesShelby
Dyer
Scott
Knox
Wayne
Polk
Sevier
Henry
Fayette
Obion
Maury
CarrollGibson
Hardin
Greene
Blount
Wilson
Monroe
Lincoln
Cocke
Perry
Sumner
Hickman
MarionFranklin
Tipton
Weakley
Rhea
Morgan
Coffee
Stewart
LawrenceMcNairy
Madison
Clay
Hamilton
Dickson
Hardeman
WhiteRoane
Fentress
Warren
Bedford
Carter
Hawkins
Davidson
Haywood
Cumberland
Rutherford
Sullivan
Smith
OvertonCampbell
Putnam
Williamson
McMinn
Lewis
Grundy
Humphreys
RobertsonClaiborne
Henderson
DeKalb
MaconMontgomery
JacksonUnion
JeffersonBenton
Bledsoe
Lauderdale
Decatur
Lake
Bradley
Marshall
Johnson
Chester
Anderson
Meigs
Grainger
LoudonCannon
Unicoi
Crockett
Cheatham Washington
PickettHancock
Houston
Van Buren
Sequatchie
Hamblen
Moore
Trousdale
KY
ALGA
IL
MS
SC
NC
IN
MO
WV
VA
AR
OH
±0 100 20050 Miles
Farms with Direct Sales to Individuals, 2007
($1,000)
None
$1 ‐ $100
$101 ‐ $200
$201 ‐ $300
$301 ‐ $500
> $500

19
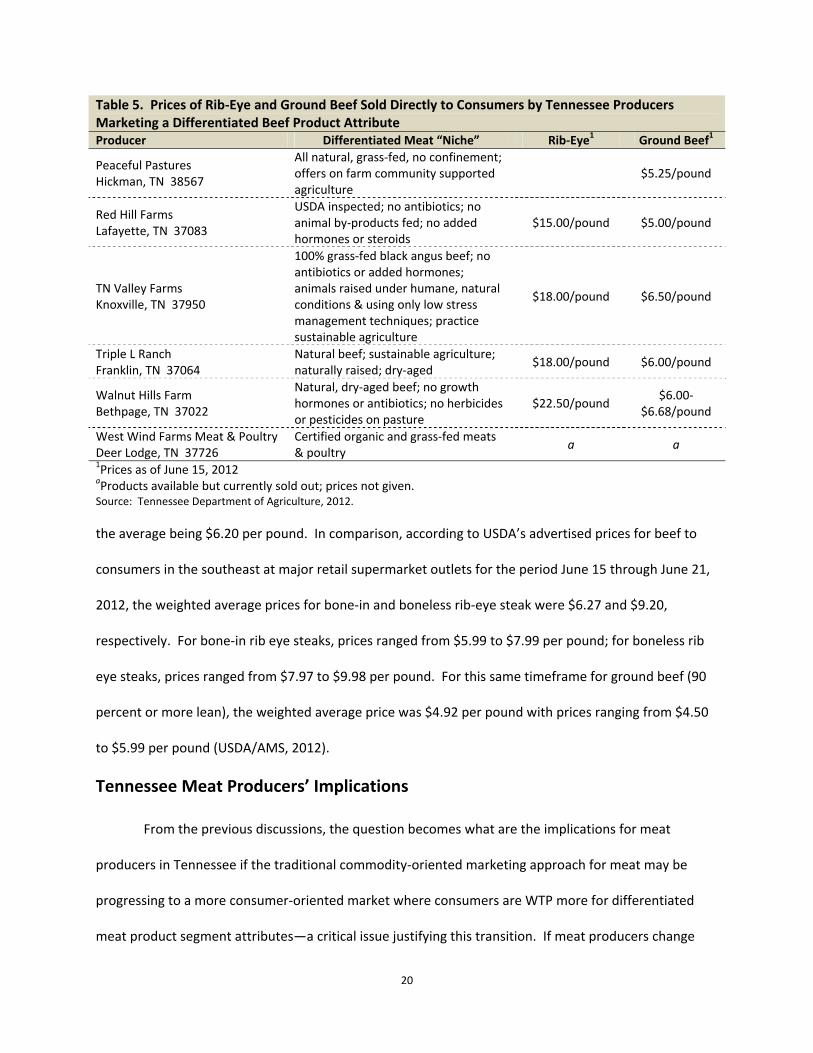
Based on beef margin values presented in Table 4, from 2006 to 2011 the average wholesale to
retail price spread was 194.1 cents per pound. For those producers involved in direct‐to‐consumer
sales, this price spread margin would potentially shift to their operations. Table 5 lists the names of
Tennessee producers with working internet links selling a differentiated beef attribute product directly
to consumers as of June 15, 2012. Rib‐eye steak and ground beef were two representative meat
products chosen. For rib‐ eye steak, prices ranged from $10.99 to $22.50 per pound with the average
being $17.36 per pound. Likewise, for ground beef, prices ranged from $5.00 to $9.60 per pound with
Table 4. Annual Averages of Choice Beef Values
Year Retail Value Wholesale Value Gross Farm Value Wholesale to Retail Price Spread
Cents Per Pound of Retail Equivalent 2006 397.0 228.0 206.6 169.0 2007 415.8 231.0 222.6 184.8 2008 432.5 234.7 223.2 197.8 2009 426.0 217.2 200.4 208.8 2010 439.5 241.1 230.8 197.4 2011 482.7 275.7 274.8 207.0
Source: USDA/ERS, 2012 Table 5. Prices of Rib‐Eye and Ground Beef Sold Directly to Consumers by Tennessee Producers Marketing a Differentiated Beef Product Attribute Producer Differentiated Meat “Niche” Rib‐Eye1 Ground Beef1
Baggett Family Farm Clarksville, TN 37043
Producer & seller of grass‐fed beef $14.00/12 ounces $6.00/pound
Circle J Ranch Indian Mound, TN 37079
Pasture/hay feed & receive 30‐60 days of grain feed prior to processing
$10.99/pound $5.99/pound
Circle T Farm Columbia, TN 38401
No added hormones; natural feed; pasture raised
$16.00/pound $6.00/pound
Gourmet Pasture Beef, LLC Springfield, TN 37172
TN grown grass‐fed beef; dry‐aged, $14.99/12 ounces $5.99/pound
Homestead Beef Sale Creek, TN 37373
TN grown Limousin beef; animals born/raised on farm; no antibiotics or added hormones; all natural; pasture raised & vegetarian fed; USDA processed
$21.60/pound $9.60/pound
KLD Farm LLC Ashland City, TN 37015
Local farm raised all natural angus beef; grass‐fed & grain finished; no antibiotics or growth hormones; USDA inspected retail cuts; minimally processed & dry‐aged
$17.00/pound $6.25/pound
Meadow Branch Beef Morrison, TN 37357
Grass‐fed, all natural, locally grown; dry‐aged; raised without growth hormones or antibiotics
$11.90/.80‐.89 pound
$5.50/pound
20
Table 5. Prices of Rib‐Eye and Ground Beef Sold Directly to Consumers by Tennessee Producers Marketing a Differentiated Beef Product Attribute Producer Differentiated Meat “Niche” Rib‐Eye1 Ground Beef1
Peaceful Pastures Hickman, TN 38567
All natural, grass‐fed, no confinement; offers on farm community supported agriculture
$5.25/pound
Red Hill Farms Lafayette, TN 37083
USDA inspected; no antibiotics; no animal by‐products fed; no added hormones or steroids
$15.00/pound $5.00/pound
TN Valley Farms Knoxville, TN 37950
100% grass‐fed black angus beef; no antibiotics or added hormones; animals raised under humane, natural conditions & using only low stress management techniques; practice sustainable agriculture
$18.00/pound $6.50/pound
Triple L Ranch Franklin, TN 37064
Natural beef; sustainable agriculture; naturally raised; dry‐aged
$18.00/pound $6.00/pound
Walnut Hills Farm Bethpage, TN 37022
Natural, dry‐aged beef; no growth hormones or antibiotics; no herbicides or pesticides on pasture
$22.50/pound $6.00‐
$6.68/pound
West Wind Farms Meat & Poultry Deer Lodge, TN 37726
Certified organic and grass‐fed meats & poultry
a a
1Prices as of June 15, 2012 aProducts available but currently sold out; prices not given. Source: Tennessee Department of Agriculture, 2012.
the average being $6.20 per pound. In comparison, according to USDA’s advertised prices for beef to
consumers in the southeast at major retail supermarket outlets for the period June 15 through June 21,
2012, the weighted average prices for bone‐in and boneless rib‐eye steak were $6.27 and $9.20,
respectively. For bone‐in rib eye steaks, prices ranged from $5.99 to $7.99 per pound; for boneless rib
eye steaks, prices ranged from $7.97 to $9.98 per pound. For this same timeframe for ground beef (90
percent or more lean), the weighted average price was $4.92 per pound with prices ranging from $4.50
to $5.99 per pound (USDA/AMS, 2012).
Tennessee Meat Producers’ Implications
From the previous discussions, the question becomes what are the implications for meat
producers in Tennessee if the traditional commodity‐oriented marketing approach for meat may be
progressing to a more consumer‐oriented market where consumers are WTP more for differentiated
meat product segment attributes—a critical issue justifying this transition. If meat producers change
21
current production methods to a single or a bundle of these following attributes – grass‐fed,
environmentally friendly, organic, hormone and antibiotics free, traceable, branded, locally produced,
natural, or humanely treated – they need to address what production techniques do they have to
control to achieve this objective (e.g., genetics (favor a trait that reduces per unit production costs or
promotes per unit production revenue), breed choices, feed ingredients, and/or traceability)? If an
economic incentive exists, for example, for the elimination of growth hormones or antibiotics, or for
adopting a more labor intensive farming system that adopts one or a bundle of these meat production
attributes, then changing production methods may be justified (Boland and Schroder, 2000).
Based on the willingness‐to‐pay studies reviewed in this analysis, the “targeted consumer”
profile appears to be individuals who are young, female, educated, have high incomes, and have small
household sizes. Based on these socio‐demographics, Davidson County and the surrounding middle
Tennessee counties of Maury, Robertson, Rutherford, Williamson, and Wilson, plus the east Tennessee
counties Anderson, Blount, and Knox, have market “niches” for this consumer profile type willing‐to‐pay
a premium for differentiated beef product segments. Depending on the type and how the differentiated
beef product segment was marketed in the studies reviewed, for those consumers’ willing‐to‐pay a
premium, the premiums ranged from $1.00 to $2.56 per pound more. For Tennessee producers’, the
question becomes whether the premium is large enough and/or sustainable over a period of time to
justify transitioning and/or diversifying from traditional beef production methods to production
methods that embraces a differentiated beef product attribute or a bundle of attributes.

22
References
Abidoye, B.O., H. Bulut, J.D. Lawrence, B. Mennecke, and A.M. Townsend. 2011. “U.S. Consumers’ Valuation of Quality Attributes in Beef Products.” Journal of Agricultural and Applied Economics 43(1):1‐12.
Allen, J. 2002. “Retail’s View.” Beef, February 15. Available at http://beefmagazine.com/mag/ beef_retails_view.
Boland, M., and T. Schroder. 2000. “Marginal Value of Quality Attributes for Natural (Organic) Beef. Paper presented at the Western Agricultural Economics Association Annual Meetings, Vancouver, British Columbia, June 29‐July 1.
Bruch, M.L. 2010. “List of Custom Meat Processing Facilities in Tennessee.” Center for Profitable Agriculture, The University of Tennessee, CPA Info #171. Available at http://cpa.utk.edu/ pdffiles/cpa171.pdf.
Campiche, J., R.B. Holcomb, and C.E. Ward. 2004. “Impacts of Consumer Characteristics and Perceptions on Willingness to Pay for Natural Beef in the Southern Plains.” Food and Agricultural Products Research and Technology Center, Oklahoma Agricultural Experiment Station, Oklahoma State University, Stillwater, Oklahoma.
Carlberg, J.G., E. Froehlich, and C.E. Ward. “Willingness‐to‐Pay for Branded Fresh Beef Products in Canada.” Report Submitted to Canfax Research Services Administrator of the Improving Alignment of the Supply Chain Component of the National Beef Industry Development Fund, March, 2007.
Chang, K.L., K. Underwood, G. Langelett, and P. Xu. 2012. “Consumer’s Willingness To Pay For Locally Produced Ground Beef: A Case Study.” Department of Economics, South Dakota State University, Brookings, South Dakota.
Dalton, A., R. Holland, and S. Hubbs. 2003. “A Review of USDA‐Inspected Livestock Slaughtering Facilities in Tennessee.” Center for Profitable Agriculture, The University of Tennessee, PB1727. Available at https://utextension.tennessee.edu/publications/Documents/PB1727.pdf.
Dunlap, A., G. Benson, and M. Poore. 2008. “Farm to Fork: A Direct‐to‐the‐Consumer Beef Marketing Handbook.” North Carolina State University, A&T State University Cooperative Extension, NC State University. Available at http://www.ncsu.edu/fvsi/beefhandbook/docs/NCSU‐BeefHandbook‐0510.pdf.
Evans, J.R. “Determining Consumer Perceptions of and Willingness to Pay for Appalachian Grass‐fed Beef: An Experimental Economics Approach.” Ph.D. dissertation, West Virginia University, Morgantown, 2007.
Fields, D., J.W. Prevatt, J. Lusk, and C.R. Kerth. 2006. “Forage‐Fed Beef Attributes: Customer Preferences and Willingness‐To‐Pay.” Alabama Agricultural Experiment Station, Auburn University, Auburn, Alabama.
Franken, J.R., J.L. Parcell, and G.T. Tonsor. 2011. “Consumers’ Willingness‐to‐Pay for Retail Branded Beef Products with Bundled Attributes.” Paper presented at the Agricultural & Applied Economics Association’s 2011 AAEA & NAREA Joint Annual Meeting, Pittsburgh, Pennsylvania, July 24‐26.

23
Gardner, J. 2009. “So You Want to Process Meat?” Oregon Department of Agriculture. Available at http://www.oregonrural.org/files/Small%20scale%20meat.pdf
Grannis, J., and D.D. Thilmany. 2002. “Marketing Natural Pork: An Empirical Analysis of Consumers in the Mountain Region.” Agribusiness 18(4):475‐489.
Greene, C., C. Dimitri, B.H. Lin, W. McBride, L. Oberholtzer, and T. Smith. 2009. Emerging Issues in the U.S. Organic Industry. Washington, DC: U.S. Department of Agriculture, Economic Research Service, Economic Information Bulletin Number 55.
IDcide‐Local Information Data Server. 2010. “Tennessee Profile.” Available at http://www.idcide.com/ citydata/tn/index.htm.
Lardy, G. 1998. “Systems for Backgrounding Beef Cattle.” Department of Animal Science, North Dakota State University. Available at http://www.ag.ndsu.edu/pubs/ansci/beef/as1151w.htm.
McCluskey, J.J., T.I. Wahl, Q. Li, and P.R. Wandschneider. 2005. “U.S. Grass‐Fed Beef: Marketing Health Benefits.” Journal of Food Distribution Research 36(3):1‐8.
McKinley, B., J. Parish, R. Watson, J. Anderson, T. Engelken, and B. White. 2004. “Stocker Production in Mississippi.” Department of Animal and Dairy Sciences, Mississippi State University, Cattle Business in Mississippi, “Stocker Cents” article, August. Available at http://www.msucares.com/ livestock/beef/stocker_aug2004.pdf.
Minnesota IMPLAN Group, Inc. IMPLAN System (2010 data and software), 502 2nd Street, Suite 301, Hudson, WI 54016. Available at http://www.implan.com.
National Cattlemen’s Beef Association. 2012. Beef Industry Statistics, Industry Statistics as of March 2012, Average Annual Per Capita Expenditures for Meat. Available at http://www.beefusa.org/ beefindustrystatistics.aspx.
National Cattlemen’s Beef Association. 2012. “Branded Beef.” Available at http://www.wybeef.com/ CMDocs/Wyoming/BrandedBeefFactSheet.pdf.
Neel, J.B. 2010. “Tennessee’s Cattle Industry.” Department of Animal Science, Institute of Agriculture, The University of Tennessee. Available at http://animalscience.ag.utk.edu/Beef/ TNCattleIndustry.html.
Ollinger, M., D. Moore, and R. Chandran. 2004. Meat and Poultry Plants’ Food Safety Investment. Washington, DC: United States Department of Agriculture, Economic Research Service, Technical bulletin Number 1911.
Painter, K. 2008. An Analysis of Food‐Chain Demand for Differentiated Farm Commodities: Implications for the Farm Sector. Washington, DC: U.S. Department of Agriculture, Rural Business and Cooperative Programs, Research Report 215.
Rauch, A., and J.S. Sharp. 2005. “Ohioans’ Attitude About Animal Welfare.” A Topical Report From the 2004 Ohio Survey of Food, Agricultural and Environmental Issues, Social Responsibility Initiative, Department of Human and Community Resource Development, The Ohio State University.
Sharp, J.S. 2008. “Summary Report: 2008 Ohio Survey of Food, Agriculture, and Environmental Issues.” Social Responsibility Initiative, Rural Sociology Program, The Ohio State University.
Tennessee Department of Agriculture. 2012. “Meats.” Pick Tennessee Products. Available at http:// www.picktnproducts.org/food/farm_meat.html.

24
Tennessee Department of Agriculture. 2010. “Tennessee Agriculture 2010.” Department Report & Statistical Summary. Available at http://www.tennessee.gov/agriculture/ publications/annualreport/annualreport.pdf.
Umberger, W.J., D.D. Thilmany McFadden, and A.R. Smith. 2009. “Does Altruism Play a Role in Determining U.S. Consumer Preferences and Willingness to Pay for Natural and Regionally Produced Beef?” Agribusiness 25(2):268‐285.
Umberger, W.J., D.M. Feuz, C.R. Calkins, and K. Killinger‐Mann. 2002. “U.S. Consumer Preference and Willingness‐to‐Pay for Domestic Corn‐Fed Beef Versus International Grass‐Fed Beef Measured Through an Experimental Auction.” Agribusiness 18(4):491‐504.
United States Census Bureau. 2010. “State & County QuickFacts.” Tennessee. Available at http:// quickfacts.census.gov/qfd/states/47000.html.
United States Department of Agriculture (USDA), Agricultural Marketing Service (AMS). 2012. “USDA Weekly Retail Beef Feature Activity.” Market News and Transportation Data. Available at http://www.ams.usda.gov/mnreports/lswbfrtl.pdf.
United States Department of Agriculture (USDA), Economic Research Service (ERS). 2012. “Beef Values and Price Spreads.” Data Sets, Meat Price Spreads. Available at http://www.ers.usda.gov/ Data/MeatPriceSpreads/.
United States Department of Agriculture (USDA), Economic Research Service (ERS). 2011. “Red Meat, Poultry, and Fish (Boneless Weight): Per Capita Availability.” Available at www.ers.usda.gov/data/ foodconsumption/spreadsheets/mtpcc.xls.
United States Department of Agriculture (USDA), Food Safety and Inspection Service (FSIS). 2012. Regulations & Policies, Meat, Poultry, & Egg Product Inspection Directory. Available at http://www.fsis.usda.gov/regulations/Meat_Poultry_Egg_Inspection_Directory/index.asp.
United States Department of Agriculture (USDA), National Agricultural Statistical Service (NASS). 2010. “Statistics of Cattle, Hogs, and Sheep.” Available at http://www.nass.usda.gov/Publications/ Ag_Statistics/2010/Chapter07.pdf.
United States Department of Agriculture (USDA), National Agricultural Statistical Service (NASS). 2011. “Cattle.” Available at http://usda01.library.cornell.edu/usda/nass/Catt/2010s/2011/Catt‐01‐28‐2011.pdf.
United States Department of Agriculture (USDA), National Agricultural Statistical Service (NASS). 2007. “Census of Agriculture.” Available at http://www.agcensus.usda.gov/Publications/2007/ Full_Report/Volume_1,_Chapter_2_County_Level/Tennessee/.
United States Department of Agriculture. 2012. “Know Your Farmer, Know Your Food.” Available at http://www.usda.gov/wps/portal/usda/usdahome?navid=KNOWYOURFARMER.
Wheatley, W.P. 2001. “Consumer Preferences, Premiums, and the Market for Natural and Organic Pork: Locating a Niche for Small‐scale Producers.” Department of Applied Economics, University of Minnesota, February.
Wong, J. “Willingness To Pay For Environmentally Friendly Beef in Georgia.” M.S. thesis, The University of Georgia, Athens, 2002.
Yorgey, G. 2008. “Local Meat for Local Meals: An Assessment of Demand for a Mobile Slaughtering Unit in Pierce, King, Kitsap and Thurston Counties, for the Puget Sound Meat Producers Cooperative. M.S. thesis, University of Washington, Seattle.