an investigation of shear design of a reinforced concrete
TRANSCRIPT

An Investigation of the Shear Design of a Reinforced Concrete Box Structure
Sasha Kuzmanovic
A thesis submitted in confomity with the requirements for the degree of Master of Applied Science Graduate Department of Civil Engineering
University of Toronto
O Copyright by Sasha Kurma,!ovic 1998

National Library ($1 of Canada Bibliothéque nationale du Canada
Acquisitions and Acquisitions et Bibliographie SeMces selvices bibliographiques
395 Wellington Street 395, rue Wellington Ottawa ON K I A ON4 ûttawaON K1AON4 Canada Canada
The author has granted a non- exclusive licence aiîowing the National Library of Canada to reproduce, loan, distribute or sell copies of this thesis in microform, paper or electronic formats.
The author retains ownership of the copyright in this thesis. Neither the thesis nor substantial extracts îrom it may be printed or othewise reproduced without the author's permission.
L'auteur a accordé une licence non exclusive permettant à la Bibliothèque nationale du Canada de reproduire, prêter, distribuer ou vendre des copies de cette thèse sous la forme de microfiche/61m, de reproduction sur papier ou sur format électronique.
L'auteur conserve la propriété du droit d'auteur qui protège cette thèse. Ni la thèse ni des extraits substantiels de celle-ci ne doivent être imprimés ou autrement reproduits sans son autorisation.

Abstract
An Investigation of the Shear Design of a Reinforced Concrete Box Structure
by
Sasha Kuzmanovic
M.ASc. 1998
Graduate Department of Civil Engineering
University of Toronto
Recent research has show that size effects reduce the shear strength of large beams with
no shear reinforcement and with low amounts of tlexural reinforcement. It was suspected that
these size effects rnay be important for the thick one-way slabs of the underground box structures
used in subway construction.
To investigote this hypothesis a 45% scale model of a slice of a 1
Commission box unit was subjected ro unifom loading.
The specimen failed in shear at only 55% of its flexural capacity. The fail
-oronto Transit
ure shear stress
of the JSMPa concrete was only 0.85MPa. Thus, it was found that the size effect in shear for this
one-way slab was very important. Also, it was proven that the AC1 Code expressions as well as
the AASHTO Culvert Method are unconservative for this case. OnIy. the shear design methods
of the CSA Code provided accurate estimates of shear capacity. Thus. the need for better shear
strength expressions was ernphasized. In the meantirne. it is recornmended that one-way slabs
with a thickness greater than 3OOmm should not be excluded frorn the provisions which require
minimum shear reinforcement if the shear stress exceeds one half of the shear strength.

Acknowledgements
The author of this thesis would like to express sincere gratitude to Professor M.P.Collins
for his invaluable guidance and for financial assistance throughout this research project. Thanks
must also be given to Professor F.J.Vechio for giving me an opponunity to use the TEMPEST
program.
Technical assistance during the experimental phase was greatly apprecirted, and special
thanks rnust be given to Renzo Basset, Mehmet Citak, John Buneo, Peter Heliopoulos, John
MacDonald. Allen McClenaghan and Ioel Babbin.
The author would also like to thank Danny Kuchma. Amr Helmy and Pawan Gupta for
their valuable advice and assistance. as well as Nick Kostecki and Oguzhan Bayrak for
contributing to the spirit of good will and humor. A note of thanks is also extended toward the
summer students who helped in the lab in accompIishing the experimental program.
Financial support from the University of Toronto was administered through the
Connaught Scholarsh ip and was greatly appreciated.
Finally. a special note of gratitude must be expressed to rny brother and my girlfriend for
their generous support and patience during the completion of this project.

Table of Contents
. . ....................................................................................................................................... Abstract ii
... Acknowledgemen ts ............................................................................................................ iii
Table of Contents .................................................................................................................. iv
. . List of Figures ....................................................................................................................... vil
. . List of Tables ........................................................................................................................ xii
... Notation ................................................................................................................................... xi11
1 Introduction 1 . I GENERAL ................................................................................................................ . . . . . . . 1
1.2 REASONS FOR INVESTIGATION ..................................................................................... 3
1.2.1 SIZE EFFECTS ............................................................................................................. 3
1.2.2 LOCATION OF THE CRITICAL SHEAR SECTION WHEN UNIFORM LOADING
IS APPLIED ........................................................................................................................... 5
1.3 HOW TO TEST THE BOX STRUCTURE? ....................................................................... 7
1 -4 CURRENT CODES ............................................................................................................... 8
1 . 4 1 ACI-95 Code ......................... .... ............................................................................... 8
1 .J.2 AASHTO-94 Code - Design for Shear in Slabs of Box Culverts ................................... 9
1.4.3 CSA-94 Code - Simplified Method 1 1.3 ......................................................................... 9
1-44 ASSHTO-94. CSA-94 . OHBDC-9 1-General Method .............. ... .......................... 10
2 Description o f Experimental Program 2.1 SPECIMEN GEOMETRY AND REINFORCEMENT LAYOUT ...................................... 1 1
. 2.1.1 SPECIMEN SIZE AND SHAf E ................................................................................. 1 1
2.1 2 REINFORCEMENT ...................................................................................................... 1 2
2.3 BUILDING OF SPECIMEN ................................................................................................ 18
2-3 MATERIAL PROPERTIES ............................ ..-,.... ......................................................... 28

2.3.1 CONCRETE .................................................................................................................. 28
2.3.2 STEEL ........................................................................................................................... 30
2.4 LOADING SCHEME ........................................................................................................... 30
2.5 INSTRUMENTATION ........................................................................................................ 34
2.5.1 REFERENCE SCHEME .......................................................................................... 36
2.5.2 LOAD CELLS ............................................................................................................... 36
2.5.3 STRAIN GAUGES .................. +... .................................................................................. 36
2.5.4 LVDTs ........................................................................................................................... 38
2.5.5 ZURICH TARGETS ..................................................................................................... 41
2.5.6 V I D E 0 AND 35mm CAMERAS .................................................................................. 41
3 Test Observations and Results 3.1 LOADING ............................................................................................................................ 43
3.2 TEST OBSERVATIONS ................................................................................................... 45
3.2.1 LOAD STAGE 1 ............................................................................................................ 45
3.2.2 LOAD STAGE I I ....................................................................................................... 46
3.2.3 LOAD STAGE I I I ......................................................................................................... 47
3.2.4 LOAD STAGE IV ......................................................................................................... 48
. 3-25 LOAD STAGE V ...................... ,. .............................................................................. 49
3.2.6 LOAD STAGE VI ......................................................................................................... 50
3.2.7 LOAD STAGE VI1 .. ................................................................................................... 5 1
3.2.8 ADDITIONAL REMARKS .......................................................................................... 51
4 Discussion of Test Results 4.1 COMPUTER MODELING BY TEMPEST ......................................................................... 96
4.1.1 MODEL ......................................................................................................................... 96
4.1.2 RESULTS ...................................................................................................................... 98
4.2 CODE PREDICTIONS .................................................................................................... 100
4.2.1 ACI-95 CODE .................... ........ .............................................................................. 102
4.2.2 AASHTO CODE .......................................................... 105
4.2.3 CSA-94 ............................................... .................................................................... 106
4.2.4 GENERAL METHOD (CSA-94 . ASSHTO-94 . OHBDC-9 1) ...................... .,.... 107
4-3 DISCUSSION OF TEST RESULTS ................................ .... ........................................... 114
4.4 COMPARISON OF TEST RESULTS AND CODE PREDICTIONS .............................. 119

5 Conclusions and Recommendations 5.1 CONCLUSIONS ................................................................................................................ 122
5.2 RECOMMEN DATIONS ........................ ,., ...................................................................... 124
.............................................................................................................................. References 126
Appendix A . Loading Assembly . Shop Drawings
Appendix B . Strain Gauge and LVDTs Data
Appendix C . TEMPEST Input Files

List of Tables
. ............................................................................................ Table 2.1 Reinforcing Steel Properties 31
. ......................... Table 4.1 General Method . Load Capacities at Different Sections in the Roof Slab I I I
. ....................... Table 4.2 General Method . Load Capacities at Different Sections in the lnvert Slab 113
Table 4.3 - Summary of Predicted Load Capacities of Specimen ....................................................... 120
vii

List of Figures
3 .............................................................................. Figure 1.1 . TTC Box Structure on the Spadina Line
3 Figure 1.2 . Cut and Cover Method ........................................................................................................ - Figure 1.3 - Shear Stress at Failure versus a/d (Adopted from Kani3) .................................................. 6
....................................... Figure I . 4 - Steps lnvolved in the Realization of the Exprimental Program 6
Figure 2.1 . Original TTC Box Unit .................................................................................................. 13
Figure 2.3 . Specimen Outline ............................................................................................................... 14
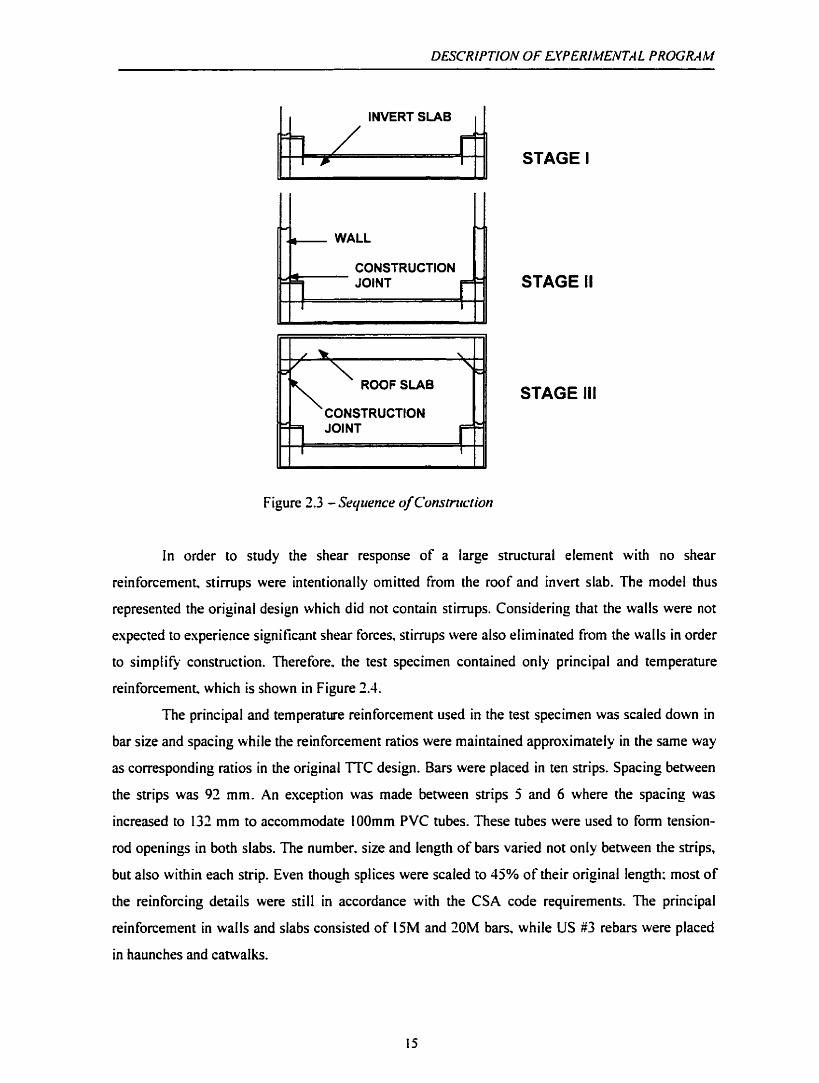
Figure 2.3 . Sequence of Construction .................................................................................................... 15
Figure 2.1 . Specimen Reinforcing Layout ....................................................................................... 16
Figure 2.5 . Reinfoming Cage - Looking South ..................................................................................... 20
Figure 2.6 . Rein forcing Cage - Looking West ................................................................................... 20
............................................ Figure 2.7 . Reinforcing Cage -Exterior Reinforcing Layer of Roof SIab 21
Figure 2.8 . Reinforcing Cage - Inttenor Reinforcing Layer of Roof Slab ........................................... I l
7 3 .............................................. Figure 2.9 . Reinforcing Cage -Exterior Rein forcing Layer of East Wall
39 ............................................ Figure 2-10 . Reinforcing Cage -Interior Reinforcing Layer of West Wall
Figure 2.1 1 . Reinforcing Cage -Roof/wall Connection at Top Corner ............................................... 23
Figure 2 . II . Reinforcing Cage 4 nvert Slab Adjacent to Catwalk .................................................. 23
Figure 2.13 . Formwork . Plan View ...................................................................................................... 21
Figure 2.14 . Formwork - Looking South .............................................................................................. 25
Figure 2.15 . Formwork . Looking West .......................................................................................... 25
Figure 2.16 . Formwork - East Wall ..................... ,. ............................................................................. 26
Figure 2.17 . Formwork - Northeast Corner . Note Steel Ties and PVC Tubes .................................. 76
Figure 2.18 . Casting of Specimen .......................................................................................................... 27
Figure 3.19 . Casting of Specimen . Vibration of Concrete- ........ ,.. ...... ... ..................................... 27
Figure 3.20 . Concrete Stress-Strain Ciirves Two Days Afier the Test ................................................. 29
Figure 2.2 1 . lncrease of Concrete Uniaxial Compressive Stren-gth over Time .................................... 79
Figure 2.22 - Reinforcement Stress-Strain Cumes .............................................................................. 3 1
Figure 2.23 - Loading Assem bly - Plan View .................................................................................. ..... 32

Figure 2.24 . One Set of Loading Assembly .......................................................................................... 33
Figure 2.25 . Loading Assembly - 783mm Spacing between Roof Slab Cross-beams ........................ 35
........................... Figure 2.26 . Loading Assembly - One Set of Jacks. Cross Beam and Tension Rod 35
Figure 2.27 . Reference Scheme .............................................................................................................. 37
Figure 2.28 . Load Cell ............................................................................................................................ 37
Figure 2.29 . Layout of Strain Gauges .................................................................................................. 39
............................................................................................................... Figure 2.30 . Layout of LVDTs 40
.................................................................................................................... Figure 2.3 1 . Zurich Targets 42
Figure 3.1 . Load History ................................................................................................................... 44
Figure 3.2 . Roof Slab Reinforcement Strains At Midspan .................................................................. 52
Figure 3.3 . Roof Slab Reinforcement Strains Near Midspan .............................................................. 52
Figure 3.4 . Roof Slab Reinforcement Strains ...................................................................................... 53
Figure 3.5 . Roof Slab Reinforcement Strains Near West Haunch ........................................................ 53
Figure 3.6 . Roof Slab Reinforcement Sinins Near East Hauncli ....................................................... 54
Figure 3.7 . Roof Slab Reinforcement Strains at West Haunch ............................................................. 54
.............................................................. Figure 3.8 . Roof Slab Rein forcement Strains at East Haunch 55
Figure 3.9 . Roof Slab Reinforcement Strains at Haunches ................................................................... 55
................................................................ Figure 3.10 . Invert Slab Reinforcement Stnins At Midspan 56
Figure 3 . I I . Invert Slab Rein forcement Strains Near Midspan ...................................................... 56
Figure 3.11 . Invert Slab Rein forcement Strains Near West Catwalk ................................................. 57
Figure 3.13 . Invert Slab Rein forcement Stnins Near East Canvalk ..................................................... 57
Figure 3.14 . lnvert Slab Reinforcement Strains at Catwalks ..................... ... ................................. 58
Figure 3.15 . Invert Slab Reinforcement Strains at Canvalks ................................................................ 58
Figure 3.1 6 O West Wall Rein forcement Strains at the Haunch .......................................................... 59
Figure 3.1 7 . East Wall Reinforcement Strains at the Haunch ............................................................... 59
Figure 3.18 . Wall Reinforcement Strains Near the Haunches .............................................................. 60
Figure 3.19 . Wall Reinforcement Strains Near the Catwalks ............................................................... 60
Figure 3.20 . West Wall Reinforcement Strains at the Cahvalk ......................... .. ............................ 61
Figure 3.1 1 . East Wall Reinforcement Strains at the Catwalk .............................................................. 61
Figure 3-72 . West Wall Reinforcement Strains at the Haunch ....................................................... 62
Figure 3.33 . West Wall Reinforcement Strains at the Catwalk ............................................................ 62
Figure 3 2 4 . Total Deflections Between lnterior Opposite Faces of the Slabs ..................................... 63
Figure 3 2 5 . Total Deflections Between interior Opposite Faces of the Wails .................................... 63

...................................................................... . Figure 3.26 Roof Slab Concrete Strains at the Midspan 63
. ...................................................................... Figure 3.27 Roof Slab Concrete Strains at the Midspan 64
* ......................................*................*............. Figure 3.28 lnvert Slab Concrete Strains at the Midspan 65
. ..................................................................... Figure 3.29 Invert Slab Concrete Strains at the Midspan 65
Figure 3.30 . Roof Slab Concrete Strains at the Haunches ................................................................ 66
.................................................................... Figure 3.3 1 - lnvert Slab Concrete Strains at the Catwalks 66
........................................................................... Figure 3.32 - Roof Slab Concrete Strains - Diagonais 67
......................................................................... Figure 3.33 - Invert Slab Concrete Strains - Diagonals 67
Figure 3.34 - Roof Slab Concrete Shains - Diagonals .......................................................................... 68
Figure 3.35 - lnvert Slab Concrete Strains - Diagonais ..................................................................... 68
............................................................................... Figure 3.36 . Wall Concrete Strains O Exterior Face 69
................................................................................ Figure 3.37 O Wall Concrete Strains . Interior Face 69
Figure 3.38 . Roof Slab Shear Stnins by Zurich Gauge .................................................................... 70
....................................................................... Figure 3.39 . lnven Slab Shear Strains by Zurich Gauge 70
Figure 3.40 . Zurich Strains Parallei and Normal to Neutra1 Axes at q = 73kNIml ............................. 71
.......................................................................... Figure 3.4 1 . Diagonal Zurich Strains ai q = 73kN/m2 71
. ........................... Figure 3.42 Zurich Strains Parallel and Normal to Neutnl Axes at q = 132kNlrn7 72
Figure 3.43 . Diagonal Zurich Strains at q = 13?kN/ml ........................................................................ 72
........................... Figure 3.44 . Zurich Strains Parallel and Normal to Neutrd Axes at q = 20 I kN/mZ 73
..................................................................... Figure 3.45 . Diagonal Zurich Strains at q = 20 1 kNIm2 73
Figure 3.46 . Zurich Strains Parallel and Normal to Neutra1 Axes at q = 274iN/rn2 ........................ ... 74
Figure 3.47 . Diagonal Zurich Strains at q = 274kN/rnl ..................................................................... 74
Figure 3.48 . Zurich Strains Parallel and Normal to Neutra1 Axes at q = 343kNim2 ........................... 75
..................................................................... Figure 3.49 . Diagonal Zurich Strains at q = 347kN/m2 75
Figure 3.50 a Crack Pattern on Softit of Specimen at q = 20 1 kNIm2 ................................................... 76
.................................................... Figure 3.5 1 . Crack Pattern on Sofit of Specimen at q = 274kNlmZ 76
............................................... Figure 3.52 . Crack Pattern on Soffït of Specimen at q = 347kNlm 2. 77
Figure 3.53 - Initial Setup . q = O k ~ / m ' ............................................................................................... 78
Figure 3-54 - Initial Setup . q = O k ~ / m ' ................................................................................................ 78 * . Figure 3-33 - Load Stage I . q = 73 kNirn2 ............................................................................................. 79
Figure 3.56 - Load Stage 1 . q = 73 ~ / m ' ............................................................................................. 79
Figure 3.57 - Load Stage I I I . q =?O1 k~lrn ' ........................................................................................ 80
Figure 3 -58 - Load Stage III . q = 20 1 k~/rn ' ................................................................................. 80
Figure 3.59 - Load Stage IV . q = 274 kN/m2 ........................................................................................ 81

....................................................................................... . . Figure 3.60 Load Stage 1V q = 274 k ~ / m \ 81
Figure 3.61 . Load Stage V . q = 347 k~/rn ' ...................................................................................... 82
Figure 3.62 . Load Stage VI . q = 347 k ~ l m ' .................................................................................. 82
........................................................................................ . . Figure 3.63 Load Stage VI q = 347 kNlm2 83
................................................................................ . Figure 3.64 . Load Stage VI 1 Post-Failure Stage 83
.......................................................................... . . Figure 3.65 Load Stage 1 q = 73 k ~ / m ' -Roof Slab 84
......................................................................... Figure 3 -66 -Load Stage I I I . q = ?O 1 kN/m2-~oof S lab 84
Figure 3.67 -Load Stage IV . q = 274 k~ /m ' -~oo f ~ l a b ..................................................................... 85
Figure 3.68 -Load Stage VI . q = 347 k~ /m ' -~oo f ~ l a b ....................................................................... 85
Figure 3.69 -Load Stage I q = 73 k ~ / m ' -1nven Slab .................................................................... 86
Figure 3.70 -Load Stage I I I . q = 10 1 k~/m'-lnvert Slab .................................................................... 86
Figure 3.7 1 -Load Stage IV . q = 274 kl\l/rn2-lnvert Slab ..................................................................... 87
..................................................................... Figure 3.72 . Load Stage V . q = 342 kN/rn2-lnvert Slab 87
Figure 3.73 . Load Stage VI . q = 347 kN/m2-lnvert Slab .................................................................... 88
Figure 3.74 . Load Stage I I I -q = 20 1 k~/m'- East Wall ................................................................... 88
...................................................................... Figure 3.75 -Load Stage IV q = 274 kN/m2- East Wall 89
Figure 3.76 . Load Stage VI . Failure Load q = 347 k ~ / r n ~ - East Wall ........................................... 89
Figure 3.77 -Load Stage 1 -q = 73 kPilmL- West Wall ...................................................................... 90
..................................................................... Figure 3.78 -Load Stage 111 q = 20 1 k~/m'- West Wall 90
Figure 3.79 -Load Stage IV . q = 174 k ~ / r n l West Wall .............................................................. 91
Figure3.80. Load Stage VI . Failure Loadq = 347 kN/rn2- West Wall ........................................... 91
............................ Figure 3.8 1 . East End of Roof Slab . Top Surface . Failure Load q = 347 kN/m ' 92
Figure 3.82 . East End of Roof Slab - Bottom Surface - Failure Load q = 347 k~lrn' ....................... 92
............................ Figure 3.83 . East End of Roof Slab - lnterior Face . Failure Load q = 347 kN/m2 93
............. Figure 3.84 . East End of Roof Slab . Exterior Face . Failure Load q = 347 h~lrn' .. ..... 93
Figure 3.85 . East End of Roof Slab - Top Surface - Post-Failure Load ............................................ 94
Figure 3.86 . East End of Roof Slab - Bottom Surface . Post-Failure Load ...................................... 94
Figure 3.87 . East End of Roof Slab - Extenor Face . Post-Failure Load ......................................... 95
Figure 3.88 . East End of Roof Slab - Interior Face - Post-Failure Load ........................................ 95
Figure 4.1 . Computer Mode1 of Specimen Used to Run Program TEMPEST ..................................... 97
Figure 4.1 . Moment Diagram and Deflected Shape ar q=344k~/m' ................................................. 97
Figure 4.3 . Total Deflection of both slabs ........................................................................................... 99
Figure 4.4 . Reinforcement Strains at Midspan of Slabs and at Wall .................................................... 99

.............................................................................. . Figure 4.5 Moment Diagram and Inflection Points 101
............................................................................................... . Figure 4.6 Location of Innecrion Points 101
........................................................................................... . Figure 4.7 Critical Sections by AC1 Code 103
................................................................................. . Figure 4.8 Critical Sections by General Method 108
. ......................................... Figure 4.9 Predicted Shear Strength and Critical Section at the Roof Slab I I I
. ..................................... Figure 4.10 Predicted Shear Strength and Critical Section at the Invert Slab 113
.................... Figure 4.1 1 - Increase of strain due to stress concentration around tension-rod hole .. 1 I J
. ..................................................................................................... Figure 4.12 Shear Strain by LVDTs 116
. ...............................................................................*. Figure 4.13 Shear Stnin by Zurichs and LVDTs 116
. ...............................................*..................................,..... Figure 4.14 Top Slab Rein forcement Strains 117
........................................................................................ . Figure 4.1 5 Top Slab Rein forcement Strains 117
. ................................................................................... Figure 4.16 Invert Slab Reinforcement Strains 118
. ................................................................................... Figure 4.1 7 lnvert Slab Reinforcement Strains 118
. ...............................*..................*............... Figure 4.18 Code Predictions and Observed Shear Failure 121
. ............... Figure 5.1 Influence of Member Size on Shear Strength (adopted from CSA-94 Code) 122
xii

Notation
distance from support to applied load
area of reinforcement in tension zone
area of tendons in tension zone
design width usually taken as lm (AASHTO Code)
minimum effective web width within depth d
distance frorn extreme compression fibber to centroid of longitudinal tension reinforcement
distance measured perpendicular to the neutral avis between the resultants of the tensile and
compressive forces due to fiexure
specified compressive strength of concrete
stress in prestressing tendons when stress in the surrounding concrete is zero
modulus of elasticity of reinforcement
modulus of elasticity of tendons
distance between inflection points
factored moment at section (CSA-94 Code)
factored moment at section (AC1 Code)
factored axial load normal to the cross section occurring simultaneously withVf
spacing of longitudinal cncks in web of member
factored shear force at section (CSA-94 Code)
factored shear force at section
distance from midspan of slab to section
factor accounting for shear resistance ofcncked concrete
A&wd
angle of inclination of diagonal compressive stresses to the longitudinal avis of the rnember
factor to account for low density concrete
resistance factor for concrete

1. Introduction
1.1 GENERAL Underground boxes are Frequently used in the design of subway running structures where
their function is to provide sufficient space to operate trains while resisting vertical and lateral
pressures due to earth, hydrostatic and live loads. They are also utilized underneath highways,
facilitating drainage flow or trafic. They may consist of single or multiple cells and their size
varies.
Generally, highway box structures or culveris are used instead of bridges when spans
measure up to 12m. Culverts can be cast in place or set on site as precast units.
Most subway running structures consist of double ce11 box units with cell widths of
approximately 4m. The thickness of the walls and slabs of these structures often exceeds 600mm.
Figure 1.1 shows two out of three cells of a box structure located south of Downsview Station.
In order to obtain flexible subway operations, which would permit trains to change
direction and switch fiorn one ceil to the other, cross over sections are occasionally built. At these
locations, two or more cells merge together into one wide cell, its width exceeding 10m, while the
thickness of the walls and slabs ranges up to 2.4m.
Subway box structures are built according to a cut and cover method (see Figure 1.2). A
large trench with vertical walls, supported by steel piles, horizontal steel sûuts and tiebacks, is
excavated to build the subway line. Once excavation is completed, box structures are cast in place
on a mud slab (a layer of low strength concrete). Since this method requires only a narrow space
above the proposed line, ir is frequently used in populated areas.
However, subway lines mua be located relatively close to the ground level or bored
tunnels could be considered as offering a more feasible solution. Thus, the earth cover usually
ranges up to 12m (40fi). If a box is designed with an eaRh cover in excess of 2.4m (8 ft), it is
reasonable to assume that concentnc loads applied at ground level would spread through the earth

INTRODUCTION
Figure 1.1 - ïTC Box S h i c ~ e on the Spadmo Line
Figure 1 2 - Cur and Cover Method

INTRODUCTION
and the top of the box would be subjected to equivalent, uniforrnly distributed loads. Lateral
hydrostatic and earth pressures are to be considered, especially in the design ofthe walls. They
cause not only bending of the walls but also compression in slabs. which enhances shear strength. It
would be hard to ensure that walls would be subjected to lateral pressure through out the entire life
of these structures. Thus, designers should also check the capacity of the slabs. assuming that the
structure would be subjected only to vertical loads.
Even though, they are known to be an economical replacement for short span bridges, a
considerable number of these structures, which are either used in subways or as culverts underneath
highways, demand a much better understanding of al1 aspects of their behavior.
1.2 REASONS FOR INVESTIGATION
1.2.1 SIZE EFFECTS
Early research on the shear strength of beams, with or without web rein forcement, was
based on the test resuits obtained from small specimens whose depthofien did not exceed 250 to
3OOmm.
A major impact on the shear design of large beams was the failure of the Wilkins Air
Force Depot warehousel in Ohio in 1955. The partial collapse was caused by shear failure that
occurred at three bays of six span frames. Each frame consisted of 914mm deep beams with a
low reinforcing ratio and no shear reinforcement. Those beams spanned approximately 20.3m
while supporting roof block purlins and gypsum slabs. Expansion joints were provided near the
centerline of each frarne. but most of them were seized. Entire frames were cast during single
working days. This coiitributed to considerable shrinkage. Prior to the failurea very wide shear
crack (about 40mm wide!) was discovered in the interior span beam. Even though this beam was
shored. the shear failure of beams at adjacent spans could not be prevented. After testing one-
third size specimens, the Portland Cement Association concluded that the failure was mainly due
to shrinkage, which contributed to axial tension forces in the beams, having a disadvantageous
effect on shear strength. Lack of knowledge regarding detrimenral size effects on shear strength
could not contradict the unconservative nature of current codes- However. this failure led to
additional research on large beams without shear reinforcement.
Leonhardt and ~ a l t h e i initially tested eight beams with the same geometry and
reinforcing ratio while the type of the ban was varied. It was found that improved bonding

INTRODUCTION
properties increased their corresponding shear strengths. After additional testing of two series of
beams with different depths, while maintaining either the same reinforcing ratio or the sarne
diameter bars. they concluded that the decrease in shear strength in the large beams was mainly
due to the increase in the bar diameten which had poorer bonding properties.
Analyzing the curent equation of the AC1 code. an? tested four series of beams. The
height of beams ranged from l5Omm to 1220mm between the series. The reinforcing ratio of
1.8% and the concrete compressive strength of 26MPa was kept constant while the o/d ratio
varied within each series. Kani reported that the unit shear strength decreased significantly when
the depth of beam increases. A reduction of 40Y0 in the tàilure shear stress was recorded in the
1720mm beams in comparison to the 150mm bearns. Kani also pointed out that the crack Iengths
and geometry were slightly different according as the depth of the beams changed.
~ a ~ l o r ' tested fifteen beams in a series whose depth varied from 250mm to 1000mm. In
addition, he varied the maximum aggregate size while the reinforcing ratio was kept constant at
1.35%. A reduction of shear strength was observed but it was less dramatic when the maximum
aggregate size was properly scaled. Taylor considered that the strength of Leonhardt's large
beams was panially reduced due to reduced dowel effects when the bars were placed in two
layen and due to a reduced aggregate interlocking strength since the maximum aggregate size
remained constant in al1 tested beams. Following Kani. Taylor noted and recommended a
reduction in shear strength by up to 40% when large beams were in question.
A number of tests proved that the shear strength was also dependent on the reinforcing
ratio. For instance. Rajagopolan and ~e r~uson ' tested ten and analyzed 27 other beams with
reinforcing ratios from 0.25% to 1.73%. They concluded that the shear strength would be
significantly reduced if the reinforcing ratio were to be dropped below 1%.
Recent research by S hioya et al6 rein forced Kani's conclusion conceming size effects
while emphasizing the importance of the aggregate size and the low reinforcing ratio. Their
beams had a constant reinforcing ratio of 0.4% and concrete a compressive strength of 13.5Mpa
whilr the effective depth of the beams varied from 1 OOmm to 3000mm. The maximum aggregate
size ranged from Imm to 25mm. Ir was found that the shear strength was reduced as the
maximum aggregate size decreased. The same effects were observed even in the beams whose
depth was in excess of 1000mm. Their tests indicate that the shear strength of large beams
depends on the aggregate interlocking strength, which is significantly reduced when the critical
shear crack widens.

Code provisions, which require beams with a minimum shear reinforcement when the
shear is more than 50% of the shear capacity. were primarily developed to overcome the
unexpected loads and the unwanted brittle nature of memben with no web reinforcement
subjected to shear. The same provisions would perhaps have prevented the shear failure of the
large beams at Wilkins Air Force Depot warehouse. However slabs. footings and joists are
excluded from these provisions because of their multi load sharing capacities. which permit the
load to be shared between weaker and stronger areas.
In addition. slabs are one of the few structural elements that might have very low
reinforcing ratios and no shear reinforcement. When they are used in the design of underground
boa structures their thickness extends to limits where they are clearly classified as large beams.
Therefore. the shear design of slabs in underground box structures might be unconservative.
Concem about the shear capacity of thick concrete slabs was expressed in regard to the
box structures for the proposed Toronto Transit Commission's Eglinton Extension Line. Slabs
with a thickness of up to 1400mm were classified as large beams. Providing minimum shear
reinforcement to both top and bottom slabs eliminated any uncertainty regarding the possibility of
shear failures. However. it was questioned whether the additional sliear rein forcement was real ly
required or the original design with no ties would have been adequate.
1.2.2 LOCATION OF THE CUTICAL SHEAR SECTION WHEN UNIFORM
LOADING IS APPLIED
Since tests with applied uniform loading are more complex and expensive, most of the
research conducted \vas based on beams subjected to single or double concentric loads acting at
distance u away from the supports. From ~ a n i ' s ~ graph (Figure 1.3) it can be observed that due to
arching the shear strength increases significantly when a concentrated Force is shifted towards the
supports and the (un ratio is less than about 2.5.
Concrete codes. which express shear strenpth only in terms of concrete compressive
strength (for instance. the AC1 code7), assume that the critical shear section would be near the
support where the ma.ximurn shear force is expected. Specifically, the critical section is
determined to be the distance d from the support and any load near to the support would be
transferred by a compressive 45" strut.

Figue 1.3 - Shear Stress OC Failure versus d d (.idoptedforn ~ a n i ' )
CODE PROVISIONS
FOR LOADS SHEAR DESIGN
i I -1
!
1 1 I l > - 1
REAL CONOmONS
LATERAL AND VERTICAL LOADS
7 POINT LOAûlNG
VERTICAL LOADS ONLY
-
MODELING
Figure 1 -4 - Steps Involved in che Reuikution of the Experimental Program
6

Following the General Method of the Canadian Code. it becomes clear that the moment
increases longitudinal strains and widens the flexural-shear cracks. This consequently leads to
reduction of aggregate interlock strength and the total shear strength of the member. Since
maximum moments and shear forces usually do not occur at the same place. it becomes harder to
pinpoint the location of critical shear sections. Based on tests conceming simply supported beams
subjected to unifonn loading, it was found that shear failures often occurred at a distance of 0.2L
from supports where both the shear forces and moments were significant. This explains why
certain codes require the shear strength to be checked not only near the supports but also at every
I oth point of the span.
If Kani's experiment was so conclusive when concentrated loads were considered. could
the same analogy be used in the case of unifonn loading? 1s the critical section located at
distance d from the support or is it appropriate to check the shear capacity at every 1 0 ' ~ point of
the span? The entire concept becomes even more complex when additional negative moments are
introduced at the ends of the beams. For instance. the ends of slabs in box structures are subjected
to negative moments. To answer this and other questions it was decided to build and test one box
structure.
The building. testing and analyzing of a concrete box structure would help to bener
understand the detrimental size effects. It wouId indicate the unconservative nature of shear
strength expressions in some curent Nonh American codes. The adequacy of additional shear
reinforcement in the design of the TTC's underground boxes could therefore be more easily
addressed. In addition. the testing of a box shaped specimen with uniform loading would help to
detemine the e'rpected critical shear sections. Moreover, the non-linear behavior of the box
structure afier the cracking of concrete would permit a better understanding of the nature of these
structures under rnonotonic loading.
1.3 HOW TO TEST THE BOX STRUCTURE?
One of the single ce11 box structures. which had to be built at the cross over section of the
proposed Eglinton West Subway Extension Line. was selected for testing. Due to its size the box
was scaled down to 45% and only one 960mm thick slice was built and tested. To ease building
and testing of the specimen, some minor modifications had to be made.
The diameten of the reinforcing bars and the maximum aggregate size were also scaled
down while the reinforcing ratio was maintained the same as it was in the original design. The

minimum yield strength of rebars and concrete compressive strength were chosen to match
corresponding properties specified on the original drawings. The main difference was in the shear
rein forcement that \vas om itted in the specimen modeling.
Only vertical uni form loading was considered in the test and was simulated by seven
point Ioading applied perpendicular to the exterior face of each slab. This was accomplished by
seven sets of double jacks. which acted against the exterior faces of both slabs. Figure 1.4
pictures the steps involved in the realization of the experimental program pertaining to real
underground conditions.
For more detaiis about specimen geometry, the material properties, and loading or
instrumentation please refer to the next chapter.
1.4 CURRENT CODES
ln addition to the experiment. the shear strength of the slabs in the specimen was deterrnined by
current Nonh American codes. The following section summarizes the shear strength expressions
and corresponding clauses presented in the ACI. AASHTO. and OHBDC codes
1.4.1 ACI-95 code7
When members are subjected to shear and flexure only, one can use the traditional expression
1 1 -4 to determ ine shear strensth.
A slightly different expression 11-5 for shear strength is sensitive not only to concrete
compressive strengh but also to the reinforcing ratio and the shear-moment ratio
y, d While ' When a simple supported beam is subjected to two point loading,

INTRODUCTION
which implies that the critical section should be located at a minimal distance d from the support.
When Vu >O.j#V,, Clause 1 1.55. l requires minimum shear reinforcement in al! flexural
memben in accordance with clause 1 1 55.3 and equation 1 1 - 13.
bws A, = 0.35 - f v
[mm and MPa]
Slabs. footings and joists are excluded from this clause.
1.4.2 AASHTO-94 code8 - Design for Shear in Slabs of Box Culverts
In Clause 5.1 4.5.3 shear strength is expressed as
but P;. 2 0 . 2 5 J f b d for single cell culvens with slabs monolithic with walls
1.4.3 CSA-94 code9 - Simplified Method 1 1.3
Clause 1 1 -3.52 States that the shear strength of memben with an effective depth greater than
300mm and no shear reinforcement should be calculated according to equation 1 1-7.
Even though the expression is simple and easy to use. the size effects are still accounted for to
some extent through the effective depth d eapressed in tems that are enclosed in the brackets. It
should be noted that the coefficients 260 and 0.10 in these CSA expressions were calibrated to
account for the low value of $c used in this code (4,=0.6). When using these expressions to
compare w ith experimental results 4, is taken as 1 -0 but the coefficients are taken as ? 1 7 and
0.084.

1.4.4 ASSHTO-94, CSA-94, OHBDC-91 'O-~eneral Method
The general method was based on Modified Compression Field Theory. It recognizes sire effects
in large beams with no shear reinforcement and was accepted in the last I O years byseveral Nonh
American Standards. Small variations. mainly related to notations were noted between the codes.
The following equations are found in the CSA-94 Code.
The shear strength of reinforced concrete beams with no shear reinforcement is calculated using
the equation
where p is determined from either tables or figures and is based on the values of axial strain
cr and crack spacing s,.
Longitudinal strain is calculated from the equation
while crack spacing shall be considered either as the effective depth or the maximum distance
between the layers of crack control reinforcement. whichever is smaller.
Equations reviewed in this chapter were used in predicting the shear strength of the specimen's
slabs and the relevant calculations are presented in Chapter 4.

2.Description of Experimental Program
2.1 SPECIMEN GEOMETRY AND REINFORCEMENT LAYOUT To ease building and to make testing possible, the specimen had to be scaled down and
modified. Chapter 2.1 describes the governing conditions in choosing the specimen size and all
the modifications that were implemented. Specimen geometry, the choice of principal
reinforcement and rebar layout were also described in this chapter.
2.1.1 SPECIMEN S E E AND SHAPE
The scale factor of 45% was govemed by crane lifting capacity, the môuimum capacity of
the test loading assembly and the volume of concrete that could be delivered to the laboratory in one
mixer truck.
In order to strip the fomwork and utilize the bottom facc of the specimen during testing,
the specimen had to be lified clear of the concrete floor by at least 0.4m by a 10 tonne crane. If the
specimen was to be carefblly elevated in small increments by lifting only one side at a tirne, the
maximum weight of the specimen had not to be more than 2 10kN.
In addition to the weight limitation, the shear and flexural capacity of the slabs govemed
the size of the specirnen. It was crucial to ensure that testing could reach the failure stage.
Therefore, the maximum loading that couid be applied by a series ofjacks dunng testing had to be
greater than the predicted failure load if the specimen was assumed to fail in either shear or flexure.
In addition to symmetrical loading, geometry and reinforcement, the consistency of the
concrete mix was one of the key issues in order to obtain symmetrical behavior of the specimen.
The only way to achieve this consistency was to deliver ready mix concrete in one truck The
maximum volume of concrete rhat could be ûansported in the mixer truck was about 9m3. It was
d e to assume that the volume of the specimen had to be less than 8.5m3 if 5% of the concrete was
accounted for in forms of miscellaneous Iosses.

There was a prior intention to preserve the cross-sectional shape of the originally
designed structural unit. However, modifications had to be made mainly to sim pli fy construction,
testing and analysis of the specimen. Nevertheiess, they were minor and they did not have a
significant impact on the test and the results. The original box (Figure 2. I ) had roof crown sloping
1.8% down from the centerline of the structure towards the exterior faces of the walls. This way,
water was easily drained from the roof to both sides of the structure. The crown was eliminated
and the average thickness of the roof slab was used in modeling. Therefore the original top slab
thickness that varied from 1400 to I46O mm was scaled down to a uni form thickness of 650 mm.
The thickness of the invert slab remained unifonn but was also scaled down to 630 mm.
Likewise, the thickness of both walls were scaled down from 750 to 340 mm. Reinforced
concrete 45' haunches and catwalks were modeled at the wall interfaces with the slabs as they were
originally designed. The purpose of the catwalks was not only to stiffen the structure's bottom
corners. but also to provide maintenance crews with a safe place to stand and yield to oncoming
trains.
In addition. fourteen 91 00mm circular holes were formed in the slabs at 783mm spacing.
Seven holes in the roof slab were aligned with corresponding holes in the invert slab in order to
accommodate steel tension rods during testing. Tension rods were part of the test loading
assembly and their function is described latter in this chapter. A concrete outline of the specimen
is shown in Figure 2.2.
2.1.2 REINFORCEMENT
The building of the actual cast-in-place box structures can be divided into three stages.
which are represented in Figure 2.3. First, the invert slab and catwalks are cast on top of a mud
slab. Second. reinforcement is placed in the walls and splicrd above catwalks with exposed
embedded rebars in the invert slab. Also, some of the rebars are extended to the top slab. The
casting of the walls up to the bottom of the haunches completes this stage. At the last stage.
reinforcement is placed and spliced in the slab above the walls. The concrete is cast and the
haunches and the roof slab are formed. In order to achieve proper moment and shear transfer
between walls and slabs. special attention is given to the construction joints located at the boaom
and top of the walls. Since the test specimen was cast horizontally. there was no need for
construction joints and they were therefore eliminated. However. splicing of the reinforcement
was maintained to closely mode1 the original box unit.

, J5U 0150
~ O M a230 rrr 15U 0100 IYP
-- 25M OJOO
OUNO1 F AC IER'rAIE
REINFORCING STEEL NOTE, REINT. SIULIETRICAL M O U 1 00,
ü?rLESS NOtEO OltQRWiSE
Figure 2.1 - Original TTC Box Unit

Figure 2 2 - Specimen Outhe
DESCRIPTION OF EWERIMENTA L PROGRI M
WALL
CONSTRUCTION JOINT
--
CONSTRUCTION
STAGE I
STAGE II
STAGE Ill
Figure 2.3 - Sepence of Consirticrion
In order to study the shear response of a large structurai element with no shear
reinforcement. stimps were intentionally omitted from the roof and invert slab. The model thus
represented the original design which did not contain stimps. Considering that the walls were not
expected to experience significant shear forces. stimips were also eliminated from the walls in order
to simpiib construction. Therefore. the test specimen contained only principal and temperature
reinforcement. which is shown in Figure 2.4.
The principal and temperature reinfornement used in the test specimen was scaled down in
bar size and spacing while the reinforcement ratios were maintained approximately in the same way
as corresponding ratios in the original TTC design. Bars were placed in ten strips. Spacing between
the strips was 92 mm. An exception was made between strips 5 and 6 where the spacing was
increased to 132 mm to accommodate lOOmm PVC tubes. These tubes were used to form tension-
rod openings in both slabs. The number, size and length of bars varied not only behveen the strips,
but also within each strip. Even though splices were scaled to 45% of their original length: most of
the reinforcing details were still in accordance with the CSA code requirements. The principal
reinforcement in walls and slabs consisted of 1 SM and IOM bars, while US #3 rebars were placed
in haunches and catwaIks.

DESCRIPTION OF EXPERIMENTAL PROGRA M
- zçç
Figure 2 -4 - Specimen Rein forcing L q u t

According to the TTC drawing, single and twin 35M rebars, alternated at 150mm
spacing, were placed along the tension faces of both slabs where maximum moments were
expected. This reinforcement was modeled with fourteen ZOM rebars. Ten rebars were located in
each strip and an additional 4 rebars were added to every third location. Originally, the exterior
top slab reinforcement consisted of 3OM rebars spaced ai 300mm. This reinforcement was mainly
used to ease the installation of shear ties and was modeled with four 15M rebars placed at every
third strip. Likewise. 35M rebars at the exterior layer of the invert slab were modeled with four
20M rebars.
Since the specimen had vertical axes of symmetry, both walls had the same geometrical
and reinforcement layout. Interior 15M bars spaced at 300 mm were provided to secure the wall ties
in place and to resist any moment that might be the result of lateral earth pressure applied to the
exterior faces of the walls. They are modeled with four 15M bars placed at every third strip. More
reinforcing bars were supplied in walls near the exterior face since the negative slab moments at
each corner were transferred to the walls. Therefore. L-shaped and straight 30M and 35M rebars
were added to the exterior layer of both walls. These rebars were substituted with 2(M bars in the
test specimen.
During construction of the specimen. haunches and catwalks were reinforced with four
US#) bars. placed at every third strip.
The proper choice of temperature reinforcement and its spacing is important in the control
of shrinkage cracks. Since rebars ernbedded in the bottom siab restrain the lower portion of the
walls from shrinking, vertical shrinkap cracks may develop in the walls. By the same analogy,
similar cracks are expected in the roof slab and haunches, since the slab would be partially
prevented from shrinking by the walls. Shrïnkage cracks may also develop through the entire
section when structural units are very long. In the original design. temperature reinforcement was
placed on the interior and exterior faces of both slabs and the walls. Slab 25M bars at 300 mm
spacing were modeled with 15M bars ai every 250 mm. Similady. I OM ban at 175 mm. usedin the
walls, were modeled with 15M bars at 250 mm spacing.
Since box structures are erposed to hanh underground conditions. a sufficient concrete
cover is required to extend their lives. The following clear concrete covers were accepted in the
design of the TTC box unit.

DESCRIPTION OF EYPERIMENTAL PROGRtlrCf
Location CIear cover
from top beam exterior face to principal reinforcement 75mm
from top beam exterior face to stimps 60mm
from top beam interior face to principal rein forcement 50mm
from wall and invert slab exterior face to principal reinforcement 1 OOmm
from wall and invert slab exterior face to stimps 70mm
from wall and invert slab interior face to principal reinforcement 50mm
Except for the concrete cover at the exterior face of the top beam. which was increased by ?O mm to
account for the roof crown. the concrete coven were scaled and they are shown below:
Location Clear cover
from top beam exterior face to principal reinforcernent 55mm
from top beam interior face to principal reinforcement 25mm
from wall or invert slab exterior face to principal reinforcement 5Omm
from wall or invert slab interior face to principal reinforcement 2Smm
2.2 BUILDING OF SPECIMEN
The specimen was constructed within a period of four months in the following sequence.
All principal and temperature reinforcing ban were rneasured, cut and bent in accordance with
pre-defined lengths.
Selected bars were strain-gauged. Ninety-six strain gauges were attached to the principal
reinforcement and this step was completed within four weeks. Additional information regarding
the type and location of strain gauges can be found later in this chapter.
The base of the formwork had to be built before reinforcement was assembled in the cage.
Two layers of 19mm thick plyvood were secured together with screws at 300mm spacing.
Top plywood was used to outline the geometry of the specimen and to partially support the
formwork plyood walls. Considering that rnany long and intricately shaped specimens
exhibited shrinkage cracks after casting, some improvements were made to the formwork. To
allow lateral movement due to shrïnkag. the formwork was designed in such a way that the
wall panels could be quickly and easily stripped. Moreover. the friction between specirnen
and the floor was minimized through a thin film of grease wrapped by two sheets of plastic
and placed between plywood panels below the specimen. Thus shrinkage cracks were

eliminated by allowing the specimen and top sheets of plywood to float on a thin layer of
grease.
The reinforcing cage was buiit on top of the fomwork base. Reinforcernent was assembled in
smaller segments (corners, and wall and slab panels). These segments were connected together
and tied with additional rebars. The reinforcing bars positioned at the catwalks and haunches
were added at a later stage to the cage. Wood ternplates were used to accurately control spacing
between ban, while plastic chairs were used to position the ban against the fomwork. Lifiing
hooks were bent from 35M ban into a U-shape and placed at midspan and at each end of both
slabs. Once the cage had been cornpleted. al1 strain gauge wires were neatly bundled and
protected by duct tape. Photos of the cage are shown in Figures 7.5 to 2.12.
lOOmm diameter PVC tubes were positioned in the top and bottom slabs at 783mm spacing
before the rest of the forrnwork was constructed.
Fonnwork walls were built using 19mm thick plywood panels. which were supponed by steel
frames. The plan view of the forrnwork is shown in Figure 2.13. To ease stripping of the
fomwork after the specimen was cast. a thin layer of oil was applied to the interior formwork
surfaces that had sustained contact with concrete. Steel frames consisting of C- and 1-shaped
horizontal bearns were connected to triangular steel soldiers by structural boits. Soldiers were
screwed to the base of the formwork while the upper potion was strengthened by jmm steel
ties. Ties were also installed through PVC tubes. Figures 2.14 to 2.1 7 picture the assembled
forrnwork prior to casting.
Concrete was delivered in one mixer truck and placed into the formwork in three layers.
Workability of the concrete was enhanced by a plasticizer and two vibraton (35mm and
50mm in diameter). Standard 150mm cylinden were cast at the same time and lefi to cure
beside the specimen. The top exposed concrete surface was finished one hour after casting
and the whole specimen was covered with wet burlap and plastic for seven days. The steel
framing and interior vertical fonnwork wails were stripped two days after casting. Floating
on a thin layer of grease allowed the specimen to shrink and the corresponding cracks were
successfully avoided. The rest of the forrnwork was removed seven days afier casting.
The casting of the specimen is shown in Figures 1.1 8 and 2.19.
Six small concrete pedestals had to be built. They supported the elevated specimen at the
haunches. catwalks, and midspans of the slabs. Once the specimen had been lified. two plain
rubber pads were centered on top of each pedestal and positioned underneath the specimen.

Figure 1.5 - Reinforcing Cage - Looking South
Figure 2.6 - Remforcing Cage - Looking West

DESCRIPTION OF EXPERII~~EIVTA L PROGRAM
Figure 2.7 - Reinforcing Cage -Exterior Reinforcing Layer of Roof Shb
Figure 1.8 - Reinforcing Cage - Interior Reinforcing Layer of Roof SZab

DESCRIPTION OF E Y P E R I i W T = I L PROGM ,CI
amr* -- - _ _ . a.. --A-& -
Figure 2.9 - Reinforcing Cage -Exterior Reinforcing Loyer of East Wall
Figure 2.1 O - Reinforcing Cage -Interior Reinforcing Luyer of West Wall

DESCRIPTION OF EXPERlh/&VT.AL PROGR4 M
Figure 2.1 1 - Reinforcing Cage -Roo~~%~ll Connection at Top Corner
Figure 2.12 - Reinforcing Cage -Imert SIab Aaacent tu Cahualk

DESCRIPTION OF EXPERIMENTAL PROGRAM
Figure

Figure 2.14 - Formwork - Looking South
Figure 2.15 - Formwork - Lookmg West


DESCRIPTION OF LW ERIMEN TA L PROG R4 ICI
Figure 2.1 8 - Casting of Specimen
Figure 2.19 - Cartmg of Specimen - Vibraion of Conmete

DESCRIPTION OF &YPERIILfENTrlL PROGRA M
These pads had to suppon the specimen weight and to accommodate any lateral displacement
of the specimen during testing.
* PVC tubes were pulled out of the hardened concrete leaving fourteen tension-rod holes in the
slabs. The specirnen was painted white and prepared for the instrumentation and the test set up
which is described in the following sections of this chapter.
2.3 MATERIAL PROPERTIES
Space limitations, the magnitude of the applied loads and construction costs are some of
the goveming factors in selecting the type of structure and the appropriate construction materials.
Generally, underground box structures do not have strict space constraints. In most cases,
interaction is only with utilities, which cm be easily relocaied. Also, the underground boxes
usually span less than the bridges or buildings and coiisequently their factored loads are
considerably lower. However. the scope of the work involved in building the subway box
structures is usually significant. Therefore, the cost of construction usually dictates the method of
construction and the rnaterials to be used. Thus. box structures are usually designed as single or
twin cell rigid frame structures with thick slabs and walls built with normal strength concrete and
standard widely available reinforcing bars. To minimize construction costs. the use of post
tensioned. prestressed or high strength concrete is generally avoided.
23.1 CONCFETE
In order to closely model the chosen ITC box structure. it was decided to build the
specimen with the concrete properties similar to those specified in the original design. Therefore, a
35MPa 28-day uniaxial compressive strength of concrete and a lOmm maximum aggregate size
were chosen. Since the supplier had a tendency to provide concrete with somewhat higher strength
than requested, '?SMPa7' concrete was ordered and cast. The standard 150mm cylinden were cast
and cured beside the specimen in a sirnilar condition. They were tested under uniaxial compression
at various times and the results are shown in Figure 2.20. Stress-strain curves of five concrete
cylindea were obtained two days afler the specimen had been tested and they are show in Figure
2.2 1.
To improve the workabiliy of fiesh concrete, the superplasticizer was added pnor to
casting, untii a slump of lOOmm was obtained.

DESCRIPTION OF MERIMENTAL PROGRAM
Figure 2.20 - Concrete Stress-Strain Curves Two Duys A$er the Test
Tirne [days]
Figure 2.2 1 - Inrrease of Concrete Uniaxiai Compressive Strength over Time

DESCRIPTION OF EYPERIMENTAL PROGR4rl.I
2.3.2 STEEL
Principal reinforcement was modeled with three different bar types. Their stress-strain
properties are listed in Table 2.1 and shown in Figure 2.21 The yield stress of 400MPa specified in
the TTC design is somewhat lower than the actual yield stresses obtained from the ban used in the
specimen. This should be considered in the design of specimen bar splices. the computer modeling
of the memben and the prediction of the shear strength of slabs. All the bars exhibiteddistinct yield
plateaus and strain harden ing.
2.4 LOADING SCHEME
Seven parallel concentrated forces. which were applied at the exterior faces of each slab
at 783mm spacing, simulated vertical uni forrn loading as accounted for in the original design (see
Figure 7.23).
Each force was applied by a set of two 50-ton single-acting jacks. The base of each jack
acted against the top surface of the roof slab while the jack head reacted against the invert slab
through the assembly of cross beams. spherical bearings, steel tension mds and load cells (Figure
2.24). In order to successfulIy simulate uniform loading, the jack loads had to be of the same
intensity at al1 seven locations.
The bottorn of each jack was positioned on a 38mm thick steel base plate. The machine
recessing of these plates provided an accurate alignment of the jacks. Each plate was attached to
the roof slab with four anchor bolts that carried not only the weight of the plate but also the
weight of the jacks. a cross bearn and a tension rod. The base plates were also used to panially
distribute the applied load From the jacks to the specirnen preventing localized crushing of the
concrete contact surface,
The roof slab cross-beams consisted of two 38mm (1.5in) thick trapezoidal steel plates
connected by three 5 1 mm (2in) thick plates. which were recessed to accommodate jack heads and
tension rods. Thus. each jack was precisely aligned between the base plate and the cross-beam.
The main hnction of the cross-beams was to transfer reaction forces from the jack heads to
the tension rods. In the design of the cross-beams additional consideration had to be given to their

DESCRIPTION OF EXPERIMENTAL P R f f i R A M
50 1 O0 Reinforcement Strain [ms]
Figwe 2.22 - Reinforcement Stress-Strain Cwves
- Initial slope of strain-hardening curve
Table 2.1 - Reinforcing Steel Properties

CROSS4
783mm n L
*--- LOAD CELL
*-- TENSION ROD
AM
\ TENSION ROD HOLE
783mm t *
BASE
PLATE
783mm 1 I
SPHERICAL BEARING WlTH NUT AND WASHER
' CROSS-BEAM

DESCRIPTION OF EYPERIMENTA L PROGRAM
. - / CROSS-BEAM
\ - . i l .
d -J~L- NUT
SPHERICAL BEARING
4 1 4--- JACK 1
-y BASE PLATE
TENSION ROD HOLE
T E N S I O N ROD
LOAO CELL
pi-
CROSS-BEAM
SPHERICAL BEARfNG
NUT
Figure 234 - One Set of Loading ..lssembiy
DESCRIPTION OF EXPERIILIENTA L PROGltl IV
stability, because the jack heads and the tension rods were aligned such that the corresponding
forces acted along the same plane.
Tension rods were used to transfer the reaction forces between opposite beams. High
strength 44mm-diameter steel ban were fabricated into fourtern short rods. These rods were
coupled together with seven load cells. and fabricated out of 63mm-diameter high strength bars.
Each side of the tension rods was threaded for coupling with load cells and in-house
manufactured bolts.
To prevent the tension rods fiom bending, spherical bearings were placed between therod
ends and the cross-beams. By allowing rotation at the bearings. hinges were created at each end of
the tension rods. Therefore. each rod functioned as a truss member transferring only the tension
force between the roof and invert slab.
Jack reaction forces were transferred through tension rods to C-shaped cross-beams.
These beams spread the reaction force to the exterior face of the invert slab. Each C-shaped beam
was bolted to the invert slab with two anchor bolts. Spacing between the crossbeams was
maintained at the same level at both slabs. By settinç al1 tension rods so that they were parallel to
the centeriine of the specimen. applied loads were also parallel. equally spaced and perpendicular
to the esterior faces of the slabs.
The test loading assernbly was designed to fail the specimen either in shear or flexure and
was tested up to a load of 800kN/mZ. Jack loads were controlled by the ioad maintainer and al1
fourteen jacks had a similar friction coefficient. Therefore. the jacks produced loads with alrnost the
same intensity at various oil pressures. Al1 hardware used in the test setup was fabricated with high
accuracy. Figures 2-25 and 7.26 pictllre the loading assembly. Shop drawing of cross-beams. Ioad
cells. spherical bearinp and other hardware are presented in Appendix A.
2.5 INSTRUMENTATION
Prior to testing. the specimen was equipped with instrumentation. which was used to
monitor and record applied loading. deflections and strains. A nurnber of electronic strain gauges.
Linear Variable Differential Transfomers (LVDTs) and Zurich targets and gauges were used to
obtain the data. In addition to 3Smm photos. the entire test was recorded on videotape.

Figure 2.25 - L U ~ & ~ ~ssembfy - ~ i o f S a & ~ross&epmc

DESCRIPTION OF EYPERlMENTA L PROGRAh4
2.5.1 REFERENCE SCHEME
To easily undentand the terrn inology related to di fferent specimen components and their
faces. a reference scheme was developed and is shown in Figure 3.27. The specimen was set in a
horizontal position and oriented in the same direction as it was built. The top surface and soffit of
the specimen outlined the cross-sectional shape of the modeled structure. The roof slab faced
north while the invert slab was oriented towards the south. The west and e s t walls were named
according to their geographical orientation. West and east haunches and catwalks were referenced
in the same fashion as the walls, and they were located at the interfaces of the walls and the slabs.
2.5.2 LOAD CELLS
Loads applied to the specimen were monitored at two different locations. The oil pressure
supplied to the jacks was checked by a pressure transducer installed adjacent to a load maintainer.
This transducer was used to monitor pressure at the main line. which supplied oil sirnultaneously
to al1 the jacks.
To simulate unifonn loading, it was necessary to ensure that al1 jack-induced loads had
the same intensity. It was not practical to rnonitorthe pressure at each individuai jack. Also, jack
loads could only be estimated because of the friction that developed around the jack heads at low
oil pressures. Therefore. seven load celis were coupled to the tension rods, which tnnsferred
reactive forces between the roof and invert slabs. Each cell was eqiiipped with four electronic
strain gauges and corresponding strains were averaged to el im inate an y bending effects. Know ing
stnins. modulus of elasticity and cross-section areas it was easy to find the corresponding
reactive tension forces being transferred by the rods from the top to the bottom slab. Prior to
testing. load cells were calibrated to directly display tension forces. One of seven load cells is
shown in Figure 2.28.
2.5.3 STRAIN GAUGES
In order to analyze the behavior of the specimen and capture key points such as the
cracking of the concrete. the yielding of the reinforcement or failure load, it was important to
obtain a continuous record of strains at selected reinforcing bars. A number of jrnm long
electronic strain gauges were attached to the principal reinforcement located in the walls and
slabs. Afier gluing the gauges to the bars. they were protected and wired to a data acquisition
system. Fifty-nine out of the eighty-four gauges were placed west of the specimen centerline.

4 WEST WALL ! EAST WALL !
! * !
! interior faces -t !
. ' WEST CATWALK ! -:gC // ! ! 1
BOTTOMOR j 1 - . t - :
t - /INMRTSLAB ! 1 , . " 1 + s -
r i - A-. -* - .- #
!
Figure 2.27 - Reference Scheme
HlGH STRENGTH ROD GAUGE
Figure 2.28 - Load Cd1

DESCRIPTION OF EYPERJMENTA L PROGRA M
The goal was to capture the strains near the shear failure plane regardless of where it may occur.
Since it was hard to predict at which corner the specimen would fail. an additional 25 gauges
were positioned at the east end of the specimen. These gauges were also used to check if there
was any discrepancy in symmetrical behavior due to the cracking of concrete or the possible
imperfections in the specirnen geometry or loading. Particular locations had two or three gauges
usually bonded on the reban in the fint, fourth or tenth strip. By doubling and tripling the gauges.
it was ensured that a11 strategically selected strains were recorded even if one of the gauges were
to fail. The exact position of each strain gauge is shown in Figure 2.29.
The main concentration of gauges was on reban of both slabs adjacent to the interior and
exterior faces at locations of expected maximum moment and shear failure. Some of the gauges
were positioned along slab principal reinforcement to capture the strain pattern dong the ban.
For example, one of the rebars at the interior face of the top slab had nine strain gauges bonded
along its ent ire length. Twenty-nine and twenty-seven strain gauges were placed respective1 y on
reinforcing bars of the roof and invert slabs.
A similar scheme was used in strain gauging of the principal wall reinforcement. The
gauges were bonded along rebars to observe the strains in the walls between the haunches and the
catwal ks.
Reinforcing bars at the haunches and the cabvalks were used mainly for detailing
purposes since these areas were assumed to be in compression when the specimen was subjected
to uniforrn loading. Therefore. there were no strain gauges in either the haunches or the catwalks.
2-54 LVDTs
Since strain gauges could only capture strains along reinforcing bars. Linear Variable
Differential Transformen (LVDTs) were used to record a continuous record of average concrete
surface strains and deflections. Forty-one LVDTs were used and their gauge lengths ranged from
350 to 48OOmm.
Four LVDTs were installed to record the total deflections between the opposite interior
faces of the slabs and the walls. Eleven gauges were mounted on the soffît of the specimen to
capture diagonal concrete strains at locations of possible shear failure. Other LVDTs were
attached to the interior and exterior faces of the slabs and the walIs at locations of expected
mavimum moment or at critical shear sections. None of the gauges were mounted on the top
surface of the specimen since they would obstruct the space required for a Zurich recording.
Figure 1-30 shows the LVDTs layout.

DESCRIPTION OF EXPERIMENTA L PROGRAM
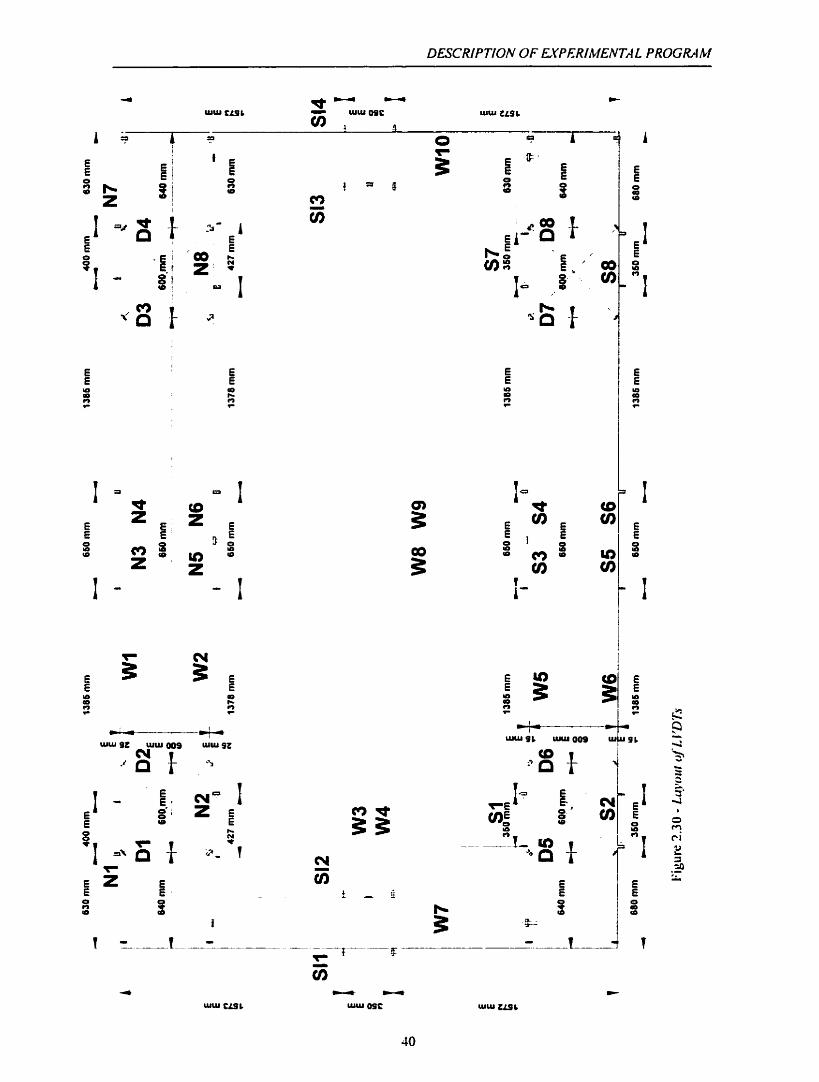
DESCRIPTION OF EYPERIMENTA L PROGRAM

DESCRIPTION OF &VP&RIkïENTrL L PROGRcl hi
2.5.5 ZURICH TARGETS
In ternis of strains, neither strain gauges nor LVDTs could cover the entire specimen. A
grid had to be laid down on the top surface and the distance between the grid points was
measured at different load stages. Zurich targets (disk-shaped aluminum buttons) were glued tu
concrete surfaces at each grid point. They were designed to facilitate fast and accurate distance
recording with mobile transducers called Zurich gauges. By recording initial and final lengths. it
was relatively simple to find the corresponding surface strains.
Zurich targets were arranged in square 300?<200mm and 300?i)00mm grids. Five hundred
and eight readings were recorded between one hundred and seventy-eight targets just prior to
testing and at each of the five consecutive load stages. The layout of the Zurich targets is shown
in Figure 2.3 1 .
2.5.6 VIDE0 AND 35mm CAMERAS
Two video cameras were positioned nonh and south of the specimen and they recorded
the overail behavior of the specimen during the entire period of testing. In addition. color photos
of the specimen, crack patterns and the test set-up were recorded by two 35mm cameras. Also. a11
stages of construction. including finished formwork, the steel cage and casting were recorded on
35mm color film.

DESCRIPTION OF LWERIMENTAL PROGR.4 M

3. Test Observations and Results
Al1 records obtained by the strain gauges and LVDTs were collected at specific loading
points as well as at regular time intervals. Data was sent to a data acquisition system, organized in
sets and stored in one computer text file. This chapter summarizes observations based on the
stress strain curves obtained by LVDTs and strain gauges. Strains obtained from Zurich readings
and crack pattems were collected at 5 loading stages.
3.1 LOADING
The specimen was subjected to rnonotonic loading sirnulated by fourteen jacks until the
point of failure. Equivalent uniform loading q, used in this chapter, was obtained from reactive
forces at seven tension rods.
Reactive forces calculated from recorded strains at seven load cells were averaged and
presented in the form of equivalent uniform vertical loading that would be applied to specimens
in real underground conditions. The difference in recorded loads at load cells was less than 9 . 5 %
at any stage of the test and l e s than 21 5% jua prior to failure. The test was completed in two days
and the load history is shown in Figure 3.1.
Seven load stages were set up at pmicular loading points in order to obtain the necessary
Zurich readings, take photos and observe crack pattems. At each stage, the load was reduced on
average by approximately 1 1% to ensure the safety of technical personnel. AAer the completion
of al1 tasks at one load stage, the specimen was loaded until the next load stage was reached. The
first three load stages were set up on the first day and the remaining stages were cornpleted on the
second day.

TEST OBSERVA TIONS AND RESUL TS
. .
O 50 100 150 200 250 300 350 400
DATASET No.
Figure 3.1 - Lod Hisrory
In order to minimize concrete creep effects and avoid test-related hazards, the specimen
was unloaded to 75.5k~/rn' over night between two consecutive test days. At the beginning of the
second day, the load was brought back to the maximum level recorded at the third stage. and then
cycled from 198.8k~lm' to 29.5 k ~ l m ' two times. Because it was known that cracks should be
exhibited on the sofit and the top surface of the specimen. load cycling was done in the order to
break the thick layer of white paint that panially covered the crack pattern. Since strain gauges
and LVDTs did not record any significant changes of strains, al1 cycling related to data was
ornitted in order to maintain the clarity of the presented graphs.
Once failure was reached, the applied Ioad was quickly removed to preserve the specimen
from funher damage, and then after photographs had been taken it was reloaded to find the post
fai lure capac ity .

TEST OBSERVA TIONS AND RESUL TS
3.2 TEST OBSERVATIONS
The specimen was loaded until shear failure occurred in the roof slab, adjacent to the
west haunch. at a load of 347 k~lrn'. Overall behavior of the specimen prior to failure can be
observed in Figure 3.24. which depicts the load-deflection curve recorded by LVDTs between
opposite interior faces of the slabs.
Detailed observations are presented in the following text in chronological order as
loading was applied. They are grouped within the seven load stages. such that any changes noted
prior to or at the load stage are presented together.
The reference scheme described in 2.5.1 is used. Roof slab was oriented to the North,
inven slab to the South while east and West walls were named according to their geographic
orientation. The mid-height of the specimen refers to the horizontal plane through the tension
rods.
3.2.1 LOAD STAGE 1
The initial localized cracks at mid-height of the roof and invert slabs were captured by
strain gauges located at the midspan. It can be observed from Figures 3.2 and 3.10 that these
cracks occurred at about 50k~lm'. When the load was increased to 73k~lm'. cracking was more
evident. not only at the mid-height but also near the top and boaom gauge in the roof slab.
Compressive strains recorded along exterior reinforcing bars at the same section were less
sensitive in capturing initial cracking, but it can be observed that the dope of the load strain
curves, as shown in Figure 3.1, changes at a load of 73k~lm'.
The load was reduced from 73k~lrn' to 65k~lrn' and the specimen was visually
inspected. However. signs of cracking were not found on concrete surfaces. Photographs of the
specirnen at this load stage are presented in Figures 3.53.3.54.3.65.3.69 and 3.77
Zurich readings were obtained at reduced loads and the corresponding average strains are
shown in Figures 3-40 and 3.4 1. A maximum average tensile strain of 190p was recorded by the
Zurich gauge along the interior edge of the invert slab above the second tension rod from the East
Side. A high compressive strain at the same section but along the exterior edge indicated
additional cracking of the invert slab approximately 3m east of the rnidspan. However. relatively
low strains. which are shown in Figure 3.13, were captured along the bottom reinforcing bar at

TEST OBSER VA TiONS AND RESUL TS
the same location. Perhaps cracking occurred between the tension-rod opening and the top surface
of the invert slab. A maximum roof slab tensile strain of 98.8 p was recorded at midspan where
maximum moments were erpected. Surface wall strains were slightly lower than strains at slabs
reaching a maximum of 70ps along exterior faces. The maximum wall compressive strain was
detected at the interface of the west wall and the catwalk.
In addition to Zurich readings and the visual inspection of the specimen, this load stage
was used to ensure that al1 instrumentation and loading equipment were functioning properly
prior to further testing.
3.2.2 LOAD STAGE 11
When the specimen was subjected to a load of 10 1 k ~ / r n ~ , the initial crack at midspan of
the invert slab propogated towards the top surface. Through an additional load of 5 k ~ / m ' this
crack extended downwards to the specimen soffit (see Figure 3.10). Compressive strains recorded
along the bars at the same section indicated a less pronounced cracking at the same load (see
Figure 3.10). Strain gauges and diagonal LVDTs. which were located in slabs approximately 1 m
West and east of midspan. recorded new cracking as the load was further increased from
107k~/m' to 132k~lrn'. This is shown in Figures 3.3, 3.1 1. 3.34 and 3.35. Cracking of the slabs
at midspan was also captured by LVDTs rnounted on interior faces. Even LVDTs on exterior
faces at the same sections captured the cracking of the concrete as increments of compressive
strains slightly increased at a load of I O l k~lrn'. Load-strain curves recorded by LVDTs on
interior and exterior faces of slabs at midspan are shown in Figures 3.26 to 3.29.
Wall cracking was detected at 107k~lrn'. Looking at Figures 3.16. 3.17,3.?0 and 3.2 1, it
is obvious that cracking occurred in both walls adjacent to haunches and catwalks. The load-
strain curve in Figure 3.1 8. captured by the strain gauge in the east wall. was also used to detect
new cracks. Wall cracking was less evident in interior faces, but could still be observed along
reinforcing bars. and these load-strain curves are shown in Figures 3.16 to 3.1 1.
LVDT SM. which was mounted on the exterior face of the east wall detected cracking
when the load was increased from 107kN/m2 to 132k~lrn'. This is shown in Figure 3.36. The
same figure also depicts the stress-strain curve obtained by the LVDT on the tension face of the
West wall. It can be observed that cracking at this location occurred just prior to Load Stage III.
However, LVDTs on interior faces of both walls detected cracking at 107 kN/rn2 (see Figure
3.3 7).

TEST OBSERVA TIONS AND RESULTS
Overall softening of the specimen due to cracking can be observed in Figures 3.24 and
3.25, which display load-deflection curves of slabs and walls.
Even though strain gauges and LVDTs captured cracking at various locations, cracks
were not visible at a loading of 1 2 1 k~lrn'. Perhaps, the crack pattern, which was developed on
the tension faces of the slabs and walls, was still covered with layers of white paint. Thus. photos
were not taken at this load stage.
Average strains obtained by Zurich gauges at a reduced load of 121 k ~ / r n ' are shown in
Figures 3.42 and 3.43. A maximum tensile strain of 4 2 4 p was recorded at the interior face of the
roof slab West of the center tension rod. High tensile and compressive strains dong interior and
exterior edges above three center tension rods indicate the location of flexural cracks in the roof
slab.
Likewise, high strains recorded on the top surface of the invert slab above three tension
rods indicated flexunl cracks. High stnin was also noted above the second tension rod from the
east side and at the same location maximum strains were captured at the previous load stage.
Based on strains along the exterior faces of both walls, which ranged up to 236 ps. it was
obvious that the cracking of the walls occurred prior to this load stage.
Since the average diagonal stnins obtained from the Zurich readings were much smaller
than the strains at the midspan of the slabs. cracks up to this load stage e-xhibited only a flexural
nature.
3.2.3 LOAD STAGE III
When load increased to more than 13 I k ~ / m ' . the formation of new significant cracks in
the slabs has not been recorded. However, further soflening of slabs was mainly due to the
formation of fine cracks and the opening of existing cracks.
At a load of 16 1 k ~ / m ' , new cracking could be noted in the exterior face of the West wall
at strain gauge WJB, which load-strain cuve is shown in Figure 3.18. Cracking was also
observed in Figure 3.19. which depicts load strain curves recorded by strain gauges near exterior
laces of the walls. An initial crack in the west wall adjacent to the haunch propagated downward
io the specimen soffit at 1 78 .6k~h ' .
The specimen was subjected to a mavimum load of I O 1kN/m2 before the third load stage
was set.
Prior to visual inspection. the load was cycled twice to break the layer of surface paint
and uncover hidden cracks. Since the soltit was cast against a smooth plywood surface, it was

TEST OBSERVA TIONS AND RESUL TS
easier to locate the crack on the soffit than on the top of the specimen. A series of cracks were
exhibited on the tension faces of slabs and walls (see Figures 3.57 and 3.58). They were evenly
spaced and perpendicular to the neutral axis. The crack pattern observed on the softit of the
specimen is shown in Figure 3.50.
Narrow vertical cracks were exhibited on interior tension faces of both slabs and they
could be seen in Figures 3.66 and 3.70. They were spaced at approximately l5Omm and their
widths ranged from 0.05 mm at quarter points to 0.1 5mm at the midspan. The spacing of cracks
was increased up to 300mm at the soffit. A few soffit cracks propagated up to 400mm through the
depth of the slabs. The flexural nature of the cracks was observed at the same tirne. Only one
slightly inclined crack was noted on the soffit of the roof slab. This crack was located
approximately 900mm west of the midspan.
Figures 3.74 and 3.78 show cracks in walls at approximately 175mm spacing. Cracks
were 0.05 to 0.lOmm wide and located on the exterior faces where the wall thickness was
340mm. Cracks were not observed in haunches or catwalks at this load stage.
Figures 3.44 and 3.45 show the Zurich average strains at 189kN/m2. A maximum strain
of 1034 ps was recorded along the interior face of the roof slab above the first tension rod West of
the midspan. High Zurich strains at both slabs confirm visual observations regarding the
extensive cracking, as well as findings from strain gauges and LVDTs. A maximum compressive
stnin of 4 7 3 ps was detected at the interface of the West wall with the catwalk. A high
compressive strain at this location was caused by an abrupt change of wall thickness, which
resulted in stress concentration at the interior corner.
3.2.4 LOAD STAGE IV
When loading was increased from 20 1 kN/rn2 to 274k~lm'. the interior faces of the roof
and the invert slab exhibited cracking up to approximately 300mrn from the haunches and
catwalks. Figures 3.5 and 3.6 display sofiening of the load-strain curves of reinforcing b a n near
the haunches. The softening was mainly due to the formation of fine cracks and opening of
existing cracks. At 225kN/m2 diagonal LVDTs adjacent to the haunches captured the
development of the new cracks (see Figure 3.32). The cracking of the invert slab near the
catwalks at the same loading was recorded by strain gauges SlOB and S14B and their load-strain
curves are shown in Figures 3-12 and 3.13. Since the stiffness of the slabs was reduced due to
additional cracking, the moment was redistributed to the walls. Thus. the corresponding strain

TEST OBSERVA TIOM AND RESULTS
increments captured near the midspan of both slabs were also reduced. This can be observed in
Figures 3.2 and 3.3, which depict load-strain curves recorded by gauges N 12B. N 13B and N 14B.
The new cracks were different in their orientation from previously developed cracks.
Figure 3.5 1 pictures cracks in a specirnen sofit at a reduced load of 25 1 k ~ / m ' . Newly developed
cracks. which were located in the roof slab near the haunches were partially inclined and
classified as flexure-shear cracks. They propagated up to SOOmm towards the exterior face.
A number of fine cracks found on the interior faces of both slabs reduced the crack
spacing while the maximum crack width remained O. 15mm. Photos of the roof and invert slab are
shown in Figures 3.59,3.60,3.67 and 3.7 1.
New cracks were also found in the soffit of both walls. Al1 wall cracks were fleurai and
they propagated up to l5Omm towards the interior faces. Most of the fine cracks in the exterior
faces of both walls were 0.05mm wide with one crack in each wall that was 0.1 mm wide. The
cracking of the walls is shown in Figures 3.75 and 3.79.
In addition, the formation of flexural-shear cracks was captured by Zurich gauges and the
corresponding average concrete surface strains are shown in Figures 3.46 and 3.47. A maximum
shear stnin of 5 19 ps was noted at the second grid east of the west haunch at same location where
the flexural-shear crack was formed. Figure 3.38 shows the load-strain curves obtained by Zurich
readings. A significant increase in shear strains was also noted at the east haunch and catwalk and
can be seen in Figure 3 -39.
Zurich strains along the interior edges of the roof and inven slabs were increased up to
1585 ps while the maximum strain along tension faces of both walls was 1032 ps.
3.2.5 LOAD STAGE V
As the load was increased new shear cracks were formed in the roof slab at the east and
West haunch. At a load of 3 0 3 k ~ / m ' Figures 3.7,3.9 and 3.30 depict sudden slope changes of the
load-strain curves captured along a reinforcing bar in the roof slab at the West haunch. Similar
observations were made at the east haunch when an additional load of 3kN/rn2 was applied (see
Figures 3.8. 3.9 and 3.30). At the load of 339k~/m'. rein forcing reban at the West haunch staned
to rapidly elongate. In addition, diagonal LVDTs D2 and D3 recorded opening of shear cracks at
the same location (see Figure 3.32). Shear cracks in the invert slab were captured by LVDTs D5
and D8, which load-strain curves are shown in Figure 3.33. Widening of the cracks followed by
excessive elongation of the reinforcing ban in the invert slab is shown in Figures 3.14. 3.15 and
3.3 1. It was evident at this stage that the specimen was close to failure and the load stage V was

TEST OBSER VA T?ONS AND RESUL TS
set at 342k~lm'. To prevent further opening of the shear cracks the load was first reduced to
323kN/m2. Since elongation of the reban and the crack opening continued. the load was funher
reduced to 302kN/m2.
One of two cracks in the roof slab adjacent to the west haunch was observed at the
previous load stage. With additional loading, this crack propagated diagonally up to almost the
full depth of the roof slab (see Figure 3.52). A second, 0.35mm wide crack propagated diagonally
from the haunch/slab interface towards the exist ing flexural-shear crack. Corn bined together these
two cracks forrned an inclined critical shear plane.
A similar crack pattern was noted in the roof slab at the east haunch. A diagonal 0.3mm
wide crack intenected the fleure-shear crack. creating a full depth shear plane.
Significant shear cracking was also noted in the invert slab near the east catwalk.
However, the maximum crack width rneasured at this quadrant was only O. Imm.
The number and width of flexural cracks increased further at this load stage. The
maximum width of the cracks in the roof and invert slab at midspan was 0.3mm (see Figures 3.61
and 3.72). Additional cracking was noted in both walls while some of the wall cracks opened up
to 0.2mrn.
Figures 3.48 and 3.49 display concrete surface Zurich strains. Shear srrain at the second
grid east of the West haunch increased from 5 19 ps to 1407 p. A considerable increase of shear
strains was also noted near the east haunch. Maximum tende strains at the roof and the invert
slabs were 1813 pi and 1990 p, respectively. Tensile and compressive Zurich strains also
increased at both walls, ranging from -775 ps at the interior face of the West wall adjacent to the
catwalk and up to 1467 ps at the enterior face of the east wall.
3.2.6 LOAD STAGE VI
Once the specimen was subjected to a previous maximum load of 342 k~lm'. large
strains were detected at al1 four quadrants. Excessive elongation of rebars and the widening of
cracks at the west haunch were observed just prior to shear failure at 347k~lrn'. The failure was
sudden and was followed by a du11 sound. To ensure the safety of personnel and protect
instrumentation. the specirnen was quickly unloaded.
Failure occurred in the roof slab adjacent to the west haunch (see Figures 3.62 and 3.63).
Photos of the failure section are illustrated in Figures 3.81 to 3.84. The criticai shear crack
described at the previous load stage opened up. The aggregate interlock strength was reduced
until the additional shear could not be carried over the gap. At the same time the crack also

TEST OBSERVA TIONS AND RESUL TS
propagated along the exterior reinforcement up to approximately 650rnm West of the midspan. At
the other side of the failure plane the concrete was extensively cracked as a result of dowel action.
A similar crack pattern was obse~ed on the slab soffit. The exterior face exhibited two ver?ical
cracks between the second and third jack set from the West side. Two wide vertical cracks were
also noted on the interior face of the roof slab at the intefiace with the West haunch.
Maximum total deflection of slabs prior to failure was 22mm (Figure 3.24). LVDTs
spanning between the walls recorded that the mavimum deflection between walls was 12.8mm
(Figure 3.25). Photos presented in Figures 3.68, 3.73. 3.76 and 3.80 picture cracks in the slabs
and the walls.
3.2.7 L O D STAGE VI1
I t appears that the specimen could still carry a considerable load. Thus, the specimen was
reloaded in the post-faiiure stage. Only the final load was recorded through the data acquisition
system and the necessary photos were obtained.
As the load was increased. the wide shear crack opened and slipped over the already
established failure plane at a load of 247khf/m2. Spal led concrete and exposed rebars were noted
on the exterior face of the roof slab. Exterior 15M bars were bent as a result of the dowel action.
Concrete was extensively cracked at the haunchhoof slab interface. Figures 3.64 and 3.85 to 3.88
show photos of the shear failure crack and the associated spalls and cracks in the roof slab.
3.2.8 ADDITIONAL REMARKS
Data collected from LVDTs and strain gauges was represented by twenty point curves
and are surnmarized in Appendix B.
Most of the photographs indicate approximate applied loading, which was measured by a
pressure transducer at various load stages. Load cells recorded more accurate applied loading than
that shown on the photos.

TEST OBSERVA TIONS AND R E S U TS
Figure 3 2 - Roof Slab Reinforcement Sfrains At Midspan
Figure 3 3 - Roof Slab Reinforcement Sîrains Near Midspan

TEST OBSERVA TfONS AhrD RESULTS
Figure 3.4 - Roof SIab Reinforcernent Strains
-200 O 200 400 600 800 1000 1200 1400 1600 1800 Reinforcement Strain ( uE )
Figure 3.5 - Roof Slab Reinforcement Straim Near West Haunch

TEST OBSERVA TIONS AND RESULTS
-200 O 200 400 600 800 1 O00 1200 1400 1600 1800 Reinforcement Strain ( uE )
Figure 3.6 - RoofSIab Reinforcement Srrairu Neur East Haunch
Figure 3.7 - Roof Shb Reinforcement Struinr ut W a t Haunch

TEST OBSERVA TIONS AND RESWL TS
Figure 3.8
-25 -20 -15 -10 -5 O 5 1 O 15
Reinforcement Strain ( uE )
- Roof SIab Reinforcement Srrains at East Haunch
i 0 --- ---- -- -- O 1 O0 ZOO 300 400 500 600 700 800 900 1000
Reinforcernent Strain ( uE )
Figure 3 -9 - Roof Stab Reinjôrcemenr Sauim at Haunches

TEST OBSERVA TIONS AND RESUL TS
Reinforcernent Strain ( uE )
Figure 3.1 0 - Invert Siab Reinforcement Strains A t Mihpan
Figure 3.1 1 - Imert Siab Reinfbrcernent Strains Nem hlidspun

TEST OBSERVA TfONS Ah/D RESUL 7S
Figure 3.1 2 - Invert Sfab Retn$iorcement Strainr Near West Canvalk
O - / --
-200 O 200 400 600 800 1 O00 Reinforcement Strain ( uE )
Figure 3.13 - Invert SIab Reinforcement Sirains Near East CatwaIk

TEST OBSER VA TIONS AND RESULTS
-40 -30 -20 -10 O 1 O 20 30
Reinforcement Strain ( uE )
Figure 3. t 4 - Invert SZab Reinlorcement Sîraim ut Catwalks
250 E S ; zoo
. 1
. .
i - I
O 50 100 1 50 200 250 300 350 400 Reinforcement Strain ( uE )
Figure 3.15 - Imert Stab Reinforcement Strains ai Cam&

TEST OBSER til TfONS AND RESUL TS
-800 -600 -400 -200 O 200 400 600 800 1000 1200 1400
Reinforcement Strain ( uE )
Figure 3.16 - West Wall Reinforcement Strains at fhe Haunch
Reinforcement Strain ( uE )
Figure 3.17 - East WaII Reinforcernent Straim at the Haunch
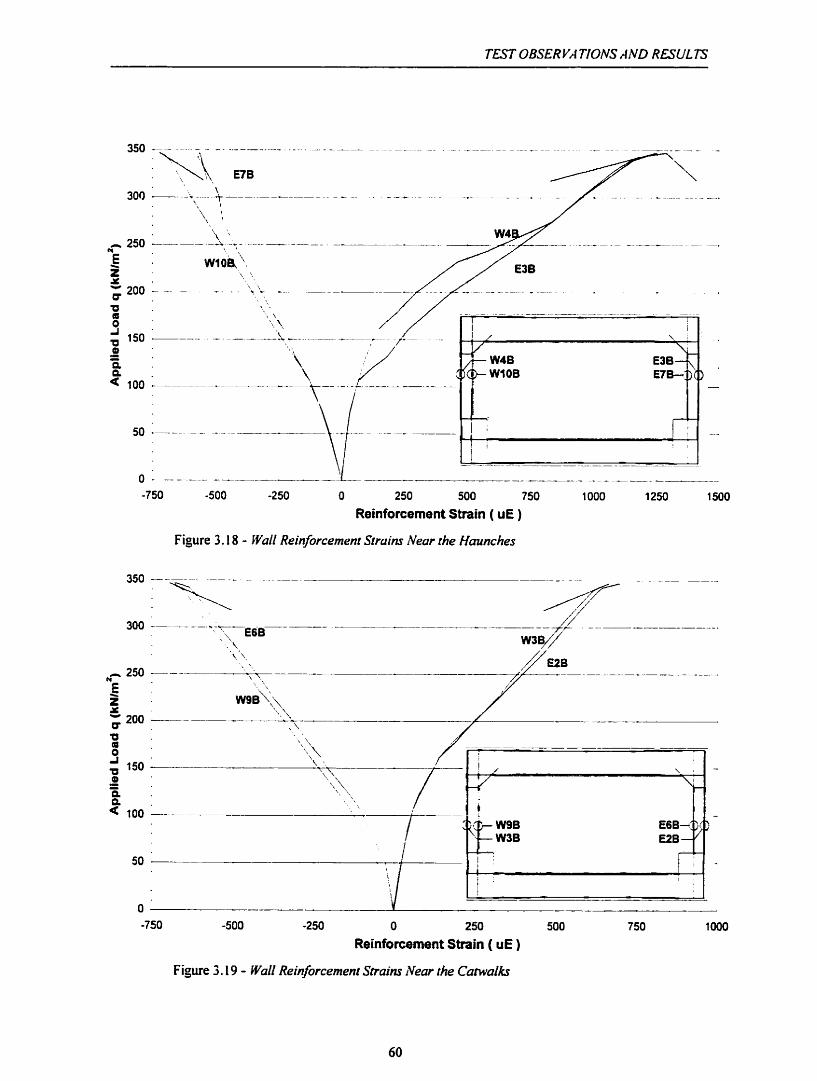
TEST OBSERVA T!OiVS AND RESUf. TS
Figure 3.1 8 - Wall Reinforcernent Srrains Near the Haunches
-750 -500 -250 O 250 500 750 1000
Reinforcernent Strain ( uE )
Figure 3.19 - WuIl Reinforcemenf S~ruins Near the Caiwalks
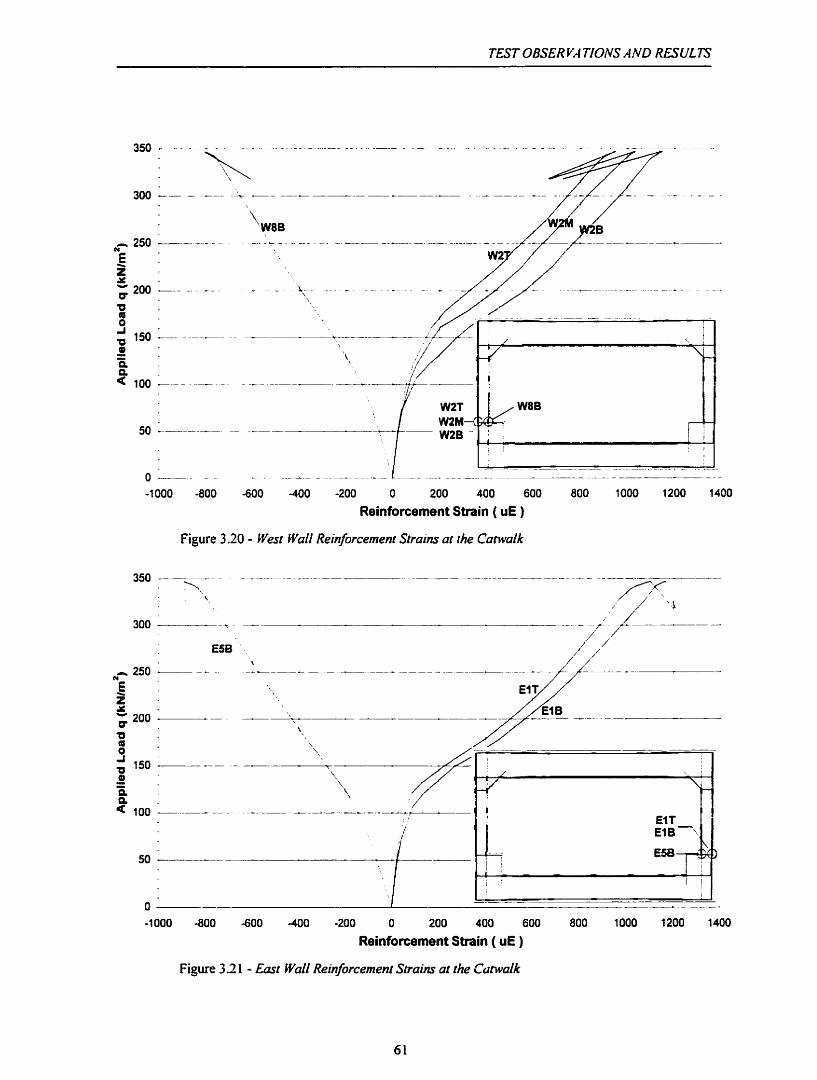
TEST OBSER VA TIONS AND RESUL TS
Reinforcement Strain ( uE )
Figure 3 3 1 - East Wall Reinforcemen Straim at the Cutwafk

TEST OBSER FA TlONS AND RESULTS
Figure 3.22 - West Wall Reinforcement Slrains at the Haunch

TEST OBSER VA TIONS rl ND RESUL 75
Figure 3.24 - T o d DeJlections Between lnrerior Opposife faces of the Slabs
0 O 2 4 6 8 10 12 14 16 18 20
Defiection ( mm )
Figure 3.25 - Total D@ectiom Between Interior Opposite Faces of the W u h

TEST OBSERVA TIONS AND RESUL TS
O 200 400 600 800 1 O00 1200 1400 1600 1800 2000 Concrete Surface Strain ( uE )
Figure 3.26 - Roof Sfub Concrere Slraim at the Mihpan
Concrete Surface Strain ( uE )
Figue 337 - Roof Shb Concrete Strains at the Mitirpan

TEST OBSER Y..l TIONS A ND RESUL TS
O -100 -200 -300 400 -500 -600 -700 -800 -900 Concrete Surface Strain ( uE )
Figure 3 39 - Invert Slab Concrete Straim a! the Midpan
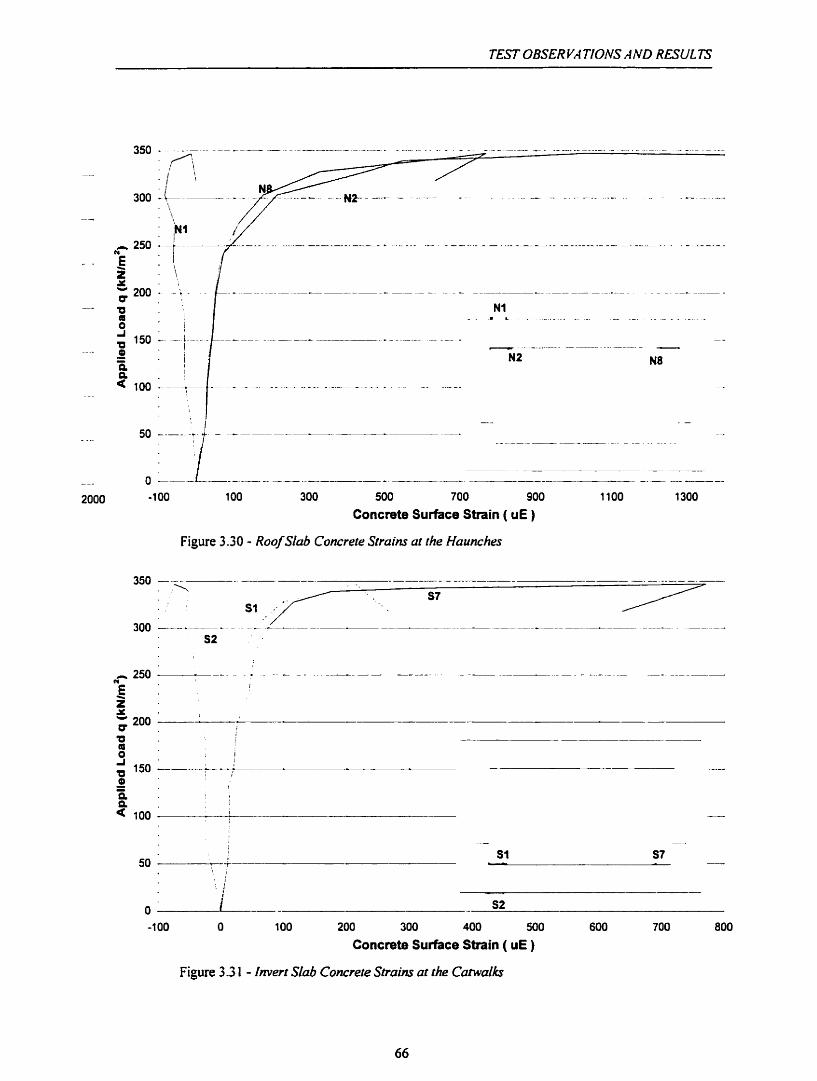
TEST OBSERVA TIQNS A ND RESUL TS
-1 00 100 300 500 700 900 1100
Concrete Surface Strain ( uE )
Figure 3.30 - Roof SIab Concrete Strains at the Haunches
O S2
-1 00 O 100 200 300 400 500 600 700 800
Concrete Surface Strain ( uE )
Figure 3.3 1 - Imert SIob Concreze Straim at the Catwu2k.s

TEST OBSERVA TIONS AND RSUL TS
-100 1 O0 300 500 700 900 1100
Conctete Surface Strain ( uE )
Figure 3 -3 2 - Roof Slob Concrefe Struinr - Diagonals
C f - ----- , ,
Concrete Surface Strain ( uE )
Figure 3 -33 - Invert Shb Concrete Srraias - Diagonals
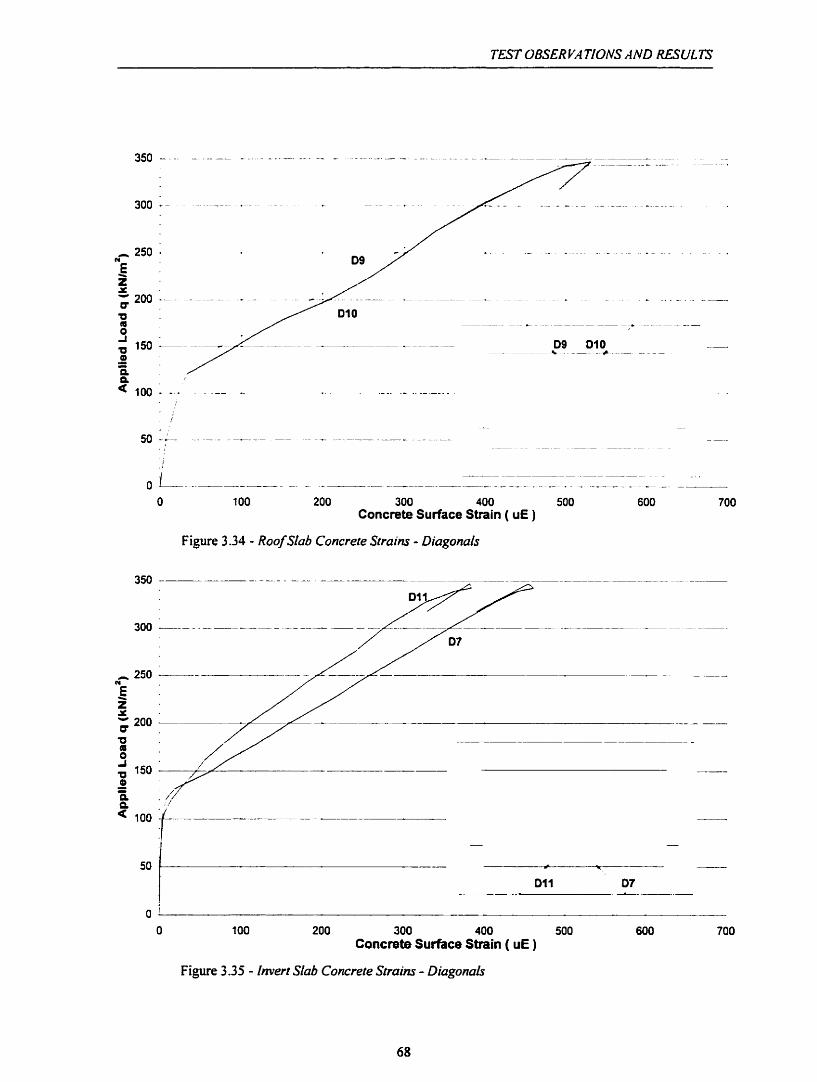
TEST OBSERVATIONS AND RESULKY
O 100 200 300 400 500 600 700 Concrete Surface Strain ( uE )
Figure 3.34 - Roof SIab Concrete Sfrains - Diagonais
O 1 O0 200 300 400 500 600 700 Concrete Surface Strain ( uE )
Figure 3 -35 - Invert Slab Concrefe Strains - Dianonals

TEST OBSERVA TIONS AND RESU TS
200 400 600 800 1000 1200 Concmte Surface Strain ( uE )
Figure 3.36 - Wall Concrete Straim - Exterior Face
O O -200 -400 600 -800 -1 O00 -1 200
Concrete Surface Strain ( uE )
Figure 3.37 - Wall Concrere Sirah - interior Face

TEST OBSERVA TIONS AND RESUL TS
Figure 3.38 - Roof Slab Shear Straim by Zurich Gauge
LOAQ STAGE V
LOAD STAGE IV
LOAD STAGE Ill
LOAD STAGE II -
tr f - -- LOAD STAGE I - -
8 6 4 2
II - --- O
O 1 O0 200 300 400 500 600 700 800
Shear Strain ( uE )
Figure 3.3 9 - invert Stab Shecar Straim by Surich Gauge

TEST OBSER Y,.I TiONS AND RESUL TS
strains in ps
Figure 3 . j O - Zurich Strains Parallel and iVormal to hèutral Axes ot q = -3kr~/d
1
I I ?
1
I .,?
1 *a*
1 ' i l 1 1
? a 1
j la*
P l,?
I I a-
? .,, 1
1 a*
i =' lu
4 1 1 1- 1 *'
/ 1..
C -
i .b &I l b P? ni * * n n t n e m s
a 4 a1 imb m i n* u r r a i 1.1 U U P. b I V U i l . ma a? L I 4b a
u 1.- ~b 811 m i n i u n i r i a? S. U II II U 0 1 U J U U . l . . . . .U *I I I 8 M i U il*
strains in ps

TEST OBSER V . TIONS AND E S U L 73
i 9 1.0 0 uo a P* a QI 0 n~ 0 ewr 0 r u 0 i w r m a 0 +ova 0 m a 0 rrr~ sr 0 a s a r u 0 a a u u i i r
strains in ps
J n . * - * f . = m 1 ~ . I - * a m INII * - I I r u e r u 0 l m . * ** d :r 'I 'I j. 1
Figure 3.42 - Zurich S~rains Paraifel and Normal to .Neurrd .-Lxes at g = 1 3 2 k ~ k 1 I I 1 1 1 3 j,
b 0 0 b 0 I I 4 . a a d
strains in ps
Figure 3-43 - D i a g o ~ l Zurich Strains at q = I X?khV&

TEST OBSERVA TIONS AND RESUL TS
. . . . j à : 3 : - i t ? a a -. .* . L.. a.. Il O lt. . U e t
strains in ps
strains in ps

TEST OBSERVA TIONS AND RESULTS
I r
II
i l
t t t
w
tir . a
1
I
1 *(a
' m I
1
n r ? I I I I
1 1 '.
1.1
I iU
' m. I
lu . 1
I - I ! '1
mi
1 ? / "
i 1 i i ? i i 4 : i 4 1; ,-a. -B. .B. ,.... VIL.a a r e + i . i j i i : ; .
strains in ps
strains in ps
ui M A Di iu .a U U 7 1 4 4.J Qi .ri.-* di Q1 1U u L I # + I . . . m . . . . . . m
T 1 'I 'J 1 Figwe 3.47 - Diagonal Zurich SnaUrs ut q = 274khr/k

TEST OBSER VA TIONS AND RESUL TS
sûains in ps
*U lia l n a iu 0 u t l nia a .ni l m . . 4s ( 1 . 0 M. a i i i j i j ;m a. a
œ . . ,. m.. II.. m,. U * -8. m. a, 7 t 2 i ; i i
strains in ps

0 0 0 O 0 O * O 0 0 ;,; g O O O 0 0 P O P ; m m * p " "' " ' O g
FIi O C I i - O
- 50.0 OC'O
/- soo EO'O y

TEST OBSER VA TIONS AND RESUL TS
/- crack width in mm
- 0.05 - 0.10 - 0.06 1 aos 4
: 4 0.05
1 Figure 3.52 - Crack Patrern on SoBt of Specimen as q = 347kiV/m2

TEST OBSERVATIONS AND RESULTS
Figure 3.53 - Initiai Sem - q = O ~ / m '
Figure 3 5 4 - Initia2 Settq - q = O kiV/rn2

TEST OBSERVA TIONS AND RESUL TS
Figure 3.55 - LoadStage I - q = 73 >w/rn2
Figure 3 S6 - L o d Stage I - q = 73 kN/m2

TEST OBSERVA TIONS AND W V L TS
Figure 3.57 - Load Stage I l l - q = 201 w/m2
Figure 3 -58 - Load Stage III- q = 201 kWmL

TEST OBSERI.'.4 TfOiVS AND RESUL TS
Figure 3.59 - L o d Stage N - q = t 74 kN/m2
Figure 3 -60 - L o d Stage IV - q = 2 74
81

TEST OBSER I.;I TlONS AND RESUL TS
Figure 3.6 1 - LoudS~oge V - q = 342 kN/m2
Figure 3 -62 - Loud Sfage M - q = 347 kM/rn2

Figure 3.63 - LoudStage YI- q = 317 ~ / m '
Figure 3.64 - Load Stage VII - Pust-FaiIure Stage

TEST OBSER K4 TIONS AND M U L TS
Figure 3.65 - Load Stage I - q = 73 kN/m2 -Roof Shb
Figure 3.66 -LouàStage LU - q = 201 i~ / rn~-~oof SM
84

TEST OBSERVA TIONS AND RESUL TS
Figure 3.67 -Load Srage N - q = 27-1 kN/m3-~oof S I U ~
Figure 3 -68 -Lod Stage YI - q = 34 7 kiM/mL~oof ~2ab

TEST OBSER If.> TIONS AND RESUL TS
Figure 3.69 -Load Stage I -q = 73 kN/m2 -Imert Slob
Figure 3 -70 -Lood Stage 111 - q = 20 1 w/M'-lnvert Shb

TEST OBSER t :4 TIONS .JND RESULTS
Figure 3.7 1 -Load Stage IV - q = 2 71 kN/m2-lnvert Siab
Figure 3.72 - Load Stage V - q = 342 kA?/m2-litvert Slab

TEST OBSER 1 2 TIOiVS .WD KESUL TS
-- - -- - -
Figure 3.73 - L o d Stage M - q = 347 khVm2-lmtert SIab
Figure 3 -74 - Load S'ge iLl-q = 201 kiV/m2- Emt Woll

TEST OBSERVA TlOn(S AND RESUL TS
Figure 3.75 -Lod Stage IV -q = 2 74 kN/m2- Eart Wall
Figure 3 -76 - Load Stage VI - Faihe Lood q = 34 7 kN/rn2- E u t Wall

T m OBSER VA TIONS AND RESUL 75
Figure 3.77 -Laud Stage I -g = 73 kN7m2- West Wu/\
Figure 3 -78 -Load Stage Ill -q = 201 kN/rn2- Wesr Wuil
90

TEST OBSER VA TIOiVS ArW RES L'L TS
Figure 3.79 -Lwd Stage N- q = 271 kh?./rnt- West Wall
Figure 3 -80 - L o d Stage YI - Failwe Lood q = 34 7 kAYm2- West Wall

TEST OBSER C :4 TIONS AND RESUL TS
Figure 3.82 - E a t End of Roof Slab - Bottom Surjace - FaiIure L o d dq = 317 RN/rn2

TEST OBSERCX TIOM AhrD RESULE
Figure 3.83 - E m End of Roof Slub - I'erior Face - Failure Load q = 347 kA?/m2
Figure 3.84 - East End of Roof SZab - Exterior Face - Faiiwe L o d q = 3 4 7 kN/m2
93
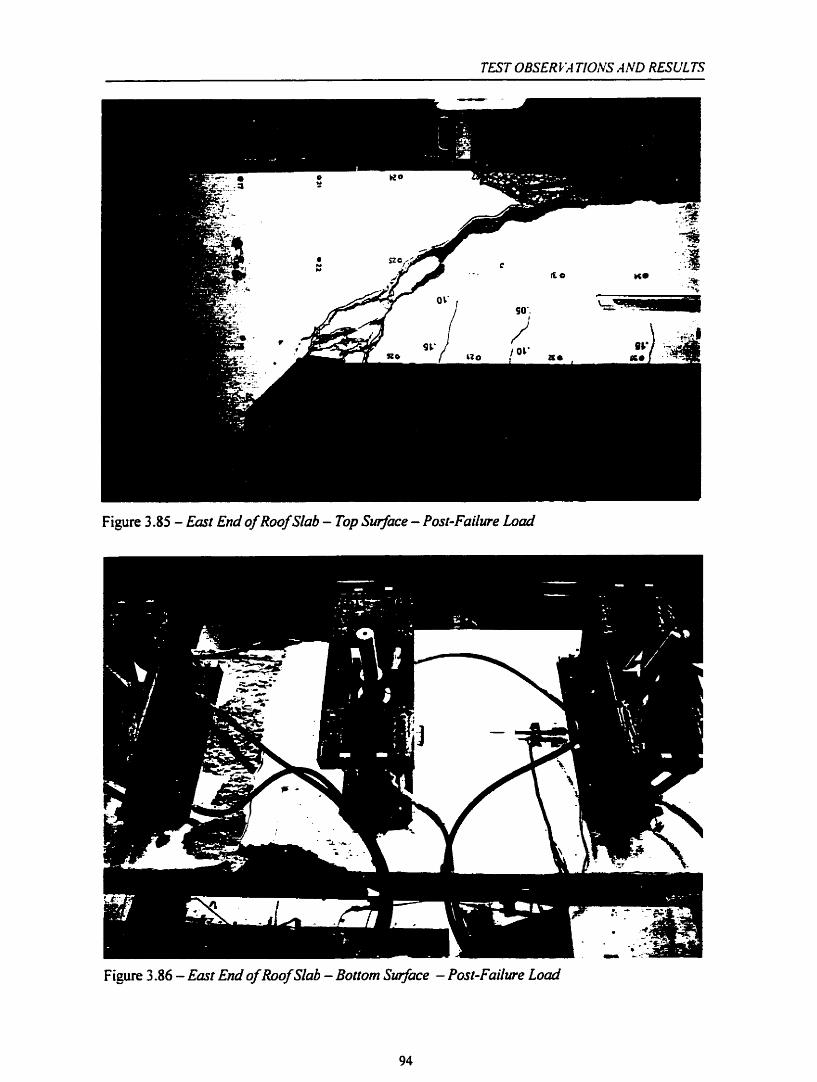
TEST OBSER t;l TIONS ri ND RESUL TS
Figure 3.85 - Eaîl End of Roof Slab - Top Sqace - Post-Failwe Load
Figure 3 -86 - Emt End of Roof Shb - Botîom Surface - Post-Failure L o d

TEST OBSER L'A TION AND RESULTS
Figure 3.87 - East End of Roof SIab - Errerior Face - Post-Failure Lod
Figure 3 -88 - E m End of RwfSub - hierior Face - Post-FaiZwe L o d

4. Discussion of Test Results
This chapter describes computer modeling by a non-linear firme analysis program
TEMPEST. The shear strength of the specimen is calculated using different North American
Codes. The test results are also examined. Lastiy, test and cornputer results as well as the code
estimates are compared and discussed.
4.1 COMPUTER MODELING BY TEMPEST A non-linear frame analysis program, developed at the University of Toronto by Prof.
Frank Vecchio was used to tind the flexural capacity of the specirnen. the member forces, the
displacements and the particular strains. The prograrn utilizes an iterative procedure since there is
no direct way to find the forces and displacements when members consist of materials that e'diibit
non-linear behavior. The stiffness of each member is calculated by bisection-analysis and the
stiffness method is applied at each iterative step. The Ioad is applied in increments and the
prograrn created the result file at each load step.
4.1.1 MODEL
Figure 4.1 illustrates the computer model used to run the program. The second order
effects, the softening and cracking of concrete, and the yielding of steel bars were accounted for
while the shear effects were ignored. Each member was modeled using eleven to sixteen concrete
layers and one to four reinforcing layen. For example, member 1 located in the roof slab left of
the midspan consisted of thirteen 50mm thick concrete layen, and top and bottom steel layen
which represented 1 SM and 20M reinforcement (see Figure 4.1). Occasionally, two reinforcing

DISCUSION OF TEST RESUL TS
@) - joint numbar
@l - memkr numkr
2 0 8 m - memhr longth ,
I 9 l I
Cross section of member 1
Figure 4.1 P
- Cornputer hfodel of Specimen Used to Rm Program TEMPEST
Figure 4.2 - Moment Diagram and Depected Shape or q=3~4ki%/m'

DISCUS?ON OF TEST RESULTS
layers were modeled at the same rnember depth to properly represent the splicing of different
reinforcing bars.
Since the specimen and the applied loading were symmetrical. it was only necessary to
rnodel one side of the specimen. The other side was substituted with proper supports at the
midspan, which allowed vertical deflections while rotations and horizontal displacements were
restrained.
An additional support was introduced at the boaom left corner. which restnined infinite
displacement of the model in the y direction. The lefi half of the specimen was modeled with 33
mernbers defined between 34 joints.
The uniform loading was applied on the roof and the invert slab rnernbers. Concentric
forces, which replaced uniforrn loading left of the wall centerline. created moments when they
were shifted from their original location to the corner joints.
The three input files are printed in Appendix C. The first file defines the range of load
steps and modes in which the TEMPEST program was executed. The second file describes the
structural components of the rnodel. including geometry and material properties. The last file
defines the loading pattern being applied to the model. The TEMPEST prognm could be
executed only if al1 three files were input properly.
RESULTS
Figure 4.1 depicts a moment diagnm and the defoned shape of the lefi side of the
specimen. subjected to a uniform loading. of 3 4 4 k ~ l m ~ . From the load-deflection curve presented
in Figure 4.3. it can be observed that flexural failure of the specimen was predicted to occur at
635 k ~ l m ' and that this flexural failure would be associated with very large deflections (over
2OOmm). Yielding of reinforcement was noted fint at the midspan of the roof slab at 490 k~lm' .
The invert slab reinforcing ban yieided at 5 10 k ~ l m ' while the yielding of the exterior wall
reinforcing bars occurred after reaching a load of 541 k~lm' . Figure 4.4 displays load-strain
curves along reinforcing bars at the midspan of both slabs and at the exterior layer of the wall. In
addition. cracking occurred in the roof and in the invert slab at 62.5 kN/m2 and 72.9 kN/rn2,
respectively, while signs of wall cracking were noted at 83.3 k~lm'.

DISCUSION OF TEST RESULTS
-
O 25 50 75 1 O0 125 1 50 175 200 225 250 Deflection ( mm )
Figure 4.3 - Total Deflection of both slabs
o r O 500 1 O00 1500 2000 2500 3000 3500 4000 4500 5000
Reinforcement Strain ( uE )
Figure 4.4 - Reinfo~ement Strains at Midspan of Slabs and at Wall

DIXUSION OF TEST RESUL TS
4.2 CODE PREDICTIONS
The shear strength of the roof and invert slab was predicted by different North American
Codes. The distribution of member forces was obtained from the TEMPEST results. Once the
moments at member joints. modeled to run TEMPEST are known, it is easy to find moments
anywhere on the slabs or the walls. However. moments would be obtained even more easily if
locations of inflection points were known and the roof and invert slabs of the box structure were
treated as simply supponed beams with supports at inflection points. The maximum moment at
midspan MTEYPEsT, found by the TEMPEST program, was p ~ % . where L was the distance
between the inflection points (see Figure 4.5). Therefore. the distance from the centerline of the
specirnen to the infiection point LQ would be:
Figure 4.6 shows how the location of inflection points moved at the first cracking of the
concreie and near yielding of the reinforcement. In the range from 290k~lm' to 450k~lm'. where
shear failure is expected to occur. the inflection points stayed essentially fixed. Thus, for the
purpose of Bnding the shear failure load. which was assumed to be in the same range. it was
reasonable to assume that the inflection points in the roof slab and the invert slab were located
1184mm and 2086mm. respectively. frorn the midspan of each slab. Bearing this in mind,
moments in the roof and invert slab could be expressed in the following rems:
where: p is the unifom loading per unit width
V and M are the shear forces and moments at distance x from the midspan while
L was the distance between inflection points.

DISCUSfON OF TEST RESUL.75
-4 UZ=2086mm %
Figure 4.5 - Moment Diagram and lnflection Points
- - --
point of inflection -----CL.--.
! . . 1 . .
distance from CL to inflection point ( m ) Figure 4.6 - Location of Infiection Points

DISCUSION OF TEST RESUL TS
42.1 ACI-95 CODE
Roof Slab-Clause 1 1.3.1.1
According to clause 1 1.3.3.1 the critical shear section was located at distanced from the
support. In this case, critical sections would be located at distance d from the interface of the
haunch and the roof slab (see Figure 4.7).
Using expression 1 1-4 of AC1 Code
Vc =0.16ïJf,b,d = 0 .167f ix960~615 = 6 6 l k ~
since critical section was 15 15mm away from midspan
Invert slab-Clause 1 1.3.1.1
Critical sections were located at a distance 595rnrn inward of cahvaiks or 1465mm on
each side of the rnidspan. Therefore:
640 p z - = 437hVl m 1 -365
By Clause 1 1.3.1.1, ACI-95 Code predicts that both the roof and the invert slab would
fail in shear when the load was q==SjkNlm.

DISCUSION OF TEST RESUL TS

DISCUS/Ohr OF TEST RESUL 75
Roof Slab-Clause 1 1.3.2.1
The shear-moment ratio. expressed in term of the distance to the centerline, was
previously derived such that:
X - - 151s 1 =- L' x ' ( 2 1 8 4 ~ 2)' 1515' 817 - - - -- 8 2 8 2
By the clause 1 1.3.2.1, the expression for shear strength was slightly modified while the
critical sections remained at the same locations.
but must be less than
Invert Sla b-Clause 1 1.3.2.1
which is less than

DISCUSfOAf OF TEST RESUL75
t here fore
Thus, this expression estimated the shear failure of the roof siab at q = 46jkN/nt2.
4.2.2 AASHTO CODE
Roof Slab-Clause 5.13.5.3
Following the AASHTO expression. similar to AC1 Clause 1 1.3 2.1. the estimated shear
strength of the roof slab was
It had to be Iess than
but not Iess than
Invert Slab-Clause 5.14.5.3
The shear force-moment ratio at the critical section was determined earlier as

DISCUSION OF TEST RESLJL TS
Therefore the shear strength was
and Y, must be at teast
Thus:
AASHTO Code-Clause 5.14.5.3 predicted that the specimen would fail in flexure since
the shear failure load is higher than the flexural failure load obtained by TEMPEST.
Roof Slab-Clause 11.3.5.2
Expression had to be modified to eliminate safety factors. such that shear strength of roof slab is
Where: &6 1 h m
bW=960rnm
The shear strength of the roof slab would not be tess than

D/SCWS/ON OF TEST RESUL TS
Therefore
Invert Slab-Clause 1 1.3.5.2
but must be greater than
By Clause 1 1.3.5.2 of the CSA Code. specimen was eapected to fail in shear of the roof
slab at 366k~lrn'.
4.2.4 GENERAL METHOD (CSA-94, ASSHTO-94,OHBDC-91)
Roof slab
The effective shear depth could be calculated either as 0.9d or as a distance between
compression and tension resultant fortes due to flexure. From Figure 4.8
d, =593ntrn

DISCUSION OF TEST RESULE

DISCUSIUN OF TEST RESUL ï3
Thus. the critical section was located 593mm away from the haunch or 1537mm fiom the
midspan and the corresponding shear and moment could be calculated from previously
determined equations.
The crack spacing parameter s: was to be taken as d,. or the maximum spacing between
the crack control reinforcement, whichever is smaller. Therefore. s, was taken as 552mm, which
was the distance between the top and bottom Iayer of reinforcement (see Figure 4.8).
Equations for shear capacity and longitudinal strains could be simplified to
0 . 5 ( N I + V , c o t Q ) + M , I d , . - A p f, 0 . 5 V f c o t B + M , Id, .
where values of q and ,û are to be determined from Figure 1 1-2 or Table 1 1-2 in the CSA-94
Code or equivalent Figures and Tables in the AASHTO-94 and OHBDC-9 1 Codes.
If longitudinal strain was assumed to be = 1.3 x 10" 9 P = 0.134 and O= 50.7"
Then:
Since assurned longitudinal strain was less than the calculated strain, an additional step was
required.
For E,= 1.32 x IO-^ + ,û= 0.133 and O= 50.8"

DISCUSIOiV OF TEST RESUL TS
Calculated longitudinal strain was the same as the assumed strain, therefore
Three additional sections at distances O.IL, 0.4L and 0.6L from the centerline were
checked. Also, a section where four 20M bars developed full yield stress. was analyzed. Results
are summarized in Table 4.1 and illustratrd in Figure 4.9. Frorn this Figure it can be noted that
the shear failure would occur at distance di- from the haunch at 344k~lrn'. Table 4. I also shows
the maximum shear resistance if al1 fourteen 20M bars would be terminated at the ends of the
roof slab.
Invert Slab
The shear capacity of the invert slab was determined in a sirnilar fashion.
From figure 4.8 it could be seen that
d,.=S 7Omm
s,=53 5mm
Therefore. the critical section was located 570mrn away from the catwalk or 1490mm away from
the midspan.
The shear and moment at this location were:
The expression for shear capacity was simplified to

DISCUSION OF TEST RESUL TS
- - yielding of longitudinal reinforcement
" - case when al1 t4M20 bars are tefminated at the ends of the slab
x - distance measured h m the midspan of the slab to the anaiyzed section p - iinear unifom ioading ( = q x 0.96 ) p and 8 are obtatned from Table 1 1-2 in CSA-94 Code
Table 4.1 - Generd Method - Load Capacities al Drferent Sections in the Roof Slub
1 1152inm (td from cut off) 1
Figure 4.9 - Predicfed Shear Snength and Critical Section al the Roof Siab

DISCUSION OF TEST RESUL TS
Since the calculated longitudinal strain was smaller than the assumed one, further
calculat ions were not required, but one more step was executed to obtain a better estimate.
For &= 1.16 x 10" + ,&?= 0.141 and @= 49.5"
O-jV, c o t e + l u , I d , 0 . j ~ j 2 1 ~ 1 0 ~ ~ c o t 4 9 . 5 0 + 3 7 3 ~ 1 0 ~ /570 6 , = - - = 1 . 1 6 ~ 1 0 - ~
E , d , 200x10~ ~ 3 7 9 5 x 1 0 ~ ~ Therefore
The shear-moment capacities were obtained at five locations and the results were
sumrnarized in Table 4.2. Figure 1.10 illustrates that the critical section was at a distance& from
the catwalk. The table also contains the results of the invert slab with al1 bars terminating over the
walis.
According to General Method specimen would fail in the roof slab in shear near the haunch at a
Ioad of 344k~/m'-

- yielding of longitudinal reinforcement
- case when a l 14M2O ban are leminated at Vie ends of Vie slab
x - distance measunxi from the rnidspan of the slab to the anaiyzed sedion p - linear uniform loading ( = q x O 96 )
p and (a16686rOPOa7ml ne are obtained from Table 11-2 in CSA-94 Code
Table 4.2 - Grneral Method - Load Cupacities ut Different Sections in the Imtert Slub
1312mm (Id hom cut off)
+ -
chtical section --$ b
Figure 4.1 0 - Predicred Shear Strength and Crifical Section at the Invert Shb

DISCUSION OF TEST RESULTS
4.3 DISCUSSION OF TEST RESULTS
Through careful observation of the test results presented in chapter 3, it can be seen that
the specirnen progressed through 3 distinct stages.
The first stage ranged op to the loading of 107kN/m2 in which the specimen exhibited an elastic
nature. Localized cracks were noted only at holes in the slabs. Reinforcing strains captured at the
midspan of both slabs are shown in Figures 3.2 and 3.10. It can be seen chat cracking occurred
first at the mid-height of the specimen. Figure 4.1 1 illustrates the stress concentration in the
disturbed region around the roof slab tension hoie at midspan. An increase of strains due to this
stress concentration was captured by the stmin gauge N 13M. Thus. localized vertical cracks were
developed at the holes. Since these cracks did not influence the overall behavior of the specirnen.
their influence was neglected in funher discussion.
85ps at strain gauge N13M q=SOkNlrn 52ps at strain gauge N13f and NI38
-------------4---L-------- strain gauge N13M
reinforcing bar M20
stress trajectories
100mm diameter hole - tension rod
localized crack
Figure 4.1 1 - Increux of srruin due to stress concenrration uromd tension-rod hoie
At a load of 107kNlrnl. cracking becornes evident. From graphs presented in the
previous chapter it can be seen that cracking was more pronounced in slabs than in the wails. The
stiffness of the cracked slabs and walls was changd at the same time such that the ratio of slab
and wall stiffness was reduced. Thus, the moment was redistributed to the walls and the
inflection points were shifted towards the centerline. For instance, Figure 3.7 pictures stnins
observed at m i n gauges near West inflection point of the roof slab. Strain gauges along the
exterior and interior face indicate no cracking at this location. Therefore. the variation of dopes
DISCUSION OF TEST RESUL TS
and sharp points at the load-strain curves were mainly due to the moment redistribution between
slabs and walls which caused the shifting of the inflection point
Shear cracking and failure characterized the final stage. First. shear cracks were detected
by diagonal LVDTs at 225k~/rn?. Shear strains obtained at critical sections of the slabs are shown
in Figure 4.12. Based on load-strain curves, the same graph indicates that both sides of the roof
slab were close to failure near the haunches. In terms of shear strains, Zurich readings were
consistent with values obtained by LVDTs (see Figure 4.13). Considering that LVDTs were
mounted on the specimens bottorn surface while Zurich readings were obtained frorn the top
surface, the specimen behaved uni formly through out its height.
The observed failure was typical of a shear failure of large beams. After formation of a
critical shear crack. aggregate interlocking contributed significantly to the total shear strength. As
the shear crack widened the aggregate interlock strength was reduced until slippage occurred over
the crack. It is evident that longitudinal strains and corresponding crack widths depend directly on
the reinforcing ratio. Since the reinforcing ratio was only 0.56%. it definitely contributed to an
early shear failure.
Based on the figures presented in the previous chapter. it can be concluded that only a
smali amount of the load was required for a specimen to fail in shear from the time when
significant shear cracks were first noted. LVDTs. which recorded total deflections between slabs
and walls did not indicate that the specimen was near failure. Flexural cracking of the slabs and
walls caused much more sofieninç of the specimen than did the shear cracking just prior to
failure. Figures 4.14 to 4.17 illustrate strains along reinforcing bars in the roof and invert slab.
None of the principal reinforcing bars in the slabs reached their yield strains. The specimen was
carefully inspected just prior to failure. Only one 0.35rnm wide diagonal crack was found on the
bottom surface of the roof slab at the west haunch. This crack could be seen because a slice of the
box unit was being tested. Interior faces. which would be accessible for inspection in the case of
full-scale structures, did not e-xhibit any evidence of the shear cracks at the critical section.
Therefore. the full size box structure would not e.uhibit any signs of structural distress prior to
sudden fai iure.

DISCUSlON OF TEST RESUL TS
0 1 L u - - + -- - - - - --y ----- - ---- ---. O 200 400 600 800 1 O00 1200 1400 1600 1800 2000
Shear Strain ( uE )
Figure 4.1 2 - Shear Strain by L VD Ts
O 1 O0 200 300 400 500 600 700 800 900 1000 Shear Strain ( uE )
Figure 3.13 - Shear Siraiil by Zurich and L VDTs

DISCUSION OF TEST RESULTS
O 250 500 750 1 O00 1250 1500 1750 2000 2250
Reinforcement Stmin ( uE )
Figure 4.1 5 - Top Slab Reinforcement Sirains

DISCUSION OF TEST RESULTS
O 200 400 600 800 1000 1200 1400 1600 1800 2000 Reinforcement Sttain ( uE )
Figure 4.16 - lnverr Slab Reinforcement Struins
O -50 -1 O0 -1 50 -200 -250 -300 -350 -400 450 Reinforcement Strain ( uE )
Figure 4.17 - Invert Siab Reinforcement Straim

DISCWON OF TEST RESUL TS
4.4 COMPARISON OF TEST RESULTS AND CODE PREDICTIONS
The shear strengths of the slabs were estimated by different codes. and the corresponding
capacities are compared in the following section.
Since the TEMPEST program was executed with the shear mode switched off. it was
found ihat the specimen would fail in flexure at a load of 635k~/m? by yielding of the top and
boaom slabs. The cornputer mode! estimated a stiffer response than that displayed by the
specimen. TEMPEST adequately simulated a sofiening of the mode1 due to the cracking of the
concrete. The load at which cracking appeared was alrnost the same as the cracking load that was
recorded during testing. However, cracking of the walls and slabs was more pronounced.
The traditional AC! Code expression estimated that the invert and the roof slab would fail
in shear at the sarne time, Thus. shear failure was to occur at a distance d either from the
haunches or the catwalks. The second expression. which is described in Clause 1 1.3.2.1 predicted
that shear failure was to occur in the roof slab at a distance d from the haunches. The actual
faillure load of the specirnen was more than 30% lower than ultimate capacity calculated using
both expressions.
Unusually high shear strengths of both slabs were estirnated by the AASHTO Culvert
Design Method. which is described in clause 5.145.3. Thus. the specimen was expected to fail in
FIexure rather than in shear. According to the AASHTO CuIvert Design Method shear
rein forcement would not increase the load capacity of the specimen.
The Simplified Method in the CSA Code estimated lower values of shear strength than
previous codes. mainly because this method accounts for size effects. The predicted shear
capacity was 5% higher than the actual capacity of the specimen. Also. the location of shear
failure was correctly predicted by the Simplified Method of the CSA Code.
Only the General Method predicted that the specimen would fail at a load less than
350k~/rn?. Moreover, the estirnated shear capacity of the roof slab was only 1% less ihan the
actual capacity of the specimen. In addition, the General Method indicated that the invert slab had
a slightly higher shear capacity. which was confirmed by test observations thatthe inven slab was
also close to failure. The General Method proved to be sensitive not only with regard to the depth
of the slabs but also with regard to the reinforcing ratio. which at the critical sectionwas only
0.56%. Table 4.3 and Figure 4.18 summarize the predictions according to different North
American Codes.
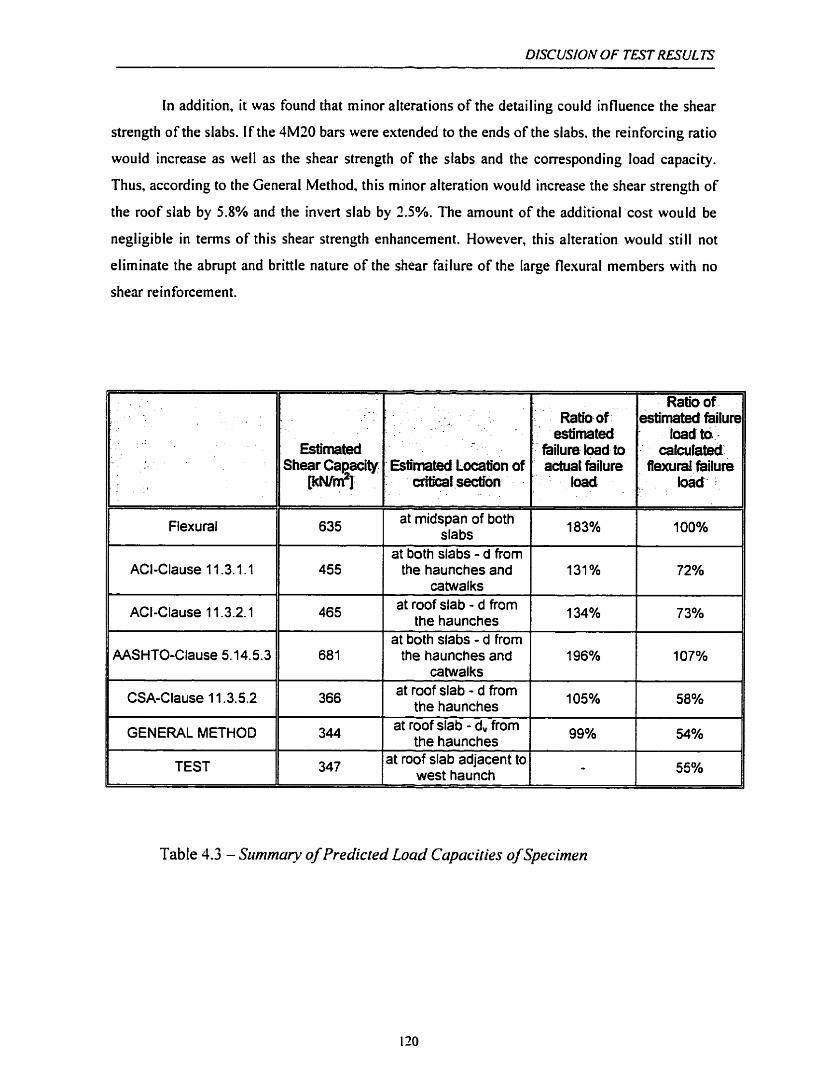
DISCUSION OF TEST RESUC 7S
In addition, it was found that minor alterations of the detailing could influence the shear
strength of the slabs. If the 4M20 bars were extended to the ends of the slabs. the reinforcing ratio
would increase as well as the shear strength of the slabs and the corresponding load capacity.
Thus, according to the General Method, this rninor alteration would increase the shear strength of
the roof slab by 5.8% and the invert slab by 7.5%. The amount of the additional cost would be
negligible in tems of this shear strength enhancement. However, this alteration would still not
eliminate the abrupt and brittle nature of the shear failure of the large flexural members with no
shear reinforcement.
1 GENERAL METHOD
Il TEST
635 1 at midspan of both --
slabs
Estimateci Shear Capacity
w ~ T
at roof slab - d from 465 1 the haunches 1 134% 1 73%
Ratio of estimated failure
loadta- . catculated
flaxural failure IO&. -
-
' Estimateci Location of aitical section
455
at roof slab - d from 366 1 the haunches 1 105% 1 58%
Ratio of esümatect
' hifure load to actuat faiiure
toad
131% at both slabs - d from
the haunches and catwal ks
681
72%
at roof slab adjacent to 347 1 west haunch 1
at both slabs - ci from the haunches and
catwa l ks
344
Table 1.3 - Sumrnury of Predicted Luad Capaciîies of Specimen
I
at roof slab - d, from the haunches
196% 107%
99% 54%

DISCUSJON OF TEST RESULTS
. - - - - * AASHTO BOX CULVERT METHOO
1 .. 681 kNImz \. i ,
T I
FLEURAL FAILURE
1 635kF4lmZ t I
. i I
I
I I
I I ! l
. . - . - . . l
OBSERVED SHEAR FAILURE CSA-Clause 11.3.5.2 347 kNImz
366kNIm2 GENERAL METHOD '
344kNlmz I
I
/ \ OBSERVED POST-FAILURE
Figure 4.1 8 - Code Predictions and Observed Sheur Fudure Loads

5. Conclusions and Recommendations
5.1 CONCLUSIONS Afler the testing of the specimen, it was more than obvious that the shear strength of the
roof and the invert slabs were heavily dependent on their size. More particularly, the maximum
shear stress ai the critical section at failure was only 0.85MPa, which was significantly lower than
the shear strengths of tested slabs and beams whose depth ranged up to 300mm. Figure 5.1
summarizes the test results of several series of large beams with different reinforcing ratios and
Kani's 'site effecl' 3.0 s a;d 5 8.0
tests
d (mm1
Figure 5.1 - Influence of Member Ske on Sheur Strength (adoptedfrom CSA-94 Code)
CONCL USIONS AND RECOMMEMM TIONS
aggregate sizes. The shear strength of the box structure is also illustrated in the same figure. The
figure shows that the shear stress at failure is significantly reduced when the depth of beams is
increased. The test of the box structure confins this pattern. Therefore, size effects are
signiticant in slabs with no shear reinforcement.
The answer to the question as to why the specimen had a shear strength less than Kani's
beams of similar size lies in the fact that the roof slab had only a 0.56% reinforcing ratio and a
1 Omm maximum aggregate size. Low reinforcing ratios contribute to the increase of longitudinal
strains and the corresponding crack widths. Funher, the widening of the cracks combined with the
reduction of the aggregate size reduced the aggregate interlocking strength, which mainly
contributed to the total shear strength of the roof slab.
The capacity of the specimen was predicted by sevenl Nonh American Codes. Clauses
1 1.3.1.1 and 1 1.3.2.1 of the ACI-95 Code were proven to be unconservative when large beams
with low reinforcing ratios were considered. The ASSHTO-94 Culvert Method was found to be
very unconservative. The CSA-94 Simplified Method accounts for the depth variations of the
flexural members. but predicted slightly higher shear capacity than the actual capacity of
specimen. The General Method. which is included in the AASHTO-94. CSA-94 and OHBDC-91
Codes. adequately addressed the size effects and the related variations of the reinforcing ratio.
The failure of the specimen was sudden with no visible wam ing. Shear cracks were found
on the top and bottom surfaces of the specimen. However, these sides are accessible for
inspection only in laboratory specimens where a slice of the modeled structure is tested.
Inspection of the real box units is limited to observations of the interior faces of the slabs and the
walls. These faces exhibited only fiexural cracks at the midspan of the roof and the invert slab.
Therefore, the original TTC box unit would not exhibit significant signs of distress which may
indicate that the structure was close to shear failure through the slabs.
Based on the testing of the model TTC box unit it is obvious that the shear design of slabs
may not be adequate unless shear rein forcement is introduced. Since the model was scded down
to 35%, analyzed and tested. the full-scale box structure would have a shear strength that was
even a lower proportion of its tlexural capacity.
The specimen failed at the West haunch. However, this does not mean that the critical
section is always located in slabs at a distance d from the haunch or canvalk when the box
structure is subjected to unifonn loading. Most tests have been performed on beams with a
constant reinforcing ratio along their entire length. Thus the beams would usually fail at 0 . X

from the support where significant shear forces and moments were encountered. In the case of a
box structure where the reinforcing ratio is not constant. the location of the critical section
depends also on the reinforcement layout. Thus, the critical section is at a location where both the
shear forces and the longitudinal strains are significant. considering that longitudinal strains
depend not only on member forces but also on the rein forcement ratios.
Running in an off-shear mode, the non-linear frame analysis program TEMPEST
predicted reasonably well the flexural behavior of the specirnen.
5.3 RECOMENDATIONS
Even though thousands of beams have been iested in shear, very little research has been
done on large beams and slabs with reinforcing ratios of less than 1%. To better understand how
sensitive these large flexural members are. in terms of shear strength. to aggregate size and low
reinforcing ratios. further research is strongly recommended.
The unconservative nature of the shear strength expressions in the ACI-95 and the
AASHTO-94 Codes should be corrected by the introduction of better expressions which would be
sensitive not only to the compressive strength of concrete and the moment to shear ratio but also
to the depth of flexural members. the reinforcing ratio and the maximum aggregate size.
Even though provisions requiring minimum shear rein forcement were developed to
account for unexpected member forces. they mainly eliminated the potential failures of large
beams due to the detrimental size effects on shear strength. However these provisions exclude
slabs and footings. Considering the graph in Figure 5.1. it c m be concluded that the ACI Code is
adequate when the thickness of the beams and the sfabs is less than 300mm. Therefore, to
eliminate shear failures of slabs classified as large beams. the exclusion in these provisions
should be limited only to the slabs whose depth does not exceed 300mm. This limitation should
be introduced until better expressions for shear strength are available.
In the case of continuous beams or boa structures where the reinforcing ratio is not
constant throughout the length, the critical shear section could be located not only at a distance d
from the supports where the maximum shear forces are expected, but also at any location where
the reinforcing ratio is significantly reduced. Thus, using the General Method, the shear capacity
should be checked near the supports as well as at the locations of cut off bars. Additionally, shear
capacity should be checked systematically throughout the entire length of the rnemben in order to

CONCLUSIONS .4 ND RECOhfhlEND.4 TIONS
ensure that failure will not occur at locations where both shear forces and moments are
signi ficant.
Since the specimen failed at 55% of its flexural capacity, minimum shear reinforcement
would enhance the shear strength of the roof and the invert slabs. Also additional shear
reinforcement would enable this type of structure to fail in a less brittle fashion, exhibiting signs
of structural distress prior to failure.
In the absence of shear reinforcement, it is recommended to at least extend al1 bars to the
ends of the slabs. This would increase the reinforcing ratio and the corresponding shear strength
near the haunches and the catwalks. However, this minor alteration would not eliminate the brittle
nature of the shear failure when structural members with no ties or stirrups are considered.

References
Anderson. B. G.. "Rigid Frarne Failures." AC1 Joirrnui. V. 53, Jan. 1957, pp. 635-636.
Leonhardt, F., and Walther, R., "The Stuttçard Shear Tests. 196 1 ," Translarion No. I I 1,
Cernent and Concrete Association. London, England, 1964.
Kani. G. N. J., "How Safe Are Our Large Reinforced Concrete Beams?," ACIJournal, V.
64, Mar. 1967, pp. 128- 14 1.
Taylor, H. P. J., "Shear Strength of Large Beams,.' Journuf of the Strticiuruf Division,
ASCE. Vol. 98. No. STl 1. Proc. Paper 9329, Nov.. 1972. pp. 2473-2490.
Rajagopolan, K. S.. and Ferguson. P. N.. gœExploratory Shear Tests Emphasizing Percentage
of Longitudinal Steel." American Cancrete lnstîtzrre Jo~crnul, Vol. 65. Aug., 1968. pp. 634-
63 8
Shioya. T.. Iguro. M.. Nojiri. Y.. Akiyama. H.. and Okada. T.. "Shear Strength of Large
Reinforced Conçrete Beams." Fracture ib1echunic.s: rlppficrz~ion to Concreie, SP- 1 18,
American Concrete Institute. Detroit. 1989, pp. 259-279
AC1 Committee 3 18. "Building Code Reqoirements for Structural Concrete (AC1 3 18-95)
and Cornmentary AC1 3 18R-95," American Concrete Institute. Detroit. 1995.369~~.
"AASHTO LRFD Bridge Design Specifications and Commentary," First Ed., American
Association of State Highway and Transportation Officials, Washington. 1994. 109 1 pp.
CSA Committee A23.3, "Design of Concrete Structures: Structures (Design) - A National
Standard of Canada'' Canadian Standards Association. Rexdale, Dec. 1994. 199pp
OHBDC. Ontario Highway Bridge Design Code. 3d ed.. Ontario Ministry of Transportation
and Communications. Toronto 199 1

Appendix A
Loading Assembly - Shop Drawings

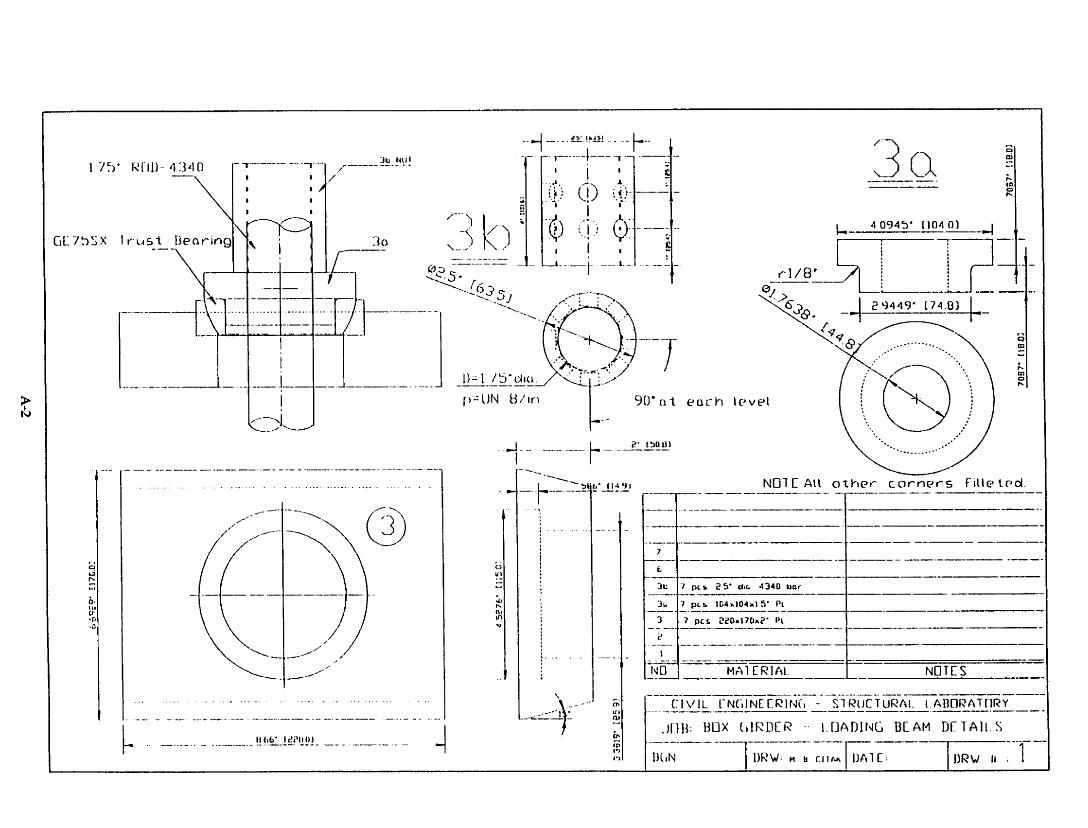


Strain Gauge and LVDTs Data

STRAIN GA UGE AND L VDTS DA TA

STRA IN GA UGE AND L VDTS DA TA
Appendix C
TEMPEST Input Files

TEMPEST INPüT FUES
TEMPEST III * * * * * * *+ * * *
NOTES: Notes that relate to the input of job data can be found at the ----- end of this f i l e .
Job F i l e Name (8 char. max. ) Date (30 char. rnax.)
STRUCTURE DATA
File Name (8 char. max.)
LOADING DATA
Data File Series Xame No. of Load Stages Starting Load Stage No.
Load F i l e name ->
case (8 rhar.nax.) Increment .
1 A UNIT3 2 NULL 3 NULL 4 NULL 5 XULL
ANALYS IS P.WJIETERS ------------------- Sred F i l e Name i 3 char. m a ~ . ) Ccnvergence Fac to r Liait ( > 1.0 1 Maximum No. of Iterations Averaging F a c t o r ( O to )
Initial Axial Stiffness F a c t o r Initial Flexural Stiffness Factor
: U N I T H : May 29,95
: UNITH
I n i t i a l F i n a l
Section Analysis Mode Shear Anaiysis Plode Tension Stiffening Strain Compatibility Geometric Nonlinearity Reinf Strain Hardening Temperature S ~ f t t n i n g Concrete Creop Effects Concrete Shrinkage Effeccs Load History
: NULL : 1.000200 : 150 : 0.500000

TEIMP EST 1NP UT FILES
T o t a l Number of Members f o r Output : 4
Member Node 1 I 1 2 32 1 3 2 2
Crk L L 1 1
NOTES : -----
i. I N CHOOSIMG THE SECTION ANALYSIS MODE, THE FOLLOWING OPTIONS ARE AVAf W L E :
1. Non l inea r Section Ana lys i s - Deforna t ion C o n t r o l l e d
2. Monlinear S e c t i o n Analysis - Force C o n t r o l l r d 3. E f f e c t i v e S t i f f n e s s - Branson ' s Formula 4 . CrackedNncracked - AC1 349 5 . Uncracked (Ig) 6 . Fully Cracked (Icr)
2 . I N CHOOSING THE METHOD OF SHEAR ANALYSIS, THE FOLLOWING OPTIONS ARE A V A I M L C :
O . Shear Not Cons idered 1. Multi-Layez Analysis - Uniform Shear Flow 2 . Mult i -Layer A n a l y s i s - Uniform Shea r S t r a i n 3. S i n g l e Layer Analysis ( @ inid-depth) 4 . Modified Single Layer A n a l y s i s
3 . WHEN SELZCTING WALYSIS PAXPHETERS WHïC3 ASK FOR A O OR 1, THE FOLLOWING 3ULE A P P L I E S :
3 - Neqlect Z f f t c t I - Consider f f f e c t
4 . WHEN SELECTING OUTIVT DATA, THIS WILL INCLUDE RESULTS SCCZ AS CONCRETE STWINS .UID STRESSES, SHZAR 3 E f NFORCEMENT S T M I N S A N D STRESSES, AND XEMBER SECTION STRAINS A N D STRESSES. THE INPUT PARAMETERS FOR THIS OPTION ARE AS FCLLOWS:
Member : The rnember number of tne desired member f o r wnich t h e s t r a i n s and s t r e s s e s will be shown.
Node : The snc o f t h e member f o r which t h e stresses ana srrains will Se shown.
Avg : O if average values f o r menber s e c t i o n s t r e s s e s / s t r a i n s a r e not required.
I if average - ra lues f o r nernber s e c t i o n stzesses/sïrains are required.
: O if v a l u e s f o r nember s e c t i o n s t r e s s e s / s ~ r a i n s a re not reçuired a t a crack l o c a t i o n .
: if values for member section s t r e s s e s / s t r a i n s are required at a crack l o c a t i o n .
5 . T H I S 3ROGRAM US2S METRIC UNITS ONL?.

TEMPEST [NP üT FILES
Note : Notes that relate t o the i n p u t of s t r u c t u r e data can be found ---- at the end of this f i l e .
Structure T i t l e Structure File Name No. of Members No. of Member Types No. of J o i n t s No. of Suppo r t J o i n t s No. o f Support Restraints
( 3 0 char. rnax. ) : U N I T H (8 char. m a x . ) : U N I T H ( 5 0 m a x . ) : 32 (97 m a x . } : 24 ( 4 5 max.) : 33
STRUCTURE ?ARAMETERS ***f******rlt**X****
( A ) Joint C o o r d i n a t e s --------------------- <NOTE:> C o o r d i n a t e u n i t s i n mm <<<<< FORMAT >>>>> NODE X Y [ #NODES d(N0DE) d(X) d(Y1 ] <-- up t,o 2 d i r e c t i o n s /
1 2570 2855 / 2 2314 2855 / 3 2058 2855 / 4 1787 2855 / 5 1546 2855 / 6 1290 2855 / 7 LOO4 2853 / 8 680 2855 ! 9 440 2855 / 10 170 2855 / 11 O 2855 / 12 O 2530 / 13 O 2260 / 14 O 2052 / 1 5 O 1844 / 1 6 O 1636 / 17 O 1618 / 1 0 0 1413 / 19 O 1208 / 20 O 1004 / 21 O 800 / 22 O 315 / 2 3 0 0 / 24 170 O / 25 510 O / 26 730 O / 27 1004 O /

TEMPEST IlVPüT FILES
28 1315 O / 29 1566 O / 30 1787 O / 31 2068 O / 32 2319 O / 33 2570 O /
/
(9 ) Member Incidences --------------------- <<<<< FORMAT >>>>> MEM INCI INC2 MEM.TYPE [ #MEMS d(MEM) d(INC) 1 <-- up to 2
directions / 1 2 1 1 / 2 3 2 1 / 3 4 3 1 ! 4 5 4 1 / 5 6 5 2 / 6 7 6 3 / 7 8 7 4 / 8 9 8 5 / 9 1 0 9 6 / 10 11 10 7 / 11 12 11 8 / 12 13 12 9 / 13 14 13 10 / 14 15 14 II / 15 16 15 12 / 16 17 16 13 / 17 18 17 14 / 18 19 18 15 / 19 20 1 9 16 / 20 21 20 17 / 21 22 21 18 / 22 23 22 19 / 23 23 24 20 / 24 24 25 20 / 25 25 26 2 1 / 26 26 27 22 / 27 27 28 23 / 28 28 29 24 / 29 29 30 24 / 30 30 31 24 / 31 31 32 24 / 32 32 33 24 /
/
(C) Supporc Restzaint List
<<<<< FORMAT >>>>> NODE X-XST ?-XST 2-RST [ 4NODES d(N0DE) <-- up Co 2 directions
/ l L 0 1 / 2 3 0 l O / 3 3 1 O I /
/

TElMPEST INPUT FILES - .-
f ' t (MPa 2.214 2.214 2 .214 2. S l 4 2.214 2.214 2.214 2.214 2.214 2.214 2.214 2.214 2.214 2.214 2.214 2.214 2.214 2.214 2.214 2.214 2 . 2 l 4 2.214 2.214 2 . 2 1 4
Csn iMPa) 0.0 0.0 0.0 0.0 '2.9 0 .0 0.0 0.0 0.0 0.0 0 .0 0.0 3.0 0.0 0 .0 0 .0 0 - 0 0.0 0.0 0.0 0 .0 0.0 0.0 0.0
esn (me}
200.000 200.000 200. QU0 203.00G 200.300 200.000 200.000 200.000 200.000 200.000 200.000 200.000 200.000 200.000 200 - CO0 200.000 200.000 200.000 200.000 200.000 200.000 200.000 200.000 200 - 000

TEMPEST [NP üT FILES
WC (mm) 960. O 960.0 960. O 960.0 960.0 960.0 960.0 960. O 960.0 960. O 960. O 960.0 960. O 960.0 960.0 960. O 960.0 960.0 960.0 960. O 960.0 960. O 960. O 960.0
As (mm2 800.0
4200, O 000.0
3000. O 1200. O
300.0 2000.0 3000. O 1200. O
aoo. o 2000. O 3000.0 2000. O 3000. O 2000.0 3000.0
202.0 2000.0 3000, O 3000.0 2000.0
800. O
(E) Concrete Layers ------------------- r h o t Nx
0.000 1 3 O. O00 13 O. 000 13 0.000 13 0. 000 13 o. 000 L 4 O . O00 1 6 o . O00 12 o . O00 11 O . O00 1 6 O. O00 1 6 O . O00 1 6 O. O00 16 0.000 16 0.000 16 0.000 16 O . 000 16 0.000 1 6 O . O00 16 o. 000 12 0.000 i 5 O . O00 15 O. O00 1 5 0.000 15
(E) Rebar Layers ---------------- Fy Fu Dep (MPa) (MPa) (me) 484.0 4 8 4 . 0 0.000 432.0 492.0 G.900 484.0 484 .0 0.000 492.0 492.0 0.000 486.0 486.0 0.000 484.0 484.0 0,000 140.0 140.0 0.000 492.0 492.0 0.000 228.0 228.0 0.000 170.0 170.0 0.000 421.0 421.0 0.000 492.0 492-3 0.000 484 .0 484.0 0.000 492.0 402.0 0.000 484.0 484.0 0,000 382.0 382.0 0.000 508.0 508.0 0.000 4 8 4 - 0 484.0 0,000 100.0 180.0 0.000 391.0 391.0 0.000 330.0 330.0 0.000 473.0 473.0 0 . ~ 0 0

TEMPEST INPUT FILES
800.0 3OOO.O 800.0 800.0 202.0 3OOO.O 800.0 800.0 3000.0 800.0 800.0 3000.0 800.0 800.0 3000.0 800.0 3OOO.O 4200.0 800.0 3000.0 4200.0 800.0 800.0 3000.0 4200.0 800.0 900.0 3000.0 4200.0 800.0 BOG. 0 4200.0 800.0 235.0 3000.0 1200.0 800.0 285.0 3000.0 3000.0 3000.0 3000.0 1200.0 3OOO. 0 1200.0 3000.0 1200.0 3000.0 1200.0 3OOO.O 1200.0 4200.0 1200.0
0.000 0 000 0.000 0.000 0.000 0.000 0.000 0.000 0.000 0.000 0.000 0.000 0.000 0.000 0.000 0.000 0.000 0.000 0.000 0. OGO 0.000 0 .000 0.000 0.000 0.000 0.000 0.000 0.000 0.000 0.000 0. OOC 0.000 0.000 0 000 0.000 0.000 0.000 0.000 0.000 0.000 0.000 0*000 0.000 0.000 0.000 0.000 0 000 0.000 0.000 0.000 0 - 000 0.000 0.000
NOTES :

TEMP EST lW UT FILES
1. DO NOT INSERT OR DELETE ANY LINE. EXCEPTION: INSERTION OF LINES I N THE SPACE PROVIDED FOR OUTPUT OF DATA. L N THIS CASE, LEATIE LINE
MfTH SLF.SH AFTER LAST DATA LINE.
2 . PROGRAM IS DIMEMSIONED FOR : 45 JOINTS, 50 MEMBERS, 10 MEMBER TYPES,
35 LOADS FER TYPEf 18 CONCRETE LAYERS, AND 10 REBAR ?OSITIONS.
3 . I N REFERENCE TO THE INPUT OF THE SUPPORT 2ESTRAINT L I S T :
O = Not Restrained 1 = Restrahed
4 . THIS FRCG2AM USES METRIC UMITS ONLY.
5 . DIFFSRENT MEMBERS, MEMBER TYPES, AND JOINTS S U L BE NUMBERED AS
6. STEEL LAYERS 3HALL BE NUMBERED AS l , 2 , 3 , . . . , E T C . , FROM THE TO? THE MEMBER SECTION.
7 . TABS, aLAiiKS, CR COElMAS CAN aE GSED ?O SEPARATE DATA. DO YOT ENCLOSE ANY
DATA IN QUOTATION MARKS.

Notes: Notes that re la te t o the i n p u t of load data may be found at t h e
----- end of this file.
Load Case Zù ( 1 5 char. max. )
Load Case Da t a F i l e ( 8 char . max . ) Load Factorod (O - Ii Time Factored 10 - 1) No. of Loaded j o i n t s No. o f Membors w / End Action Loads No. of Nembers w/ Concentratsd Loads No. of Pieipbers w / Distribuced Loads No. of Yembers w/ Temperatuze Loads
Reference Temperature (deg. C) : 26.0
LOAD ?.WAETERS t**t*llt**t***t
;oint ioads
Meanber Sac Actions ------------------ <NOTE:> UMITS: kN,kN-m <<<<< FORMAT >>>>> M 9.1 3F1 9MI SF2 3M2 ( SM d [M) 1 <-- ( 2 ) /
/
Concectrated Lsads ------------------ <NOTE : > UNITS : kN, kN-m, m <<<<< FORMAT >>>>> 'I Fx Fy Mz :ci?, [ %M d(M) d ( t x ) d (Fy ) d(Mz} )<-- (SI/
/
Unif ûml y Distributed Loads --------------------------- <NOTE : > mITS : kN/m, m

TEMP EST IWüT FIL ES
Cc<<< FORMAT >>>3>
M W a / L b/L [ #M d(M) d(W) ]<- - f 2 ) / 1 - 1 0 0 1 1 0 1 0 / 2 3 1 0 0 1 1 0 1 0 /
/
Temperature Loads ------------------ <NOTE: > UNITS: Deg. C, hrs <<<<< FORMAT >>>>> M Tl' T2' Tl T2 TIME ( #M d(M) ]<- - (2)/
/
NOTES :
1. DO NOT INSERT OR DELETE M Y LINE. EXCEPTION: INSERTION OF LINES IN THE SPACE PROVIDED FOR THE INPUT OF THE DATA. IN THIS CASE, LCAVE
L I N E WITH A SLASH AFTER THE MST DATA LINE.
2 . THIS PROGRAM USES METRIC UbIITS ONL?.
3. MOMENTS ARE COUNTERCLOCKWISE POSITIVE.
4 . WHEN INPUTTING DATA R E i A T I N G ?O TEMPERATURE LOADIFIG, THE FOLLOWING VARIABLES ARE REQUfRED :
TI' = Initial Top Temperature T2' = I n i t i a l aottom Temperature TL = Fiinal Top Temperature T 2 = F i n a l Boctorn Temperature -
Nota: ,911 temperacures are d i f f e r e n t i a l s w i t h respect t o che re fsrence
temperacüre .
5 . TABS, BLANKS, OR C2WAS CAN SE USE3 TO SEPMATE DAT3. DO NOT ENCLOSE ANY
DATA IN QUOTATION LYARKS.
6. INFORMATION M O U T LOAD/TXE FACTGRED OPTIONS ARE AS FOLLOWS :
Load Fsctorod = O --> Do n o t r n u l t i p l y loads ny l o a d factors. Load Factored = I --> Multiply loads ~y load factors. Tîme Factored = 0 --> Do n o t r n u l t i p l y loads by t i m e factors. T i m e Factored = I --> XuLtiply loads by l o a d factors.