an investigation of measured and simulated wideband
TRANSCRIPT
LUND UNIVERSITY
PO Box 117221 00 Lund+46 46-222 00 00
An investigation of measured and simulated wideband channels with applications to1.25 MHz and 5 MHz CDMA systems
Asplund, Henrik; Alayon Glazunov, Andres; Berg, Jan-Erik
Published in:48th IEEE Vehicular Technology Conference, 1998. VTC 98.
DOI:10.1109/VETEC.1998.686637
1998
Link to publication
Citation for published version (APA):Asplund, H., Alayon Glazunov, A., & Berg, J-E. (1998). An investigation of measured and simulated widebandchannels with applications to 1.25 MHz and 5 MHz CDMA systems. In 48th IEEE Vehicular TechnologyConference, 1998. VTC 98. (Vol. 1, pp. 562-566) https://doi.org/10.1109/VETEC.1998.686637
Total number of authors:3
General rightsUnless other specific re-use rights are stated the following general rights apply:Copyright and moral rights for the publications made accessible in the public portal are retained by the authorsand/or other copyright owners and it is a condition of accessing publications that users recognise and abide by thelegal requirements associated with these rights. • Users may download and print one copy of any publication from the public portal for the purpose of private studyor research. • You may not further distribute the material or use it for any profit-making activity or commercial gain • You may freely distribute the URL identifying the publication in the public portal
Read more about Creative commons licenses: https://creativecommons.org/licenses/Take down policyIf you believe that this document breaches copyright please contact us providing details, and we will removeaccess to the work immediately and investigate your claim.

An Investigation of Measured and Si ulated Wideband Channels with Applications to 1.25 MHz and 5 MHz CDMA Systems
Henrik Asplund, Andres Alayon Glazunov and Jan-Erik Berg
Ericsson Radio Systems AB S-16480 Stockholm
Sweden
Abstract - Fading of the wideband radio channel and its implications for CDMA RAKE receiver operation has been investigated using measured wideband impulse responses and simulations with an exponentially shaped channel model. The emphasis has been on systems with 1.25 MHz and 5 MHz bandwidth, and the reduction in fading varia- tions as well as the increased complexity in terms of required RAKE correlator branches when increasing the bandwidth has been studied. An analysis of the conse- quences of fast power control has also been performed.
I. INTRODUCTION
As the development of mobile communications systems moves on towards higher bandwidths and bitrates, a good and thorough understanding of the fundamentals of the radio chan- nel at higher bandwidths is necessary. In this paper, the behav- iour of the radio channel at bandwidths of 1.25 MHz and 5 MHz is investigated, with a focus on parameters of interest for CDMA systems. The basis for the analysis is wideband chan- nel measurements performed at 1880 MHz and simulations using a channel model with an exponential power delay profile.
The questions this paper seeks to answer are the following:
What are the typical quantitative reductions in channel fading when increasing the system bandwidth?
How does the signal at the output of a RAKE receiver behave at different bandwidths and in comparison with the total received signal?
What is the influence of power control?
How many branches or RAKE fingers are necessary?
Previous work in this area include, among other, the article by Chan [l], where the power variations and RAKE receiver performance at 1.25 MHz and 10 MHz are investigated. The number of RAKE receiver fingers needed at different band- widths to capture a certain percentage of the total power has been investigated by Martin and Faulkner [2]. Received signal levels and correlation properties are investigated by Kozono [3]. Iwai et al. [4] have investigated wideband signal fluctua- tions and path and spatial diversity for CDMA systems.
9
11. CHANNEL MEASUREMENTS
The wideband channel measurements have been performed at two locations in the city of Stockholm, Sweden, correspond- ing to two different environments. The location of the first was on a roof-top on the main building of Ericsson Radio Systems AB, in an environment best classified as a mixture of urban and suburban. 30 measurement locations at distances of 200- 2000 m were selected. The second site was located in the cen- tral parts of Stockholm, in an urban environment with areas of open water. 41 measurement locations were used, at distances spanning 150 to 2500 m. Base station heights were 2-3 m above rooftop level, which for both sites was 20-25 m above ground level.
The mobile antenna was placed on top of a van, which was driven around on streets and highways in the area. Most of the measurements were acquired in non-line-of-sight conditions. Each measurement consists of 1430 consecutive complex impulse responses of length 109 ms, which were obtained via cross-correlation with a transmitted 5 11 bit PN-sequence clocked at 4.672 MHz. The sampling rate of the receiver, a HP 89441A Vector Signal Analyzer, was 6.4 MHz. With vehicle speeds of 30 to 90 km/h, the 1430 impulse responses would span a distance of 10-25 wavelengths at 1880 MHz.
The measured impulse responses were post-processed to bandwidths of 1.25 MHz and 5 MHz, with sampling rates of 1.6 MHz and 6.4 MHz respectively. Sampling rates are 1.28 times the bandwidths to avoid aliasing in the receiver. The level of the noise floor in the measured impulse responses was assessed, and all samples below a threshold level (set to about 6 dB above the noise level) were set to zero. Rather than using a threshold specified in relation to the strongest peak we chose to specify the threshold in relation to the median noise level, in a similar manner as described in [5].
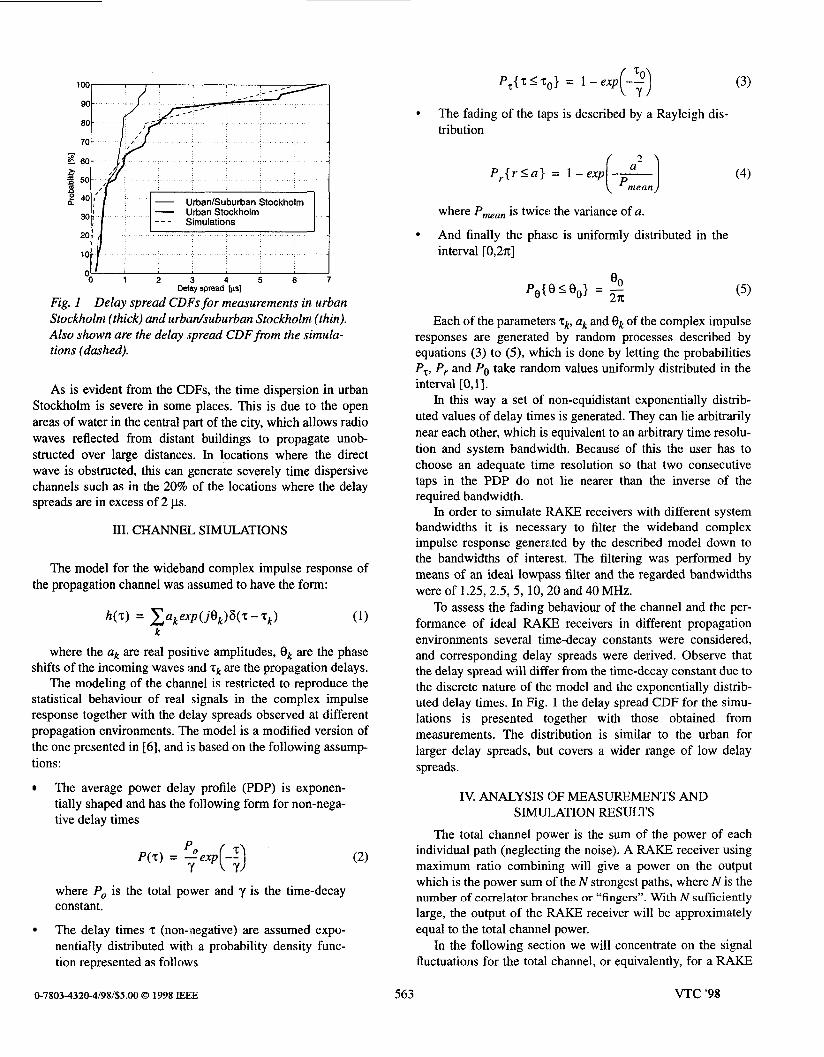
The amount of time dispersion encountered in the two mea- surement environments can be assessed by studying Fig. l , which displays the cumulative distribution functions (CDFs) of the rms delay spread.
0-7803-4320-4/98/$5.00 0 1998 IEEE 562 VTC '98
“0 1 2 3 4 5 6 7 Delay spread tis]
Fig. I Delay spread CDFs for measurements in urban Stockholm (thick) and urbadsuburban Stockholm (thin). Also shown are the delay spread CDF from the simula- tions (dashed).
As is evident from the CIIFs, the time dispersion in urban Stockholm is severe in some places. This is due to the open areas of water in the central part of the city, which allows radio waves reflected from distant buildings to propagate unob- structed over large distances. In locations where the direct wave is obstructed, this can generate severely time dispersive channels such as in the 20% of the locations where the delay spreads are in excess of 2 ps.
111. CHANNEIL SIMULATIONS
The model for the wideband complex impulse response of the propagation channel was assumed to have the form:
h ( z ) = C a k e x p ( j e , ) S ( z - 7,) (1) k
where the ak are real positive amplitudes, 0, are the phase shifts of the incoming waves and 2, are the propagation delays.
The modeling of the channel is restricted to reproduce the statistical behaviour of real signals in the complex impulse response together with the delay spreads observed at different propagation environments. The model is a modified version of the one presented in [6] , and is based on the following assump- tions:
The average power delay profile (PDP) is exponen- tially shaped and has the .following form for non-nega- tive delay times
where Po is the total power and y is the time-decay constant.
The delay times z (non-negative) are assumed expo- nentially distributed with a probability density func- tion represented as follows
P,{z S Z , ~ } = 1 - exp ( -- 3 (3)
The fading of the taips is described by a Rayleigh dis- tribution
where P,,,,,, is twice the variance of a.
And finally the phase is uniformly distributed in the interval [0,2n]
Each of the parameters zk, ak and e k of the complex impulse responses are generated by random processes described by equations (3) to (3, which is done by letting the probabilities P,, P,. and Po take random values uniformly distributed in the interval [0,1].
In this way a set of non-equidistant exponentially distrib- uted values of delay times is generated. They can lie arbitrarily near each other, which is equivalent to an arbitrary time resolu- tion and system bandwidth. Because of this the user has to choose an adequate time resolution so that two consecutive taps in the PDP do not lie nearer than the inverse of the required bandwidth.
In order to simulate RAKE receivers with different system bandwidths it is necessary to filter the wideband complex impulse response generated by the described model down to the bandwidths of interest. The filtering was performed by means of an ideal lowpass filter and the regarded bandwidths were of 1.25,2.5,5, 10,20 and 40 MHz.
To assess the fading behaviour of the channel and the per- formance of ideal RAKE receivers in different propagation environments several tirne-decay constants were considered, and corresponding delay spreads were derived. Observe that the delay spread will differ from the time-decay constant due to the discrete nature of the: model and the exponentially distrib- uted delay times. In Fig. 1 the delay spread CDF for the simu- lations is presented together with those obtained from measurements. The distribution is similar to the urban for larger delay spreads, but covers a wider range of low delay spreads.
IV. ANALYSIS OF MEASUREMENTS AND SIMULATION RESULTS
The total channel power is the sum of the power of each individual path (neglecting the noise). A RAKE receiver using maximum ratio combining will give a power on the output which is the power sum of the N strongest paths, where N is the number of correlator branches or “fingers”. With N sufficiently large, the output of the RAKE receiver will be approximately equal to the total channel power.
In the following section we will concentrate on the signal fluctuations for the total channel, or equivalently, for a RAKE
0-7803-4320-4/98/$5.00 0 1998 IEEE 563 VTC ‘98

receiver employing a sufficient number of "fingers". In section B the result of using a finite number of RAKE "fingers" will be investigated. In section C , the effect of power control is stud- ied.
A. Channel fading
A parameter which can be used to characterize the amount of fading of the channel is the fading width, defined as the dif- ference in dB between the 99% level and the 1% level in the CDF for the received signal power [4]. Using the approach in [4], we plot the fading width vs. the product of the signal band- width and the rms delay spread in Fig. 2. The solid line is an empirical curve which gives a very good representation of the fading gains obtained in simulations using the exponential channel model.
Denoting the above defined fading width as FW the curve in Fig. 2 is then given by the following equation:
FW = A ( I -y tanh(aln( /3Wxsp))) (6)
where a=0.4, /3=1.49, ~ 0 . 8 3 and A=14.54 dB. The fading width approaches 26.6 dB as the system bandwidth-delay spread product becomes smaller, which is the fading width that corresponds to the Rayleigh CDF.
As can be seen, this curve is also a good fit to the experi- mental data, though the spread is much larger than for the sim- ulated data (not shown). Some deviations are evident, as there are some data points with low fading width and low signal bandwidth-delay spread product, i.e. the two groups of four points located to the lower left in the figure. These are identi- fied as being measurements in or close to LOS, which provides an explanation for the low fading widths. LOS channels tend to be Rician rather than Rayleigh fading, resulting in much lower fading variations.
0 0 5 MHz measurements + + 1.25 MHz measurements
io" 1 0-' 1 o0 10' 1 o2
Fading width vs. the product of delay spread (Delay spread)x(System bandwidth)
Fig. 2 and system bandwidth. Measurement results are marked with o (5 MHz) and + (1.25 MHz). The solid line is an empirical fit to the simulations results.
From Fig. 2 we find that increasing the bandwidth for a fixed delay spread reduces the fading variations of the channel, a result which is well-known from experience. This reduction
is largest when the signal bandwidth-delay spread product is near unity, where the slope of the curve in Fig. 2 is most steep.
Alternately, the reduction in fading can be investigated by looking at the reduction in fading margin, or the increase of the value of the CDF for the received signal power at a specific probability level. To get a good ground for comparison, all measurements in each of the environments were normalized to the same average power, and then the total CDF for the signal power was calculated for the whole ensemble of measure- ments. Fig. 3 shows the total CDFs for the bandwidths of 1.25 MHz and 5 MHz for the urbadsuburban environment (left) and the urban (right). The reduction in signal fading when increas- ing the bandwidth is clearly evident when comparing the two curves. We can look at the gain at a specific probability level, such as the 1% level. For the two curves, a gain of 3.5-4.0 dB is achieved.
1 o2 UrbanJSuburban Stockholm Urban Stockholm
U lo-; -0 20 30 10-10 20 30 40
Relative Power [dB] Relative Power [dB]
Fig. 3 for each of the environments at 1.25 MHz and 5 MHz bandwidth. Also shown are the fading gains at the I % probability level.
Distributions of fading variations (normalized)
Fig. 4 shows the fading gain obtained when simulating the channel using the exponential model for the average power delay profile and Rayleigh fading taps. The fading gain with the 5 MHz system relative to the 1.25 MHz system is presented at different CDF levels using 1, 2, 4, 8 and all possible taps in the profile. At the 1% probability level, the fading gain is 3.5 dB, which is in conformity with the value obtained from the measurements.
Fig. 4 4, 8, and all taps in the power delay profile.
Fading gains vs. CDFprobability level for I , 2,
B. Fading in ideal RAKE receivers
A practical communications system can utilize the signal energy in different manners. In CDMA systems using RAKE receivers, correlator branches or RAKE "fingers" are used to
0-78034320-4/98/$5.00 0 1998 IEEE 564 VTC '98

capture part of the signal energy. These fingers are assigned to different delays in the time, domain description of the radio channel, and utilizes the signal energy present at those delays. To evaluate the signals at the output of RAKE receivers, we make the following simplifying assumptions:
The RAKE receiver has no time window, and can con- sequently have fingers at large delay separations.
Correct decisions are always made regarding which delays the fingers are to be used at, and the delays can be changed instantly.
The noise level is assumed to be the threshold level of the measurements, so that for measurements with good dynamic range even very weak peaks may be used.
These assumptions distinguish our “ideal” RAKE receiver from a practical one, but are useful for investigating the perfor- mance limits of this type of receivers. Furthermore, to facilitate detection of peaks, our “ideal” RAKE receiver will operate on a channel impulse response which has been oversampled to exactly two times the system bandwidth. The minimum dis- tance between two RAKE fingers must then be two samples, or 1/B where B is the system bandwidth.
Measurements
Low delay spread 0 . 2 0 ~
* - - e 1.25MHz b 20 n
‘1 2 3 4 5 6 7 8 Number of RAKE fingers
Typical delay spread: 0 . 7 3 ~ s
b 20 a
Number of RAKE fingers
High delay spread: 6.8 ps
J 2 3 4 5 6 7 E
Number of RAKE fingers
Simulations
Low delay spread 0 . 2 3 ~
& 20 - 5MHz n 1.25 MHz
‘1 2 3 4 5 6 7 8 Number of RAKE fingers
Typical delay spread 0 . 7 6 ~ s
g 80 0
...
- 5MHz n 1 25 MHz
‘1 2 3 4 5 6 7 8 Number of RAKE fingers
High delay spread 6.05 ps loo( ’ , 1 ’ ” I
01-8 Number of RAKE fingers
Fig. 5 RAKEfingers for measurements (left) and simulations (right).
Percent of total power captured as afunction of
0-7803-4320-4/98/$5.00 0 1998 EEE
The first question we look at is how much of the total signal power is captured in a RAKE receiver with a limited number of fingers. In Fig. 5, we present three special cases, a low-delay spread channel, a typical delay spread channel and a high- delay spread channel. Corresponding results from simulations are also shown. The mieasurements are taken from the urban environment.
Not surprisingly, higher delay spread means a larger num- ber of fingers is necessary to capture a given percentage of the total signal power. Interesting to note is the general trend of the simulations predicting a larger number of fingers than the mea- surements do. For a given percentage of the total power, the number of RAKE fingers predicted by the simulations is approximately twice the number indicated by the measure- ments. This indicates that the exponentially shaped channel may be more difficult from a power capture point of view than a typical measured channel. Probably the signal energy is more concentrated to a few pleaks than what is the case in an expo- nential channel.
Apart from not capturing the total received power, the result of only using a limited number of RAKE fingers is that fading variations will increase (path diversity will be less when less paths are combined). Fig. 6 shows the captured power CDFs for the urban and the urbadsuburban environments for differ- ent number of RAKE fingers.
UrbadSuburban Stockholm - 1.25 MHz Urban Stockholm - 1.25 MHz
Relative Power [dB1
- UrbanlSuburban Stockholm - 5 MHz
Relative Power [de]
Urban Stockholm - 5 MHz ~
Relative Power [dB]l Relative Power [dB]
Fig. 6 Distributions of fading variations at the RAKE receiver output using different number of RAKE fingers. The curves in each diagram represents an increasing number of RAKEfingers from left to right, starting at one and increasing up to ten.
After a certain number of fingers, asymptotic curves are reached which correspond to the curves in Fig. 3. As can be seen, the CDF curves alpproach these asymptotic curve with different speeds, the 1.25 MHz system will be very close to this after 3 fingers, while the 5 MHz system will need more fingers to reach the asymptote. ,4s an example, we can look at the 1%
565 VTC ‘38
fading gain when both systems are using 4 RAKE fingers. This will be 2.8 dB in the urban and 2.9 dB in the urbadsuburban. For comparison, the simulations predict a fading gain of 2.2 dB, as can be seen in Fig. 4.
C. RAKE receivers in CDMA systems with power control
Fast power control is a way of mitigating the effects of fad- ing. If fast power control is used, one may ask what the point of investigating the fading in a RAKE receiver is when the received signal will be constant if the power control is perfect. But there is a price to pay for achieving constant received power, and that is that the average transmitted power is increased in comparison with a less fading channel. In essence, the transmitted power will be the inverse of the received power shown in Fig. 6, and the more severe the fading, the higher the average transmitted power need to be to achieve equal constant received power level. Defining the Excess transmitted power as the average increase in transmitted power relative to a non-fad- ing channel, we can plot a figure such as Fig. 7.
UrbadSuburban Urban
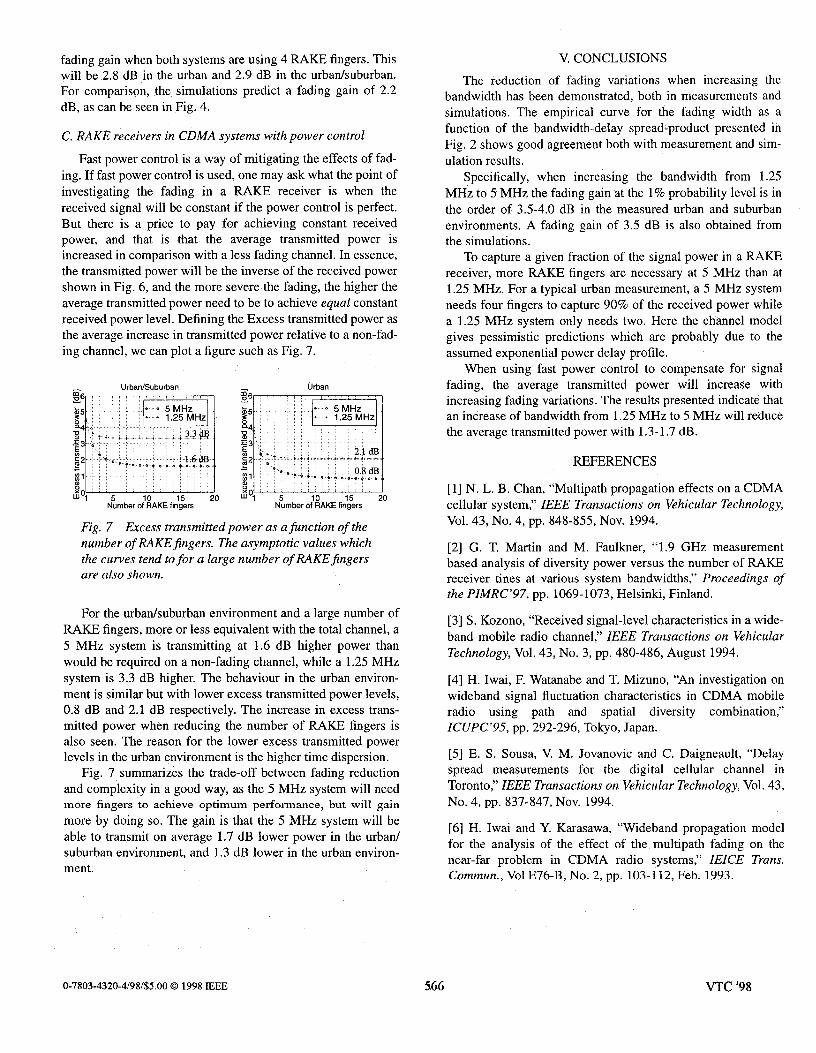
Fig. 7 Excess transmittedpower as afunction of the number of RAKE$ngers. The asymptotic values which the curves tend to for a large number of RAKEfingers are also shown.
For the urbanhuburban environment and a large number of RAKE fingers, more or less equivalent with the total channel, a 5 MHz system is transmitting at 1.6 dB higher power than would be required on a non-fading channel, while a 1.25 MHz system is 3.3 dB higher. The behaviour in the urban environ- ment is similar but with lower excess transmitted power levels, 0.8 dB and 2.1 dB respectively. The increase in excess trans- mitted power when reducing the number of RAKE fingers is also seen. The reason for the lower excess transmitted power levels in the urban environment is the higher time dispersion.
Fig. 7 summarizes the trade-off between fading reduction and complexity in a good way, as the 5 MHz system will need more fingers to achieve optimum performance, but will gain more by doing so. The gain is that the 5 MHz system will be able to transmit on average 1.7 dB lower power in the urban/ suburban environment, and 1.3 dB lower in the urban environ- ment.
V. CONCLUSIONS
The reduction of fading variations when increasing the bandwidth has been demonstrated, both in measurements and simulations. The empirical curve for the fading width as a function of the bandwidth-delay spread-product presented in Fig. 2 shows good agreement both with measurement and sim- ulation results.
Specifically, when increasing the bandwidth from 1.25 MHz to 5 MHz the fading gain at the 1% probability level is in the order of 3.5-4.0 dB in the measured urban and suburban environments. A fading gain of 3.5 dB is also obtained from the simulations.
To capture a given fraction of the signal power in a RAKE receiver, more RAKE fingers are necessary at 5 MHz than at 1.25 MHz. For a typical urban measurement, a 5 MHz system needs four fingers to capture 90% of the received power while a 1.25 MHz system only needs two. Here the channel model gives pessimistic predictions which are probably due to the assumed exponential power delay profile.
When using fast power control to compensate for signal fading, the average transmitted power will increase with increasing fading variations. The results presented indicate that an increase of bandwidth from 1.25 MHz to 5 MHz will reduce the average transmitted power with 1.3-1.7 dB.
REFERENCES
[ l ] N. L. B. Chan, “Multipath propagation effects on a CDMA cellular system,” IEEE Transactions on Vehicular Technology, Vol. 43, NO. 4, pp. 848-855, NOV. 1994.
[2] G. T. Martin and M. Faulkner, “1.9 GHz measurement based analysis of diversity power versus the number of RAKE receiver tines at various system bandwidths,” Proceedings of the PIMRC’97, pp. 1069- 1073, Helsinki, Finland.
[3] S . Kozono, “Received signal-level characteristics in a wide- band mobile radio channel,” IEEE Transactions on Vehicular Technology, Vol. 43, No. 3, pp. 480-486, August 1994.
[4] H. Iwai, F. Watanabe and T. Mizuno, “An investigation on wideband signal fluctuation characteristics in CDMA mobile radio using path and spatial diversity combination,” ICUPC’95, pp. 292-296, Tokyo, Japan.
[5] E. S. Sousa, V. M. Jovanovic and C . Daigneault, “Delay spread measurements for the digital cellular channel in Toronto,” IEEE Transactions on Vehicular Technology, Vol. 43, NO. 4, pp. 837-847, NOV. 1994.
[6] H. Iwai and Y. Karasawa, “Wideband propagation model for the analysis of the effect of the multipath fading on the near-far problem in CDMA radio systems,” IEICE Trans. Commun., Vol E76-B, No. 2, pp. 103-1 12, Feb. 1993.
0-7803-4320-4/98/$5.00 0 1998 IEEE VTC ’98