an investigation of macroeconomic determinants of domestic ... · an investigation of macroeconomic...
TRANSCRIPT
An Investigation of Macroeconomic Determinants of Domestic
Private Investment
Evidence from East Africa
A Research Paper presented by:
Esubalew Tadele Agidew (Ethiopia)
In partial fulfillment of the requirements for obtaining the degree of MASTER OF ARTS IN DEVELOPMENT STUDIES
Major:
Economics of Development
(ECD)
Members of the Examining Committee:
Prof. Peter Van Bergeijk [Supervisor]
Dr. John Cameron [Reader]
December, 2014 The Hague, The Netherlands

i

ii
Acknowledgments
First of all, I would like to express my deepest gratitude to the Netherlands fellowship program (NFP) for providing me the opportunity to study my Master’s Degree in development studies in Economics of development (ECD) at the International Institute of Social studies (ISS) part of the Erasmus University Rotterdam which has helped me to equip with different experiences in a diversified world. Next, I would like to express my special thankful for Professor Peter Van Bergeijk who supervised and give me tremendous academic guidance to shape and direct overall activities during this thesis process. I am grateful to express your patience and diligence in reading and commenting from early to the final draft of the paper and equipped me with providing relevant articles. I would also like to thank Dr. John Cameron for his great inspiration, guidance, understanding and inexhaustible patience and definitely grateful to acknowledge his generosity and invaluable advice in commenting and supporting from initial proposal write up till the final draft of this paper. I appreciate your determination to support and fulfill academic need of students with always welcoming and accommodating behavior.
In addition, I really grateful to extend my deepest gratitude to my beloved Yebirzaf Yeshiwas always being with me during the ups and downs, moments throughout the entire study program and her countless support during all those good and some bad days with inspiring and encouraging words prominently helped me a lot to pursue my master’s degree.
Taking this opportunity, I would like to thank all my friends who have been there all the time in entertaining and making the entire study program full of memorable. I had a superb time with (Yoni, Habte and Tade) and my classmates during the year 2013/14. Moreover, I would like to give special thanks to my parents and my siblings who supported me in morally in pursuing my academic ambitions (Dad, Mom) now your dream comes true, all your wishes for my academic success are fulfilled and I am gratefully recognize almighty God for this success.
Lastly and certainly not the least, endless support of many people and friends, especially those who asked me about thesis process and achievements, here is my thankful for your support and encouraging words and since it has inspired me a lot to qualify my paper.
This paper is dedicated to ‘Nathan’
iii
Contents Acknowledgments ................................................................................................................. ii
List of Tables ...................................................................................................................... iv
List of Figures..................................................................................................................... iv
List of Appendices .............................................................................................................. iv
List of Acronyms ................................................................................................................. v
Abstract.............................................................................................................................. vi
Chapter 1: Introduction ............................................................................................... 1
1.1 Background of the study ...................................................................................... 1
1.2 Why Domestic Private Investments? ................................................................. 2
1.3 East Africa Countries Recent Trends/ Some Stylized Facts .......................... 3
1.4 Statement of the Problem .................................................................................... 4
1.5 What is the Gap? ................................................................................................... 6
1.6 Objectives of the study ........................................................................................ 6
1.7 Main Research Questions .................................................................................... 6
1.8 Limitation of the Study and Challenges ............................................................. 7
1.9 Organization of the Paper ................................................................................... 8
Chapter 2: Academic Literature Review ................................................................ 9
2.1. Theoretical Setup ................................................................................................. 9
2.1.1 Simple accelerator model .............................................................................. 9
2.1.2 Neoclassical model/ flexible accelerator model ...................................... 10
2.2 Empirical Reviews on Determinants of Private Investment ........................ 12
Chapter 3: Research Methodology ........................................................................ 17
3.1 Data sources ........................................................................................................ 17
3.2 Methods of Specification ................................................................................... 17
3.2.1 Panel Data, FE and RE models ................................................................. 17
3.3 Hausman Specification Test .............................................................................. 19
3.4 Data and Variables Considered ......................................................................... 19
3.5 Missed Observations and Treatment Methods .............................................. 20
Chapter 4: Result and Discussions ........................................................................ 22
4.1 Descriptive Statistics ........................................................................................... 22
4.1.1 Private and Public Investment Trends ..................................................... 22
4.1.2 Macroeconomic Indicators of East African Countries during the
Period of 2000-2012 ............................................................................................. 30
4.2 Empirical Results of Regional Investigations ................................................. 37
4.2.1 Determining factors of domestic private investments ........................... 39
4.2.2 Public investment vs domestic private investment ................................. 42
4.2.3 Nexus between FDI and Domestic private investment ........................ 43
Chapter 5: Concluding Remarks ............................................................................ 45
Bibliography ....................................................................................................................... 48
Appendices ......................................................................................................................... 53

iv
List of Tables
Table Page
Table 1 Empirical Investigation on Determinants of Private Investment ............ 14
Table 2 Description of variables under investigation and expected signs ............ 21
Table 3 Average value of domestic private and public investments ...................... 22
Table 4 Macroeconomic performance of selected East African countries ........... 31
Table 5 Summary statistics and all variables used in the investigation .................. 36
Table 6 Estimated Parameter for specified models .................................................. 38
List of Figures
Figure Page
1) Organization of the study .......................................................................................... 8
2) Investment Trends in Ethiopia ............................................................................... 23
3) Investment trends in Kenya .................................................................................... 24
4) Investment trends in Tanzania ................................................................................ 25
5) Investment trends in Uganda .................................................................................. 26
6) Investment trends in Mozambique ........................................................................ 27
7) Investment trends in Rwanda ................................................................................. 28
List of Appendices
A1 Hausman Specification test .................................................................................... 53 A2 Diagnostic checking of Serial Correlation ........................................................... 53 A3 Checking serial correlation in the residual for FE model. ................................. 54 A 4 Modified Wald test for group wise testing heteroskedesticity: ........................ 54 A5 The relationship between DPI and Public investment across countries ........ 55 A6 Scatter Diagram for Domestic private Investment and Per Capital GNI ...... 56 A7 Fixed effects: Heterogeneity across countries ..................................................... 57 A8 Fixed effects: Heterogeneity across years (2000-2012) ...................................... 58

v
List of Acronyms
CBK Central Bank of Kenya
COMESA Common Market for Eastern and Southern Africa
EIA Ethiopian Investment Authority
FDI Foreign Direct Investment
FE Fixed Effect
GDP Gross Domestic Product
GFCF Gross fixed capital formation
GNI Gross National Income
GTP
HIPCs
Growth and Transformation Plan
Heavily Indebted Poor Countries
ICP International comparison program
ILO International Labor Organization
IMF International Monetary Fund
LDCs LICs
Least Developed Countries Low Income Countries
LMICs Lower Middle income Countries
MNCs Multinational corporations
OLS Ordinary Least Square
PPP Purchasing Power Parity
RE Random Effect
SSA Sub Saharan Africa
UNCTAD United Nations Conference on Trade and Development
UNDP United Nations Development Program
WB World Bank
vi
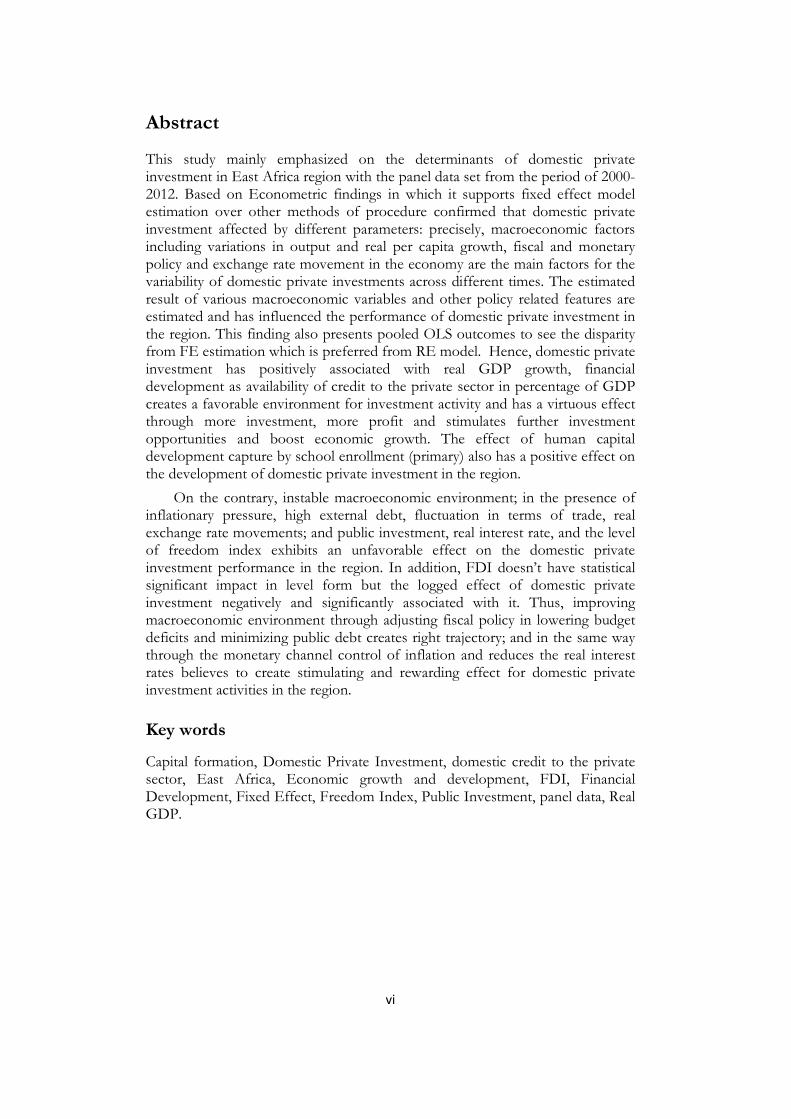
Abstract
This study mainly emphasized on the determinants of domestic private investment in East Africa region with the panel data set from the period of 2000-2012. Based on Econometric findings in which it supports fixed effect model estimation over other methods of procedure confirmed that domestic private investment affected by different parameters: precisely, macroeconomic factors including variations in output and real per capita growth, fiscal and monetary policy and exchange rate movement in the economy are the main factors for the variability of domestic private investments across different times. The estimated result of various macroeconomic variables and other policy related features are estimated and has influenced the performance of domestic private investment in the region. This finding also presents pooled OLS outcomes to see the disparity from FE estimation which is preferred from RE model. Hence, domestic private investment has positively associated with real GDP growth, financial development as availability of credit to the private sector in percentage of GDP creates a favorable environment for investment activity and has a virtuous effect through more investment, more profit and stimulates further investment opportunities and boost economic growth. The effect of human capital development capture by school enrollment (primary) also has a positive effect on the development of domestic private investment in the region.
On the contrary, instable macroeconomic environment; in the presence of inflationary pressure, high external debt, fluctuation in terms of trade, real exchange rate movements; and public investment, real interest rate, and the level of freedom index exhibits an unfavorable effect on the domestic private investment performance in the region. In addition, FDI doesn’t have statistical significant impact in level form but the logged effect of domestic private investment negatively and significantly associated with it. Thus, improving macroeconomic environment through adjusting fiscal policy in lowering budget deficits and minimizing public debt creates right trajectory; and in the same way through the monetary channel control of inflation and reduces the real interest rates believes to create stimulating and rewarding effect for domestic private investment activities in the region.
Key words
Capital formation, Domestic Private Investment, domestic credit to the private sector, East Africa, Economic growth and development, FDI, Financial Development, Fixed Effect, Freedom Index, Public Investment, panel data, Real GDP.
vii
Relevance to Development studies
In the process of economic growth and development, there are different assertions linked with enhancing productions and productivity and creates a suitable environment for the well being of its citizens. Among them, creating broad based and long lasting economic growth through investment activities enriches technical progresses, introduces new techniques of production and creates an employment opportunity. Hence, productivity and the accumulation of capital stock in the long run determined by the rate of investment capacity in the economy. In light of this, private sector investment facilitates economic growth through promoting entrepreneurs, technology transfer and dynamically creates employment opportunity and reduces poverty and opens the road to economic growth.
Thus, identifying the binding constraints of private investment and gives immediate policy response to tackle growth and development problems are crucial insight for the development practitioners’. Formulating appropriate model to stimulate private investments and provide possible policy interventions connects the economic growth further. Thus, it helps to guide professional outlook based through intuitional reforms and inspection of growth parameters for the best investment achievements and economic growth.
1
Chapter 1: Introduction
1.1 Background of the study
In the process of economic growth of countries, investment plays a crucial role to raise productivity through encouraging technological progress and promotes new techniques of production. It also plays an enormous role in the long run capital accumulation since investment increases productive capacity and creates new capital goods. Hence, as investment rates increase the rate of accumulation of capital stock increases rapidly (Majeed and Khan 2008).
Realizing the different productivity performance of public and private sector investment to the economic growth of countries, different scenarios are attached to its marginal returns of the two investment components. In light of this, the marginal benefit from private sector investment has an enormous role in the countries’ economic growth and development, and increasing the public sector investment at the expense of the private one might have a deleterious effect on the growth of private sector and retards economic growth of countries, though the total investment as percentage of GDP remain unchanged (Majeed and Khan 2008).
In light of this, giving recognition to the development of private sector become recent phenomena. Thus, developing countries’ governments give much emphasis and energy to attract private investment believing this will overcome constraints on economic growth through promoting technology transfer, creating employment opportunity and attracting other investors in a more diversified economy. In doing so, developing countries have launched specific concerned bodies to facilitate and provide support to investors (Pfeferman and Madarasy1990). East African countries also implemented this course of action to facilitate the privatization process in the region via privatizing government parastatals. Uganda investment authority and private sector foundation, Kenya investment promotion center, Tanzania investment centre; and Ethiopia investment authority (EIA) are among the recognized institutions.
The fundamental challenge that developing countries are facing with the way to increase investment rates domestically, thus the policy they followed significantly affects the private domestic sector given the limited amount of FDI in the developing regions. Thus, when policy is established it should be conducive to the development of domestic investors (Ghura and Goodwin 2000).
In the discussion of countries’ economic growth there are always different claims to determine best performance in economic growth either market led, state led or some combination of the two. Every economy has had a period of market and state led systems seeking for the best achievements to the growth of the economy. Currently; more emphasis is given to the market led system to improve performance in economic growth (Ajide and Lawanson 2012).
Realizing healthy macroeconomic environment is vital for countries’ economic growth, developing regions continue to follow SAPs advocated by the IMF and follow a market led approach and trust to the market for better
2
economic achievements. In doing so, support and assist in the realization of this model, macroeconomic decline is cut and state owned enterprises are privatized leaving the market to perform in its own way. Otherwise, economic growth is retarded and cannot achieve its desire objectives (Ajide and Lawanson 2012).
The structural reform based on giving more attention to private sector investments and long term target of economic growth based on sectoral reforms and giving incentive to the development of private sectors. Along with this, multilateral and bilateral institutions take initiatives to promote private sector developments. World Bank and allied institutions provides development finance and took initiatives to boost privatization process in African economy mainly in the 1990s (Oshikoya 1994). With this in mind, some African countries show progress from deep trough of 1980s after the reformation of macroeconomic environments. But the growth rate is not still impressive and scholars argued that low investment rates and low economic growth persists in the region (Bloom et al. 1998; Ojo and Oshikoya 1995).
For instance, in the investigation of Greene and Villanueva (1991) in developing countries during the year 1980s, among those countries experienced decline in economic progress was directly linked with the decline of gross capital formation. These variations in capital formation reflect the involvement of private and public investment rate in the economy. In most developing countries the share of public investment too high believed to contribute to economic growth before the realization of the SAPs, then after in 1980s share of public investment declines and more emphasis is given to the private sector investments in which neoclassical economists argue that it has a highly significant impact on economic growth than public investments (Greene and Villanueva 1991). As Pfeffermann and Madarassy (1993) pointed out that in many developing countries private investment become rising and brings significant impact on economic growth than the previous periods of 1970s’ and earlier times; this is mainly closely linked with following the SAPs which is associated with enhancing the efficiency of private sector investments.
1.2 Why Domestic Private Investments?
Importance is attached with investment activity for overall economic performance of countries in long run perspectives, endogenous growth theory gives more emphasizes for investment activities for long run economic performances. Moreover, empirical evidences confirmed that the relevance of investment for better economic achievements. It creates an employment opportunities, enhances technical progress and introduces new techniques of production and facilitates economic growth. Thus, investment determines productivity in the long run through the accumulation of capital stock. As Easterly and Rebelo (1993) underscore the rates of investment activity for economic growth of countries. Similarly, Mwega (1997) emphasizes the role of investment as it enhances productivities through increasing quantity of physical capital per workers.
In light of these, in the discussion of whether public or private investment is much more effective in bringing robust economic growth; recent trends go
3
towards to have more private sector investments. Private sector investment plays a vital role in economic growth via promoting innovations, job creations, and generating more revenues and improves the well being of the poor. Moreover, considering the long run growth of countries and analyzing the convergence rate of per-capita income among countries, aggregate investments were emphasized (Barro 1991; Mankiw et al. 1992). But, segregation of public and private investment also gives a substantial impact on the closer views of the rate of convergence among countries. More of private investment rates facilitate the convergence rate than public investment. Majeed and Khan (2008) argued that countries with a high participation of private investment succeeded in higher economic growth.
Similarly, Oshikoya (1994) pointed out that private investment performs well and less likely connected with corruption and other related factors and precisely robust economic growth can be achieved through promoting and encouraging domestic private investment and increasing its share in the total investment rates. Thus, it requires greatest effort to mobilize domestic resources and more effort needs to create conducive environments for the development of domestic private investments. Since nowadays main challenges facing developing countries, particularly low-income countries in the process of economic growth is that the way to promote investment rates domestically, in essence with the inadequate role played by FDI in the economy.
In the region of East Africa, where effort needs to increase domestic private investment rates, realizing its significant impact to achieve robust economic growth. Moreover, there is ongoing policy debate on the performance of private sector in the region following liberalization policy starting in the 1980s and 1990s; accordingly, this analysis contributes input for designing appropriate policy on the development of domestic private sectors through identifying potential factors that correlates with it.
1.3 East Africa Countries Recent Trends/ Some
Stylized Facts
The region of East Africa consists of Ethiopia (91.73 million people); this large population potentially led to have largest domestic market in Africa in addition to preferential market access from common market for Eastern and southern Africa (COMESA). Moreover, Kenya (43.18 million), Uganda (36.35 million), Tanzania (47.78 million) and Rwanda (11.46 million) and totally brings a population of approximately 230.5 million people with a further 25.20 million from Mozambique (World Bank 2012). Different economic progress across the area has been recorded; precisely GDP growth rates per annum were 8.7% in Ethiopia, 4.6% in Kenya, Rwanda 8.0 %, Tanzania 6.9%, Uganda 3.4% and Mozambique 7.4% of economic growth while the average growth rate of SSA countries are 5.5% in the year 2012/13.
In the year 1980s and 1990s East African countries have implemented SAPs. For instance, Ethiopia changed policies in 1992 and following IMF and World Bank prescription fiscal adjustments were made, privatization policy developed
4
and a lot of reforms have been made as agreed with these institutions. The new investment code was launched, the financial sector became liberalized and allowed to encourage private investments, but the problem was privatization process was so slow (Deneke 2001). In addition, with the main aim of privatization in increasing allocative and productive efficiency and stimulate economic growth and making markets more competitive and eliminating monopoly power were vital issues.
But a major challenge to the Ethiopian economy is that people saving capacity are low, in turn low levels of capital accumulation thus leading to poor performance in investments and involvement of private sector investors in the economy remain below in comparison with other developing countries in SSA region. Thus, domestic capital formation can be enhanced through people saving domestically. Thus, it is hoped people will reduce their current level of consumption to save and invest (Deneke 2001).
Thus, following from economic reform, long lasting and sustained economic growth is believed to be achieved through the participation and involvements of private sector investments through relaxing the existing scarce resources and free interaction through market force.
1.4 Statement of the Problem
The lessons taken from developing countries where there is a lack of coordination in the investment activities of individual and aggregate investment in the economy leads to a low economic trap that linked with low investment rates and low economic growth and goes towards into a vicious circle.
In light of this, realizing significant contribution of investment for economic growth, especially SSA countries where poverty and underdevelopment persists in the region, it demands inward looking development strategy and creating a more suitable environment for domestic investments as an engine of economic growth. For instance, like other developing countries, Ethiopian economy mainly depends on agrarian based system of production and substantial amount of labor force mainly engaged in this sector of the economy. It contributes more than half of national output, employment for more than 80 % of the labor force. The economy mainly depends on this sector and majority of the population are engaged in subsistence level of production and living under the poverty line. These experiences are the fate of many of the East African countries. Hence, taking experiences of successful countries in line with the existed realities of domestic economy, encouraging private investors through creating a suitable environment for the business activities and providing necessary facilities for private sector development is a crucial issue.
Thus, despite the policy reform Ethiopian has experienced a lot of problems; low level of saving limiting investment activities and high unemployment rates. In light of these, recent expectation of GDP growth rates to have 11 % per annum, but IMF alerts that it will be declined to 7 % due to restricted access to the private sector investments as compared with a large share of public investment in the economy.
5
Moreover, educational attainment becomes significantly increases in the region, but efforts to create job opportunity for newly educated job seekers need more and serious attention. Especial emphasis needs to youth unemployment since it is more serious than adults and it is a challenging task to transform youth from school to work (AfDB et al. 2012). Precisely, the problem affects social and economic order of the economy. In these situations, creating safe and appropriate work to the youth in addition to productive employment opportunity needs utmost care for the productive growth of the economy. Accordingly, the unemployment rate1 as World Bank noticed the ILO estimated of these East African countries in the year 2012; Ethiopia 5.4, in Kenya 9.2, Tanzania 3.5, Uganda 4.2 and Mozambique 7.5 from the total percent of the labor force.
Likewise, in the region of East Africa almost 70 % of labor forces are engaged in agriculture and low investment rate keeps large population to live in under poverty. Needs required to transform agrarian based to industrialized led economy and coordination of every sector of the economy, creating forward and backward linkages of sectors of the economy are desirable. In the given dimension, the private sector plays a fundamental role to equip economy with employment, technology transfer, innovating, inventing and able to use the resources efficiently and less prone to corruption.
Thus, effort needs to stimulate private investment in the countries’ economic growth and poverty reduction process. Hence, identifying main constraints of private investment should be given much more emphasis and stimulates economic growth further rather than simply stick to state owned enterprises and public investments.
Economic growth is achieved through capital accumulation, thus to accumulate capital it needs investment in capital assets. In doing this, it needs favorable investment climates, which promotes investment further and expand the expected outcomes through re-investment opportunity, and encourages firms to invest. But many developing countries lack this favorable environment for investments, discouraging private firms from investing in further economic opportunity, thus this constraint remains a problem in many developing countries (Fiestas and Sinha 2011).
1.5 What is the Gap?
Apart from providing finance through a financial institution to the region of Africa, considering the significant contribution of private investment for achieving sustainable economic growth, there is little empirical analysis in the academic arena on determinants of domestic private investment (Greene and Villanueva 1991; Oshikoya 1994). Moreover, Ghura and Goodwin (2000) investigate across regional empirical investigation of private investment determinants, but fail to look the nexus between FDI and domestic private investments; Oshikoya (1994) uses a panel data to examine the determinants of domestic private investment for some African countries but ignores the link between domestic private investment and FDI. This paper gives an investigation
1 Unemployment, total (% of total labor force) (modeled ILO estimate) data from WB

6
of the binding constraints of domestic private investment explicitly at macro level and act accordingly to suggest policy interventions and address prioritized problems of the private sector of the economy in the region of East Africa.
1.6 Objectives of the study
The main objective of this study has focused on identifying the macroeconomic determinant factors of domestic private investment in East African countries.
Specifically,
� To examine the trends of domestic private investment across different
time in East African countries.
� To point out which parameters are significantly determines domestic
private investment activities in East Africa.
� To figure out the response of domestic private investment when the
expected explanatory variables changes in East Africa.
� To examine the existing association between public and domestic private
investments in the region.
1.7 Main Research Questions
The main research question targets to address basically;
o What are the macroeconomic constraints for the development of domestic
private investments in East Africa region, and looking through
� What factors are significantly determines/ stimulate and constrain/
domestic private investments in East African countries?
� What looks like the response of domestic private investment with public
investment activities in the context of East Africa?
� Does FDI significantly affect the domestic private investment rates in the
region?
7
1.8 Limitation of the Study and Challenges
Having special characteristics of developing countries in applying the standard model of investment which requires the existence of perfect capital market, little public investment rates, and these makes empirical investigation of theoretical expectation of the behavior of private investment in developing countries makes rather difficult.
Moreover, some data is not readily available to investigate the determinants of private investment in developing countries in general and East African countries in particular. Thus, this study has constrained by the accessibility of essential data, but for the sake of investigation of the real factors, proxy variables were considered for some of explanatory variables. This issue is addressed more in detail in the data and variable considered section later.
In addition, considering a broad topic of investment discourse this study has focused on domestic private investment looking through macroeconomic factors and holding non-macroeconomic factors constant. Moreover, in the cross country investigation compiling different countries data and merge together was also another challenge because of spatial and temporal variation nature of the data in different countries' perspectives.
With all the stated challenges in conducting the study using standard models of investment activity, we tried to cover all the possible options and made the finding more plausible within the given time frame.
8
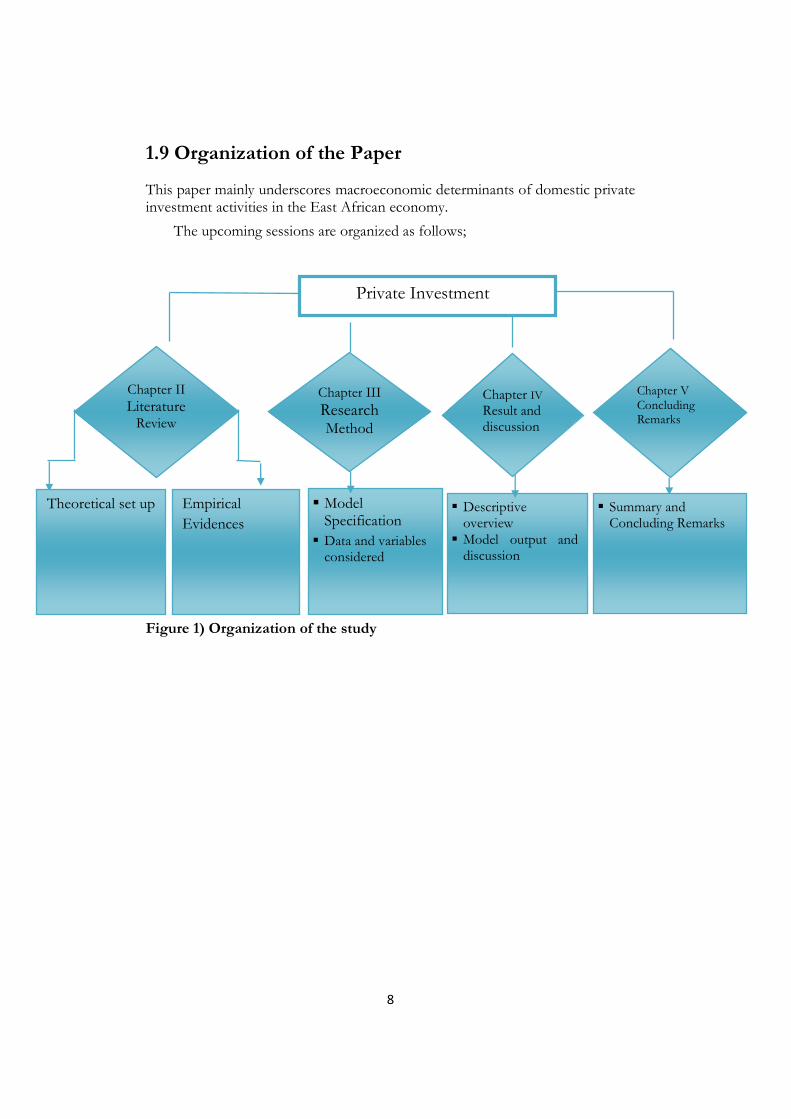
1.9 Organization of the Paper
This paper mainly underscores macroeconomic determinants of domestic private investment activities in the East African economy.
The upcoming sessions are organized as follows;
Figure 1) Organization of the study
Chapter IV Result and discussion
Chapter II
Literature Review
Chapter III
Research Method
Private Investment
Chapter V Concluding Remarks
Theoretical set up
Empirical
Evidences
� Model Specification
� Data and variables considered
� Descriptive overview
� Model output and discussion
� Summary and Concluding Remarks
9
Chapter 2: Academic Literature Review
2.1. Theoretical Setup
There are different models that are used to frame and shape the theoretical frameworks. Many scholars used different types of models and fit the argument with the realization of these theoretical baselines. These models are simple accelerator model, Tobin Q theory and flexible accelerator/ neoclassical model and explicit detail tries to address below.
The existence of an independent investment function in the economy was stated under Keynes (1936) with the basic features of saving and investment are equivalent in the ex-post situation while decision are taken by different bodies and equality of ex-ant saving and investment activities lacks real justification. Next to this, the accelerator theory of investment states that investment is a linear function of output change in the economy. This theory has not given emphasis to the cost of capital goods, expectation and profit in its model. With disregarding the role of input costs in the investment function Keynesians have favored to this model.
In the underlying theory of the flexible accelerator model, which is appropriate to the existing condition of developing countries realities where data on capital stocks, depreciation rates and other relevant variables could not be easily available, especially in SSA countries and particular emphasis given to East African region as per this investigation. Hence, setting hypothesis and conduct empirical findings is an alternative and best approach to figure out economic performances and variability of domestic private investment activities in the region. Thus, this study focuses on finding what determines domestic private investments in East African countries and starts with possible preliminary hypotheses setup and empirical baselines.
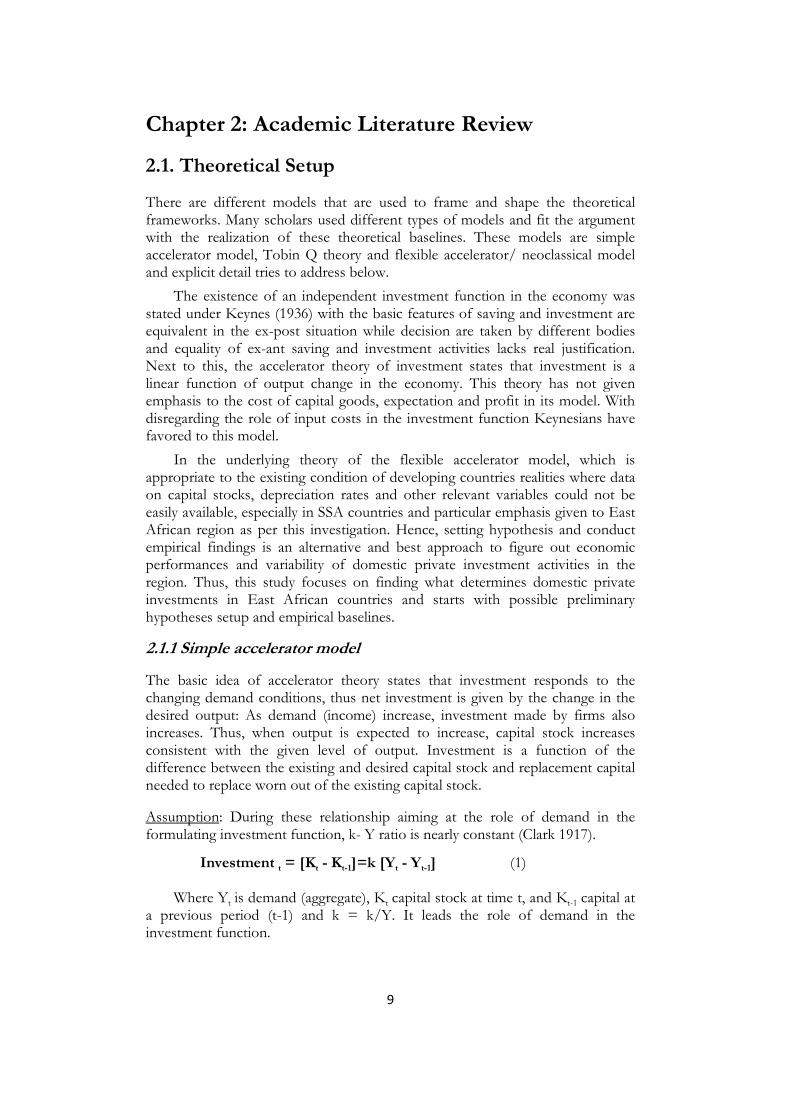
2.1.1 Simple accelerator model
The basic idea of accelerator theory states that investment responds to the changing demand conditions, thus net investment is given by the change in the desired output: As demand (income) increase, investment made by firms also increases. Thus, when output is expected to increase, capital stock increases consistent with the given level of output. Investment is a function of the difference between the existing and desired capital stock and replacement capital needed to replace worn out of the existing capital stock.
Assumption: During these relationship aiming at the role of demand in the formulating investment function, k- Y ratio is nearly constant (Clark 1917).
Investment t = [Kt - Kt-1]=k [Yt - Yt-1] (1)
Where Yt is demand (aggregate), Kt capital stock at time t, and Kt-1 capital at a previous period (t-1) and k = k/Y. It leads the role of demand in the investment function.
10
Critics: When demand changes the level of actual and desired capital kept constant by the level of investment, may not always be true. Since the cost of capital and technology varies, the desired capital-output varies as a well.
2.1.2 Neoclassical model/ flexible accelerator model
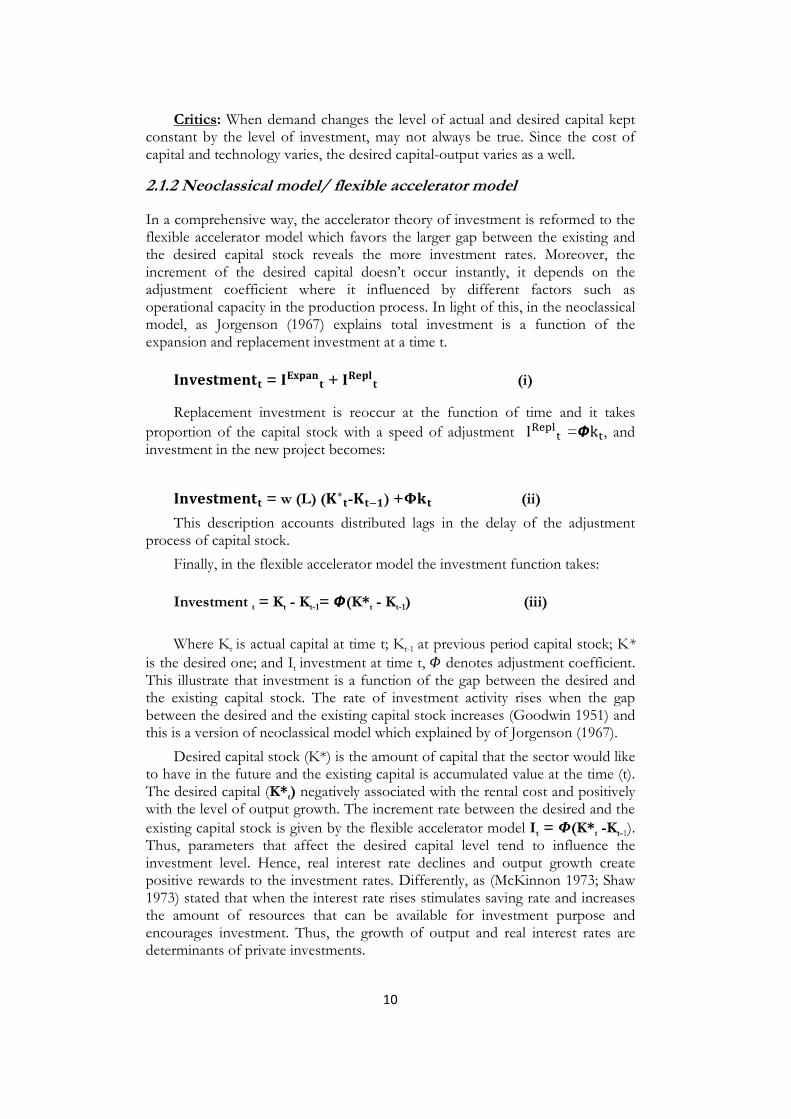
In a comprehensive way, the accelerator theory of investment is reformed to the flexible accelerator model which favors the larger gap between the existing and the desired capital stock reveals the more investment rates. Moreover, the increment of the desired capital doesn’t occur instantly, it depends on the adjustment coefficient where it influenced by different factors such as operational capacity in the production process. In light of this, in the neoclassical model, as Jorgenson (1967) explains total investment is a function of the expansion and replacement investment at a time t.
����������� = ����� + ���
� (i)
Replacement investment is reoccur at the function of time and it takes
proportion of the capital stock with a speed of adjustment I����� =�k�, and
investment in the new project becomes:
����������� = w (L) (�∗�-����) +��� (ii)
This description accounts distributed lags in the delay of the adjustment process of capital stock.
Finally, in the flexible accelerator model the investment function takes:
Investment t = Kt - Kt-1= �(K*t - Kt-1) (iii)
Where Kt is actual capital at time t; Kt-1 at previous period capital stock; K*
is the desired one; and It investment at time t, � denotes adjustment coefficient. This illustrate that investment is a function of the gap between the desired and the existing capital stock. The rate of investment activity rises when the gap between the desired and the existing capital stock increases (Goodwin 1951) and this is a version of neoclassical model which explained by of Jorgenson (1967).
Desired capital stock (K*) is the amount of capital that the sector would like to have in the future and the existing capital is accumulated value at the time (t). The desired capital (K*t) negatively associated with the rental cost and positively with the level of output growth. The increment rate between the desired and the
existing capital stock is given by the flexible accelerator model It = �(K*t -Kt-1). Thus, parameters that affect the desired capital level tend to influence the investment level. Hence, real interest rate declines and output growth create positive rewards to the investment rates. Differently, as (McKinnon 1973; Shaw 1973) stated that when the interest rate rises stimulates saving rate and increases the amount of resources that can be available for investment purpose and encourages investment. Thus, the growth of output and real interest rates are determinants of private investments.
11
Thus, in the model of flexible accelerator theory variables that are included, what determines the desired capital stock (Kt*) are output growth, availability of domestic credit, and cost of external financing. To overcome the limitation of data for investigating empirical findings, scholars used a flexible accelerator model where the adjustment coefficient is given by observable characteristics such as public investment rates, domestic credit, exchange rate movement, level in terms of trade, inflation, the presence of external debt are the among the listed parameters through hypothesis setting and empirical justifications (Frey1989).
Among different determinants of private investments, government investment in the area of infrastructure investments has considered to be positive and significant effects. Hence, infrastructure and allied activity stimulates private sector investors and it has a complementary effect on increasing returns of the private outputs in the long run, however in the short run it has some ‘crowding-out’ effects (Blejer and Khan 1984). From this finding in 24 developing countries; real GDP growth and credit given to the private sector has a positive effect on the private investment activities.
Moreover, a controversial view of the effect of public investment on the private sector investments gives remarkable insight in the empirical investigations. In low income countries investment in the infrastructure is not quite adequate to support the growth of the economy. Hence, infrastructural investments have positive spillover to the returns of private investment (Blejer and khan 1984). In a different way, public investment leaves undesirable effect on the private investments. For instance, in some Latin American countries in the 1970s’ and Asia and Africa in 1980s’ public sector mega projects, such as huge Electric dam projects with enormous cost has been either not operated at its full capacity or were not completed leaves undesirable impact on private investments. Similarly, in many LDCs public investment projects are too ambitious in transportation projects, roads, railways, and other activities ended up without meeting the desire objectives (Krueger and Orsmond 1990).
Furthermore, in the area of input-output relationship of public and private sector investments also mentioned as complementarities when the output of the public sectors used as input for the private sector investments. On the contrary, the output product of the two investment sectors may compete with each other and ‘crowds-out’ the private one (Khan and Kumar 1997). In another channel, when public investment run under budget constraints and financed by imposing high tax rates leaves undesirable impact on private investments since it raises the cost of inputs and causes to decline expected output growth. Likewise, when it is financed by market borrowing, it imposes restrictions on resources allocated to the private sectors and affect private investments negatively.
Many scholars have pointed out that determinate of private investments looking through macro dimension and micro (firm level) aspects: from the macroeconomic perspective scholars’ used time series and panel data set depending on the nature of the investigation. Thus, credit to the private sector, real GDP growth, real exchange rates, real interest rate, inflation rate, terms of trade, trade openness (openness facilitates integration among countries and diffusion of technology), external debt stock, government investment and FDI are among the determining factors of private investments that are considerably listed in the literatures.
12
2.2 Empirical Reviews on Determinants of Private
Investment
Different scholars have conducted research on the determinants of private investment looking at the firm level and at the aggregate level analysis which is the main focus of this paper. Thus, this paper follows macroeconomic perspectives using cross country investigations of East African countries.
The paper of Greene and Villanueva (1991) looks policy effects and macroeconomic environments on the response of private investment in LDCs during 1975-87 and they concluded that real and per capita GDP level and public investment positively affects private sector investments while real interest rate, external debit and debit service and the incidence of high inflation has negatively associated with private investment rates.
As Pfeffermann and Madarassy (1993) summarizes what determines private investments in developing countries and it is stimulated by the growth of demand in the economy. Likewise, credit obtained from banks, which helps to finance investment projects are directed to public and private firms and when the public sector needs highest proportion of it leaves negative impact on the amount required by the private sector investments. Moreover, fiscal deficit adversely affects the availability of finance to the private sector firms. Similarly, exchange rate movements and the existence of inflation affect private investments negatively as of distorting effects on the relative prices of items. High inflation in the economy associated with the devaluation of currency leads to increase the price of imported goods and items and affects the private sector investment negatively. Ghura and Goodwin (2000) confirmed that private investment in LDCs has positively associated with real GDP growth, investment activity by government and improvement of financial intermediation.
Among the determinants of domestic private investments scholars pointed out that FDI has a controversial effect on the domestic private investment. In one way the presence of FDI facilitates technological diffusions, new production techniques and capital inflows. FDI also facilitates integration with a potential foreign market via enhancing domestic firms’ productivity or providing intermediate inputs. Likewise, the presence of FDI in the economy is believed to have advanced technology, which is more productive and preferable than domestically grown one. Due to this, in LDCs emphasis is given to foreign investors expecting positive externality (Mayanja). Moreover, FDI enhances technical know-how and knowledge spillover and production linkages (UNCTAD 1999). Due to this, many LDCs countries followed different policies to draw attention and attract FDI into their economy reduction in tax and import tariffs on the imported items and improving infrastructure facility and other rewarding effect has been given special consideration in the process of attracting FDI.

13
On the contrary, FDI leaves a negative impact on the economy through lowering domestic firm's productivity using different prospects and mostly it is assumed that foreign firms pays higher wages than the domestic one and there are possibilities of the skilled workers shift from domestic firms. Moreover, with advanced technology further equipped with promotion and marketing skill leads to control the market and ‘crowds-out’ the domestically growth firms and investors (Mayanja).
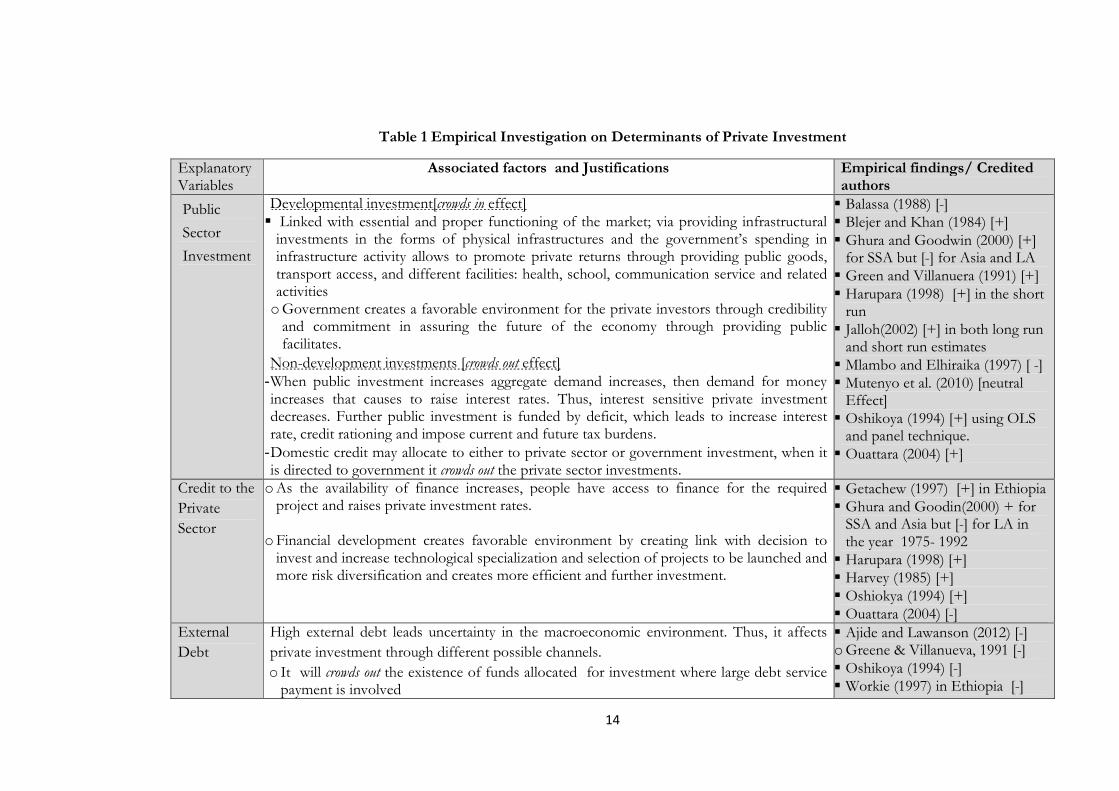
Thus, in this investigation, including FDI as one of explanatory variables used and has attempted to figure out its real effect on the domestic private investment in East African region and detail investigation proceeds in the analysis part. The given table below precisely presents the existed literatures on the determinate private investment across different times and places.
14
Table 1 Empirical Investigation on Determinants of Private Investment
Explanatory Variables
Associated factors and Justifications Empirical findings/ Credited authors
Public
Sector
Investment
Developmental investment[crowds in effect] � Linked with essential and proper functioning of the market; via providing infrastructural
investments in the forms of physical infrastructures and the government’s spending in infrastructure activity allows to promote private returns through providing public goods, transport access, and different facilities: health, school, communication service and related activities
o Government creates a favorable environment for the private investors through credibility and commitment in assuring the future of the economy through providing public facilitates.
Non-development investments [crowds out effect] - When public investment increases aggregate demand increases, then demand for money increases that causes to raise interest rates. Thus, interest sensitive private investment decreases. Further public investment is funded by deficit, which leads to increase interest rate, credit rationing and impose current and future tax burdens.
- Domestic credit may allocate to either to private sector or government investment, when it is directed to government it crowds out the private sector investments.
� Balassa (1988) [-] � Blejer and Khan (1984) [+] � Ghura and Goodwin (2000) [+]
for SSA but [-] for Asia and LA � Green and Villanuera (1991) [+] � Harupara (1998) [+] in the short
run � Jalloh(2002) [+] in both long run
and short run estimates � Mlambo and Elhiraika (1997) [ -] � Mutenyo et al. (2010) [neutral
Effect] � Oshikoya (1994) [+] using OLS
and panel technique. � Ouattara (2004) [+]
Credit to the
Private
Sector
o As the availability of finance increases, people have access to finance for the required project and raises private investment rates.
o Financial development creates favorable environment by creating link with decision to invest and increase technological specialization and selection of projects to be launched and more risk diversification and creates more efficient and further investment.
� Getachew (1997) [+] in Ethiopia � Ghura and Goodin(2000) + for
SSA and Asia but [-] for LA in the year 1975- 1992
� Harupara (1998) [+] � Harvey (1985) [+] � Oshiokya (1994) [+] � Ouattara (2004) [-]
External
Debt
High external debt leads uncertainty in the macroeconomic environment. Thus, it affects
private investment through different possible channels.
o It will crowds out the existence of funds allocated for investment where large debt service payment is involved
� Ajide and Lawanson (2012) [-] o Greene & Villanueva, 1991 [-] � Oshikoya (1994) [-] � Workie (1997) in Ethiopia [-]
15
o Developing countries may face liquidity constraints in global capital markets because of large sum of unpaid debt service obligations.
o Uncertainly of time and amount of external debt transfers to the creditors as it be subject to future levels of world interest rates, the direction of terms of trade, the purchasing capacity of exports, and the ability to reschedule the existed debt also have substantial impact on private investors.
o Moreover, real exchange rate levels, the effectiveness of demand management policies with the expected external transfers also become unreliable.
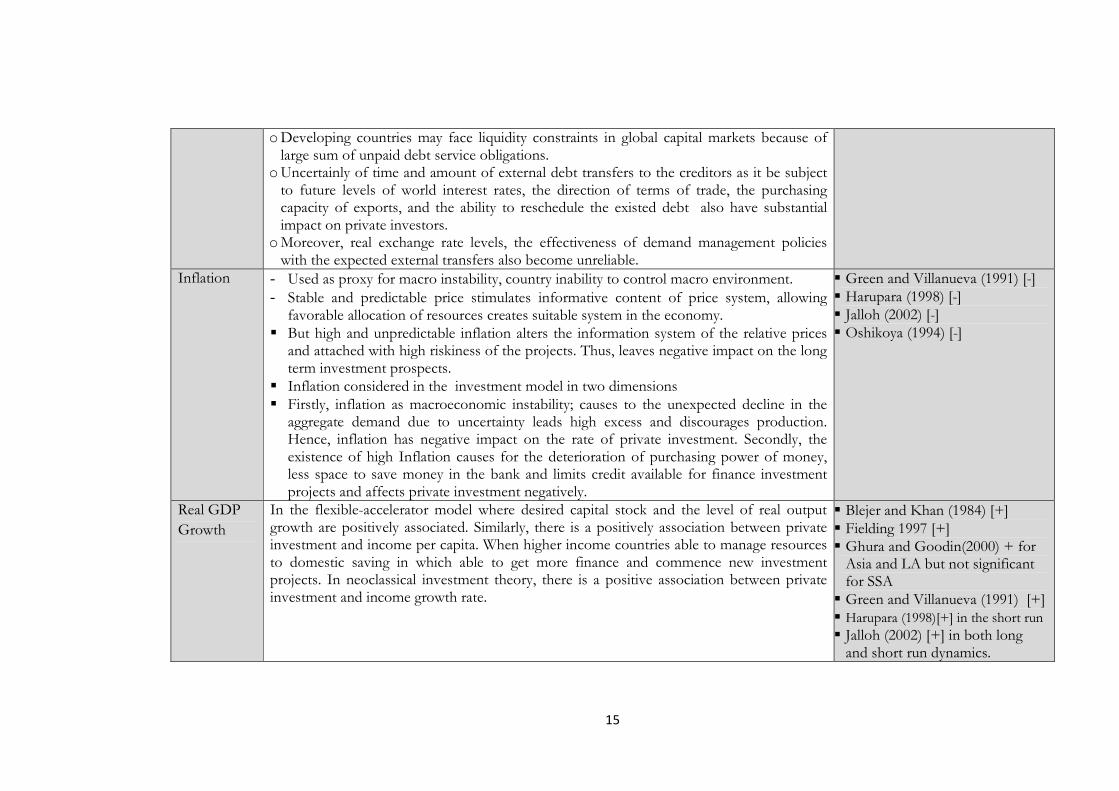
Inflation - Used as proxy for macro instability, country inability to control macro environment.
- Stable and predictable price stimulates informative content of price system, allowing favorable allocation of resources creates suitable system in the economy.
� But high and unpredictable inflation alters the information system of the relative prices and attached with high riskiness of the projects. Thus, leaves negative impact on the long term investment prospects.
� Inflation considered in the investment model in two dimensions � Firstly, inflation as macroeconomic instability; causes to the unexpected decline in the
aggregate demand due to uncertainty leads high excess and discourages production. Hence, inflation has negative impact on the rate of private investment. Secondly, the existence of high Inflation causes for the deterioration of purchasing power of money, less space to save money in the bank and limits credit available for finance investment projects and affects private investment negatively.
� Green and Villanueva (1991) [-] � Harupara (1998) [-] � Jalloh (2002) [-] � Oshikoya (1994) [-]
Real GDP
Growth
In the flexible-accelerator model where desired capital stock and the level of real output growth are positively associated. Similarly, there is a positively association between private investment and income per capita. When higher income countries able to manage resources to domestic saving in which able to get more finance and commence new investment projects. In neoclassical investment theory, there is a positive association between private investment and income growth rate.
� Blejer and Khan (1984) [+] � Fielding 1997 [+] � Ghura and Goodin(2000) + for
Asia and LA but not significant for SSA
� Green and Villanueva (1991) [+] � Harupara (1998)[+] in the short run
� Jalloh (2002) [+] in both long and short run dynamics.
16
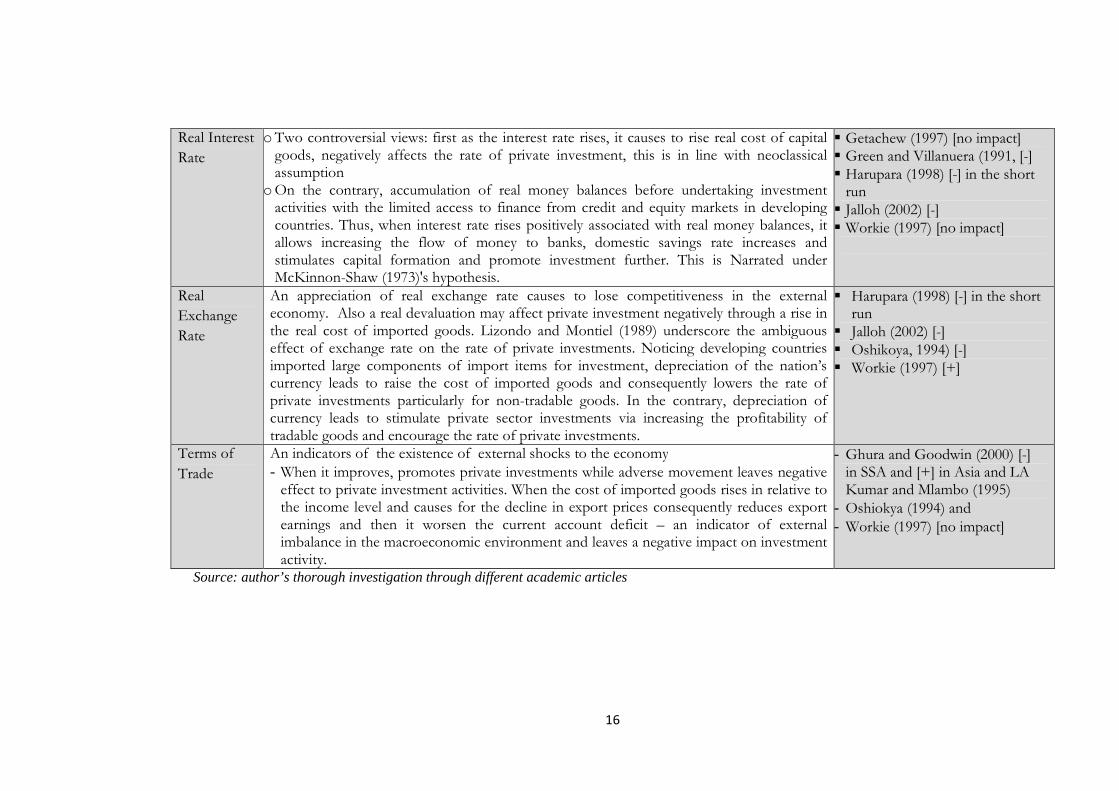
Real Interest
Rate
o Two controversial views: first as the interest rate rises, it causes to rise real cost of capital goods, negatively affects the rate of private investment, this is in line with neoclassical assumption
o On the contrary, accumulation of real money balances before undertaking investment activities with the limited access to finance from credit and equity markets in developing countries. Thus, when interest rate rises positively associated with real money balances, it allows increasing the flow of money to banks, domestic savings rate increases and stimulates capital formation and promote investment further. This is Narrated under McKinnon-Shaw (1973)'s hypothesis.
� Getachew (1997) [no impact] � Green and Villanuera (1991, [-] � Harupara (1998) [-] in the short
run � Jalloh (2002) [-] � Workie (1997) [no impact]
Real
Exchange
Rate
An appreciation of real exchange rate causes to lose competitiveness in the external economy. Also a real devaluation may affect private investment negatively through a rise in the real cost of imported goods. Lizondo and Montiel (1989) underscore the ambiguous effect of exchange rate on the rate of private investments. Noticing developing countries imported large components of import items for investment, depreciation of the nation’s currency leads to raise the cost of imported goods and consequently lowers the rate of private investments particularly for non-tradable goods. In the contrary, depreciation of currency leads to stimulate private sector investments via increasing the profitability of tradable goods and encourage the rate of private investments.
� Harupara (1998) [-] in the short run
� Jalloh (2002) [-] � Oshikoya, 1994) [-] � Workie (1997) [+]
Terms of
Trade
An indicators of the existence of external shocks to the economy
- When it improves, promotes private investments while adverse movement leaves negative effect to private investment activities. When the cost of imported goods rises in relative to the income level and causes for the decline in export prices consequently reduces export earnings and then it worsen the current account deficit – an indicator of external imbalance in the macroeconomic environment and leaves a negative impact on investment activity.
- Ghura and Goodwin (2000) [-] in SSA and [+] in Asia and LA Kumar and Mlambo (1995)
- Oshiokya (1994) and
- Workie (1997) [no impact]
Source: author’s thorough investigation through different academic articles

17
Chapter 3: Research Methodology
This study combines the theoretical expectations and empirical observations that enable to extract the expected controlled variable that influences domestic private investment. Statistical and econometric analyses of the given data were applied and Stata software was used to examine the statistical findings.
3.1 Data sources
Data for this investigation purpose came from different sources. Various parameters were considered to explicitly figure out determinant factors. Data from World Bank (WB): African development indicators (ADI), United Nations Conference on Trade and development (UNCTAD), IMF, freedom house index sources from (www.freedomhouse.org), and other complementary sources have supported this investigation, including a central bank report of individual countries and other specific country sources were used to address the given discourse.
3.2 Methods of Specification
The main variables under consideration are taken from theoretically setups and empirical evidences in different countries. The study and econometric output depend upon the data from the aforementioned sources. Looking the trends and identifying the constraints of domestic private investment activities in the region underscores in this article.
3.2.1 Panel Data, FE and RE models
This investigation considers panel data where by cross sectional with time variation natures of the data and different methods can be applied to get the estimated variable of interest. When looking variation of domestic private investment rates in the region, it is affected by different observable and unobservable; time varying and invariant factors across in the investigation period. Thus, empirical estimation using fixed effect and random effect model estimation can be applied depending on the assumption of the nature of unobserved factors relation with predictor variables; and policy intervention using this kind of estimation is becoming common for controlling unobserved regional variations (Wooldridge 2012). In light of this, applying the FE model is common to get rid of ‘time invariant’ factors. Hence, this ‘time invariant’ factors that affect domestic private investment rates in the region includes geographical features of country locations and historical factors are effectively
captured by the unobserved effect �� (Wooldridge 2012).
18
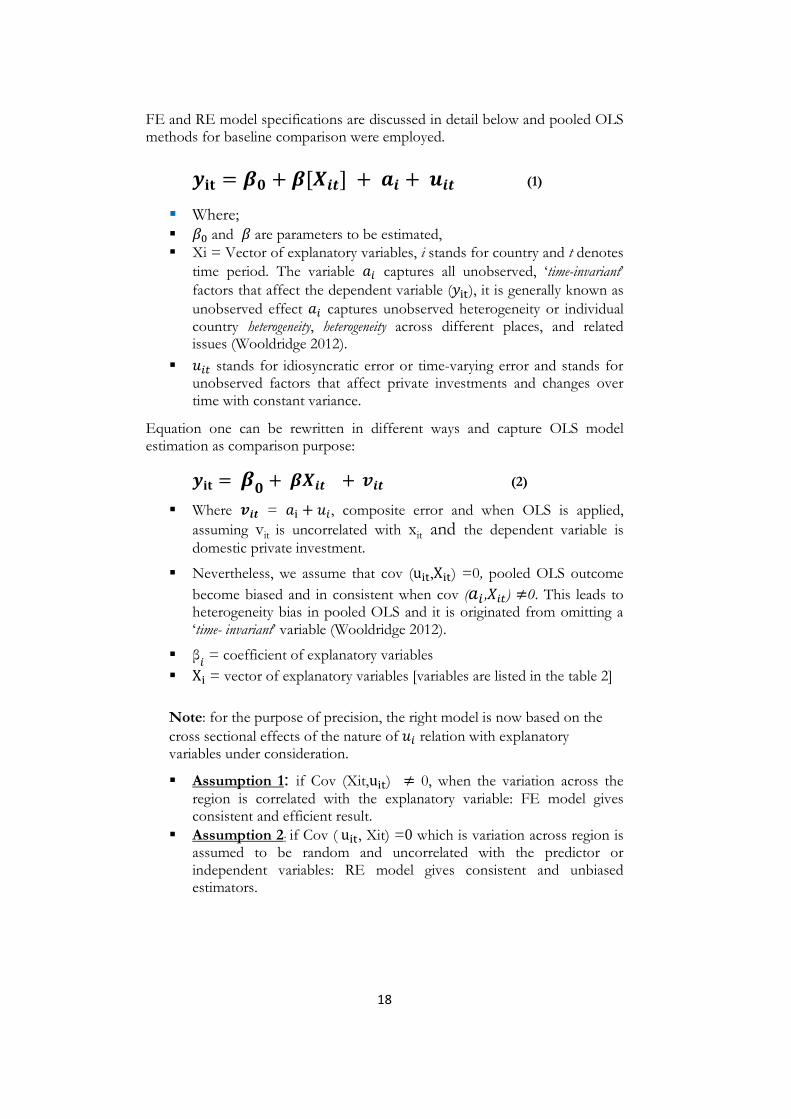
FE and RE model specifications are discussed in detail below and pooled OLS methods for baseline comparison were employed.
!� = #$ + #['()] + ,( + -() (1)
� Where; � ./ and . are parameters to be estimated, � Xi = Vector of explanatory variables, i stands for country and t denotes
time period. The variable �� captures all unobserved, ‘time-invariant’
factors that affect the dependent variable (01�), it is generally known as
unobserved effect �� captures unobserved heterogeneity or individual country heterogeneity, heterogeneity across different places, and related issues (Wooldridge 2012).
� 2�3 stands for idiosyncratic error or time-varying error and stands for unobserved factors that affect private investments and changes over time with constant variance.
Equation one can be rewritten in different ways and capture OLS model estimation as comparison purpose:
!� = #$
+ #'() + 4() (2)
� Where 4() = �1 + 2�, composite error and when OLS is applied,
assuming vit is uncorrelated with xit and the dependent variable is domestic private investment.
� Nevertheless, we assume that cov (u1�,X1�) =0, pooled OLS outcome
become biased and in consistent when cov (�� ,7�3) ≠0. This leads to heterogeneity bias in pooled OLS and it is originated from omitting a ‘time- invariant’ variable (Wooldridge 2012).
� β� = coefficient of explanatory variables
� X1 = vector of explanatory variables [variables are listed in the table 2]
Note: for the purpose of precision, the right model is now based on the
cross sectional effects of the nature of 2� relation with explanatory variables under consideration.
� Assumption 1: if Cov (Xit,u1�) ≠ 0, when the variation across the region is correlated with the explanatory variable: FE model gives consistent and efficient result.
� Assumption 2: if Cov ( u1�, Xit) =0 which is variation across region is assumed to be random and uncorrelated with the predictor or independent variables: RE model gives consistent and unbiased estimators.
19
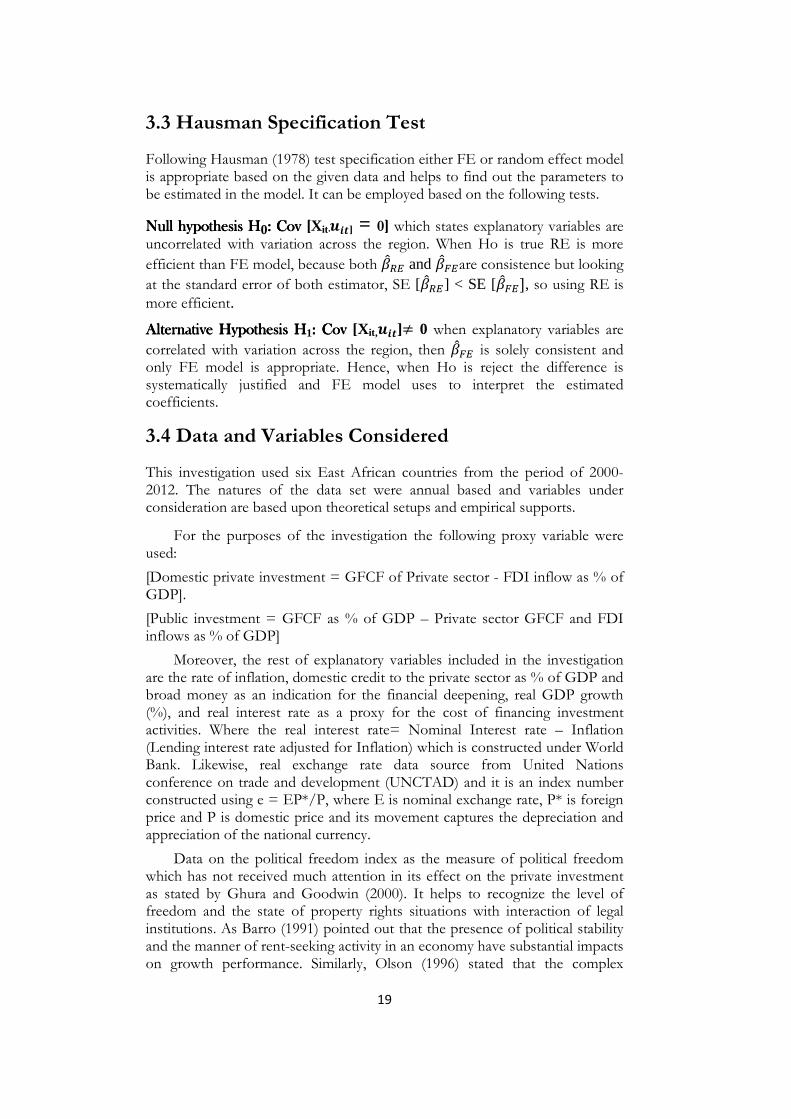
3.3 Hausman Specification Test
Following Hausman (1978) test specification either FE or random effect model is appropriate based on the given data and helps to find out the parameters to be estimated in the model. It can be employed based on the following tests.
Null hypothesis Null hypothesis Null hypothesis Null hypothesis HHHH0: Cov [: Cov [: Cov [: Cov [Xit ,,,,-()] = 0]]]] which states explanatory variables are uncorrelated with variation across the region. When Ho is true RE is more
efficient than FE model, because both .9:; and .9<;are consistence but looking
at the standard error of both estimator, SE [.9:;] < SE [.9<;], so using RE is
more efficient.
AlternativeAlternativeAlternativeAlternative Hypothesis Hypothesis Hypothesis Hypothesis HHHH1: : : : CovCovCovCov [Xit,-()]≠ 0 when explanatory variables are
correlated with variation across the region, then .9<; is solely consistent and only FE model is appropriate. Hence, when Ho is reject the difference is systematically justified and FE model uses to interpret the estimated coefficients.
3.4 Data and Variables Considered
This investigation used six East African countries from the period of 2000- 2012. The natures of the data set were annual based and variables under consideration are based upon theoretical setups and empirical supports.
For the purposes of the investigation the following proxy variable were used:
[Domestic private investment = GFCF of Private sector - FDI inflow as % of GDP].
[Public investment = GFCF as % of GDP – Private sector GFCF and FDI inflows as % of GDP]
Moreover, the rest of explanatory variables included in the investigation are the rate of inflation, domestic credit to the private sector as % of GDP and broad money as an indication for the financial deepening, real GDP growth (%), and real interest rate as a proxy for the cost of financing investment activities. Where the real interest rate= Nominal Interest rate – Inflation (Lending interest rate adjusted for Inflation) which is constructed under World Bank. Likewise, real exchange rate data source from United Nations conference on trade and development (UNCTAD) and it is an index number constructed using e = EP*/P, where E is nominal exchange rate, P* is foreign price and P is domestic price and its movement captures the depreciation and appreciation of the national currency.
Data on the political freedom index as the measure of political freedom which has not received much attention in its effect on the private investment as stated by Ghura and Goodwin (2000). It helps to recognize the level of freedom and the state of property rights situations with interaction of legal institutions. As Barro (1991) pointed out that the presence of political stability and the manner of rent-seeking activity in an economy have substantial impacts on growth performance. Similarly, Olson (1996) stated that the complex
20
system of political and social institutions are still not given due attention in an empirical investigation and theoretical growth models.
3.5 Missed Observations and Treatment Methods
In complement with main data sources for this investigation; country specific annual reports of central banks are used to fill out the missed observations from the main sources. Moreover, after a thorough exploration of missed observations from different sources and those variables that left unobserved from the data has filled by using interpolation and extrapolation techniques. These techniques of prediction of values are used within the data range and beyond the given data range respectively. In doing all this, when employing these techniques assuming the variables are linearly associated and it can be implemented through time trends and regression analysis to fill out the missed observations. Domestic credit to the private sector, real interest rates and school enrollment are variables treated during the course of actions through this method. When employing this, variables missed in one country are not necessary missed in another country and it needs detailed reviews of all variables and follow up the trends.
21
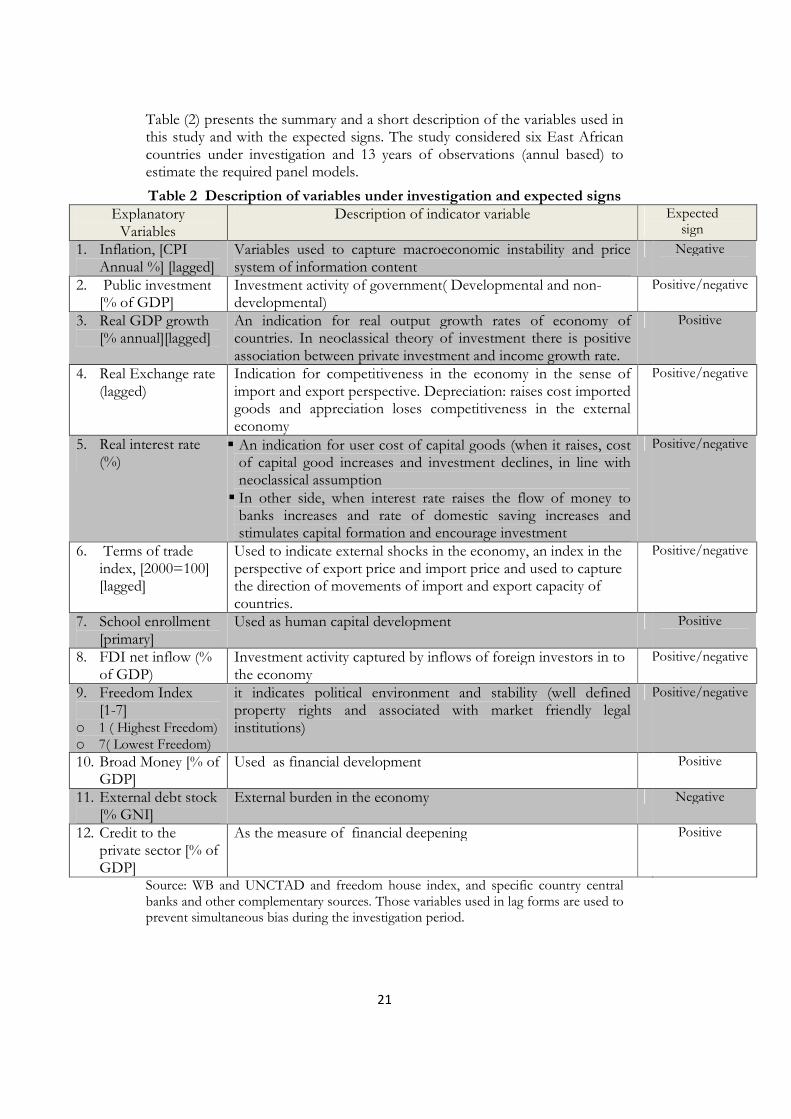
Table (2) presents the summary and a short description of the variables used in this study and with the expected signs. The study considered six East African countries under investigation and 13 years of observations (annul based) to estimate the required panel models.
Table 2 Description of variables under investigation and expected signs Explanatory
Variables Description of indicator variable Expected
sign
1. Inflation, [CPI Annual %] [lagged]
Variables used to capture macroeconomic instability and price system of information content
Negative
2. Public investment [% of GDP]
Investment activity of government( Developmental and non-developmental)
Positive/negative
3. Real GDP growth [% annual][lagged]
An indication for real output growth rates of economy of countries. In neoclassical theory of investment there is positive association between private investment and income growth rate.
Positive
4. Real Exchange rate (lagged)
Indication for competitiveness in the economy in the sense of import and export perspective. Depreciation: raises cost imported goods and appreciation loses competitiveness in the external economy
Positive/negative
5. Real interest rate (%)
� An indication for user cost of capital goods (when it raises, cost of capital good increases and investment declines, in line with neoclassical assumption
� In other side, when interest rate raises the flow of money to banks increases and rate of domestic saving increases and stimulates capital formation and encourage investment
Positive/negative
6. Terms of trade index, [2000=100] [lagged]
Used to indicate external shocks in the economy, an index in the perspective of export price and import price and used to capture the direction of movements of import and export capacity of countries.
Positive/negative
7. School enrollment [primary]
Used as human capital development Positive
8. FDI net inflow (% of GDP)
Investment activity captured by inflows of foreign investors in to the economy
Positive/negative
9. Freedom Index [1-7]
o 1 ( Highest Freedom) o 7( Lowest Freedom)
it indicates political environment and stability (well defined property rights and associated with market friendly legal institutions)
Positive/negative
10. Broad Money [% of GDP]
Used as financial development Positive
11. External debt stock [% GNI]
External burden in the economy Negative
12. Credit to the private sector [% of GDP]
As the measure of financial deepening Positive
Source: WB and UNCTAD and freedom house index, and specific country central banks and other complementary sources. Those variables used in lag forms are used to prevent simultaneous bias during the investigation period.
22
Chapter 4: Result and Discussions
4.1 Descriptive Statistics
4.1.1 Private and Public Investment Trends
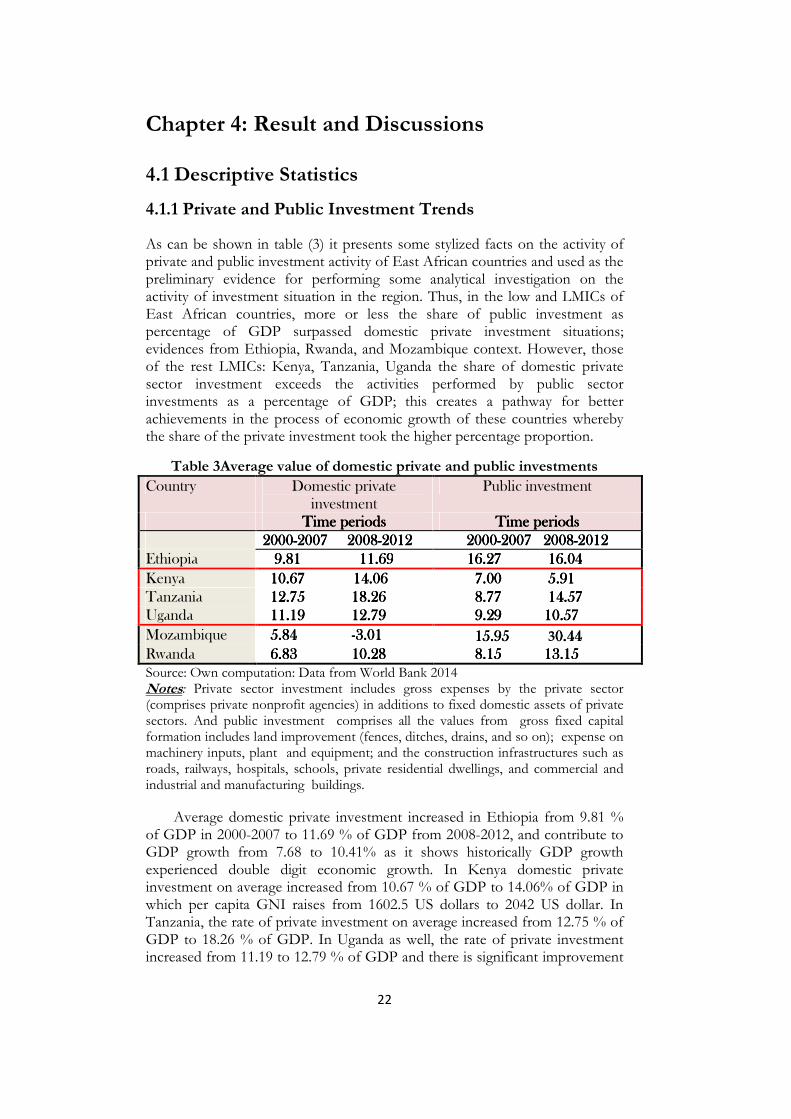
As can be shown in table (3) it presents some stylized facts on the activity of private and public investment activity of East African countries and used as the preliminary evidence for performing some analytical investigation on the activity of investment situation in the region. Thus, in the low and LMICs of East African countries, more or less the share of public investment as percentage of GDP surpassed domestic private investment situations; evidences from Ethiopia, Rwanda, and Mozambique context. However, those of the rest LMICs: Kenya, Tanzania, Uganda the share of domestic private sector investment exceeds the activities performed by public sector investments as a percentage of GDP; this creates a pathway for better achievements in the process of economic growth of these countries whereby the share of the private investment took the higher percentage proportion.
Table 3Average value of domestic private and public investments
Country Domestic private investment
Public investment
Time periodsTime periodsTime periodsTime periods Time periodsTime periodsTime periodsTime periods
2000200020002000----2007 2007 2007 2007 2008200820082008----2012201220122012 2000200020002000----2007 20082007 20082007 20082007 2008----2012201220122012
Ethiopia 9.81 11.699.81 11.699.81 11.699.81 11.69 16.27 16.27 16.27 16.27 16.0416.0416.0416.04
Kenya 10.6710.6710.6710.67 14.0614.0614.0614.06 7.00 7.00 7.00 7.00 5.915.915.915.91
Tanzania 12.75 18.2612.75 18.2612.75 18.2612.75 18.26 8.77 8.77 8.77 8.77 14.5714.5714.5714.57
Uganda 11.19 12.7911.19 12.7911.19 12.7911.19 12.79 9.29 9.29 9.29 9.29 10.5710.5710.5710.57
Mozambique 5.84 5.84 5.84 5.84 ----3.013.013.013.01 15.95 15.95 15.95 15.95 30.440.440.440.44 Rwanda 6.83 10.286.83 10.286.83 10.286.83 10.28 8.15 8.15 8.15 8.15 13.1513.1513.1513.15
Source: Own computation: Data from World Bank 2014 Notes: Private sector investment includes gross expenses by the private sector (comprises private nonprofit agencies) in additions to fixed domestic assets of private sectors. And public investment comprises all the values from gross fixed capital formation includes land improvement (fences, ditches, drains, and so on); expense on machinery inputs, plant and equipment; and the construction infrastructures such as roads, railways, hospitals, schools, private residential dwellings, and commercial and industrial and manufacturing buildings.
Average domestic private investment increased in Ethiopia from 9.81 % of GDP in 2000-2007 to 11.69 % of GDP from 2008-2012, and contribute to GDP growth from 7.68 to 10.41% as it shows historically GDP growth experienced double digit economic growth. In Kenya domestic private investment on average increased from 10.67 % of GDP to 14.06% of GDP in which per capita GNI raises from 1602.5 US dollars to 2042 US dollar. In Tanzania, the rate of private investment on average increased from 12.75 % of GDP to 18.26 % of GDP. In Uganda as well, the rate of private investment increased from 11.19 to 12.79 % of GDP and there is significant improvement
23
in per capita GNI from 843.75 US dollars to 1244 US dollar. However, in Mozambique the rate of private investment declined from 5.84 to -3.01 % of GDP where domestic saving decreased from 7.45 to 3.54 % GDP and GDP growth rate decreased from 7.36 to 6.96 % and more of the contribution of the private sector as a percentage of GDP is came from FDI, thus the private sector development is owned by the inflow of foreign investors. In Rwanda, the rate of private investment on average increased from 6.83 to 10.28 % of GDP and government investment on average rises from 8.15 to 13.15% of GDP as well.
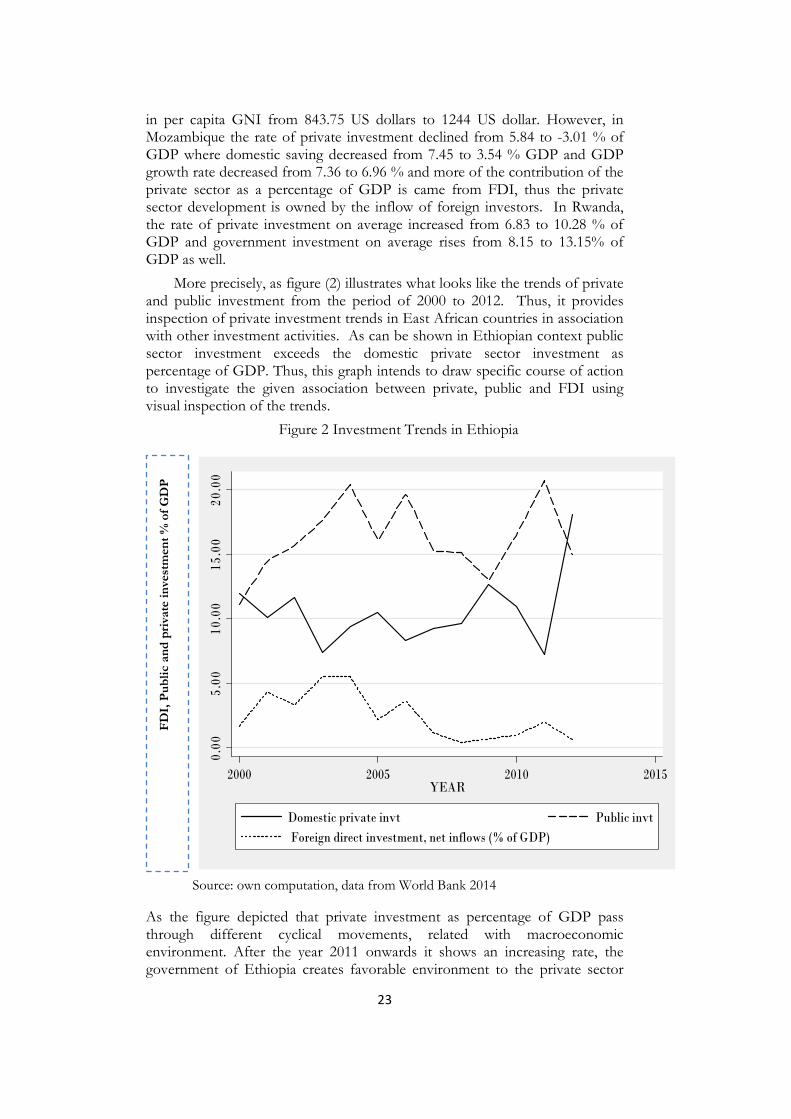
More precisely, as figure (2) illustrates what looks like the trends of private and public investment from the period of 2000 to 2012. Thus, it provides inspection of private investment trends in East African countries in association with other investment activities. As can be shown in Ethiopian context public sector investment exceeds the domestic private sector investment as percentage of GDP. Thus, this graph intends to draw specific course of action to investigate the given association between private, public and FDI using visual inspection of the trends.
Figure 2 Investment Trends in Ethiopia
Source: own computation, data from World Bank 2014
As the figure depicted that private investment as percentage of GDP pass through different cyclical movements, related with macroeconomic environment. After the year 2011 onwards it shows an increasing rate, the government of Ethiopia creates favorable environment to the private sector
F
DI,
Pu
bli
c an
d p
riva
te i
nve
stm
ent
% o
f G
DP
0.00
5.0
010
.00
15.0
02
0.00
2000 2005 2010 2015YEAR
Domestic private invt Public invt
Foreign direct investment, net inflows (% of GDP)
24
development and continued to perform sound economic growth. The growth strategy is based on public sector with highest percentage share of investment is based on public one, which requires external finances and mobilizing the existing domestic resources. Recently, the GTP plan of the country in the year 2010 forwards based on state-led system of the economy, expenditure through priority projects become increasing in spite of the external financing which was not mounting during the year 2010/2011 while commencing GTP plan of development programs and this forced to use domestic credit which ‘crowds-out’ credit available and foreign exchanges to private sector of the economy and as shown from the figure (2) private sector capital formation has declined in the year 2010/11 and again starts to rises.
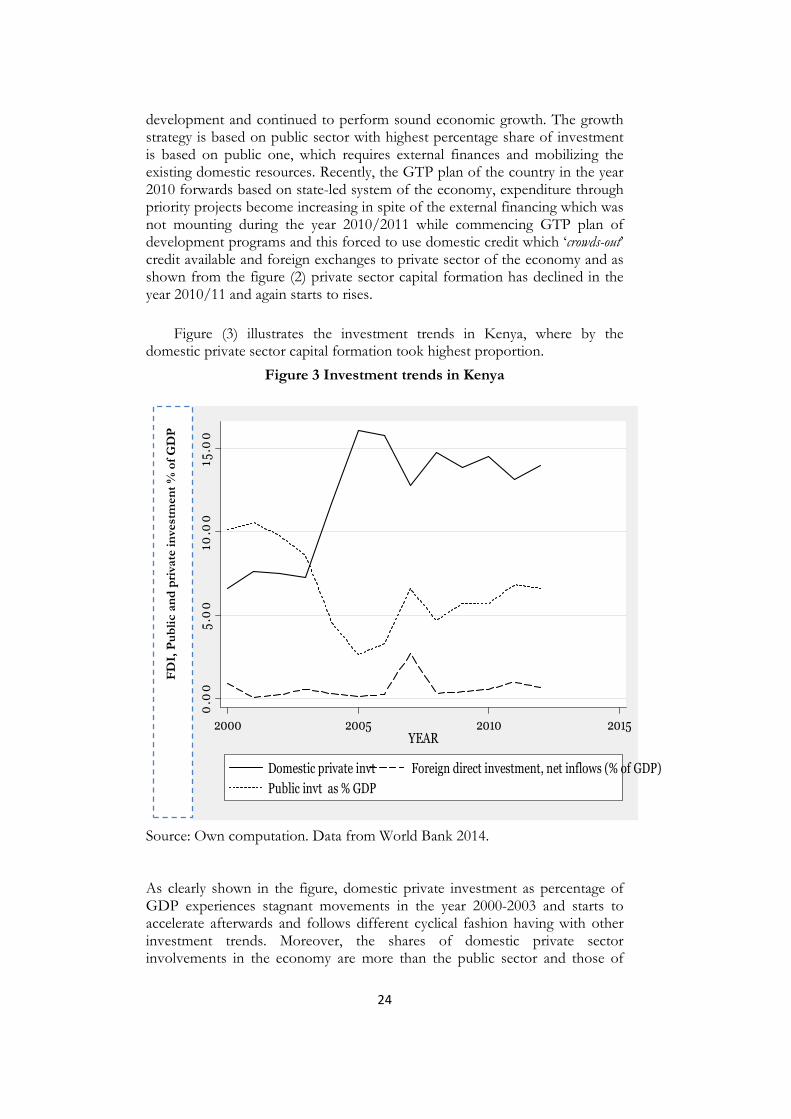
Figure (3) illustrates the investment trends in Kenya, where by the domestic private sector capital formation took highest proportion.
Figure 3 Investment trends in Kenya
Source: Own computation. Data from World Bank 2014.
As clearly shown in the figure, domestic private investment as percentage of GDP experiences stagnant movements in the year 2000-2003 and starts to accelerate afterwards and follows different cyclical fashion having with other investment trends. Moreover, the shares of domestic private sector involvements in the economy are more than the public sector and those of
0.0
05
.00
10.0
015
.00
2000 2005 2010 2015YEAR
Domestic private invt Foreign direct investment, net inflows (% of GDP)
Public invt as % GDP
F
DI,
Pu
bli
c an
d p
riva
te i
nve
stm
ent
% o
f G
DP
25
0.0
05
.00
10.0
015
.00
20
.00
25
.00
2000 2005 2010 2015YEAR
Domestic private invt Foreign direct investment, net inflows (% of GDP)
Public invt
FDI inflows as percentage of GDP. Thus, Kenya maintained relatively high domestic private investments across in the investigation period.
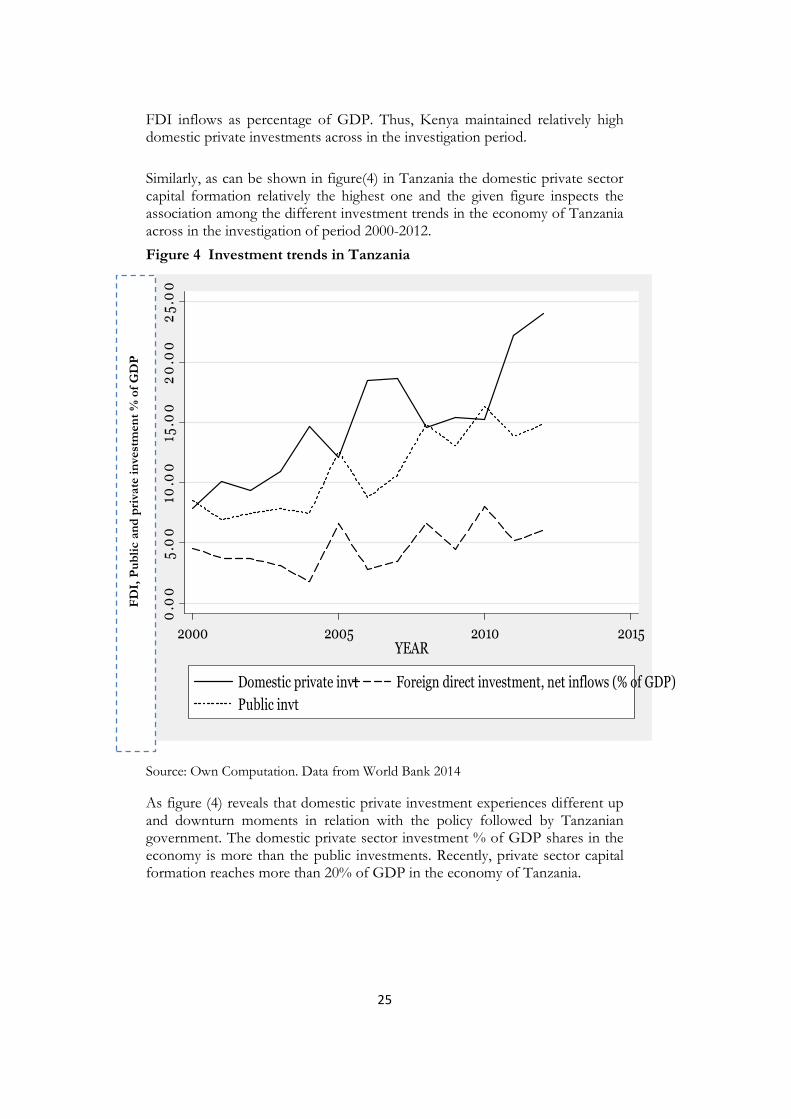
Similarly, as can be shown in figure(4) in Tanzania the domestic private sector capital formation relatively the highest one and the given figure inspects the association among the different investment trends in the economy of Tanzania across in the investigation of period 2000-2012.
Figure 4 Investment trends in Tanzania
Source: Own Computation. Data from World Bank 2014
As figure (4) reveals that domestic private investment experiences different up and downturn moments in relation with the policy followed by Tanzanian government. The domestic private sector investment % of GDP shares in the economy is more than the public investments. Recently, private sector capital formation reaches more than 20% of GDP in the economy of Tanzania.
FD
I, P
ub
lic
an
d p
riva
te i
nve
stm
ent
% o
f G
DP
26
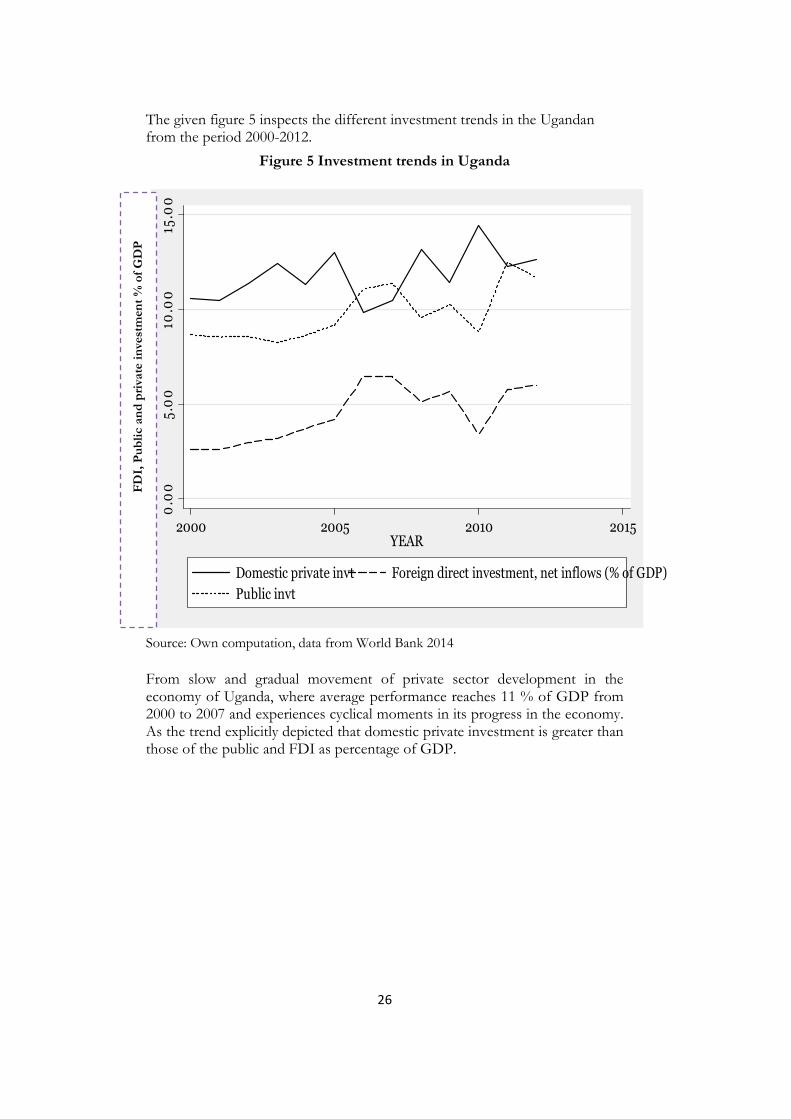
The given figure 5 inspects the different investment trends in the Ugandan from the period 2000-2012.
Figure 5 Investment trends in Uganda
Source: Own computation, data from World Bank 2014
From slow and gradual movement of private sector development in the economy of Uganda, where average performance reaches 11 % of GDP from 2000 to 2007 and experiences cyclical moments in its progress in the economy. As the trend explicitly depicted that domestic private investment is greater than those of the public and FDI as percentage of GDP.
0.0
05
.00
10.0
015
.00
2000 2005 2010 2015YEAR
Domestic private invt Foreign direct investment, net inflows (% of GDP)
Public invt
F
DI,
Pu
bli
c an
d p
riva
te i
nve
stm
ent
% o
f G
DP
27
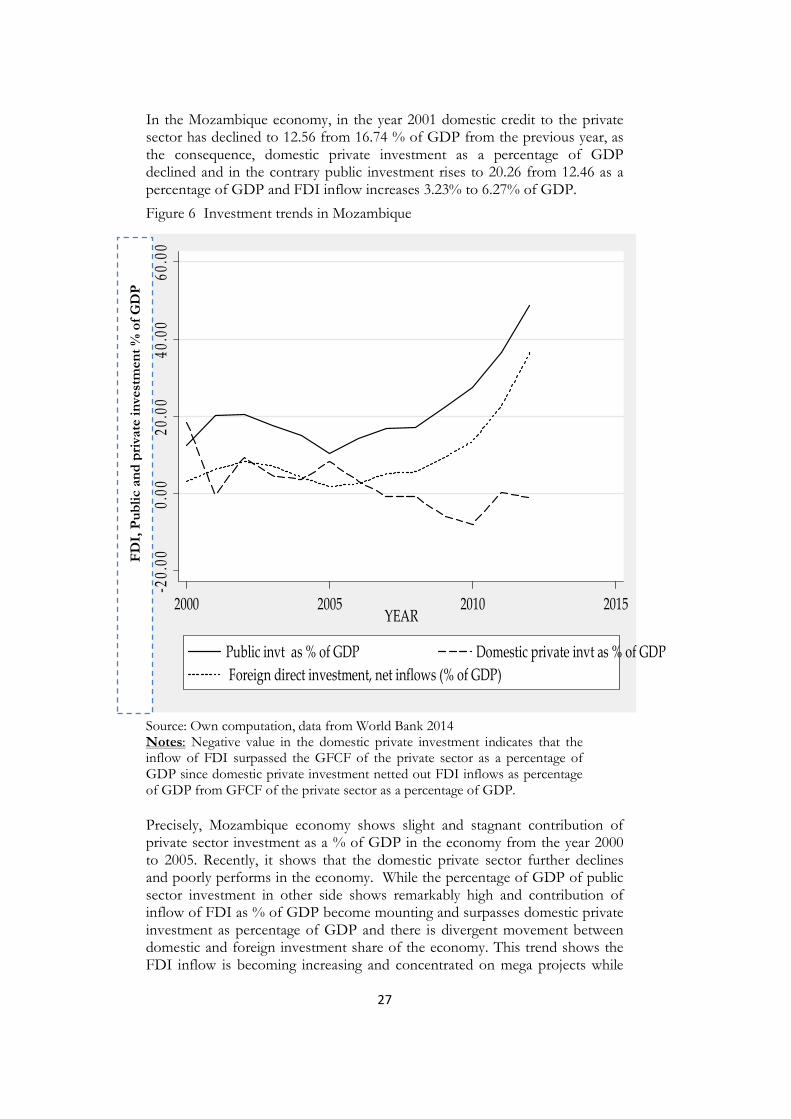
In the Mozambique economy, in the year 2001 domestic credit to the private sector has declined to 12.56 from 16.74 % of GDP from the previous year, as the consequence, domestic private investment as a percentage of GDP declined and in the contrary public investment rises to 20.26 from 12.46 as a percentage of GDP and FDI inflow increases 3.23% to 6.27% of GDP.
Figure 6 Investment trends in Mozambique
Source: Own computation, data from World Bank 2014 Notes: Negative value in the domestic private investment indicates that the inflow of FDI surpassed the GFCF of the private sector as a percentage of GDP since domestic private investment netted out FDI inflows as percentage of GDP from GFCF of the private sector as a percentage of GDP.
Precisely, Mozambique economy shows slight and stagnant contribution of private sector investment as a % of GDP in the economy from the year 2000 to 2005. Recently, it shows that the domestic private sector further declines and poorly performs in the economy. While the percentage of GDP of public sector investment in other side shows remarkably high and contribution of inflow of FDI as % of GDP become mounting and surpasses domestic private investment as percentage of GDP and there is divergent movement between domestic and foreign investment share of the economy. This trend shows the FDI inflow is becoming increasing and concentrated on mega projects while
-20.
000.
0020
.00
40.0
060
.00
2000 2005 2010 2015YEAR
Public invt as % of GDP Domestic private invt as % of GDP
Foreign direct investment, net inflows (% of GDP)
FD
I, P
ub
lic
and
pri
vate
in
vest
men
t %
of
GD
P
28
domestic one is uncorrelated with it. As the structure of the economy towards the inflow of FDI in the economy in agro-industry, agriculture, tourism and industry and mineral resources are experiencing in attracting investors into the economy with the existences of rich in natural resources which has rent seeking behavior and accumulation of wealth to private gain are leads to expose vulnerability of the economy and instability in the business development of the private sector.
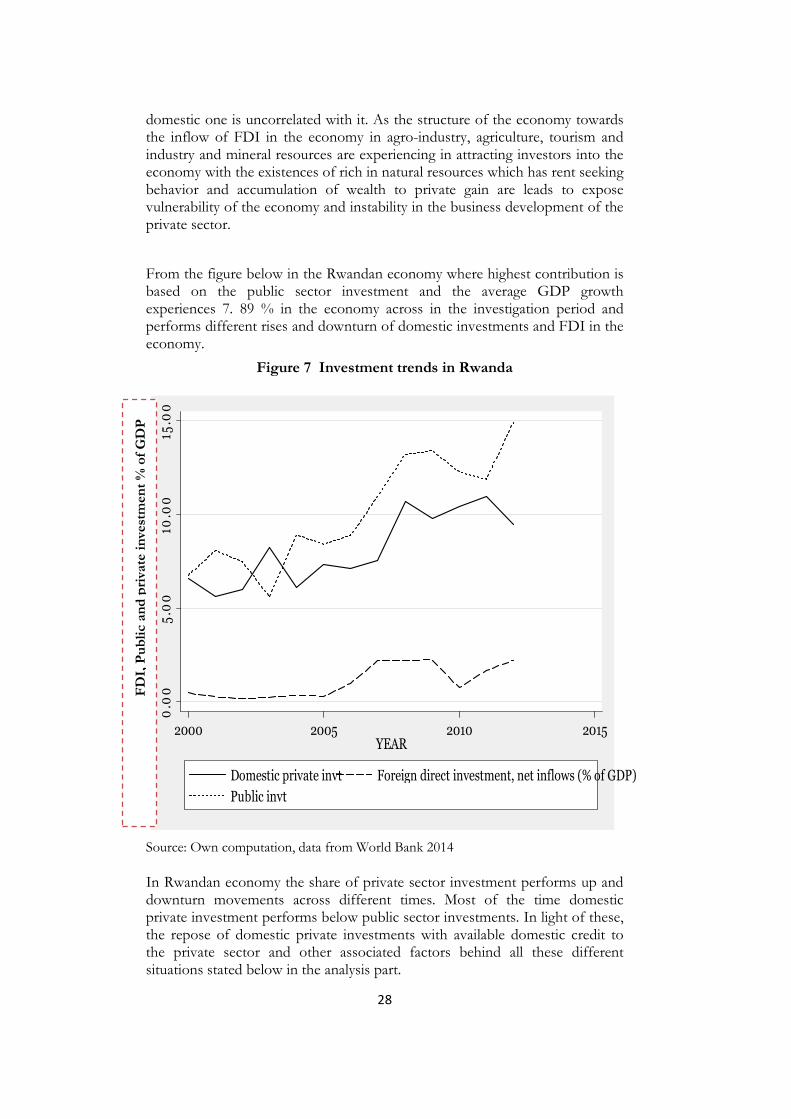
From the figure below in the Rwandan economy where highest contribution is based on the public sector investment and the average GDP growth experiences 7. 89 % in the economy across in the investigation period and performs different rises and downturn of domestic investments and FDI in the economy.
Figure 7 Investment trends in Rwanda
Source: Own computation, data from World Bank 2014
In Rwandan economy the share of private sector investment performs up and downturn movements across different times. Most of the time domestic private investment performs below public sector investments. In light of these, the repose of domestic private investments with available domestic credit to the private sector and other associated factors behind all these different situations stated below in the analysis part.
0.0
05
.00
10.0
015
.00
2000 2005 2010 2015YEAR
Domestic private invt Foreign direct investment, net inflows (% of GDP)
Public invt
FD
I, P
ub
lic
an
d p
riva
te i
nve
stm
ent
% o
f G
DP
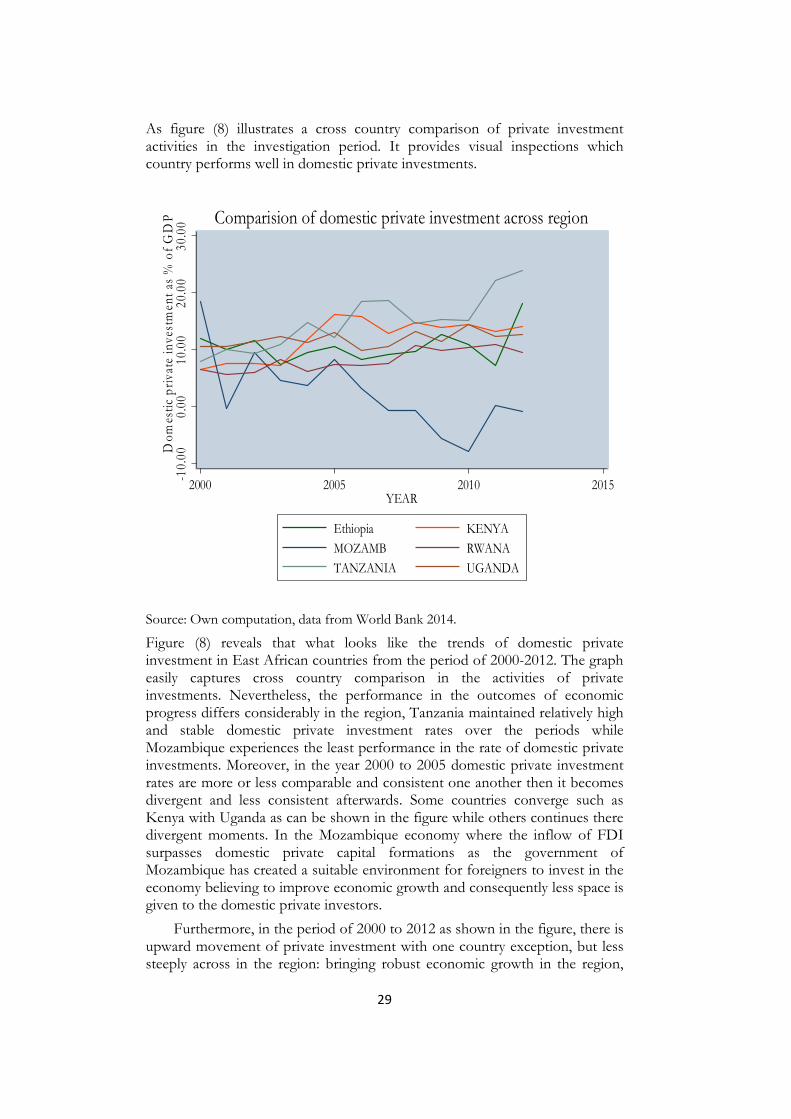
29
As figure (8) illustrates a cross country comparison of private investment activities in the investigation period. It provides visual inspections which country performs well in domestic private investments.
Source: Own computation, data from World Bank 2014.
Figure (8) reveals that what looks like the trends of domestic private investment in East African countries from the period of 2000-2012. The graph easily captures cross country comparison in the activities of private investments. Nevertheless, the performance in the outcomes of economic progress differs considerably in the region, Tanzania maintained relatively high and stable domestic private investment rates over the periods while Mozambique experiences the least performance in the rate of domestic private investments. Moreover, in the year 2000 to 2005 domestic private investment rates are more or less comparable and consistent one another then it becomes divergent and less consistent afterwards. Some countries converge such as Kenya with Uganda as can be shown in the figure while others continues there divergent moments. In the Mozambique economy where the inflow of FDI surpasses domestic private capital formations as the government of Mozambique has created a suitable environment for foreigners to invest in the economy believing to improve economic growth and consequently less space is given to the domestic private investors.
Furthermore, in the period of 2000 to 2012 as shown in the figure, there is upward movement of private investment with one country exception, but less steeply across in the region: bringing robust economic growth in the region,
-10.
000.
0010
.00
20.
00
30.0
0D
om
esti
c p
riva
te i
nve
stm
ent
as %
of
GD
P
2000 2005 2010 2015YEAR
Ethiopia KENYA
MOZAMB RWANA
TANZANIA UGANDA
Comparision of domestic private investment across region
30
stimulating and creating a favorable environment for domestic private investment rates is crucial issue. Still further effort needs to precisely diagnose the constraints for the development of domestic private investments in the region.
4.1.2 Macroeconomic Indicators of East African Countries during
the Period of 2000-2012
Following SAPs in which an improving macroeconomic environment through deregulation and privatization process and elimination of trade barriers in the 1980s and early in the 1990s allowed the economies of these developing countries to become more market oriented, and able to reduce budget deficits and induce the growth of economies. After all, what are the associated factors in the performance of private investment activity in the region and what makes one distinct from the other, thus, table (4) shows a descriptive overview of the six East African countries economic performance and associated factors from the period of 2000-2012.
Thus, table (4) explicitly shows there is preliminary evidence on macroeconomic performance of East African countries as first glance to further investigate what determines private investment in this region. Finally, taking main indicators as main explanatory variables and further accounts in the FE models and figure out what truly explains the variability of domestic private investment in the region and its validities. Subsequently, precautions should be taken in the sense of intensity of macroeconomic adjustment program; the occurrence of economic crises and the performance outcomes of these countries vary accordingly.
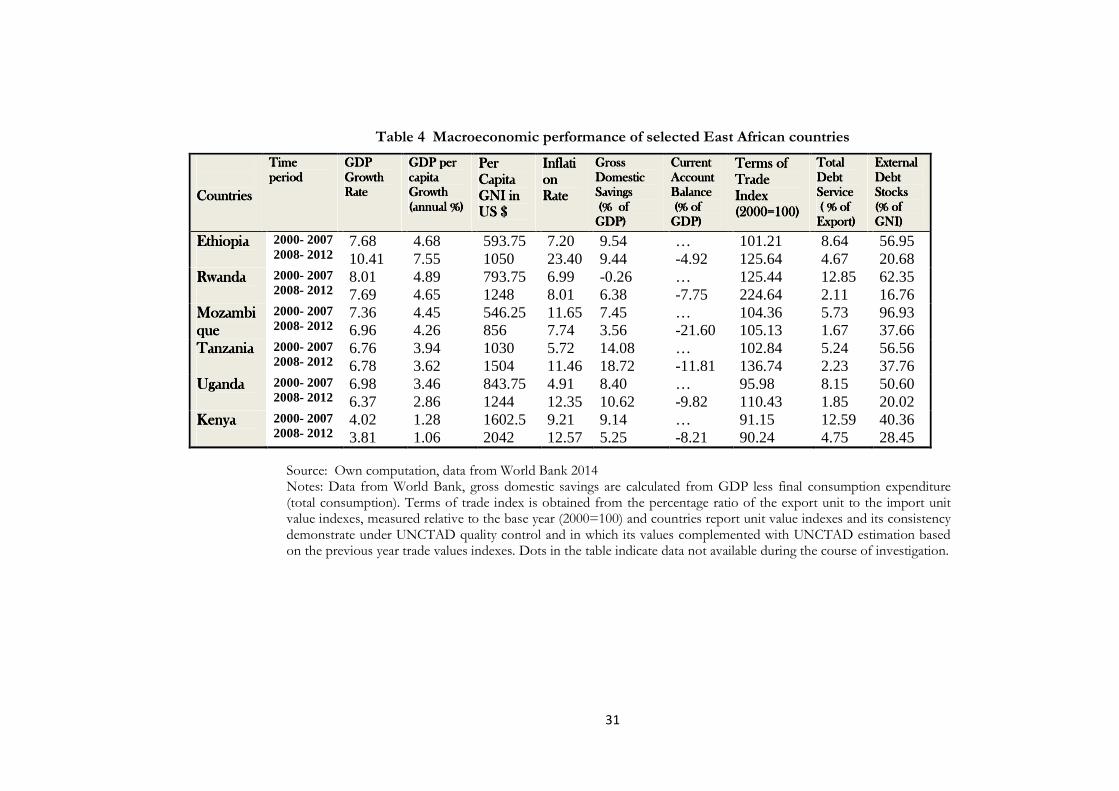
31
Table 4 Macroeconomic performance of selected East African countries
Source: Own computation, data from World Bank 2014 Notes: Data from World Bank, gross domestic savings are calculated from GDP less final consumption expenditure (total consumption). Terms of trade index is obtained from the percentage ratio of the export unit to the import unit value indexes, measured relative to the base year (2000=100) and countries report unit value indexes and its consistency demonstrate under UNCTAD quality control and in which its values complemented with UNCTAD estimation based on the previous year trade values indexes. Dots in the table indicate data not available during the course of investigation.
CountriesCountriesCountriesCountries
Time Time Time Time periodperiodperiodperiod
GDPGDPGDPGDP Growth Growth Growth Growth RRRRateateateate
GGGGDP per DP per DP per DP per capita capita capita capita GGGGrowth rowth rowth rowth (annual %)(annual %)(annual %)(annual %)
Per Per Per Per CCCCapita apita apita apita GNI in GNI in GNI in GNI in US $US $US $US $
InflatiInflatiInflatiInflation on on on RRRRateateateate
Gross Gross Gross Gross Domestic Domestic Domestic Domestic SSSSavingsavingsavingsavings (% of (% of (% of (% of GDP)GDP)GDP)GDP)
Current Current Current Current Account Account Account Account BalanceBalanceBalanceBalance (% of (% of (% of (% of GDP)GDP)GDP)GDP)
Terms of Terms of Terms of Terms of Trade Trade Trade Trade IIIIndexndexndexndex (2000=100)(2000=100)(2000=100)(2000=100)
Total Total Total Total Debt Debt Debt Debt SSSServiceerviceerviceervice ( % of ( % of ( % of ( % of Export)Export)Export)Export)
External External External External Debt Debt Debt Debt SSSStocks tocks tocks tocks (% of (% of (% of (% of GNI)GNI)GNI)GNI)
EthiopiaEthiopiaEthiopiaEthiopia
2000- 2007 2008- 2012
7.68 10.41
4.68 7.55
593.75 1050
7.20 23.40
9.54 9.44
… -4.92
101.21 125.64
8.64 4.67
56.95 20.68
RwandaRwandaRwandaRwanda
2000- 2007 2008- 2012
8.01 7.69
4.89 4.65
793.75 1248
6.99 8.01
-0.26 6.38
… -7.75
125.44 224.64
12.85 2.11
62.35 16.76
MozambiMozambiMozambiMozambiquequequeque
2000- 2007 2008- 2012
7.36 6.96
4.45 4.26
546.25 856
11.65 7.74
7.45 3.56
… -21.60
104.36 105.13
5.73 1.67
96.93 37.66
Tanzania Tanzania Tanzania Tanzania
2000- 2007 2008- 2012
6.76 6.78
3.94 3.62
1030 1504
5.72 11.46
14.08 18.72
… -11.81
102.84 136.74
5.24 2.23
56.56 37.76
UgandaUgandaUgandaUganda
2000- 2007 2008- 2012
6.98 6.37
3.46 2.86
843.75 1244
4.91 12.35
8.40 10.62
… -9.82
95.98 110.43
8.15 1.85
50.60 20.02
Kenya Kenya Kenya Kenya
2000- 2007 2008- 2012
4.02 3.81
1.28 1.06
1602.5 2042
9.21 12.57
9.14 5.25
… -8.21
91.15 90.24
12.59 4.75
40.36 28.45
32
The salient features of East African countries economic growth process as can be shown in the macroeconomic indicators in the last decade revealed that there are significant differences in the real GDP growth and per capital growth across countries. For instance, Ethiopia has different economic growth in response of macroeconomic policies whereby the real GDP grew on average of 7.68% in 2000-2007 and increased to 10.40% in 2008-2012. This robust and inclusive growth of Ethiopia places the country among the top performing African countries as the NBE (2012) noticed that for these achievements many factors are associated with the stated economic growth, conducive policy and the environment for best productivity; For this reasons the agriculture sector grew remarkably using improved variety and favorable environmental condition; Also central bank noticed the government statement of Ethiopia which claims industry sector has become enhanced by more than 15.0% during the 2010 fiscal year onwards and this is supported by investment in basic infrastructures and the construction sector along with service becomes stimulated.
In the same vein, per capita GDP growth increased from on average 4.68 to 7.55 % and average per-capita GNI2 in US Dollar increased from 593.75 in the year 2000-2007 to 1100 in the year 2008-2012 moved from lower-income to lower-middle income. Inflation rate increased on average from 7.20 to 23.40, i.e. from single to double digit inflationary pressure. This was attributed by the high price of food items and other commodities, mainly fuel prices in the international markets and further constraint was faced by the domestic supply side and high growth rates of reserve money which aggravated the existence of high inflationary pressure. Average gross domestic saving as a percentage of GDP became stagnant and didn’t show any significant variation. The current account balance shows there is a deficit, which accounts on average 4.92 % of GDP from the year 2008 to 2012.
Terms of trade index show a decline from 2000-2004 which is negative value later it shows an improvements and it became on average 125.64 from the year 2008-2012 where its index values is (2000=100). The experience of decline movements in the terms of trade reflects as export items are depends on the primary commodity and as its prices deteriorate which leaves a substantial impact on the terms of trade. The occurrence of debt service as percentage of export and external debt stock as a % of GNI shows deterioration (8.64 to 4.67 and 56.95 to 20.68 respectively) but still its presence might affect the activity of private investment by diverting the available resources to overcome the existing external debts.
2Data obtained from World Bank, GNI is equivalent to the sum of value added
by producers of all resident and plus any product taxes (less subsidies) that is not
incorporated in the valuation of output plus net receipts of primary income
(compensation of employees and property income) from abroad. Estimated low
income countries are ($1,045 and less); lower- middle income countries are
($1,046 and $4, 125).
33
Kenya in the period of 2000-2012: Kenya experienced GDP growth rates of 4.02% from the period of 2000- 2007 and 3.81% later on, for this result there are different assertions that lead to perform such economic growth. Among the stated factors are an increment of fuel prices, unfavorable weather conditions in the agriculture sector, which contribute a higher share to the country’s GDP (i.e. more than 20%) and high costs of inputs that resulted from higher fuel prices added up together leaves undesirable effect on the economy of Kenya (CBK 2012). Furthermore, after Kenya’s election in the 2007, the growth rates of the economy experienced different obstacles where the post-election violence in the 2008 and 2009 and unfavorable climate conditions especially drought incident caused the economy to grow only 1.53 and 2.74 % respectively. In addition, in 2011 and 2012, severe climate condition and an unstable macroeconomic environment put another undesirable effect on the growth of the economy. However, the growth rate of the economy shows relatively robust where 4.42 and 4.55 % respectively.
Moreover , on average inflation was accelerated from 9.21% in 2000-2007 to 12.57% in 2008-2012, this is attributed to high food and oil prices, which led to an incidence of high inflationary pressure, a deteriorated exchange rate and a rapid increment of interest rates especially in the period of 2011/2012 worsen the situation. In the same vein, GDP per capita decline from 1.28 to 1.06, gross domestic saving deteriorated from 9.14 to 5.25 % of GDP, it leaves undesirable effect on investment activity where unable to mobilize domestic resources and since saving rate declines couldn’t finance investment activities. In doing all this, Kenya during the period 2000-2012 remain grouped in lower-middle income countries since the average per capita GNI in US Dollar on average are 1602.5 and 2042 respectively from the period of 2000-2007 and after 2007. In addition to this, as there is an existence of current account deficit, which is 8.21 % of GDP, there are factors that could leave an undesirable effect on macroeconomic environments. Terms of trade show negative value taking 2000 as the base year, thus it has less export capacity in the relation to the import of goods and services.
Uganda in the period of 2000-2012: Uganda experiences different growth performance where from the period of 2000 to 2007 GDP growth rate was 6.98 % and later it became on average 6.37% growth, which leads to deteriorating GDP per capita growth on average from 3.46 to 2.86 %. This reduction in the economic performance is linked with different assertions. As Sender and Erik (2009) pointed out global financial crises leaves an undesirable effect on the price of export items (coffee and cotton and flowers) after the year 2007 and worsen the balance of payments through a decline in export revenue which was related to the price of items, not on the volume of export items.
Moreover, fluctuation of international commodity prices affects the domestic economy. In the export of items in the economy almost 20% of revenue is from coffee exports and where the destiny to international markets mainly in Europe (financial crises occurred next to US) affects the economy undesirably (Evarist et al. 2010). Domestic saving shows an improvement from 8.40 to 10.62 % of GDP, which is believed to finance investment projects domestically. Progress shows in the per capita GNI and on average from 843.75 to 1244 US dollar and moved from low-income to lower-middle income. Terms
34
of trade index show an improvement on average from 95.98 from the year 2000-2007 to 110.43 after the year 2007 while taking (2000 =100) as the base year. Total debt service as a percentage of export declines and external debt stock declines as well, but still there exists a high external public debt. Thus, the economy of Uganda experiences home grown problems and externally interlinked factors on the performances of the macroeconomic environment.
Tanzania in the period of 2000-2012: Tanzania experiences robust economic growth from the period of 2000 to 2012. This growth is supported by prudent fiscal policy resulting from an improvement in domestic revenue, and domestic saving increased from 14.08% to 18.72 % of GDP. Tanzanian economy mainly depends on agriculture which accounts for more than 25% of GDP, offers 85% of exports, and 80% of the work force is also engaged in this sector of the economy. With the existence of this reality economic growth rate is supported by investments in infrastructure activity and recording robust economic growth in different time reflected by improvement in the communication and service sector and the growth of the financial sector by reforming the financial sector stimulating the growth of credit to the private sector of the economy (Bank of Tanzania 2009).
Moreover, there is an improvement in the per capita GNI from 1030 to 1504 US dollars, but remain grouped in the category of lower-middle income countries. The growth of GDP is influenced by global financial and economic catastrophes through trade channels and capital inflows into the economy of Tanzania (Bank of Tanzania 2009).In doing all this, the economy experiences GDP growth in 2009 shows a relative decline i.e. 6.02% from 7.44 % in the year 2008. Average performance was 6.76% and 6.78% from the year 2000-2007and 2008-2012 respectively as shown from table (4).
Mozambique in the period of 2000-2012: SAPs launched in Mozambique in 1987 and various macroeconomic performances has been realized. The Structural Adjustment Facility (SAF) till 1990 assisted the program and support macroeconomic environments. This program sustained to a second phase until the period of 1995 with an enhanced SAF until the middle of 1999 (IMF 1999). This policy with approved government’s targeted areas and economic reforms supported by the World Bank facilitates and the lending program allows creating a favorable environment for the investment climates.
Moreover, during the year 2011 and onwards Mozambique’s economy was mainly stimulated by the production of coal mining projects which became functional in 2011 and makes the economy experiences new dimensional growth and export performance rises from this coal mining project, and creates a suitable macroeconomic environment and strong fiscal performance via providing strong export performance from natural resources. In addition to this, financial sector development, transport and communication service and construction development supported the economic growth rate of Mozambique. High records FDI inflows and growth of the agricultural sector supports the robust economy growth of Mozambique. Furthermore, a recent high infrastructure investment which stimulates other sectors of the economy and has also created a favorable environment for the high inflow of FDI into the economy (AfDB et al. 2012).
35
Despite in doing all this, Mozambique as shown in the per capita GNI in US Dollar which is below $1,045 and categorized under in the LICs group. State led system in the economy and huge infrastructure investments of government aggravates the presence of fiscal deficits. Thus, the presence of fiscal challenges in the governments of Mozambique is solved by different scenarios, one side, creating a positive environment for the private sector and reducing the fiscal deficit and other side while expanding infrastructure and allied activities should target on priority projects and appropriate pro-poor policies.
Rwanda in the period of 2000-2012: In the Rwandan economy, despite the growth of agricultural production and a low growth rate of broad money in the economy, inflationary pressure accelerated in the economy and in the year 2007 annual average has reached 9.08% and 15.44% in the year 2008. For this acceleration of inflation in the economy, high price of international fuel and food price are mentioned as the cause to this instability in the economy (National Bank of Rwanda 2008). The economy growth rate relatively shows robust and sustained and 8.01% and 7.69% real GDP growth rate during 2000-2007 and 2008-2012 respectively. Similarly, total debt service and external debt stock percentage of GNI shows decline but there is still exists high public debt. As per capita GNI in US dollar increased from 793.75 to 1248 US dollar and moved from low-income to lower middle income countries category. Domestic saving that enables to finance investment activities domestically shows an improvement.
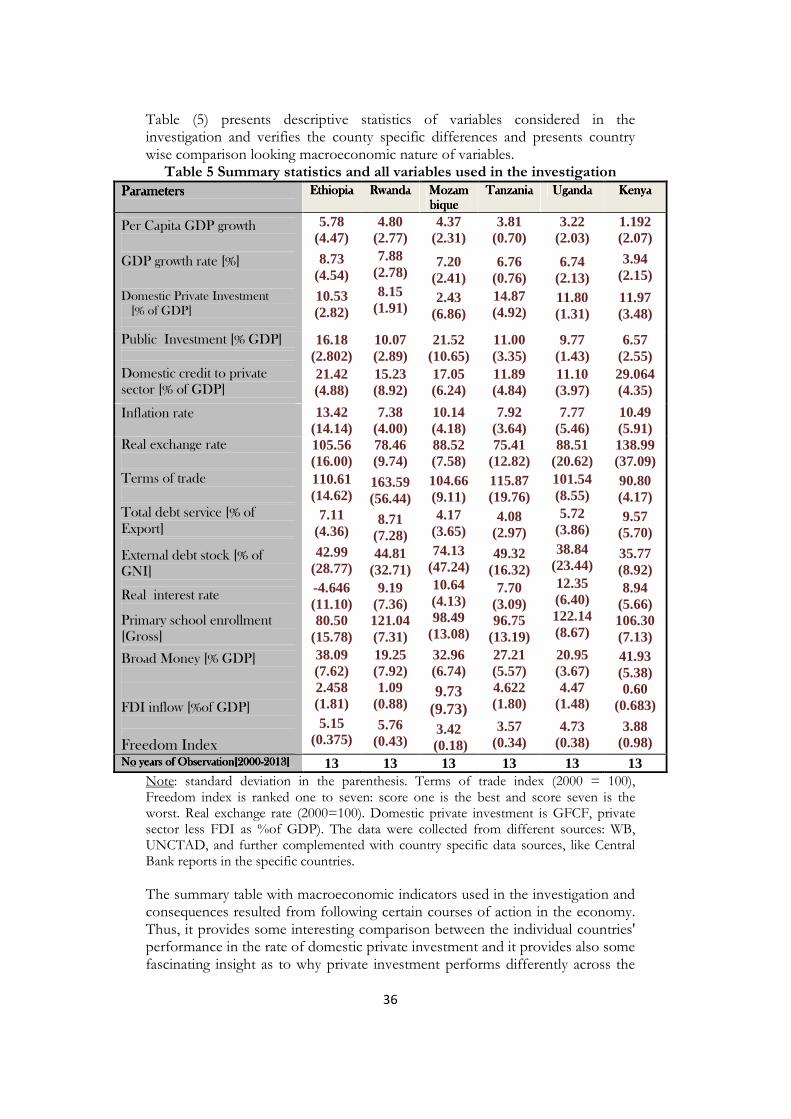
36
Table (5) presents descriptive statistics of variables considered in the investigation and verifies the county specific differences and presents country wise comparison looking macroeconomic nature of variables.
Table 5 Summary statistics and all variables used in the investigation
ParametersParametersParametersParameters EthiopiaEthiopiaEthiopiaEthiopia RwandaRwandaRwandaRwanda MozamMozamMozamMozambiquebiquebiquebique
TanzaniaTanzaniaTanzaniaTanzania UgandaUgandaUgandaUganda KenyaKenyaKenyaKenya
Per Capita GDP growth
GDP growth rate [%]
Domestic Private Investment [% of GDP]
5.78 (4.47)
8.73 (4.54)
10.53 (2.82)
4.80 (2.77)
7.88 (2.78)
8.15 (1.91)
4.37 (2.31)
7.20 (2.41)
2.43 (6.86)
3.81 (0.70)
6.76 (0.76)
14.87 (4.92)
3.22 (2.03)
6.74 (2.13)
11.80 (1.31)
1.192 (2.07)
3.94 (2.15)
11.97 (3.48)
Public Investment [% GDP]
Domestic credit to private sector [% of GDP]
16.18 (2.802)
21.42 (4.88)
10.07 (2.89)
15.23 (8.92)
21.52 (10.65)
17.05 (6.24)
11.00 (3.35)
11.89 (4.84)
9.77 (1.43)
11.10 (3.97)
6.57 (2.55)
29.064 (4.35)
Inflation rate 13.42 (14.14)
7.38 (4.00)
10.14 (4.18)
7.92 (3.64)
7.77 (5.46)
10.49 (5.91)
Real exchange rate
Terms of trade
Total debt service [% of Export]
External debt stock [% of GNI]
Real interest rate
Primary school enrollment [Gross]
Broad Money [% GDP] FDI inflow [%of GDP]
Freedom Index
105.56 (16.00)
110.61 (14.62)
7.11 (4.36)
42.99 (28.77)
-4.646 (11.10) 80.50
(15.78)
38.09 (7.62) 2.458 (1.81)
5.15 (0.375)
78.46 (9.74)
163.59 (56.44)
8.71 (7.28)
44.81 (32.71)
9.19 (7.36) 121.04 (7.31)
19.25 (7.92) 1.09
(0.88)
5.76 (0.43)
88.52 (7.58)
104.66 (9.11)
4.17 (3.65)
74.13 (47.24)
10.64 (4.13) 98.49
(13.08)
32.96 (6.74)
9.73 (9.73)
3.42 (0.18)
75.41 (12.82)
115.87 (19.76)
4.08 (2.97)
49.32 (16.32)
7.70 (3.09) 96.75
(13.19)
27.21 (5.57) 4.622 (1.80)
3.57 (0.34)
88.51 (20.62)
101.54 (8.55)
5.72 (3.86)
38.84 (23.44)
12.35 (6.40) 122.14 (8.67)
20.95 (3.67) 4.47
(1.48)
4.73 (0.38)
138.99 (37.09)
90.80 (4.17)
9.57 (5.70)
35.77 (8.92)
8.94 (5.66) 106.30 (7.13)
41.93 (5.38) 0.60
(0.683)
3.88 (0.98)
NNNNoooo yearsyearsyearsyears of Observationof Observationof Observationof Observation[2000[2000[2000[2000----2013]2013]2013]2013] 13 13 13 13 13 13 Note: standard deviation in the parenthesis. Terms of trade index (2000 = 100), Freedom index is ranked one to seven: score one is the best and score seven is the worst. Real exchange rate (2000=100). Domestic private investment is GFCF, private sector less FDI as %of GDP). The data were collected from different sources: WB, UNCTAD, and further complemented with country specific data sources, like Central Bank reports in the specific countries. The summary table with macroeconomic indicators used in the investigation and consequences resulted from following certain courses of action in the economy. Thus, it provides some interesting comparison between the individual countries' performance in the rate of domestic private investment and it provides also some fascinating insight as to why private investment performs differently across the
37
region of East Africa. On average, domestic credit is relatively higher in Kenya, which is 29.06 % GDP; this may create an important implication to contribute higher investment rates for the private sectors. Moreover, on average highest broad money as a percentage of GDP is seen in Kenya, which reflects the development of financial growth and expresses partly the records of highest private sector development in the country.
In Mozambique the public sector investment rate was highest recorded in the investigation period and least on the domestic private investment as percentage of GDP. On average, there is an existence of the highest external debt stock as a percentage of GNI, which may be linked with lower participation of domestic private investment rates in the country. There is theoretical justification with a ‘debt overhang’ effect on the economy when the existence of high external debt can reduce funds available for the investment purpose and less incentive for investment.
Similarly, human capital development, on average Uganda, Rwanda, and Kenya shows relative high gross primary school enrollment during the periods of 2000-2012. Likewise, the level of freedom index, lowest freedom in Rwanda (5.76), and highest freedom in Mozambique (3.42) where the highest index number indicates lowest freedom (individual freedom and civil liberties) and vice versa.
As the sample of East African countries indicates the growth of private investment rates are not impressive and linked with the lowest growth rates of the economy. As explained above in some countries the share of public investment is higher than the participation of private sector in the economy as a percentage of GDP. Unlike experiences taken from developed countries as the share of private sector investments surpassed the public one, the existing experiences of East African countries confirmed that the problem of a vicious circle that linked with low contribution of the private sector in the economy and lower GDP growth rates in the region.
Within the stated factors, it needs demand for development practitioners to paint possible pictures for investment and decision-making capacity and critically examine the existed policy related to actions in the development strategy of the region of East Africa. When governments made an effort to adopt some models of development strategy; it is continually criticized in hindering private sector involvement in the business activities and creates imbalance in the macroeconomic environments. This is at least confirmed its validity in Ethiopia.
4.2 Empirical Results of Regional Investigations
As can be shown in table (6) which presents a cross country investigation of the result of the specified outcomes of OLS and fixed effect models and the result favors FE model estimation and the interpretation based this model output with the given significant levels.
This paper seriously follows the flexible accelerator investment theory taking proxy variables based on the stated hypotheses and theoretical setups during the course of investigation.

38
Table 6 Estimated Parameter for specified models
Fixed Effect Pooled OLS Explanatory Variables Levels
(1) Logs (2)
Levels Logs (3) (4)
Real GDP growth (t-1)
Internal variables
0.4714*** (0.157)
0.0433*** (0 .014)
0.131 0.0102 (0.157) (0.016)
Public investment (% of GDP)
Domestic credit to private sector % of GDP
Real interest rate
-0.1572* (0.300) 0.0469* (0.1059)
-0.0198* (.0693)
-0.0435* (0. 029) 0.01034* (0.009)
-0.00155* (0 .0063)
-0.24*** -0.096*** (0.28) (0.036) 0.106* 0.0154* (0.1442) (0.0155) -0.1691** -0.0072 (.078) (.0089)
Inflation (t-1)
Broad Money % of GDP
-0.0846* (0 .051)
0.0194 (.1006)
-0.0083* (0.0045)
0 .0028 (.0090)
-0.0452 -0.0054 (0.052) (0.0053)
0.170* 0.018 (.098) (.0127)
Real Exchange Rate (t-1)
Freedom Index External Variables Terms of trade(t-1)
External Debt stock
FDI as % of GDP
Total debt service
Human Capital Development
School enrollment (Primary)
Intercept
R-squared
F-test of fixed effects
Hausman test statistic:
-0.0198* (0.0693) -1.457** (1.152)
-0.0574** (.0234)
-0.082*** (.0268)
0.0294 (0.3328) -0.2800 (0.194)
0.00292* (.0453)
7.233 (7.704)
0.79
2.98*** (0.0025)
0.000 (0.999)
-0.00035* (.00256) -0.397** (.1099)
-0.0050** (0 .0020) -0.009***
(.0025) -0.1771*** (0.0373) -0.02279 (0.017)
0.00680* (.00429)
3.44*** (0.713)
0.7545
11.11**** (0.000)
-0.0232 -0.0040 (.032) (.0030) -0.5308 0.0132 (.861) (.0107)
-0.0536** -0.0029 (0.025) (0.0027) -0.0216* -0.0015* (0.0263) (.0035) 0.953*** -0.0223 (0.330) (0.0632) -0.1227 -0.0393* (.136) (0.0219)
0.1073* 0.0095* (.0532) (.0056)
25.77*** 4.49*** (7.97) (1.053)
0.5394 0.5642
Number of observations 72 66 72 66 Notes: Robust standard errors in parentheses for OLS and FE models. Significance levels are *** p<0.01, ** p<0.05, * p<0.1. The dependent variable is domestic private investment in level and log form. Explanatory variables entered in the form of lags are to reduce the occurrence of possible simultaneous bias during estimation of coefficient parameters. Variable TOT index taking base year (2000 = 100), Freedom index is ranked one to seven: score one is the best and score seven is the worst which is taken from countries freedom house index.
39
As can be shown in table (6), pooled OLS considers all individual countries together by pooling and this leads to deny heterogeneity or individuality among countries under investigation, thus cross section and time series dimensional nature of the data become neglected. Hence, OLS gives inconsistent and biased results since it doesn’t consider heterogeneity and time-invariant factors. The Hausman specification test was performed to know fixed or random effect model is appropriate and the result favors for FE estimation strategy and the interpretation is based on this model.
4.2.1 Determining factors of domestic private investments
When considering all countries together using pooled regression, it confirms that domestic private investment is encouraged by real GDP growth, improvements in financial intermediation, which is captured by broad money as a percentage of GDP and credit to the private sector, FDI and human capital development as indicated by primary school enrollment. In the contrary, domestic private investment is negatively associated with the rate of inflation, real interest rate levels, public investment activities, real exchange rate movements, the existence of external debt stocks and freedom index level. Pooled OLS used as baseline comparison and FE deals with getting rid of time invariant and unobserved difference across in the region.
In light of these, table (6) presents determinant factors of domestic private investment in East Africa countries using FE model specification where it allows for heterogeneity or individuality in the analysis and accounts country specific parameters across countries and time-invariant factors get rid from the model. Significant variables that are substantially affects domestic private investments in the investigation periods are Real GDP growth, financial intermediation, and human capital development as primary school enrollment which are positively associated. In the contrary, the rate of inflation, public investment, terms of trade, External debt stock, Freedom index level, real exchange rates and real interest rates affects domestic private investment negatively. Thus, detailed investigations of significant parameters are as follows.
The effect of real GDP growth rates in East African region exhibits a positive and significant effect on the growth of domestic investment rates. In the region, as real GDP growth increases across time by one unit, it raises domestic private investment activity as a percentage of GDP by 0.47 units or from log specification it is increased by 4.33%. This result is consistent with (Blejer and Khan 1984; Green and Villanueva 1991; Fielding 1997; Harupara 1998; Jalloh 2002; Ghura and Goodin 2000). For instance real GDP growth of Ethiopia on average 8.73%, Uganda 6.74% and Tanzania 6.76% from 2000-2012 growth performance associated with a positive effect on the growth of domestic private investments in the region. Thus, further economic growth leads rewarding effect since it contributes to raise the income of the people and contributes to raise GDP per capita income and leads to generate higher income and stimulates effective demand through rising disposable income. Thus, it encourages private investors to spent and re-invest further to meet people desire for goods and services. As explained by Greene and Villanueva (1991)as income rises, capacity to manage resources to domestic saving rises and able to get more finance and commence new investment projects. Thus, it also creates consistent with expectations of neoclassical investment theory, positive association between
40
private investment and income growth rate. When income per capita increases, it opens new perspective to allocate more resources for the purpose of domestic saving and be able to finance various investment projects. Thus, the existed economic growth rates of East African countries have attributed positive effect on the growth rates of domestic private investments during 2000-2012.
In the similar way, credit to the private sector, which captures as indication for financial development exhibits positive and significant effect on private investment activity in East Africa. In the region when credit to the private sector increase across time by one unit, domestic private investment as % of GDP increases by 0.0469 units. Financial requirement that is required to commence investment projects has encouraging effect on the development of private sector investments. Hence, it creates a favorable environment by creating linkage in facilitating decision to invest and increases technological specialization and selection of projects to be launched and attached with further risk diversification. This is consistent with empirical investigation of (Harvey 1985; Oshikoya 1994; Kumar and Mlambo 1995; Workie 1997; Harupara 1998; Getachew1997).
Moreover, private sector firms in East African countries, mainly depend on bank credit to finance for the investment projects, since financial markets are not well developed and credit given to the private sector with the preferential interest rate affects the private investment rates positively. Alternatively, the need of financial deepening in enhancing private sector development in the economy captured by broad money as a percentage of GDP also shows a positive impact.
Furthermore, human capital development taking school enrollment as one of explanatory variable captures positive and significant effect on the rate of domestic private investment activities in the region. This result is consistent with the findings of Ghura and Goodwin (2000). School enrollment rises in the region and creates stimulating effect on the development of domestic private investment rates. The highest enrollment rate in Uganda, Rwanda and Kenya mentioned in this perspective. The recent growth models emphasize the role played of human capital development in the long term growth and enhances product and productivity in the economy, through different channels either used as a direct input into research as explained by Romer (1990) or enriches knowledge by spillover comes from positive externality as described by Lucas (1998), the role played by human capital accumulation in the production process. In addition, educational development creates awareness in the production process, enhances efficiencies in using inputs and technology transfer and raises long term profitability. As Barro (1991) argued that countries equipped with higher human capital reflects lesser fertility rates and greater ratios of physical investment to GDP.
On the contrary, the unstable exchange rate movement affects domestic private investment rates negatively. Real devaluation of exchange rate affects domestic private investment negatively through raising the real cost of imported goods. This result is consistent with the findings of (Oshikoya1994; Jalloh 2002; Harupara 1998). East African countries import a large amount of good for investment, depreciation of the nation’s currency leads to raise the cost of these imported goods and consequently lowers the domestic private investment activity in the region. Likewise, real exchange rate appreciation in the time of
41
higher export capacity causes to lose external competitiveness; and affects the rate of domestic private investments negatively.
Following this, countries' experience in the time of reducing the external imbalance of the economy is cutting back excessive expenditures and switch to domestic goods. This can be done by following policies that lead such switching expenditure effect at the time of a real devaluation of currencies. However, basic inputs of investment activities are constituted appropriate mixture of machineries; equipment’s used for construction purpose obtained from domestic and imported items. Thus, the real devaluation policy affects investment activity by increasing the relative prices of these imported capital goods and creates adverse shocks on the supply of input items in the investment activities. Hence, exchange rate policies have substantial impact on the volume and composition of investment activity in the region of East Africa.
Moreover, the situation of political freedom confirmed that its effect on the growth of domestic private investment has negative with a 5 % level of statistical significant impact in the region. In which it reflects political environment and associated with creating market friendly institutions and well defined property rights. The average freedom index ranges from 3.42 in Mozambique relatively highest freedom and 5.76 in Rwanda the lowest freedom and the other countries lies between this range in the region. Thus, there is a lowest freedom level index in the region and negatively affects the rate of domestic private investments in the region. Similarly, Ghura and Goodwin (2000) confirmed its negative effects in the cross country analysis of LDCs private investment rates. Across different time the presence of political tension and instability, social unrest and other related activities deteriorates the economic growth and capital accumulation rates in the region.
The inflation rate as macroeconomic instability exhibits negative and statistically significant at the 10 % level of significant. In the region, as inflation increases across time by one unit, domestic private investment as percentage of GDP lowers by 0.0846 units. This result is consistent with the empirical findings of (Green and Villanueva 1991; Oshikoya 1994; Harupara 1998). Hence, inflation as a proxy for macro instability alters the information system of the relative prices and attached with high riskiness of the projects. It leaves a negative impact on the long term investment prospects. The negative effect of inflation in the investment model either leads to an unexpected decline in the aggregate demand or causes for the deterioration of purchasing power of money, less space to save money in the bank and unable to finance for investment project opportunities. Thus, due to the stated factors as inflation directs towards economic uncertainty and has negative impact on the rate of private investment activities in the region where the unstable price of items are persists. During 2000-2012 on average double digit inflationary pressure in Ethiopia 13.42 %, Kenya 10.9 % and Mozambique 10.14 % recognized in the region.
External Debt: The existence of external debt stock is negatively associated with a 1 % level of significance on domestic private investment rates in East African countries. In the region when external debt rises across time by one unit, domestic private investment as percentage of GDP decreases by 0.082 units. This is supported by many empirical papers (Greene & Villanueva 199; Oshikoya 1994; Workie 1997) confirms the adverse effects of external shocks on the

42
functioning of private investment performance in the economy. As can be shown in summary statistics part, on average the presence of high external debt burden in the region lies between on average 35.77 to 74.13 as Percentage of GNI. Thus, this external debt creates uncertainty in the macroeconomic environment and ‘crowding-out’ credits allocated for private investment where large debt service payment has involved and may face liquidity constraints in global capital markets because of large sum of unpaid debt service obligations. As `debt overhang' (Krugman 1988) explains large amount of debt eliminates the incentive for investors because returns from investors used for reimburse the existing debt and puts pressure on current and future tax burden on private investors.
Moreover, uncertainly of time and the amount of external debt transfers to the creditors as it is subject to future levels of world interest rates, the direction in terms of trade and the competency to reschedule the existed debt services in the economy. Thus, high debt affects the region and support to get rid of the existing debt using debt relief strategy of HIPCs categories by the IMF and World Bank in 1996 assists these countries. Since, East Africa countries are among those countries identified as heavily indebted poor countries, with this initiative needs required to support these countries complement with adjustment programs and certain reforms in the economy.
Terms of trade: fluctuation of terms of trade exhibits a negative impact with a 5 % level of statistical significance in influencing domestic private investment rates in the region. It might have linked with export capacity of East African countries depends on the primary commodities. Less of export earnings in relative to cost imports of goods and services have negative impact on the level of private investments through deteriorating the current account deficit. This result is consistent with the Ghura and Goodwin (2000).
4.2.2 Public investment vs. Domestic private investment
The effect of public investment has a substitution effect on the growth of domestic private investment in the region since the coefficient is negative with a 10 % level of statistically significant impact. When public investment rises across time by one unit, domestic private investment as percentage of GDP decreases by 0.15 units or from log specification it is decreased by 4.35%. With the highest proportion of public sector investment exhibits in the economy and utilizes both physical and financial resources in the region and ‘crowds out’ the domestic private sector investments in the region. In Ethiopia, Rwanda and Mozambique the highest percentage proportion of public investment in the economy, which exceeds the domestic private investments leaves negative effect on it.
Moreover, public investment activities conducted with the existence of budget deficit creates unfavorable effects through raising interest rates, limiting credit available to the private sector and impose current and future tax burden on the activity of domestic private sector in the economy. This also supported by when public investment increase aggregate demand increases and this leads to raise the demand for money, which causes to increases interest rates, and interest sensitive private sector firms discourages.
Within all these potential channels, the domestic private sector in East African countries discourages by this non-developmental activities of public
43
sector investments. This result is consistent with (Balassa 1989; Mlmbo and Elhiraika 1997). However, developmental aspects of public investment creates potential links with essential and proper functioning of the market allowed to increase the rate of private sector investments via providing physical infrastructure investments when government’s spending in infrastructure activity allows to promote and stimulate private returns through providing public goods and various transport access and different basic facilities including communication, electricity and school, health and water etc. In doing this, government creates favorable environment for the private investors through credibility and commitment in assuring the sustainability of future through providing public facilitates for the economy as confirmed by the findings of (Blejer and Khan 1984; Green and Villanuera 1991; Ghura and Goodwin 2000; Jalloh 2002; Ouattara 2004).
4.2.3 Nexus between FDI and Domestic private investment
In this analysis the effect of FDI in East African countries illustrated that there is positive association between domestic private investment and FDI (crowds in)3 in level form but the result is not significant in statistical sense and this result is consistent with Agosin and Machado (2005) who found that there is no statistical significant effect of FDI on domestic private investment when investigating its effect on domestic private investment in Asia, Africa and Latin America countries during the period of 1971-2000. The logged effect after getting rid of outliers’ exhibits negative and statistical significant impact on domestic private investments.
Thus, heterogeneity of countries preference and inflow of FDI in the economy varies accordingly in the region. Highest inflow of FDI in Mozambique which was on average 9.73 as a percentage of GDP where concentrated in the extractive industries and the least has recorded in Kenya on average 0.6 percentage of GDP during 2000-2012. Its presence may lower domestic firm’s productivity using different prospects realizing technological gaps between domestic and foreign firms. Thus, with better and advanced technology, promotion and marketing skill leads to control the market and ‘crowds out’ the domestic investors. Hence, within this investigation causal link between the two parameters needs further investigation with sectoral linkages, particularly in the forms of MNCs effects in the economy, which may have better access for advanced technology, market access at international level and financial capability requires detailed investigation of its effect on domestic firms in country wise
3It has forward and backward linkages systems. In the forward linkages foreign firms able to provide input for the production process of domestic firms. As Mayanja narrates Javorcik’s (2004) idea in the interaction of domestic and foreign firms, domestic firms may be more beneficial and increase productivity with new and effective productive system. Domestic firms have access to new intermediate inputs produced by MNCs with customer oriented and other facilities that may not get from import connection with abroad. In backward linkages, outputs produced from domestic firms provide to foreign firms and increase profitability. In addition, knowledge in the production process transfers from foreign firms to domestic firms and this creates backward spillover generated from foreign firms. Moreover, domestic firms develop their skill and technical capacity and enhance quality of their products with the support of foreign firms and gets different trainings that enhances the production process, control quality, customer handling etc.
44
investigation.
Positive externality of FDI allows increasing capital inflows, technological transfer through introducing new types of products, different productivity experiences and creates links with potential foreign markets through providing intermediate inputs. FDI presence in the economy is believed to have advanced technology and more preferable than domestically grown one in terms of productivity due to this privilege is given to foreign investors expecting positive externality.
Hence, policies that enable to stimulate the inflow of FDI should incorporate all the possible scenarios; even if it doesn’t mean that it has always positive and significant impact on the development of domestic private investments as can be seen in the logged effect it has a negative and significant impact on the region and other sectoral investigation and detailed study on the spillover effects should incorporate and documented for policy interventions.
45
Chapter 5: Concluding Remarks
This paper gives more emphasis to the development of domestic private sector investment in bringing robust economic growth where building strong economy from highest share given to the private sector involvement in the economy. In the region of East Africa where poverty and underdevelopment persists and the private sector investment activity is not extensive enough, state-led system with highest percentage share of public investment exists. Privatization process is so slow and public sector uses significant resources to perform investment activities.
Hence, this paper has tried to answer the determinant factors of domestic private investment, the effect of public sector investments and the response of domestic private investment with FDI presence in the economy of six East African countries during 2000-2012 using a panel data set and follows the flexible accelerator investment theory. It underscores macroeconomic factors in this cross country investigation. An empirical sight in relation with hypothetical bases given due consideration in this analysis.
As illustrated from the result, domestic private investment is significantly affected by different parameters in the investigation period. Evidence from econometric output confirmed that domestic private investment has positively and significantly associated with real GDP growth rates. This connects with the growth of domestic private investments at 1 % level of statistical significance as shown in the FE estimation. It confirms the virtuous circle that outbreaks from the rise of real GDP to the growth of domestic private investment activities in the region and creates consistency with neoclassical theory of investment which claims direct proportionality between private investment and income growth rate through the growth of real GDP. The real GDP growth rates of East African countries have attributed positive effects on the growth of domestic private investments during 2000-2012.
Likewise, credit to the private sector has stimulated the growth of domestic private investment in the region. It connects with the growth of financial systems which provide financing to the required investment projects. But, the FE model output indicates it has only 10% statistical significant impacts in the region. Hence, private firms depend on bank credit to finance investment projects in the region where financial market are not well developed and that might be the reason that took less significant level. Further financial system liberalizing and creating suitable environment for the domestic private investments will stimulate domestic private investments in the region. Thus, need is required to stimulate private investments through well-functioning capital markets that able to transform the available resources from savers to investment activities.
Furthermore, human capital development using primary school enrollment confirmed that it has a significant effect on the development of domestic private investment activities in the region, which is consistent with the recent growth models where human capital development enhances long term productivity in the economy. In the region primary school enrollment becomes increasing and creates a positive impact on the development of domestic private investments through improving knowledge and enhances productivity. But, further effort needs to bring highest significant impact since the output indicates it has only 10% level of significant impact in the region.
46
On the contrary, public investment exhibits substitution effect on the development of domestic private investment activity in the region. As per the FE estimation, it has a negative coefficient with a 10 % level of statistical significance. Thus, the highest percentage proportion of public sector investment in the economy leaves undesirable effect on the development of domestic private investment rates in the region. As confirmed from the summary statistics, there is also a budget deficit in the macroeconomic environment and this circumstance led to create an unfavorable effect on the development private investment in the region through limiting credit to the private sector and creates a high tax burden on the private sectors of the economy. Hence, domestic private investments are inhibited by non-developmental activity of public sector investments through utilizing both physical and financial resources in the region.
Likewise, the rate of inflation negatively affects domestic private investment activities in the region. This indication of macroeconomic instability has a statistical significant impact on the domestic private investments. In the region, unexpected and high inflation affects domestic private investment negatively through an unanticipated decline in the aggregate demand and discourages further production. Similarly, it might be linked with weakening purchasing power of money and deteriorates saving capacity in turn shortage of finance to investment projects. Hence, this unstable price of items leads to economic uncertainty and has negative impact on the domestic private investment activities in the region.
In the same way, real exchange rate movement exhibits an unfavorable effect on the development of the private sector of the economy with 10 % statistical level of significance. Real devaluation raises cost of imported capital goods where East African countries imports large volume of items for investment projects. In a similar way, appreciation real exchange rate also affects domestic private investments in the region at the time of export of goods and services causes to lose competitiveness in the external economy. Thus, unstable exchange rate movements affect domestic private investments negatively and have significant impact on the volume and composition of investment activity in the region. Along with this, fluctuation of terms of trade exhibits a negative impact at the 5 % level of statistical significance in influencing domestic private investment rates in the region. Where export capacity of East African countries depends on the primary commodities. Less of export earnings in relative to high cost imported items have negative impact on the level of domestic private investments.
On average the level of freedom index varies accordingly and ranges from 3.42 in Mozambique and 5.76 in Rwanda with relatively highest and lowest freedom respectively. This confirms the presence of lowest freedom level in the region and negatively affects domestic private investment activities and FE outcome also confirmed that its effect has negative at 5% level of statistical significance. Furthermore, across different time the presence of political tension and instability, social unrest and other related activities deteriorates the economic growth and rates of capital accumulation in the region.
Including others factors, external indebtedness is still a serious problem in the region of East Africa. These countries are among eligible countries for the debt relief program when the HIPCs Initiative was launched by the IMF and

47
World Bank in 1996. In the region the presence of external debt inhibits the growth of domestic private investment with high statistical significance level. High external debt burden in the region lies between on average 35.77 and 74.13 percentage of GNI in Kenya and Mozambique respectively, during 2000-2012 and total debt service as percentage of Export also high. This large external debt creates uncertainty in the macroeconomic environment and ‘crowding-out’ credits allocated for private investment. It also reduces investors’ profits when returns from investors used to reimburse the existing debt and increases tax burden on domestic private investors.
Furthermore, the effect of FDI into the economy of east Africa region confirmed that there is positive and non-significant effect in level, but the logged effect after getting rid of outliers’ exhibits negative and statistically significant impact on domestic private investments. Heterogeneity of countries preference and inflow of FDI in the economy varied accordingly in the region. Highest inflow of FDI in Mozambique which was on average 9.73 as a percentage of GDP where concentrated in the extractive industries and the least has recorded in Kenya on average 0.6 percentage of GDP during 2000-2012. Its presence may lower domestic firm’s productivity using different prospects realizing technological gaps between domestic and foreign firms. Hence, within this investigation causality links between the two parameters needs further investigation with sectoral linkages particularly in the forms of MNCs effects in the economy which may have better access for advanced technology, market access at international level and financial capabilities.
To sum up, this paper has tried to address issues whereby domestic private investment is affected by different macroeconomic parameters: output/ per capita growth, fiscal, monetary and exchange rate movements in the economy. Moreover, this paper has addressed human capital development and freedom index level and response of domestic private investment in the region. To this end, private sector plays a vital role in bringing broad based economic growth and its constraints of different root factors that are inconsistent government policies, poor infrastructure development; and economic constraints and political instabilities should be further addressed. Thus, adjusting fiscal policy through lowering budget deficits minimizes public debt and similarly control of inflation rates and reducing interest rates from monetary policy channels believed to create stimulating and healthy environment for investment climates in the region.
A future line of work needs concentration on investigating the level and composition of domestic private investments as influenced by government investments and under what composition does and quality of domestic private investment is driven by macroeconomic adjustment policies. Furthermore, investigation through exploring income distribution and redistribution effects to the response of domestic private investment activities in the region and country specific circumstances, considering multidimensional aspects of parameters that affects domestic private investments in the region. Finally, to point out the limitation of this article one can include more countries, follow sectoral segregations and can also account micro-economic evidence to explicitly figure out detailed investigations and can overcome the limitation of this article since this article focused on macro and aggregate data in some East African countries only.
48
Bibliography
AfDB, OECD, UNDP, UNECA (2012) African Economic Outlook 2012: Promoting Youth Employment, OECD Publishing. Accessed date: 06/08/2014<www.oecd-ilibrary.org/development/african-economic-outlook-2012_aeo-2012-en>.
Agosin, M. Mayer (2000) 'Foreign Investment in Developing Countries–Does it Crowd in Domestic Investment', Africa': UNCTAD, Discussion Paper, no. 146. Geneva, Switzerland.
Agrawal, N., Z.U. Ahmed, M.M. Mered and M.R. Nord (1993) Structural Adjustment, Economic Performance, and Aid Dependency in Tanzania (EPub).IMF: Washington, D.C.
Ajide, K.B. and O. Lawanson (2012) 'Modelling the Long Run Determinants of Domestic Private Investment in Nigeria', Asian Social Science 8(13): 139-152.
Balassa, B. (1988) 'Public Finance and Economic development', working paper No. 31, World Bank, Washington, D.C
Bank of Tanzania (various Year). Annual Report. Dares Salaam, Tanzania
Bayai, I. and D. Nyangara (2013) 'An Analysis of Determinants of Private Investment in Zimbabwe for the Period 2009-2011', Management 2(6):11-42.
Barro, R. J. (1991)'Economic growth in a cross section of countries'. NBER,No. w3120). The Quarterly Journal of Economics, 106(425):407-443.
Blejer, M.I. and M.S. Khan (1984) 'Government Policy and Private Investment in Developing Countries', Staff Papers-International Monetary Fund: 31(2), 379-403.
Bloom, D.E., J.D. Sachs, P. Collier and C. Udry (1998) 'Geography, Demography, and Economic Growth in Africa', Brookings papers on economic activity: 1998(2):207-295
Bresser-Pereira, L.C. and P. Gala (2009) 'Why Foreign Savings Fail to Cause Growth', International Journal of Political Economy 38(3):58-76.
Cameron, J. (1997) 'Privatization and Public Enterprise Reform in the Asia‐Pacific Region: Privatization and the Real Economic Development Problems of Pakistan', Journal of the Asia Pacific Economy 2(2): 239-249.
Central Bank of Kenya (various years) Annual Reports. Nairobi, Kenya. Accessed date: 08/09/2014<https://www.centralbank.go.ke/index.php/cbk-annual-reports>.
Claessens, S., E. Detragiache, R. Kanbur and P. Wickham (1997) 'HIPCs' Debt Review of the Issues', Journal of African Economies 6(2): 231-254.
Clark, J.M. (1917) 'Business Acceleration and the Law of Demand: A Technical Factor in Economic Cycles', The Journal of Political Economy: 25(1): 217-235.
Deneke, S. (2001) 'Private Sector Development in Ethiopia'. International Conference on African Development Archives. Paper 19.Kalamazoo, Michigan. Accessed date: 05/08/2014. Available at <http://scholarworks.wmich.edu/africancenter_icad_archive/19>.
Devarajan, S., W. Easterly and H. Pack (2001) 'Is Investment in Africa Too High Or Too
Low? Macro‐and Micro‐evidence', Journal of African Economies 10 (suppl. 2): 81-108.
49
Easterly, W. and S. Rebelo (1993) 'Fiscal Policy and Economic Growth', Journal of Monetary Economics 32(3):417-458.
Elbadawi, I., B.J. Ndulu and N. Ndung’u (1997) 'Debt Overhang and Economic Growth in Sub-Saharan Africa', External finance for low-income countries: 49-76
Evarist, T., M. John, L. Sebastian and B. Patrick (2010) 'Sectoral and Welfare Effects of the Global Economic Crisis on Uganda: A Recursive Dynamic CGE Analysis'. Research Series No. 73, (EPRC), Kampala, Uganda.
Fielding, D. (1997) 'Adjustment, Trade Policy and Investment Slumps: Evidence from Africa', Journal of Development Economics 52(1): 121-137.
Fiestas, I and S. Sinha (2011) 'Constraints to Private Investment in the Poorest Developing Countries' a Review of Literature’. Department for International Development, London UK.
Fry, M.J. (1989) 'Foreign Debt Instability: An Analysis of National Saving and Domestic Investment Responses to Foreign Debt Accumulation in 28 Developing Countries', Journal of International Money and Finance 8(3): 315-344.
Getachew, M. (1997) 'Determinants of Private Industrial Investment in Ethiopia'. An MSc Thesis Presented to the School of Graduate Studies of Addis Ababa University, Ethiopia.
Ghura, D. (1995) 'Macro Policies, External Forces, and Economic Growth in Sub-Saharan Africa', Economic Development and Cultural Change: 43(4):759-778.
Ghura, D. and B. Goodwin (2000) 'Determinants of Private Investment: A Cross-Regional Empirical Investigation', Applied Economics 32(14):1819-1829. IMF: Washington, D.C.
Greene, J. and D. Villanueva (1991) 'Private Investment in Developing Countries: An Empirical Analysis', Staff Papers-International Monetary Fund: 38(1): 33-58.
Goodwin, R.M. (1951) 'The Nonlinear Accelerator and the Persistence of Business Cycles', Econometrica: Journal of the Econometric Society: 19(1): 1-17.
Gujarati, D.N. (2003) Basic Econometrics. 4th. New York: McGraw-Hill. Hausman, J.A. (1978) 'Specification Tests in Econometrics', Econometrica: Journal of the
Econometric Society: 46(6): 1251-1271.
Harupara, G. (1998) 'Macroeconomic Determinants of Private Investment in Namibia' M.Sc.Thesis: Department of Economics, Addis Ababa University.
Harvey, C. (1985) Macroeconomics in Africa. Macmillan Education, London.
IMF (2009) 'The Implications of the Global Financial Crisis for Low-Income Countries'. IMF: Washington D.C
IMF (1999) 'Republic of Mozambique Enhanced structural Adjustment Facility Policy Frame', Work Paper for April 1999- March 2002. IMF: Washington, D.C.
50
Jorgenson, D. (1967) 'The Theory of Investment Behavior', Determinants of Investment Behavior, 129-188. NBER.
Jorgenson, D.W. (1963) 'Capital Theory and Investment Behavior', The American Economic Review: 53 (2): 247-259.
Keynes, J.M. (1936) The General Theory of Employment, Money and Interest. London, Macmillan.
Khan, M.S. and M.S. Kumar (1997) 'Public and Private Investment and the Growth Process in Developing Countries', Oxford Bulletin of Economics and Statistics 59(1): 69-88. IMF: Washington, D.C
Khan, M.S. and C.M. Reinhart (1990) 'Private Investment and Economic Growth in Developing Countries', World Development 18 (1): 19-27.
Kikeri, S. and A. Kolo (2005) Privatization: Trends and Recent Developments. Vol. 3765. World Bank Publications.
Krugman, P. (1988) 'Financing vs. Forgiving a Debt Overhang', Journal of Development Economics 29(3): 253-268.
Krueger, A. O., & D. Orsmond (1990) 'Impact of government on growth and trade' (No. w3545). NBER, Massachusetts, Cambridge
Kumar, M. and K. Mlambo (1995) 'Determinants of Private Investment in Sub-Saharan Africa: An Empirical Analysis', A paper Presented at the 11th World Congress of the International Economic Association: 22-24.
Lensink, R. and P.A. Van Bergeijk (1991) 'Official Finance Requirements in the 1990s', World Development 19(5): 497-510.
Lizondo, S., and P. Montiel ((1989) 'Contractionary devaluation: An overview,' IMF Staff Papers, 36, 182-227.
Lucas, R. (1998) 'On the Mechanics of Economic Development', ECONOMETRIC SOCIETYMONOGRAPHS 29: 61-70.
Lopez, H. (2004) 'Pro-Poor Growth: How Important is Macroeconomic Stability?', World Bank, Washington, D.C.
Majeed, M.T. and S. Khan (2008) 'The Determinants of Private Investment and the Relationship between Public and Private Investment in Pakistan', Journal of Business and Economics 1(1): 41-48.
Mankiw, N.G., D. Romer and D.N. Weil (1992) 'A contribution to the empirics of economic growth'. Quarterly journal of economics, 109: 407-37.
Mayanja, J. B 'Determinants of Domestic Private Investment in Sub-Saharan African (SSA) Countries: The Role of Foreign Direct Investment'. Department of Economics, Johannes Kepler University Linz Austria.
McKinnon, R.I. (1973) 'Money and Capital in Economic Development', The Brookings Institution, Washington, DC.
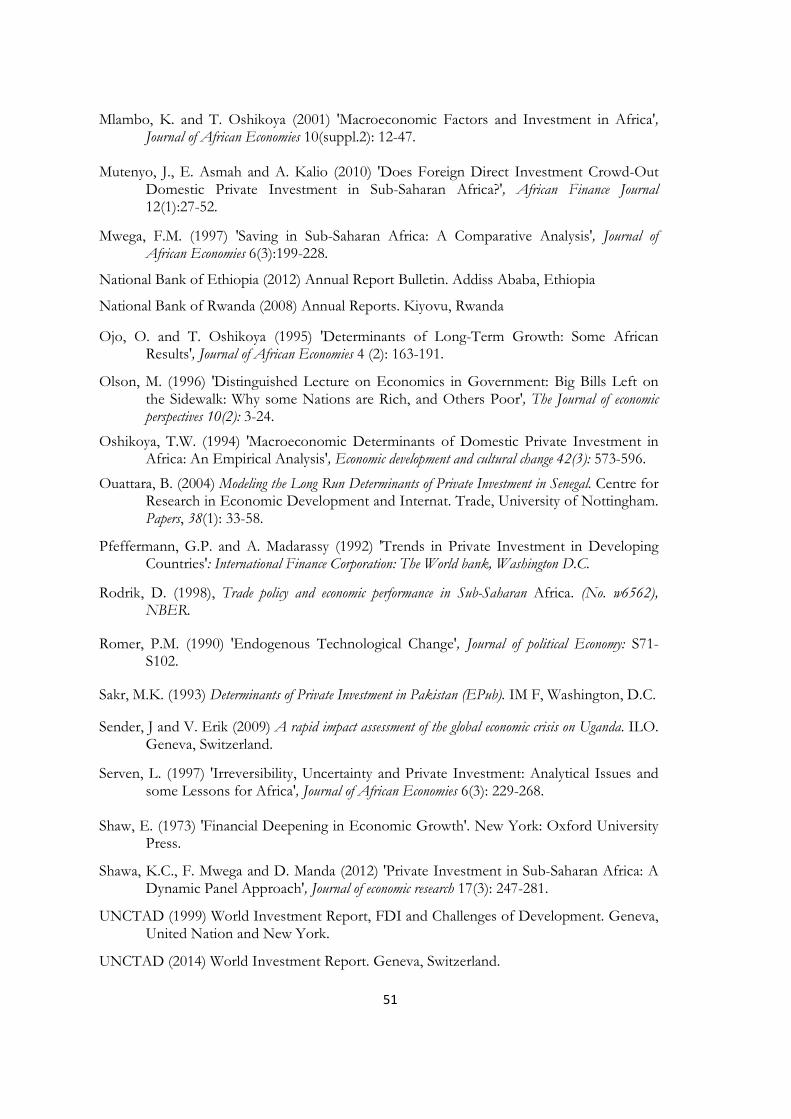
51
Mlambo, K. and T. Oshikoya (2001) 'Macroeconomic Factors and Investment in Africa', Journal of African Economies 10(suppl.2): 12-47.
Mutenyo, J., E. Asmah and A. Kalio (2010) 'Does Foreign Direct Investment Crowd-Out
Domestic Private Investment in Sub-Saharan Africa?', African Finance Journal 12(1):27-52.
Mwega, F.M. (1997) 'Saving in Sub-Saharan Africa: A Comparative Analysis', Journal of African Economies 6(3):199-228.
National Bank of Ethiopia (2012) Annual Report Bulletin. Addiss Ababa, Ethiopia
National Bank of Rwanda (2008) Annual Reports. Kiyovu, Rwanda
Ojo, O. and T. Oshikoya (1995) 'Determinants of Long-Term Growth: Some African Results', Journal of African Economies 4 (2): 163-191.
Olson, M. (1996) 'Distinguished Lecture on Economics in Government: Big Bills Left on the Sidewalk: Why some Nations are Rich, and Others Poor', The Journal of economic perspectives 10(2): 3-24.
Oshikoya, T.W. (1994) 'Macroeconomic Determinants of Domestic Private Investment in Africa: An Empirical Analysis', Economic development and cultural change 42(3): 573-596.
Ouattara, B. (2004) Modeling the Long Run Determinants of Private Investment in Senegal. Centre for Research in Economic Development and Internat. Trade, University of Nottingham. Papers, 38(1): 33-58.
Pfeffermann, G.P. and A. Madarassy (1992) 'Trends in Private Investment in Developing Countries': International Finance Corporation: The World bank, Washington D.C.
Rodrik, D. (1998), Trade policy and economic performance in Sub-Saharan Africa. (No. w6562), NBER.
Romer, P.M. (1990) 'Endogenous Technological Change', Journal of political Economy: S71-S102.
Sakr, M.K. (1993) Determinants of Private Investment in Pakistan (EPub). IM F, Washington, D.C.
Sender, J and V. Erik (2009) A rapid impact assessment of the global economic crisis on Uganda. ILO. Geneva, Switzerland.
Serven, L. (1997) 'Irreversibility, Uncertainty and Private Investment: Analytical Issues and some Lessons for Africa', Journal of African Economies 6(3): 229-268.
Shaw, E. (1973) 'Financial Deepening in Economic Growth'. New York: Oxford University
Press.
Shawa, K.C., F. Mwega and D. Manda (2012) 'Private Investment in Sub-Saharan Africa: A Dynamic Panel Approach', Journal of economic research 17(3): 247-281.
UNCTAD (1999) World Investment Report, FDI and Challenges of Development. Geneva, United Nation and New York.
UNCTAD (2014) World Investment Report. Geneva, Switzerland.

52
Workie, M (1997) 'Determinants and Constraints of Private Investment in Ethiopia' M.Sc Thesis: Department of Economics, Addis Ababa University.
Wooldridge, J. (2012) Introductory Econometrics: A Modern Approach, 5th Edition. South-Western,
Cengage Learning.
World Bank (2014) World Development Indicators. Washington, D.C. World Bank. Accessed date: 07/07/2014 Available at <www.worldbank.org>.

53
Appendices
A1 Hausman Specification test
In the application of Hausman test enables to verify either FE or RE best and it can be verified as follows.
Ho: RE model is appropriate Ha: FE model is appropriate Note: The probability value indicates that its value is less than 5%, it leads to use, the FE model to investigate the estimated value of the parameters.
A2 Diagnostic checking of Serial Correlation
Testing for cross-sectional dependence/contemporaneous correlation: using Breusch-Pagan LM test of independence Ho: in the B-P/LM test of independence is that residuals across entities are not correlated.
Pr ob>chi 2 = 0. 0000
= 85.76
chi2(12) = (b-B)'[(V_b-V_B)^(-1)]( b-B)
Test: Ho: difference in coefficients not syst ematic
B = inconsistent under Ha, efficient un der Ho; obtained from xtreg
b = consistent under Ho and Ha; obtained from xtreg
Broadmoney~P .0194705 .1877712 -.1683007 .0 681136
TotalDebts~e -.2800392 -.1476275 -.1324116 .15068
Externalde~I .0815576 .0448043 .0367533 . 020968
Domesticcr~o .0469575 -.0470496 .0940071 .0 648645
Realintere~e -.0198324 -.138482 .1186496 .0 544087
Schoolenro~r .0029217 -.0445385 .0474602 .0 375386
Freedomindex -1.457958 1.677213 -3.135171 1. 057042
TOT_1 .0574614 .0460309 .0114305 . 019062
REER_1 -.0252838 -.0152123 -.0100714 .0 222282
GDP_1 .4713733 .0810198 .3903535 .1 074531
DINF -.0846263 -.0265954 -.0580309 .0 321676
CForeigndi~t .029424 1.175498 -1.146074 . 325328
fixed random Difference S.E.
(b) (B) (b-B) sqrt(di ag(V_b-V_B))
Coefficients
. hausman fixed random
-

54
Note: its probability value confirms that there is no cross sectional dependence across the observation. Since the null hypothesis states that residuals across entity are uncorrelated, thus the test result supports the null hypotheses since the probability value is higher. If the null hypothesis is rejected the committed error is 47 %( type I error, rejecting a true null hypothesis). A3checking serial correlation in the residual for FE model.
Checking whether there is serial correlation in the residuals across entities by applying the Pasaran CD (Cross sectional dependence).
Pesaran's test of cross sectional independence = 1.382, Pr = 0.5684 Average absolute value of the off-diagonal elements = 0.240
As probability value indicates, there is no cross sectional dependence
A 4 Modified Wald test for group wise testing heteroskedesticity:
Testing for heteroskedasticity
HO: there is homoscedasticity (the existence of constant variance). Against there is heteroskedasticity.
Modified Wald test for group wiseheteroskedasticity in FE regression model
Based on 12 complete observations over panel units
Breusch-Pagan LM test of independence: chi2(15) = 14.733, Pr = 0.4709
__e6 0.0879 -0.0860 -0.4765 0.3101 0.2129 1.0000
__e5 -0.1095 -0.3661 -0.0652 0.3486 1.0000
__e4 -0.1716 0.5817 -0.2096 1.0000
__e3 0.3589 0.1701 1.0000
__e2 0.0520 1.0000
__e1 1.0000
__e1 __e2 __e3 __e4 __e5 __e6
Correlation matrix of residuals:
Using Pasaran CD test for Testing for Cross-sectional dependence/contemporaneous correlation:
Ho: states that residuals are uncorrelated (no serial correlation): Ha: there is serial correlation. Thus, using the command: xtcsd, pesaran abs
H0: sigma (i) ^2 = sigma^2 for all i
chi2 (6) = 97.31 Prob> chi2 = 0.0000 Evidence to reject Ho and there is heteroskedesticity, since the probability of
making mistake is 0 when reject Ho. Then Using ‘robust’ standard errors (White
estimators) to get heteroskedastic standard errors, can be estimated the parameters.
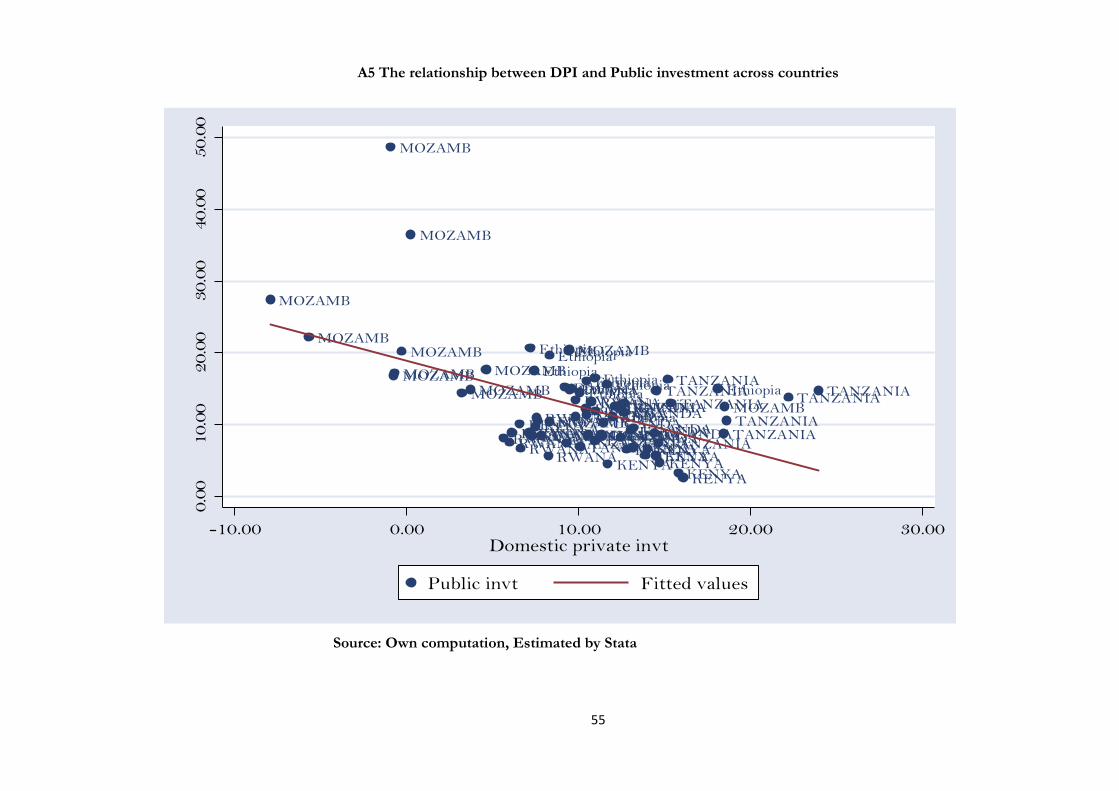
55
A5 The relationship between DPI and Public investment across countries
Source: Own computation, Estimated by Stata
KENYAEthiopia
UGANDARWANA
MOZAMB
TANZANIARWANA
KENYA
Ethiopia
MOZAMB
TANZANIAUGANDA
TANZANIA
KENYA
Ethiopia
RWANAUGANDA
MOZAMB
MOZAMB
KENYA TANZANIA
RWANA
Ethiopia
UGANDA
KENYA
RWANATANZANIA
MOZAMB
UGANDA
Ethiopia
RWANA UGANDA
TANZANIA
Ethiopia
MOZAMB
KENYA
UGANDA
KENYA
Ethiopia
RWANA TANZANIA
MOZAMB Ethiopia
RWANA TANZANIAUGANDA
KENYA
MOZAMBTANZANIA
UGANDA
MOZAMB
RWANAEthiopia
KENYA
UGANDA
RWANA TANZANIA
KENYA
Ethiopia
MOZAMB
MOZAMB
UGANDA
RWANA
KENYA
TANZANIAEthiopia
UGANDA
MOZAMB
RWANA
KENYA
Ethiopia
TANZANIAEthiopia
MOZAMB
KENYA
RWANA TANZANIA
UGANDA
0.0
010.0
020.0
030.0
040.0
050.0
0
-10.00 0.00 10.00 20.00 30.00Domestic private invt
Public invt Fitted values
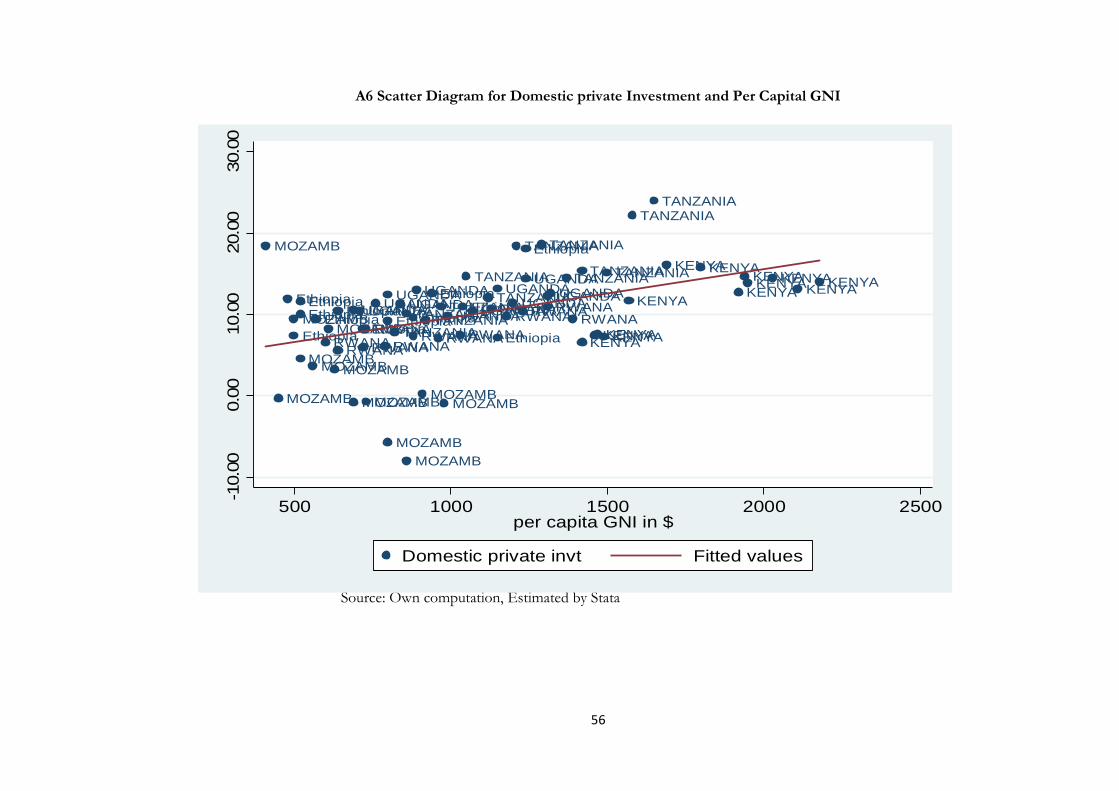
56
A6 Scatter Diagram for Domestic private Investment and Per Capital GNI
Source: Own computation, Estimated by Stata
EthiopiaEthiopiaEthiopia
EthiopiaEthiopia
EthiopiaEthiopia
EthiopiaEthiopia
EthiopiaEthiopia
Ethiopia
Ethiopia
KENYAKENYAKENYAKENYA
KENYA
KENYAKENYA
KENYAKENYAKENYAKENYA
KENYAKENYA
TANZANIATANZANIATANZANIA
TANZANIA
TANZANIA
TANZANIA
TANZANIATANZANIA
TANZANIATANZANIATANZANIA
TANZANIATANZANIA
UGANDAUGANDAUGANDAUGANDA
UGANDAUGANDA
UGANDAUGANDA
UGANDAUGANDA
UGANDAUGANDAUGANDA
MOZAMB
MOZAMB
MOZAMB
MOZAMBMOZAMB
MOZAMB
MOZAMB
MOZAMBMOZAMB
MOZAMBMOZAMB
MOZAMBMOZAMB
RWANARWANARWANA
RWANARWANA
RWANARWANARWANA
RWANARWANARWANARWANA
RWANA
-10.
000.
0010
.00
20.0
030
.00
500 1000 1500 2000 2500per capita GNI in $
Domestic private invt Fitted values
57
A7 Fixed effects: Heterogeneity across countries
Source: Own computation, Estimated by Stata
-10.
000.
0010
.00
20.0
030
.00
Ethiopia Kenya Tanzania Uganda Mozamique RwandaID
Domestic private invt DPI_mean
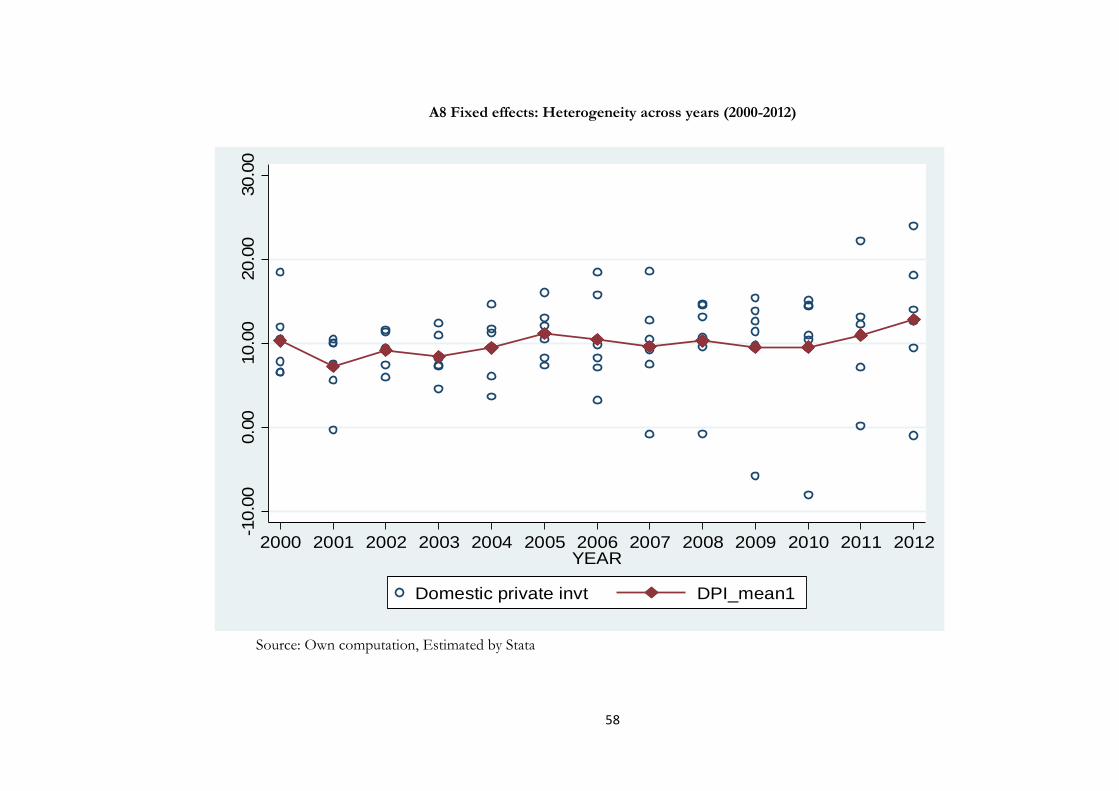
58
A8 Fixed effects: Heterogeneity across years (2000-2012)
Source: Own computation, Estimated by Stata
-10.
000.
0010
.00
20.0
030
.00
2000 2001 2002 2003 2004 2005 2006 2007 2008 2009 2010 2011 2012YEAR
Domestic private invt DPI_mean1