an investigation into taste perceptiongerardkeegan.co.uk/tsp/arm_project_1_gail.pdffor example, an...
TRANSCRIPT

AN INVESTIGATION INTO TASTE PERCEPTION
GAIL MCHUGH
HND SOCIAL SCIENCE

CONTENTS
Abstract page 1 Introduction page 2 Method Design page 5 Participants page 6 Apparatus page 6 Procedure page 6 Results page 8 Discussion page 10 Conclusion page 14 References page 15 Bibliography page 16 Appendices Appendix i Counterbalancing chart page 17 Appendix ii Data response sheet page 18 Appendix iii Letter to Gianna page 19 Appendix iv Binomial test data page 20 Appendix v Related t-test page 21 Appendix vi Bar graph page 23

ABSTRACT
This study investigated taste perception of Irn-Bru, Scotland’s Other
National Drink. The aim of this investigation was to assess the influence of
visual cues on taste perception. An experiment using a repeated measures
design was carried out. The independent variable (I.V.) was egg yellow food
colouring in lemonade in Condition B and the dependent variable (D.V.) was
the observation and measurement of participant response to the Condition B
manipulation of lemonade with egg yellow. 20 participants were selected by
opportunity sampling to participate in the study who were required to taste
4 separate drinks and state what they thought the taste was. Results were
analysed using descriptive statistics and inferential statistics. Analysis of
recorded results using a related t-test gave a t value of 10.376. Critical t
for a one-tailed test with 19 degrees of freedom at the 0.05 level of
significance gave a tabled value of 1.729. This allowed rejection of the null
hypothesis and acceptance of the experimental hypothesis H1: “That when
visual cues are frustrated, taste perception will be adversely affected.”
INTRODUCTION
The purpose of this investigation was to assess the influence of visual
cues on taste perception.
Perception is the process by which we take in raw sensations from our
environment using our senses and interpret these sensations using our past
knowledge and understanding of the world in order that the sensation, or
what we are sensing, becomes meaningful to us.
Taste is one of the five senses, affected by the contact of soluble
substances on the tongue. Although humans can distinguish between a wide
range of flavours, the sensation of taste is actually a response to a
combination of several stimuli, including texture, temperature, and smell, as
well as taste.
In isolation, the sense of taste can only identify four basic flavours:
sweet, salt, sour and bitter, with individual taste buds particularly
responsive to one of these.
The 10,000 or so taste buds found in humans are distributed unevenly
over the top of the tongue, creating patches sensitive to specific classes of
chemicals which give the taste sensations.
Chemicals from food are dissolved in the moisture of the mouth and
enter the taste buds through pores in the surface of the tongue where they
come into contact with sensory cells.
When a receptor is stimulated by one of the dissolved substances, it
sends nerve impulses to the brain. The frequency of the repetition of the

impulse tells the brain how strong a flavour is and the type of flavour is
registered by the nerve cells that responded.
Taste perception is a result of our sense of vision, taste and smell all
working together. Previous past experience is also an issue.
It is likely that people learn and become familiar with specific
combinations of colours and tastes. These learned associations might alter
our perceptions and create expectations about how a food or drink should
smell and taste.
In this experiment, lemonade was mixed with egg yellow food colouring
until it resembled Irn-Bru.
In Scotland, Irn-Bru is a popular fizzy drink, which is advertised as
‘Your Other National Drink’, and has also been described as ‘Made in
Scotland from Girders’.
Since perception is partly dependent on meaningful past experience,
this experiment on taste perception, carried out in Scotland, could be
influenced by culture.
Culture refers to the way of life of a society; it covers all the
folkways of a society, such as language, customs, dress, as well as the
symbols and artefacts, which people develop.
Dubose, C.N. (1980) experimented on the effects of colourants on
identification of fruit-flavoured beverages. Cherry, lemon-lime and orange
drinks were coloured red, orange or green. It was found to be easier for the
participants to identify the correct flavour when the drink had the expected
colour. For example, an orange-coloured drink that was really cherry-
flavoured was often thought to taste like an orange drink; a green coloured
cherry drink would be reported as tasting like lime. Only 50% of participants

correctly identified lemon-lime, 30% correctly identified cherry, and only
20% correctly identified orange.
Oram, N. (1995) investigated the influence of colour on drink
identification by children and adults. The participants were divided into 5
age groups, and were given drinks coloured brown, orange, yellow or red.
After tasting each drink, the participants had to choose whether the drink
was chocolate, orange, pineapple or strawberry.
Results found that younger participants made more colour-associated
errors. They relied on the colour of the drink more than the older
participants to make a decision about its taste.
Stillman, J.A. (1993) experimented on how colour influences flavour
identification in fruit-flavoured beverages. Uncoloured, red, yellow-orange
and green colours were used to test the ability of participants, who were at
least 15, to identify raspberry-flavoured and orange-flavoured drinks.
These results showed that the ability to identify raspberry and
orange flavours correctly was reduced in uncoloured and ‘odd-coloured’ drink
samples.
The aim of this investigation was to assess the influence of visual cues
on taste perception.
The experimental hypothesis was H1: “That when visual cues are
frustrated, taste perception will be adversely affected.” This is a one-tailed
hypothesis because it is predicting the direction of the results.
The null hypothesis was H0: “That the frustration of visual cues will
have no adverse effect on taste perception at the 0.05 level of significance.”

METHOD
Design
A repeated measures laboratory experimental design was used,
meaning one group of participants undergoing both conditions of the I.V. In
this experiment, there were 2 conditions. Condition A was the tasting of
plain lemonade and orangeade and Condition B was the tasting of lemonade
mixed with egg yellow food colouring and orangeade.
This design was used to have good control of extraneous variables.
These could be in the environment and might affect the results of the
experiment.
Other advantages of using a repeated measures design also means the
statistics are more sensitive, and fewer participants are needed.
The main disadvantage of this design is order effect in the
participants. This is when practice, fatigue or boredom can influence their
performance. To control for order effect counter balancing was applied,
using the ABBA technique. This was when the sequence of the drinks was
changed. Participants 1, 3, 5, 7 etc. were given lemonade, orangeade,
orangeade, and then lemonade mixed with egg yellow food colouring, while
participants 2, 4, 6, 8, etc. were given orangeade, lemonade, lemonade mixed
with egg yellow food colouring, orangeade.
The Independent Variable (I.V.) was the egg yellow food colouring in
the lemonade in Condition B and the Dependent Variable (D.V.) was the
observation and measurement of participant response to the Condition B
manipulation of the lemonade plus the egg yellow food colouring.

Participants
The participants were 20 individuals selected by opportunity sampling,
from Kilmarnock College.
This sampling method was used for convenience and availability. There
were 12 female participants and 8 male participants who had no prior
knowledge of psychology.
Apparatus
Counterbalancing chart – see appendix i on page 17
80 Disposable cups
1l lemonade
1l orangeade
38ml egg yellow food colouring
Data response sheet – see appendix ii on page 18
Procedure
Before the actual experiment, a pilot study was carried out on a small
group to standardise the instructions and to identify any ambiguities.
Permission was asked from Gianna Devin, head of Social Science
faculty, to conduct the experiment in the college. This was done by letter –
see appendix iii on page 19

Before the participants arrived, half of the lemonade was mixed with
egg yellow food colouring until it resembled Irn-Bru.
A small amount of lemonade, lemonade mixed with egg yellow food
colouring and 2 amounts of orangeade was poured into 4 of the cups for each
participant.
Each participant was dealt with individually, and the same conditions
were used for all participants. They were asked if they would like to
participate in a psychological experiment. On their consent, they were told it
was an experiment into taste perception.
At this point, they were given the opportunity to withdraw from the
experiment.
On entering the laboratory, they were asked to taste the liquid in the
4 cups, 1 at a time, and say what they thought it was that they were
drinking. Their answers were written down as well as any further comments
they made. This is known as introspection.
After the experiment, according to the British Psychological Society
ethical guidelines they were thanked for participating, debriefed regarding
the true purpose of the experiment and told when they would be able to
read the finished report.

RESULTS
Measures of central tendency were used in the results procedure.
These are different ways to discover the average of all scores recorded.
The mean, median, and mode were all found. The definition of mean is the
average, found by adding all scores and dividing by the number of
participants taking part, the median is the middle number when all scores are
put in numerical order, and if there is an even number of these, the middle
two are taken and divided by two, and the mode is the most frequently
occurring score.
Condition A: MEAN = 1.95
MEDIAN = 2
MODE = 2
Condition B: MEAN = 1.15
MEDIAN = 1
MODE = 1
The experimental hypothesis was tested using a Binomial Sign Test
As can be seen in appendix iv on page 20 there are 4 ties, therefore N
= 16. Calculated s = 0 because there are 16 (-) and 0 (+).
When N = 16, calculated s must be equal to or less than 4 for a one-
tailed test at the 0.05 level of significance in the binomial sign test table.

In this experiment, since s = 0 the null hypothesis can be rejected and
the experimental hypothesis can be accepted.
An inferential statistic called the related t-test was used. This was
appropriate because the research hypothesis predicted a difference due to
visual cues in Condition B, there was interval data and because a repeated
measures design was used, providing related data.
The formula for the related t-test is:
For this experiment, a one-tailed test at the 0.05 level of significance
with 19 degrees of freedom, t must equal or exceed 1.729. Since in this
experiment t = 10.378, as shown in appendix v on page 21 the null
hypothesis can be rejected and the experimental hypothesis can be
accepted.

DISCUSSION
The purpose of this investigation was to assess the influence of visual
cues on taste perception.
Analysis of recorded results gave a mean value for Condition A of
1.95, a median value of 2 and a mode of 2. For Condition B the mean value
was 1.15, the median value was 1, and the mode was 1.
In the binomial sign test, s had to be equal to or less than 4 for a one-
tailed test at the 0.05 level of significance when N = 16, and since s = 0, this
meant the null hypothesis H0: “That the frustration of visual cues will have
no adverse effect on taste perception at the 0.05 level of significance”
could be rejected and by counterintuition, the experimental hypothesis H1 :
“That when visual cues are frustrated, taste perception will be adversely
affected” could be accepted.
In the light of the hypotheses, the results of the related t-test, to
find out if the results were significant, showed t must equal or exceed
1.729, and in this experiment t = 10.378, which meant that the null
hypothesis H0: “That the frustration of visual cues will have no adverse
effect on taste perception at the 0.05 level of significance” could be
rejected, therefore the experimental hypothesis H1 : “That when visual cues
are frustrated, taste perception will be adversely affected” could be
accepted.
Descriptive statistics in appendix vi on page 23 show 19 out of 20
participants guessed correctly in Condition A, but only 3 out of 20 guessed
correctly in Condition B.

In the light of comparable studies, these results support results from
Dubose, C.N. (1980), Oram, N. (1995), and Stillman, J.A. (1993) who
discovered that visual cues do adversely affect taste perception.
Dubose, C.N. (1980) used cherry, lemon-lime and orange drinks which
were coloured red, orange or green. The results found that it was easier for
the participants to identify the correct flavour when the drink had the
expected colour. 50% of participants correctly identified lemon-lime, 30%
correctly identified cherry, and only 20% correctly identified orange, which
showed that visual cues were influencing taste perception.
Oram, N. (1995) also investigated the influence of colour on drink
identification. Participants were given drinks coloured brown, orange, yellow
or red. After tasting each drink, the participants had to choose whether the
drink was chocolate, orange, pineapple or strawberry.
Results found that younger participants relied on the colour of the
drink to make a decision about its taste more than the older participants.
Stillman, J.A. (1993) experimented on how colour influences flavour
identification in fruit-flavoured beverages. Uncoloured, red, yellow-orange
and green colours were used to test the ability of participants to identify
raspberry-flavoured and orange-flavoured drinks.
Results showed that the ability to identify raspberry and orange
flavours correctly was reduced in uncoloured and ‘odd-coloured’ drink
samples, again illustrating how visual cues adversely affected taste
perception.
Scientists have discovered that knowing the brand of a soft drink can
influence an individual’s perception of what it tastes like. When undertaking
a taste challenge, brain scans showed that when the volunteers knew which

brand they were tasting, the parts of the brain involved with recalling
memories were activated.
When the volunteers were unaware which beverage they were
drinking, they expressed no preference for one over another. However, when
they were given visual clues to the brand they were drinking, they expressed
a definite preference.
Brain scan results showed that knowledge of the brand influenced
preference and activated brain areas including the dorsolateral prefrontal
cortex and the hippocampus. These areas are involved in recalling cultural
influences and modifying behaviour based on emotion and mood.
Lead researcher, Dr. Read Montague said, “We live in a sea of cultural
images. Those messages have insinuated themselves in our nervous system.”
Dr John O’Doherty, a research scientist at University College
London’s Functional Imaging Lab, said it was widely known that perception of
the taste or smell of a food item can be influenced by other information
such as the images, texture or sounds associated with that food. People’s
decisions or preferences can be influenced by providing different contextual
information. One such way is by associating a brand with other pleasant,
rewarding things.
There were areas in this investigation which could have been
improved.
For this research to be more representative, more participants could
have been used. If a larger, more representative sample had been used,
results could have been generalised further, rather than only to Kilmarnock
College.

A better design might have been matched pairs, where the
participants only undergo one condition of the I.V., thus order effect can be
avoided.
Also another sampling method could have been used, such as a random
design, where everybody has an equal chance of being selected.
For future research, gender differences could be studied to discover
if this affects results, or age differences to find out if a person’s cultural
preferences change with age.

CONCLUSION
This experiment was a study into taste perception. Its aim was to
determine whether visual cues influenced taste perception.
Analysis of recorded results using a related t-test gave a t value of
10.376. Critical t for a one-tailed test with 19 degrees of freedom at the
0.05 level of significance gave a tabled value of 1.729.
These results conclude that visual cues do adversely affect taste
perception.
Thus as a consequence, the null hypothesis was rejected and the
experimental hypothesis H1: “That when visual cues are frustrated, taste
perception will be adversely affected” was accepted.
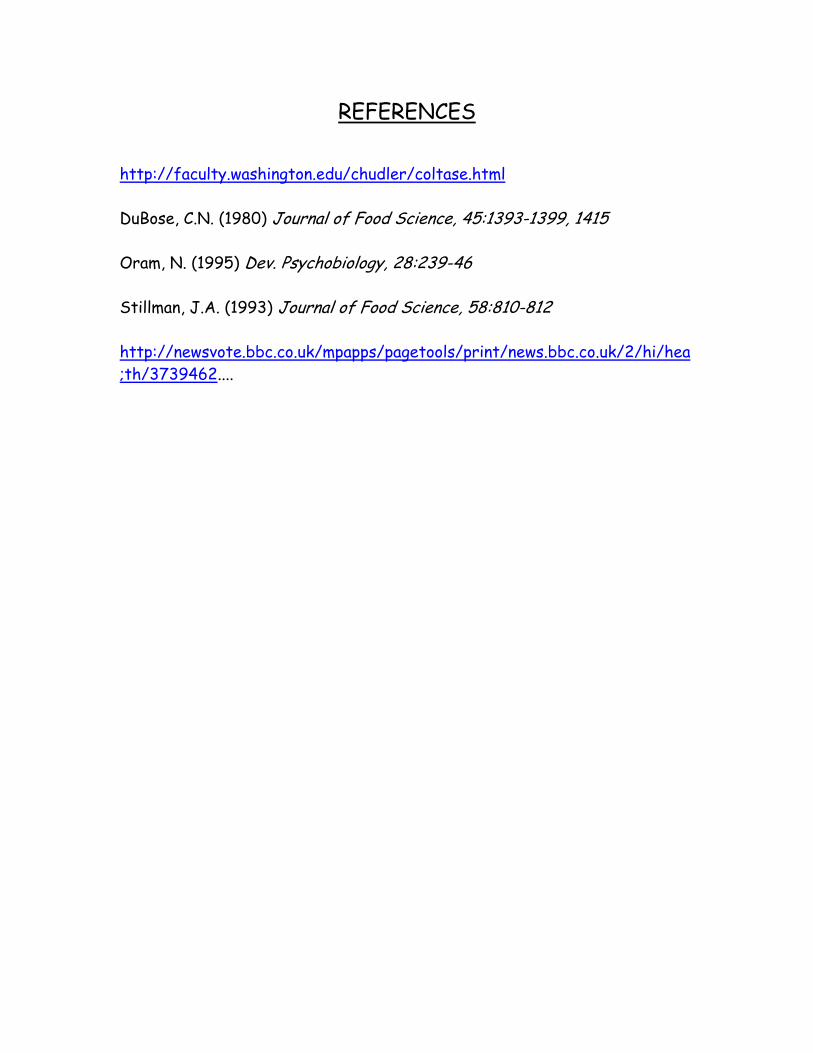
REFERENCES http://faculty.washington.edu/chudler/coltase.html DuBose, C.N. (1980) Journal of Food Science, 45:1393-1399, 1415 Oram, N. (1995) Dev. Psychobiology, 28:239-46 Stillman, J.A. (1993) Journal of Food Science, 58:810-812 http://newsvote.bbc.co.uk/mpapps/pagetools/print/news.bbc.co.uk/2/hi/hea;th/3739462....

BIBLIOGRAPHY
Coolican, H. (2004) Research Methods and Statistics in Psychology (4th edition). London: Hodder & Stoughton. Keegan, G. (2002) Higher Psychology Approaches and Methods. London: Hodder & Stoughton. http://athena.english.vt.edu/~carlisle/Postcolonial/Concepts_and_Issues/Identity.html http://www.napier.ac.uk/depts/pas/CulturalStudies/IrnBruFactor.htm http://business.scotsman.com/print.cfm?id=91652005&referringtemplate=http%3A%2... http://www.bbc.co.uk/dna/h2g2/A219863 http://www.sewanee.edu/chem/Chem&Art/Detail_Pages/ColorProjects_2003/Haney/in.... http://www.foodproductdesign.com/archive/1996/1096QA.html
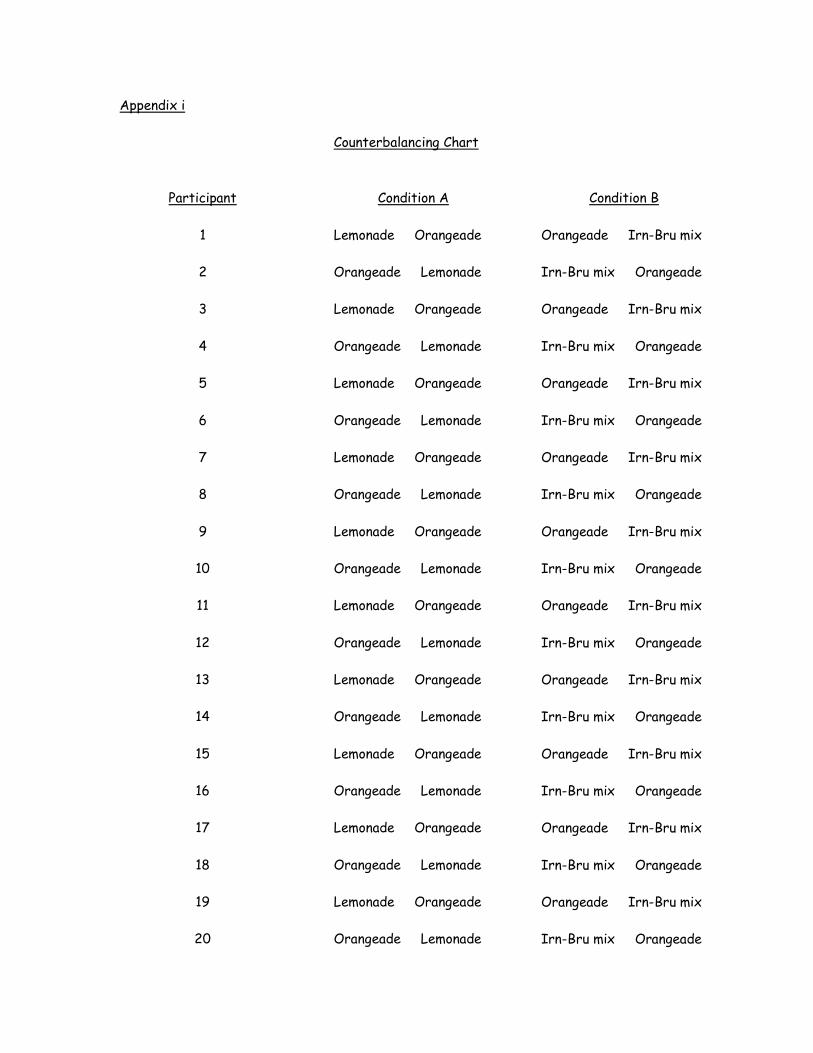
Appendix i
Participant
1
2
3
4
5
6
7
8
9
10
11
12
13
14
15
16
17
18
19
20
Counterbalancing Chart
Condition A Lemonade Orangeade Orangeade Lemonade Lemonade Orangeade Orangeade Lemonade Lemonade Orangeade Orangeade Lemonade Lemonade Orangeade Orangeade Lemonade Lemonade Orangeade Orangeade Lemonade Lemonade Orangeade Orangeade Lemonade Lemonade Orangeade Orangeade Lemonade Lemonade Orangeade Orangeade Lemonade Lemonade Orangeade Orangeade Lemonade Lemonade Orangeade Orangeade Lemonade
Condition B Orangeade Irn-Bru mix Irn-Bru mix Orangeade Orangeade Irn-Bru mix Irn-Bru mix Orangeade Orangeade Irn-Bru mix Irn-Bru mix Orangeade Orangeade Irn-Bru mix Irn-Bru mix Orangeade Orangeade Irn-Bru mix Irn-Bru mix Orangeade Orangeade Irn-Bru mix Irn-Bru mix Orangeade Orangeade Irn-Bru mix Irn-Bru mix Orangeade Orangeade Irn-Bru mix Irn-Bru mix Orangeade Orangeade Irn-Bru mix Irn-Bru mix Orangeade Orangeade Irn-Bru mix Irn-Bru mix Orangeade

Appendix ii
Participant
1
2
3
4
5
6
7
8
9
10
11
12
13
14
15
16
17
18
19
20
Data Response Sheet
Condition A Lemonade Orangeade Orange Lemonade Lemonade Orange Orange Lemonade Lemonade cheap Orangeade Orange Lemonade Lemon Orange Tangerine Sprite Lemonade Orange Fanta Sprite/7up Sprite Orangeade Orange Lemonade Lemonade Orange Orangeade Sprite Lemonade Fanta Orange Lemonade Lemonade Orange Orange Lemonade Lemonade Pineapple Orange Lemonade
Condition B Orange Lemonade/Orangeade Orange Orange Orange Lemonade Or Not so cheap Orangeade L Cheap Irn-Bru
Lucozade
ange
ucozade
Orange Orange Irn-Bru Cheap/flat Irn-Bru Tangerine Orange Irn-Bru Flat Irn-Bru Fanta Orangeade Irn-Bru Lemonade Or Grapefruit L
ange
emonade Orange Orange Diet Fanta Irn-Bru Orange Orange Orange Irn-Bru Irn-Bru Orange Orange cheap Irn-Bru Orange Orange

Appendix iii
Letter to Gianna
114 Lainshaw Avenue Kilmarnock KA1 4TF 8TH March 2005 Head of Social Science Faculty Kilmarnock College Holehouse Road Kilmarnock KA3 7AT To Gianna Devin, We are writing to apply for permission to use a room on the yellow floor to carry out a psychology experiment as part of our HND course. As the experiment involves opportunity sampling, the room may be needed for most of the day, Thank You, Gail McHugh and Andrew Sim.

Appendix iv
Participant
1
2
3
4
5
6
7
8
9
10
11
12
13
14
15
16
17
18
19
20
Binomial test data
Condition A
2
2
2
2
2
2
2
2
2
2
2
2
2
2
2
2
2
2
1
2
Condition B
2
1
1
2
1
1
1
1
1
1
1
2
1
1
1
1
1
1
1
1
B-A Sign of d
-
-
-
-
-
-
-
-
-
-
-
-
-
-
-
-

Since there are 4 ties, N = 16. Calculated s = 0 because there are 16 (-) and 0 (+).
When N = 16, calculated s must be equal to or less than 4 for a one-tailed test at
the 0.05 level of significance in the binomial sign test table.
In this experiment, since s = 0 the null hypothesis can be rejected and the
experimental hypothesis can be accepted.

Appendix v
Condition A Results
2
2
2
2
2
2
2
2
2
2
2
2
2
2
2
2
2
2
1
2
Related t-test
Condition B Results
2
1
1
2
1
1
1
1
1
1
1
2
1
1
1
1
1
1
1
1
d (A-B)
0
1
1
0
1
1
1
1
1
1
1
0
1
1
1
1
1
1
1
1
d 2
0
1
1
0
1
1
1
1
1
1
1
0
1
1
1
1
1
1
1
1

= 20 x 17 = 340
340 – 289 = 51
N = 20
N – 1 = 19
51 19 = 2.684
17 1.638 = 10.378
t = 10.378
Degrees of freedom = N – 1 = 19
For a one-tailed test at the 0.05 level of significance with 19 degrees of freedom, t
must equal or exceed 1.729. Since in this experiment t = 10.378, the null hypothesis can be
rejected and the experimental hypothesis can be accepted.
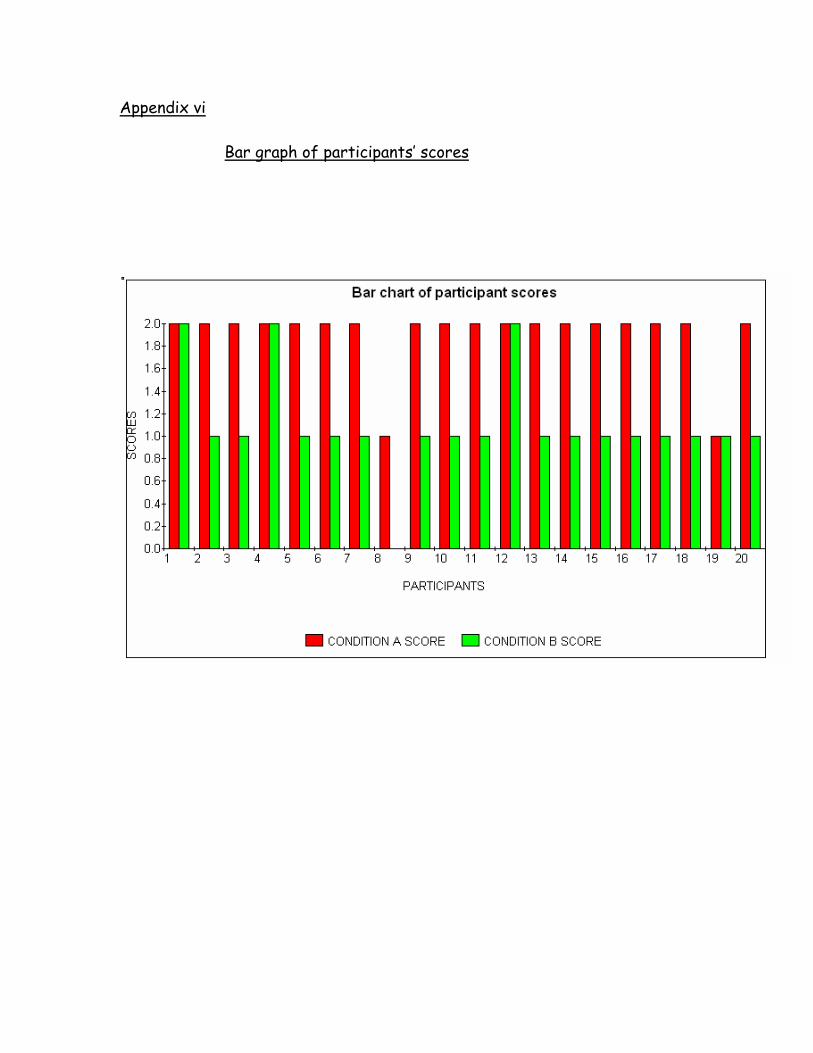
Appendix vi Bar graph of participants’ scores