an introduction to early equipment management design · pdf filean introduction to early...
TRANSCRIPT

DAK Consulting, Chiltern House, 45 Station Road, Henley on Thames, RG9 1AT, UK.
+44 (0) 1491 845504 [email protected], website: www.dakconsulting.co.uk
An Introduction to Early Equipment Management
26 November 2014 Budapest
V1.0
Design
Specification
Project Manage

Who are DAK?
We help companies to deliver year in year improvement in performance through a blend of consultancy advice, training and practical hands on support. (Contributors to 3 TPM books published by
Butterworth Heinemann)
DAK has helped many well known and award winning organisations to accelerate the pace of improvement
DAK Academy training courses and Continuous Improvement Network provide additional support to develop improvement leader at capabilities at all levels.
Slide 1
Abbott

Learning Goals
Raise awareness of Early Equipment Management (EEM) and how to incorporate this into best practice capital project delivery
Explain how to identify weak components/mechanisms, assess potential vendors and work with them to lower total asset life cycle costs;
Help participants to
– Capture knowledge and codify into a form which supports equipment design and procurement decisions
– Compare and select vendors who can deliver equipment with added value
– Apply value engineering principles to each design step to reduce life cycle costs and enhance capital project return on investment.
Slide 2

Agenda
Introduction Learning goals
Capital project deliver, what goes wrong and why?
Specification Delivery How to capture and apply the current shop floor knowledge to design a better equipment specification
Using models, sketches and simple simulation processes to explore ideas, refine options and reduce operational life cycle cost
Steps to deliver flawless operation from day 1
Design Effectiveness Identifying weak components and setting improvement targets
Developing equipment design standards
Assessing design options
Maintenance Prevention
Defect Prevention/Enhancing project value
Project Governance Avoiding common pitfalls that are the root causes of late and costly capital projects
Selecting and working with equipment vendors
Capturing lessons learnt and cross project learning
Action Planning Assessing current capital project management processes
Implementing improved project delivery processes
100 day action plan
Review of the workshop
Slide 3
Section Header

Early Equipment Management: Toyoda Case Study
Total Cost Forecast
DEFINE Design Refine Improve
Concept High Level
Design Detailed Design
Pre fab Const
Install Comm-
ission Test Stabilise Optimise
Budget
No of Changes Early Equipment Management
Traditional Approach
Budget Squeeze
Innovation
Vendor disputes/ specification errors
Incomplete design guidance
Difficult to operate/ maintain
No time to optimise plant
Unforeseen, reliability/ safety
issues
Knowledge not transferred from
project to operations
The Main Causes of Capital Project Problems are not Technical
Not involving/ releasing the right people at the right
time
Specification not complete enough to
guide option selection
Define Design Refine Improve
ConceptHigh Level
Design
Detailed Design
Pre fab Constructi
onInstall
Comm-ission Test
Stabilise Optimise
Section Header

EEM Case Study Extracts
BNFL 30% reduction in minor stops, 30% increase in MTBI
JM Delivered step our project in 25% less time, double product value, increased ROI by over 300%.
RHM £500k investment avoidance
Rolls Royce Capital avoidance of £17m by resolving 9 design weaknesses and increasing capacity of bottleneck process by 25%.
3M increased capacity of new product line by 25% and improved material yield to reduce LCC by 10%
BP delivered flawless operation from day 1 for deep sea oil platform increasing revenue from deep sea oil platform sufficient to repay capital cost in the first year of operation. Vessel was able to maintain operation in weather conditions where other vessels had to shut down production.
Slide 5

Slide 6
Benefits of Using EEM
Development of in house capability to deliver: – Flawless operation from day 1, low operational life cycle costs
and increased return on investment
EEM captures and unlocks tacit knowledge to support – Cross project learning
– Clarity of investment priorities
– Project ownership
– Innovation
EEM is an improvement process for projects to – Speed up project delivery;
– Improve collaboration across functional/company boundaries;
– Improve design, specification and project management systems and processes.

Understanding Equipment Weaknesses
Common Perception Reality Benefit
Poor design 70% 20% High
Poor maintenance 30% 20% High
Incorrect operation 20% High
Human error 20% High
Ingress of dust and dirt 20% High
Focus on Equipment Engineering and How it is Used
Section Header

Robot infeeder
Brush sanding mach
Sanding machine
Flash-off
Spraying box Drier
Buffer Cooling unit
Turning unit Ranging unit
Out feeder
Cleaning unit
Paint Line Process Steps
Slide 8

Top Level Criticality
Slide 9
Case Study Paint Line Crit above 14
S A P Q R M E C TOTSafety
Risk
Reliabil
ity
Operab
ility
Maintai
nability
Custo
merLCC
Tech
Stability
Opn
Resilience
Process
ControlTotal
Robot infeeder 2 3 3 2 3 3 1 3 20 8 9 8 9 8 7 8.5 8.5 7.5 542
Brush sanding unit 1 1 2 3 1 1 2 1 12 3 4 6 3 5 4 3.5 4.5 4.5 71
Sanding machine 1 1 2 3 3 2 2 2 16 6 6 8 7 8 7 6 7.5 7.5 338
Cleaning unit 1 1 2 2 1 1 2 1 11 3 4 5 3 4 4 3.5 4 4 56
Spraying unit 3 2 3 3 3 3 3 3 23 9 8 9 9 9 9 8.5 9 9 689
Paint supply 2 1 2 2 1 2 3 2 15 5 4 5 5 5 6 4.5 5 5.5 124
Extraction system 3 1 1 2 3 2 3 3 18 8 5 6 8 8 9 6.5 7 8.5 387
Air purification 3 2 1 2 2 2 3 3 18 7 5 5 7 7 8 6 6 7.5 270
Flash-off 2 2 2 2 3 3 3 3 20 8 7 7 9 8 9 7.5 8 8.5 510
Drier 2 3 3 2 2 3 3 3 21 7 8 7 8 7 8 7.5 7.5 7.5 422
Process heating 2 1 2 2 1 3 2 3 16 6 4 5 7 6 6 5 6 6 180
Cooling unit 1 2 1 1 3 3 1 3 15 7 6 5 9 7 7 6.5 7 7 319
Buffer 1 1 1 1 1 1 1 2 9 3 3 3 4 4 4 3 3.5 4 42
Turning unit 1 3 2 1 1 1 1 1 11 3 6 4 3 3 3 4.5 3.5 3 47
Ranging unit 1 3 2 2 3 1 1 2 15 5 8 7 6 7 6 6.5 6.5 6.5 275
Out feeder 1 3 3 2 3 2 2 2 18 6 9 8 7 7 7 7.5 7.5 7 394
Compressed air 1 3 3 2 1 2 2 2 16 4 7 6 5 5 5 5.5 5.5 5 151
Electrical supply 3 1 3 1 1 2 1 2 14 6 5 5 5 4 4 5.5 5 4 110
Average 1.72 1.89 2.11 1.94 3.00 2.06 2.00 2.28 5.78 6.00 6.06 6.33 6.22 6.28 5.30 5.58 5.92 689
OK Weak Weak Weak Weak Weak
64% 60% 59% 53% 56% 54%
59% OK
EM Target Assessment
Rating against Benchmark
Overall assessment
Current
(SRM) (APR) (PQR) (MRC) (QRC) (REC)

slide 10
Spray Filter Box Schematic
Filter Box
Spray Head path
Extraction flow under conveyor

Drilling Down: Spray Box
Slide 11
Case Study Spray Box Crit above 19
S A P Q R M E C TOTSafety
Risk
Reliabil
ity
Operab
ility
Maintai
nability
Custo
merLCC
Tech
Stability
Op
Resilience
Process
ControlTotal
Cleaning unit 1 3 3 2 3 3 3 3 3 23 9 8 8 9 9 9 8.5 8.5 9 650
Cleaning unit 2 3 3 2 3 3 3 3 3 23 9 8 8 9 9 9 8.5 8.5 9 650
Mixing and dosage 3 3 2 3 3 3 3 3 23 9 8 8 9 9 9 8.5 8.5 9 650
Control System 1 3 3 3 2 3 1 3 19 6 8 8 8 8 6 7 8 7 392
Spray guns and enclosure 1 3 2 3 2 2 2 3 18 5 7 7 7 8 7 6 7 7.5 315
Conveyor belt 1 1 2 3 3 3 1 3 17 7 6 8 9 9 7 6.5 8.5 8 442
Paint container 3 2 2 3 2 1 3 1 17 6 6 7 4 6 6 6 5.5 6 198
Roller Flash off unit 1 2 2 3 2 3 1 3 17 6 6 7 8 8 6 6 7.5 7 315
Paint supply pump 3 1 3 2 1 1 2 1 14 5 5 6 3 4 4 5 4.5 4 90
Filter x 2 Coarse 1 1 1 3 3 1 1 1 12 5 5 7 5 7 5 5 6 6 180
Filter x 2 Fine 1 1 1 3 2 1 1 1 11 4 4 6 4 6 4 4 5 5 100
Ceiling Filter x 12 1 1 1 3 1 2 1 1 11 4 3 5 4 5 3 3.5 4.5 4 63
Average 1.83 2.00 1.92 2.92 3.00 2.17 1.83 2.17 6.25 6.17 7.08 6.58 7.33 6.25 3.73 4.10 650
Weak Weak Poor Weak Poor Weak
55% 57% 38% 48% 33% 55%
50% OK
Current
EM Target Assessment
Rating against Benchmark
Overall assessment
(SRM) (APR) (PQR) (MRC) (QRC) (REC)

Slide 12
Setting Condition Standards
Rate Condition Possible Actions
1. Poor Well below standard, unsafe
difficult to operate, high scrap rate
unreliable, does not hold tolerance
Scrap or restore and improve safety
clean up, begin planned maintenance
2. Fair Barely acceptable, below standard, not easy to operate, limited capability, unpredictable scrap rates
Restore, improve safety, clean up, improve planned maintenance to stabilise accelerated deterioration
3. Acceptable Meets requirements, not too many problems, average scrap rates, needs regular intervention
Improve asset care to stabilise wear rates/component life and contain sources of contamination.
4. Good Reliable, no recurring problems, zero breakdowns achieved, optimum conditions identified, reducing level of intervention needed
Reduce contamination towards zero, reduce necessary adjustments/ intervention. Strive for optimum conditions and early problem detection
5. Excellent No touch production achieved, no scrap, zero breakdowns, increasing to better than new performance
Reduce variability of process, tooling and procedures. Improve visibility of minor defects due to normal deterioration

slide 13
SPRAY BOX
Existing design is hard to clean.

slide 14
SPRAY BOX – Extraction (1/2)
• Damage to the filter housing allows for unwanted
airleaks, bypassing the filters causing dust buildup in
the air ducts and insufficient extraction of laquer dust
• Is this normal or accelerated wear?

slide 15
SPRAY BOX – Extraction (2/2)
• Current condition of the extract filtration allows for,
bypassing the filters causing dust buildup in the air
ducts and insufficient extraction of laquer dust

Collating Operational Knowledge
Criticality assessment Designed to identify weak components and provide a measure of design effectiveness
Condition appraisal Designed to assess if basic conditions are in place, identify sources of accelerated deterioration and actions needed to achieve flawless operation from day one for assets which are not being replaced but which can impact on the
Day in the life of Designed to tease out tacit knowledge about operational conditions and constraints as a trigger for setting standards, defining areas of risk, priorities and checklist points
OEE and Life Cycle Cost Analysis
Where are the main contributors to capital cost, operational cost and OEE hidden losses.
EEM data provides an insight into the operational reality to highlight weak components and opportunities for improvement. Not all of the tools below are required for every project

Capital Project Delivery
Logical but False Sequential
Project Models Id
entify
need
Deve
lop D
esi
gn
Pro
cure
Benefici
al use
Inst
all
Iterative Project Reality
Focus on Processes and Potential to add value at
each step Get the rightDesign
Get the design right
Optimise Design Performance
Increasing granularity of decision making by step
Define ScopeDesign Installation
Improve Capability
Diverge
Converge
Implement the Right Design
Refine Operation
Focus on tools and techniques
Section Header

Common Project Management Failings
Planning tasks take too long/are incomplete – Patchy knowledge of project methodology
– Confusion over roles and responsibilities,
– Authority levels are unclear
– Poor discipline/inconsistent project management practices
Collaboration is limited – Project team dispersed in multiple locations
– Ad hoc networking but no formal process in place
– Sharing knowledge is on a one to one, ad hoc basis
– Decisions are made in isolation are poorly communicated and of poor quality
Knowledge is hard to find – Documentation management systems inadequate or duplicated,
– Access restricted even to those on the project
– Cabinets full of unused out of date documents,
Limited learning from experience – Lessons are not passed on from site team to project team
– Resources are not allocated to the task of capturing lessons learned
– Designers don’t use experience from past projects
– Mistakes are repeated
– Blame culture encourages hiding of mistakes
Slide 18

Get the rightDesign
Get the design right
Optimise Design Performance
Increasing granularity of decision making by step
Implement the Right Design
Option Visualisation
Generate/Refine Idea
Explore and gain insight
Mix of Collective Knowledge, Discipline, Creativity
Measure of Option Design Effectiveness
Evaluate
OK
Iteration
Social Nature of Capital Projects
OK
Without Informed
Iterative Learning, the Quality of the Solution
Depends on Luck
Logical but False Sequential Project
Models Don’t Reflect Reality
Define Design Refine Improve
ConceptHigh Level
Design
Detailed Design
Pre fab Constructi
onInstall
Comm-ission Test
Stabilise Optimise

Measuring Design Effectiveness 1. Intrinsically Safe/Environmental robust
Prevent Human Error
2. Intrinsic Reliability Minimum intervention Tolerant of material variation
3. High Operability Control Contamination/Scattering of Dirt
and Dust Minimise Accumulation Errors Ease of start up steady state and close
down
4. High Maintainability Stabilise and extend component life Simplified Asset Care Visual inspection Define and establish optimum conditions
5. Customer Value Meets current and likely future customer
product and service features
6. Low life cycle costs Minimise total of capital and operating
costs
DESIGN DEFINE REFINE IMPROVE
ConceptConceptHigh High
Level Level
DesignDesign
Detailed Detailed
DesignDesign
Process Process
DevelopDevelop
mentmentInstallInstall
CommComm--
issionission
TestTestStabiliseStabilise OptimiseOptimise
DESIGN DEFINE REFINE IMPROVE
ConceptConceptHigh High
Level Level
DesignDesign
Detailed Detailed
DesignDesign
Process Process
DevelopDevelop
mentmentInstallInstall
CommComm--
issionission
TestTestStabiliseStabilise OptimiseOptimise
LCC Influence
EEM Step
DESIGN DEFINE REFINE IMPROVE
ConceptConceptHigh High
Level Level
DesignDesign
Detailed Detailed
DesignDesign
Process Process
DevelopDevelop
mentmentInstallInstall
CommComm--
issionission
TestTestStabiliseStabilise OptimiseOptimise
DESIGN DEFINE REFINE IMPROVE
ConceptConceptHigh High
Level Level
DesignDesign
Detailed Detailed
DesignDesign
Process Process
DevelopDevelop
mentmentInstallInstall
CommComm--
issionission
TestTestStabiliseStabilise OptimiseOptimise
DESIGN DEFINE REFINE IMPROVE
ConceptConceptHigh High
Level Level
DesignDesign
Detailed Detailed
DesignDesign
Process Process
DevelopDevelop
mentmentInstallInstall
CommComm--
issionission
TestTestStabiliseStabilise OptimiseOptimise
DESIGN DEFINE REFINE IMPROVE
ConceptConceptHigh High
Level Level
DesignDesign
Detailed Detailed
DesignDesign
Process Process
DevelopDevelop
mentmentInstallInstall
CommComm--
issionission
TestTestStabiliseStabilise OptimiseOptimise
LCC Influence
EEM Step
LCC Influence
EEM Step
Option Visualisation
Generate/Refine Idea
Explore and gain insight
Mix of Collective Knowledge, Discipline, Creativity
Measure of Option Design Effectiveness
Evaluate
OK
Iteration

EEM Design Goals
Definition 3.Acceptable 5. Optimum
Safety and Environmental
Function is intrinsically safe, low risk, fail safe operation able to easily meet future statutory and environmental limits
Little non standard work Moving parts guarded, few projections Meets SHE and fire regulations Easy escape routes and good ergonomics
Foolproof/failsafe operation High level of resource recycling Uses sustainable resources
Reliability Function is immune to deterioration requiring little no intervention to secure consistent quality
Low failure rate Low idling and minor stops Low complexity/quality defect potential Flexible to technology risks Good static and dynamic precision
High MTBI Stable machine cycle time Easy to measure Flexible to material variability
Operability Process is easy to start up, change over and sustain “normal conditions”. Rapid close down, cleaning and routine asset care task completion.
Simple set up and adjustment mechanisms Quick replace tools Simple process control Auto load and feeder to fed processing
One touch operation for height, position, number colour etc Flexible to volume risk Flexible to labour skill levels
Maintainability Deterioration is easily measured and corrected, Routine maintenance tasks are easy to perform and carried out by internal personnel.
Easy failure detection/repair Off the shelf/common spares used Long MTBF, Short MTTR Easy to inspect and repair
Easily overhauled Self correcting/auto adjust Inbuilt problem diagnostic Predictable component life Fit and forget components
Customer Value Process is able to meet current and likely future customer QCD features and demand variability. Provides a platform for incremental product improvement
Easy order cycle completion Maximum control of basic and performance product features Flexible to product range needs
Capacity for future demand Robust supply chain Simple logistics//forecasting needs Flexible to potential market shifts Access to high added value markets
Life Cycle Cost Process has clearly defined cost and value drivers to support Life Cycle Cost reduction, enhance project value and maximise return on capital invested
Clarity of current capital and operational cost drivers and process added value features Potential for value engineering gain Resource economy
High level of resource recycling Flexible to financial risks (e.g. vendor) Easily scalable to 400% or to 25%
DESIGN DEFINE REFINE IMPROVE
ConceptConceptHigh High
Level Level
DesignDesign
Detailed Detailed
DesignDesign
Process Process
DevelopDevelop
mentmentInstallInstall
CommComm--
issionission
TestTestStabiliseStabilise OptimiseOptimise
DESIGN DEFINE REFINE IMPROVE
ConceptConceptHigh High
Level Level
DesignDesign
Detailed Detailed
DesignDesign
Process Process
DevelopDevelop
mentmentInstallInstall
CommComm--
issionission
TestTestStabiliseStabilise OptimiseOptimise
LCC Influence
EEM Step
DESIGN DEFINE REFINE IMPROVE
ConceptConceptHigh High
Level Level
DesignDesign
Detailed Detailed
DesignDesign
Process Process
DevelopDevelop
mentmentInstallInstall
CommComm--
issionission
TestTestStabiliseStabilise OptimiseOptimise
DESIGN DEFINE REFINE IMPROVE
ConceptConceptHigh High
Level Level
DesignDesign
Detailed Detailed
DesignDesign
Process Process
DevelopDevelop
mentmentInstallInstall
CommComm--
issionission
TestTestStabiliseStabilise OptimiseOptimise
DESIGN DEFINE REFINE IMPROVE
ConceptConceptHigh High
Level Level
DesignDesign
Detailed Detailed
DesignDesign
Process Process
DevelopDevelop
mentmentInstallInstall
CommComm--
issionission
TestTestStabiliseStabilise OptimiseOptimise
DESIGN DEFINE REFINE IMPROVE
ConceptConceptHigh High
Level Level
DesignDesign
Detailed Detailed
DesignDesign
Process Process
DevelopDevelop
mentmentInstallInstall
CommComm--
issionission
TestTestStabiliseStabilise OptimiseOptimise
LCC Influence
EEM Step
LCC Influence
EEM Step

slide 22
Spray Box Cleaning
Cleaning requires around 4 hours per day maintain quality of operation with a further in depth clean per week of 4 hours
Filters in the extraction get clogged and have to be changed every week.
– In total worth around 25% of current available time.
Cleaning the build up of dried paint overspray involves the use of a hammer and chisel which causes damage to the filter box (accelerated wear)
The filter box no longer fits correctly
The gap allows paint spray directly into the extraction system so extraction system becomes less and less effective
How would you incorporate this insight into the specification for a new line using the EEM design goals?

Understanding Design Complexity
Slide 23
S A P Q R M E C TOTSafety
Risk
Reliabil
ity
Operab
ility
Maintai
nability
Custo
merLCC
Tech
Stability
Op
Resilience
Process
ControlTotal
Cleaning unit 1 3 3 2 3 1 3 3 3 21 7 6 6 7 7 7 6.5 6.5 7 296
Cleaning unit 2 3 3 2 3 1 3 3 3 21 7 6 6 7 7 7 6.5 6.5 7 296
Mixing and dosage 3 3 2 3 1 3 3 3 21 7 6 6 7 7 7 6.5 6.5 7 296
Control System 1 3 3 3 1 3 1 3 18 5 7 7 7 7 5 6 7 6 252
Spray guns and enclosure 1 3 2 3 1 2 2 3 17 4 6 6 6 7 6 5 6 6.5 195
Conveyor belt 1 1 2 3 1 3 1 3 15 5 4 6 7 7 5 4.5 6.5 6 176
Paint container 3 2 2 3 1 1 3 1 16 5 5 6 3 5 5 5 4.5 5 113
Roller Flash off unit 1 2 2 3 1 3 1 3 16 5 5 6 7 7 5 5 6.5 6 195
Paint supply pump 3 1 3 2 1 1 2 1 14 5 5 6 3 4 4 5 4.5 4 90
Filter x 2 Coarse 1 1 1 3 1 1 1 1 10 3 3 5 3 5 3 3 4 4 48
Filter x 2 Fine 1 1 1 3 1 1 1 1 10 3 3 5 3 5 3 3 4 4 48
Ceiling Filter x 12 1 1 1 3 1 2 1 1 11 4 3 5 4 5 3 3.5 4.5 4 63
Average 1.83 2.00 1.92 2.92 1.00 2.17 1.83 2.17 5.00 4.92 5.83 5.33 6.08 5.00 2.98 3.35 296
OK Good OK OK Weak OK
80% 82% 63% 73% 58% 80%
75% Good
EM Target Assessment
Rating against Benchmark
Overall assessment
The source of complexity is shown by this more detailed analysis
In addition if we deal with the condition issues, the current asset design effectiveness would be much improved
(SRM) (APR) (PQR) (MRC) (QRC) (REC)

Setting Project Roles and Accountabilities
Slide 24
Commercial
Operations
Technical
Who Should be involved?
Customer and Financial Issues Intrinsic Reliability and Safety
Operability and Maintainability Issues
Section Header

Defining the EEM Organisation
Define Design Refine Improve
1.Concept 2.High Level
Design
3.Detailed Design
4. Pre fab Constructi
on 5.Install
6.Comm-ission Test
7. Stabilise
8. Optimise
Funding Day 1
EEM Project Organisation
EEMCore Team
Project Functional SupportInvolvement fluctuates
depending on project step needs
Remain with the project from
Concept to Stable Operation
Consult, Inform,
Engage
Sta
ge G
ate
Revie
w T
eam

Set Incremental Quality Milestones
Define Design Refine Improve
1.Concept 2.High Level
Design
3.Detailed Design
4. Pre fab Constructi
on 5.Install
6.Comm-ission Test
7. Stabilise
8. Optimise
Funding Day 1
Steps 1 and 2 focus on
getting the right design
Design Specification
Steps 3 and 4 focus on getting the design right
Project Manage
Steps 5 and 6 focus on
delivering flawless
operation
Steps 7 and 8 focus on
delivering year on year
performance improvement
Deciding what to do Making it happen

Goals Evolve With Each Step
De-palletise Pasteuriser Filler Pack
Infeed
conveyorsTransfer Pasteurisation Discharge
Pump/
PipeworkBelts/Drives
Process
Function
ComponentDoors/Seals
Palletiser
Services
EEM High Level Design (Define Expectations/
Select Vendor)
EEM Concept (Evaluate Options)
EEM Detailed Design (Collaborate with
Vendor)
High Level Design
EEM Concept
Detailed Design
Start up Steady State Close Down
Pre start
up checksSet up
Material
Supply
Fit change
partsSet/align
SOP
Task
Working MethodRun/First off
checks
Remove
guarding
Equip
ment
Work
ing M
eth
od
Section Header

Capture Knowledge as Standards and Checklists
Concept De-palletise Pasteuriser Filler Pack
Infeed
conveyorsTransfer Pasteurisation Discharge
Pump/
PipeworkBelts/Drives
Process
Function
ComponentDoors/Seals
Palletiser
Services
HLD
EEM Target Operability categories
Ops5 Data Collection
Ops6 Hygiene Standards
Ops7 Enviornmental Standards
Operability
Ops8 Access for Operations
Ops9 Manning / Resource
Ops10 Materials Control
Ops11 Building Environment
Op10.3 Handling
Op10.2 Changeover
Op10.1 QA
Op10.4 Storage
Commercial
LCC
Maintainability
Reliability
Safety
High Level Design Questions How can we design this out What outline ways of working could be relevant How will needs change as a result of this project Do we know what is critical and how to control it
Have we taken into account lessons learned and best practices What outline prevention, inspection, servicing methods could
apply Do we know what we need, can we reduce the list
What outline operational/clean out activities could be relevant Do we know what is required, can we improve it Has a relevant risk assessment been carried out and actions
identified
Does the project increase risk levels, how can we simplify/improve control
What standards apply

Use Checklists To Refine Ideas/Add Value High Level Design Questions How can we design this out What outline ways of working could be relevant How will needs change as a result of this project Do we know what is critical and how to control it Have we taken into account lessons learned and best practices What outline prevention, inspection, servicing methods could
apply Do we know what we need, can we reduce the list What outline operational/clean out activities could be relevant Do we know what is required, can we improve it Has a relevant risk assessment been carried out and actions
identified Does the project increase risk levels, how can we
simplify/improve control What standards apply
Detailed Design Questions How to improve this to prevent potential problems
Does the design make it easy to do right and difficult to do wrong, are skill gaps identified
How to design in compliance to required standards
How to assure compliance with best practice
Does the design support maintenance prevention standards
Are spares identified
Does the design make it easy to do right and difficult to do wrong,
Are skill gaps identified
Slide 29
Installation Questions Will the asset be installed to make it easy to use and
maintain Are working methods defined Has a suitable training and skill development regime
been identified Have we plans to update our systems and
procedures to account for this Has spares provision been made, are there plans to
update CMMS before day one production Have production materials been sourced are there
plans to update production management systems
Commissioning Questions Do we know how we will manage this on day 1 operation
Has competence been assured
How can we achieve flawless operation
Do we know how we will manage this on day 1 operation
Have we taken all steps to Eliminate, Reduce, Isolate, and Control risks

Slide 30
Apply Lean Concepts
Flow (Auto Activation linking Islands of Activity)– Visual workflow scheduling
see early finishes/delays at a glance
– Simplified coordination/Pull Systems In built system recovery/contingency planning;
Rapid feedback and response on quality issues;
Improved use and care of equipment/technology.
Flexibility to make only what is needed– It has to be right first time
You need
– the right mix of skills to make it happen;
– Routine standardised practices that are easy to do right, difficult to dowrong;
– Work place/work flow organisation.
Focussed improvement to reduce activities which donot add value (customers would not miss):
– Transport, Inventory, Movement, Waiting, Over processing, Overproductions, Defects (TIM WOOD)

Documentation Formats to Encourage Creativity
Sketches
Layouts
Milestone plans
Scale Models
Simple simulation
Design standards
Outline ways ofworking
Define Design Refine Improve
Concept High Level
Design
Detailed Design
Pre fab Constructi
on Install
Comm-ission Test
Stabilise Optimise
Detailed Layouts
Larger Models
More detaileddrawings
Checklists
Testing/Analysis
Quality plan
Task lists
Detailed ways ofworking
Risk Assessment
QA of Manufacture
Cross shift learning
Technical manuals
Problem resolution
Confirm the project scope To encourage creativity Capture working assumptions
Select vendor Tease out weaknesses Enhance value Record Decisions
Work plans
QA installation
Best practice development
Training plans
Test reports
Problem resolution
Coordinate resources Develop new skills Achieve flawless operation
Refine new skills Stabilise performance Achieve business benefits Strive for optimum conditions

Title Conveying SystemsVersion/Date 1.0 draft 11.11.12 ByReason for preparing the standardTo define how to design conveying systems to be able to handle a range of full packconfigurations effectivelly
Scope of the application1 The standard applies to handling of multi packs of cans between the packing machines and
palletiser.2 The standard below sets out design principles to be applied at and prior to EEM step 2 Basic
Engineering3 This standard will be developed into a measure of conveyor system effectiveness to guide
the assessment of conveying system options.(Design effectiveness is a function of conveying system length and complexity)
Design and method of useDesign PrinciplesIntrinsic reliability is a function of conveying system length and complexity. See below for basisfor optimum assessment. 5 = simple, short, level conveying systems and intrinsic pack alignmentOperability is enhanced by assuring alignment and reducing change over complexity andcontamination risk. 5= no touch change over, Conveyor system should maintain alignment of packs without the need for additionalguide rails. This reduces contact and the risk of can damage/leaking cans.Below are guidelines for optimum (score of 5) conveying gaps, distance and complexity
EEM Equipment Design Standard
DMc
Conveyor Gaps and Distance
Conveyor gap/ dead plate span
Pack side edge lengthConveying gap should be no more than 40% of the smallest pack side edge length.
Avoid using long runs of conveyors these have more joins. The impact each join on alignment is cumulative. Long conveyors need more guide rails and maintenance
Optimum Conveying Systems
Packs will maintain their alignment on a conveyor system unless acted upon by other forces
The optimum conveying system requires no additional alignment between process steps.
This reduces risk of can damage/leaking cans, change over time, capital and maintenance costs.
Conveyor and Pack Alignment
Pack side edge length
Specify conveyor horizontal and vertical alignment parameters
Design dead plate transfer to minimise Pack to Pack and Pack to Guide rail contact
Avoid Complex Conveying Options
Inclines reduce traction. Gaps should be less than 25%? of the smallest pack side edge length
Directional changes Avoid where possible as this results in 2 gaps and requires additional alignment guides/pack contact
Sketches and Diagrams
Simple illustrations to describe and encourage exploration of options
Use models to understand what you don’t know
Develop outline ways of working and Day in the life of activities to explore tacit knowledge
Use working assumptions to guide decision making. Test decision sensitivity if needed
Capture lessons learned as design standards
Slide 32
Define Design Refine Improve
ConceptHigh Level
Design
Detailed Design
Pre fab Constructi
onInstall
Comm-ission Test
Stabilise Optimise
End elevation
Plan View
Pusher
Chain
Back Plate
Adjustment
Pusher
Chain
Back Plate
Pusher
Chain
Back Plate
Adjustment
Book

Slide 33
28% 15% 20% 23% 15%
Basic 2 2 3 3
Perf 3 1 2 3 1
Perf 3 1 2 3 1
Perf 3 2 1 3 1
12% 17% 22% 17% 17% 17% 11 6 8 9 6 40
Feature
Parameter/Part
Total
5 5 2 1 1 1 5 10%
2 2 3 2 1 2 1 2 2 7 14%
5 3 1 1 3 1 1 2 7 14%
2 2 3 1 2 3 1 2 3 2 11 22%
2 3 3 1 1 3 2 5 3 3 16 32%
3 3 4 2 1 1 4 8%
7 10 13 10 10 10 10 10 10 10 10 50
S
t
o
c
k
R
o
t
a
t
i
o
n
S
u
p
p
l
i
e
r
C
o
n
t
r
o
l
s
Action Feature
O
p
s
L
o
g
P
u
r
c
h
C
l
e
a
n
i
n
g
P
r
o
c
Q
A
M
a
i
n
t
T
e
m
p
e
r
a
t
u
r
e
M
i
x
i
n
g
t
i
m
e
T
o
o
l
w
e
a
r
K
i
l
n
P
a
c
k
Raw Material Quality
Dust Control
M
i
x
S
h
a
p
e
r
D
r
y
C
o
n
t
r
o
l
P
o
i
n
t
P
r
o
c
e
s
s
Total
Cosmetic Appearance
Predictable Life
Long life
Strength
Total
Cutting
Start up routine
Steady state routine
Close down routine
Documents to Record Insights Gained
1. Allocatefeatures to
processes by level of
importance, all scores add up
to 10
Identify which parameters have most impact on
quality defects
Identify parameter
control points
Allocate accountabilities for specification/delivery

Assure Project Discipline: Stage Gate Review
Goals
Confirm progress made from the last review – Red status: Issues which have a significant impact on future project success. Stage gate
cannot be passed without resolving this issue
– Amber status: Issues with a known route to resolution which are unlikely to have significant impact on the deliver of project goals or working assumptions made based on experience but in need of confirmation. These items must be completed prior to the next stage gate review;
– Green status: Issues which have been resolved satisfactorily.
Develop plan for actions to deliver next stage gate – Amber status issues
– Check list Items to be checked, examined or dealt with prior to the next stage gate
Define Design Refine Improve
1.Concept2.High Level
Design
3.Detailed Design
4. Pre fabConstructi
on5.Install
6.Comm-ission Test
7. Stabilise
8. Optimise
Funding Day 1
Design Specification Project Manage
Deciding what to do Making it happen

EEM Project Milestone Plan
Slide 35
EEM Road Map Overview Eden Valley Line 4
Goal SG Review
1 Mobilise concept
2 Select preferred concept
3 Create concept specification
4 Develop project plan
1 Mobilise HLD
2 Select concept delivery approach
3 Define HLD specification
4 Develop project plan
Eden Valley Line 4 Goal SG Review
1 Procure
2 Equipment detailed design
3 Freeze specification
4 Detailed activity planning
1 Mobilise PFP
2 Operations change management
3 Organise installation and commissioning
4 Deliver QA Plan
Eden Valley Line 4 Goal SG Review
1 Mobilise installation
2 Install
3 Pre commission
4 Installation coordination
1 Mobilise Commissioning
2 Commission
3 Flawless Operation delivery
4 Commissioning coordination
Eden Valley Line 4 Goal SG Review
1 Mobilise team
2 Stabilise "Normal" conditions
3 Technical stability
4 Coordinate handover
N D J
J J A S O N D J
2015
J J A S OM
M
D J
2015
J J A S OM
M J J A
A M
18/02/2016
24/06/2026
A M
N D J F M
N D J F
A M
0
21/11/2014
20/03/2015
20/11/2015
15/01/2016
Impr
ove
Step 7 Stabilise
Def
ine
Des
ign
Ref
ine
Step 1: Concept
Development
Step 2: High Level
Design
Step 3: Detailed
Design
Step 4: Pre Fab
Procurement
Step 5 Installation
Step 6 Commissioning
Task
Task
Task
7. To establish normal
conditions without
special support
1. To develop a
preferred concept
2. To develop a
funding application
and vendor short list
3. To select a
preferred vendor,
detailed specification
and installation plan
4. To manufacture
equipment and
prepare site for
installation
5. To Install
equipment, finalise
micro layout and
prepare glide path to
flawless operation.
6. To deliver flawless
operation on
production day 1
J A STask A MO N D J F
J A S O N D J F M
2014 2015
2014
M
MJ A S O
2014
2014
J A S O
2015
N D J
S O N F M A M J
2016
F M A M J
2016
2016
2016
F M A M J
F M A M J
Case Study Example

Milestones Resources,
Timing
Clarify project scope
Confirm concept
Vendor RFQ
EEM Define Steps: Getting the Right Design
Slide 36
Define Design Refine Improve
ConceptHigh Level
Design
Detailed Design
Pre fab Constructi
onInstall
Comm-ission Test
Stabilise Optimise
Concept Stage Gate
Define Design
Modules
Risk Assessment 1
LCC Update
Evaluate Options
Document concept
Evaluate Delivery Options
Flawless Operation
risks
LCC forecast and Targets
HLD Stage Gate
Concept
HLD
Fund Application
1. Mobilise Concept
2. Select preferred concept
3. Create Concept
Specification
1. Mobilise HLD
2. Select concept delivery
approach
3. Create HLD
Specification
4. Develop Project Plan
Design
Design
Specification
Specification
Project Manage
4. Develop Project Plan
Project Manage
Milestones Resources,
Timing
Define business
case
Understand Operational
Reality
Document HLD
Section Header

Concept Development
Slide 37
Operational Performance Data
Equipment Investment Planning
Equipment Management Master Plan
Early Equipment Management
Specification and LCC Management
Feedback on performance
Project Concept
Set Budget
EEM Master Plan
Select project Project
Management
Design Management
Focussed Improvement
Improvement Priorities

EEM Site Level Master Plan
Slide 38
How is this changing Challenges Equipment Management Goal
Increasing expectations of Quality Cost and Delivery performance.
Incremental product development, new products and services for growth Supply chain for global operations
Capacity for future demand Robust supply chain Simple logistics/forecasting needs Flexible to potential market shifts
Material costs, energy costs, labour costs, batch sizes
Sustaining volume on existing products whilst introducing new ones Energy inflation,
High level of resource recycling Flexible to financial risks (e.g. vendor) Easily scalable to 400% or to 25% Access to high added value markets
Focussed improvement Smaller batches, New product life cycles, shorter lead times
Systematic hidden loss and lead time reduction Achieve “Normal operations” with less effort,
One touch operation for height, position, number colour etc Flexible to volume risk Flexible to labour skill levels
Reduced plant availability for maintenance, more complexity, increased precision, availability of skills
Extending MTBF/MTTR Maintenance prevention Supporting process optimisation Lack of skills
Inbuilt problem diagnostic Self correcting/auto adjust Predictable component life Easily overhauled, fit and forget
Improved control, lower grade materials
Capturing lessons learned Adapting plant to new products, improving technical competence
High MTBI Stable machine cycle time Easy to measure Flexible to material variability
Increased legislation and controls. Higher environmental expectations
Safe, environmental practices with minimum impact on performance Improved sustainability
Foolproof/failsafe operation High level of resource recycling Uses sustainable resources
Operations
• Operability
• OEE losses
• Lead time/flow/flexibility
• Maintainability
• Predictable component life
• Defect prevention
Technical • Reliability
• Increase precision Automation
• New technology/materials
•
Safety • Ease of compliance • New legislation
Commercial • Customer
• Expectations
• New products and services
• LCC Management
• Main contributors (4M)
• Technology
•
H
Case Study Example

Slide 39
“Day In the Life Of” (DILO) Simulation
Month in the Life list 3: Maintenance:
- Daily Checks
- Running Checks
- Routine servicing
Week in the Life list 2 Problem solving
- Availability
- Performance
- Quality Losses
PHYSICAL REPRESNTATION
OF REALITY/SCALE
Participants with defined roles /target areas
- Intrinsic Reliability
- Intrinsic Safety
- Ease of use
- Ease of Maintenance
- Product/Service Quality
- Product/Service Profitability
Design Feedback/Concerns
Checklist Development
Life cycle cost Innovation
Day in the Life list 1 Production:
- Start up
- Steady state
- Close Down
Experience/ Tacit knowledge
The outcome may include low cost or no cost
improvement opportunities which are outside of the
Capex project scope. This is part of the EEM scope

slide 40
Stage Gate Checklists
Page 3 of 10
Target Improvement Plant SE: Safety/Environment
Project Rel: Reliability
Updated Cst: Customer QCD
LCC: Life Cycle Costs
OP: Ease of Use
OP: Ease of Use
Owner Date Equipment/ Area Weakness/Issue TargetMileston
eNotes (In Design y/n/
completed)Eng 24-Nov Packaging Define cost, quantity and size Rel 3. DD
Eng 24-Nov End of line ops Basis of preferred layout/operation SE, Rel 3. DD
Eng 24-Nov Packing station Carton on demand detailed spec Op,LCC 3. DD
Eng 24-Nov Training Operator skills required/manual
production
Rel, Se 3. DD
Eng 24-Nov Ease of use Specification/measurement Op 3. DD
Eng 24-Nov Change over Standards for freqency/speed LCC 3. DD
Ops 24-Nov Best practice Standardise machine components LCC 3. DD
Ops 24-Nov Best practice dev Cleaning and asset care design Mnt 3. DD
Ops 24-Nov Best practice dev Training schedule development LCC 3. DD
Ops 24-Nov Storage For outers Op 3. DD
Ops 24-Nov Storage For service spares e.g vacuum cups Mnt 3. DD
Ops 24-Nov Glue system Heating cost/timer setting Op 3. DD
Ops 24-Nov End of line ops Start up procedure (refined/visual aids) Op 3. DD
Ops 24-Nov Seals Failure/rework cost assessment LCC 3. DD
Ops 24-Nov Glue system cost of downtime MNt 3. DD
Ops 24-Nov End of line ops Set up procedure (refined/visual aids) Op 3. DD
Ops 24-Nov End of line ops Asset care development (Provisional) MNt 3. DD
6. Tst: Test
01-Dec-05
Sassib 1
End of line packing 2. HLD: High Level Design
3. DD: Detailed Design
4. Pre: Pre fab construction
5. Ins: Install/Test
Design ChecklistMilestone
1.Con: Concept
Case Study Example

, slide 41
Setting EEM Targets Commercial
3. Acceptable 5. Optimum
Rework levels Less than 1 pallet worth of rework cases per shift No rework
Handballing off line during tape change No handballing off the line
2 rejects from the case closer per run 2 rejects per 24 hour period
WasteLess than 1 pallet of empty or part filled cases at
the end of a run2 part filled cases at the end of a run
Half current levels of damaged cases 1/20th of current levels
Half current levels of returned cases 1/20th of current levels
Outer carton Half current levels of rejected cases 1/20th of current levels
Operations3. Acceptable 5. Optimum
Set up procedure Set up machine in less than 20 minutes Set up in 10 minutes or less
Standard set up across shifts
Training manual/process Visual management and checklist support Self start and visual management confirmation
Easy to clean at end of runEasy to keep clean when running, no routine
major clean required
Countermeasures to Common Problems
Develop best practice for response to list of
common problems e.g end of line jam upsAuto recovery following likely problems
AccessFloor level access to packing station (gate vs
stairs) without removing boxesDirect access
Reject carton (case closer) Ease of access to carton Self eject/auto reset
Spare partsLine side spares for frequent spares e.g. vacuum
tips
Early warning condition checks and single touch
replacement capability
Material Storage Storage for current and next outer carton size
Component Standards Agreed list of standard parts for service kits Agreed list of standard parts for overhaul items
Engineering 3. Acceptable 5. Optimum
Packaging Agreed spec to test against for this projectFormal standards which are easy to apply to
multiple projects
Machine selectionAgreed basis for selection of a preferred option
for this project
Formal standards which are easy to apply to
multiple projects
Carton buffering ? Minutes buffering Reject conveyor/ loop?
Sensors Guarded to avoid damage when releasing jams No sensor?
Jam reset Machine can be cleared easily following a jam Automatic reset to start of cycle following jam
Specification Agreed measures for ease of use etcFormal standards which are easy to apply to
multiple projects
Agreed specification for change over frequency
and speed for this project
Formal standards which are easy to apply to
multiple projects
Case Study Example

Targeting Performance Gains
18
57
3737
61
100
118
18
19
Potential
OEE
Total
Improve-
ment
Total
productive
time (OEE)
Rework
and Scrap
6
Operating
time
Speed
losses
24
6
Available
time
Availability
losses
39
19
Planned
time
Planned
downtime
Total time
+110%
Potential
Current • Set up and adjustment
• Routine Cleaning
• Jams
• Defect prevention
• Belt utilisation
Index
8
10
• Major Clean
• Routine servicing
65
3
34
• Rework
31 3

slide 43
Maintenance and Defect Prevention Gains Include Low Equipment Life Cycle Costs
Capital
21%
Material
32%
Energy/Water
10%
Labour
25%
Inventory
1%
Overheads
11%
Capital costs are only part of the picture….
The Goal of EEM is to Minimise Life Cycle Cost

slide 44
44
Analyse Defects
% pieces
602934
SKU A
Right First Time
Inspection
Defects 123.429
Production 726.427
17%
1. Right first time output is 83%, 17% of
the line capacity is wasted on bad
quality.
2. An estimated 50% of defective parts
are reworked at 1/3 of process speed to
feed the pieces properly. This loses
another 15-20% of line capacity.
Target improvement 25%-30%
increase in capacity
3. Poor material from upstream
processes causes downtime due to lack
of material. This accounts for 10% of
availability .
Target availability improvement from
downstream processes 5%

Slide 45
Action Map
Goal
Strategies
Actions
Assumptions
Outcome
Actions Actions
Assumptions Assumptions
Strategies What will we do to achieve the goal
What do we need to achieve to be
successful
What will success deliver
What actions will will support the
strategy
What are the fundamental parts of the solution
Section Header

`
Action Map Example
Seamless start up A. Outcome
B. Goal
D. Actions
E. Issues to be resolved
99% Efficiency,
Green for lean on go live
C. Strategies
Maintenance Plan
Compliance
Documentation
Maintenance Tasks /Role
Ramp up
Case Presentation
Existing Equipment
WIP Management
Finalise Design
Skill Development
Skills Training Process
FDS
Procedure Design
8. Bar Code
Layout
Project
Resource Release
Auto Palletiser Project @ 8 May 2014
Design
AssessmentNow Future
Customer 3
LCC 3
Operability 3
Maintainability 3
Reliability 3
Safety 3
Average 1.6 3
1.8
1.6
1.2
(1= limited, 3= acceptable, 5 = Excellent)
Commissioning plan

Action Map Workstream Summary
Slide 47
Workstream Aim EEM Team Planned Outputs
1 2 3 4 5
1. Compliance 100% compliance for all
internal specifications or
in outs to Autopalletiser
Commercial
Perform gap
analysis vs. case
quality doc
Agree case
quality
doc/spec
Quality/FLM
Review and sign
off
2. Maintenance Reliable safe plant Operations FMECA study Assessed parts
holding
MP2 condition
monitoring,
maintenance
tasks and follow
up review
process
Training plan
defined
Training plan
delivered and
competencies
confirmed
3. Commissioning Develop a plan to prove it
works Technical
Identify a preferred
commissioning
approach
Mobilise team
Carry out test
and
communicate
updates
Day 1
production
success
4. Finalise design Deliver URS KPI's Technical Team vision Draft FDS Final FDS Tested
software
Installed signed
off software
4.1 Layout Best use of space Operations List of activities List of tools,
info etc
Preferred option
selected (and
why)
Work station
specification
agreed
Approve layout
5. Skill Development
Develop competencies of
Auto P operation team,
support shift tech and line
MT's
Operations
List of procedures
(SOP, SWP,
CSWP)
Refine
procedures
Defined TNA
and Gap
analysis for
roles and skills
Carry out
training and
confirm
competencies

Weaknesses/ problems/ priorities
Technical Handbook
MP Data
Subjective analysis
Objective Testing
Risk Assessment/ Foolproofing
Visual Indicators for Early Problem
Detection/ Normal conditions
Standardisation Policy
Select/Refine Specification
Update Best Practice Design Book
Mock ups Simulation
Option Shortlist Option
Shortlist Option Shortlist
Evaluate, Select and Refine Preferred Option
Section Header

Short Listed options
Long List to Short List Evaluation
Function: Loading containers
3, Pit 10. Ramp and Pit
2. Ramp
Location
Internal External
14, Tanker to US 12. Consolidate
loads at haulier
13. New location current
building
11. New warehouse
1. Current location
X X X
15. Load at Bottling
X
16. Auto Carousel loading
X
Short List Logic: Assess location issues first, then method of loading
External is more expensive
No advantage in changing location No space to consolidate at
line end
£+
£+
10A. Ramp and Loading Platform

Long List Review Benefits/Outcomes
Encourages the conditions for Innovation
Structures the decision making process
Reduces the risk of missing attractive opportunities
Documents working assumptions and the basis for converging towards a preferred option:
– These working assumptions can be tested/confirmed as part of project governance/stage gate review
More time can be spent evaluating and developing the most viable options
Future team members can be quickly brought up to speed about the basis for past decisions

Subjective Analysis: Case Closing with Glue or Tape?
1. Preliminary qualitative assessment identified the double tape head as the preferred option.
(Using a 1 to 5 scale where 1 is poor, 3 is acceptable and 5 optimum solutions)
Tape was considered safer, easier to maintain, a better pack presentation to the customer and also cost less
Glue was considered to have higher reliability and require less intervention
To be robust, the assumptions on which this preliminary assessment was made had to be confirmed. These were tested using a line study and analysis of
available data.
This assessment identified that both tape and glue options provided benefits
Description Safety Reliability Operability Maintainability Customer Cost Total
1 Glue 2.5 4 4 3 4 2.5 20
2 Single tape head 3.5 3 3 4 3 3 19.5
3 Multiple tape head 3.5 3 3.5 4 3 3 20

Objective Testing : Case Closing with Glue or Tape?
Following the above analysis, the assessment was revised. Glue and the Double Tape head options were very close. Glue was selected as the preferred option because it provided more flexibility for future
packaging configurations
The design brief for the Glue option was amended to include design actions to improve safety, maintainability and cost performance to as close as possible
to that achieved by the tape option
2. Following a line study and evaluation of maintenance data
a. On some products, the mean time between intervention at the tape packing station is less than 2 minutes;
b. Discussions with marketing revealed that customers are likely to want to move to shelf ready packaging which will only be possible with Glue closures.
c. A suitable, proven double tape head solution could not be sourced
Description Safety Reliability Operability Maintainability Customer Cost Total
1 Glue 3 4 4 3 4 4 22
2 Single tape head 3.5 3 3 4 3 3 19.5
3 Multiple tape head 3.5 3 3.5 4 3 3 20

Slide 53
Specify Design Modules Structure
Process Step Criticality
Function A criticality(M)
Component B2 criticality (h)
Make Criticality and the Main Contributors to Life Cycle Costs Visible
Function C criticality(L)
Function B criticality(H)
Function D criticality (L)
Component B1 criticality (l)
Component B3 criticality (l)
Prioritise by Criticality and Life Cycle Cost Contribution
Key
High LCC
Medium LCC
Low LCC
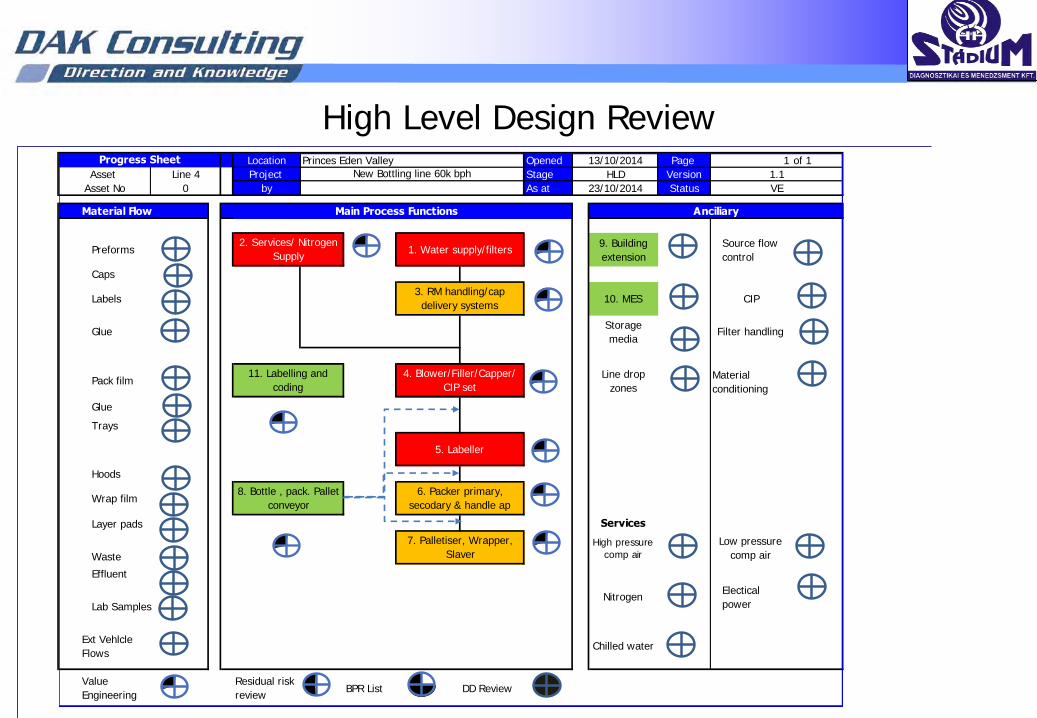
High Level Design Review Location Princes Eden Valley Opened Page 1 of 1
Project Stage Version
by As at Status
Material Flow
Preforms9. Building
extension
Source flow
control
Caps
Labels 10. MES CIP
GlueStorage
mediaFilter handling
Pack filmLine drop
zones
Material
conditioning
Glue
Trays
Hoods
Wrap film
Layer pads Services
Waste
High pressure
comp air
Low pressure
comp air
Effluent
Lab SamplesNitrogen
Electical
power
Ext Vehlcle
FlowsChilled water
Value
Engineering
Residual risk
reviewBPR List DD Review
2. Services/ Nitrogen
Supply1. Water supply/filters
3. RM handling/cap
delivery systems
11. Labelling and
coding
4. Blower/Filler/Capper/
CIP set
5. Labeller
8. Bottle , pack. Pallet
conveyor
6. Packer primary,
secodary & handle ap
7. Palletiser, Wrapper,
Slaver
Asset No 0 23/10/2014 VE
Main Process Functions Anciliary
1.1New Bottling line 60k bph
Progress Sheet 13/10/2014
Asset Line 4 HLD

slide 55
Getting the Right Design
Be aware of the shop floor operating conditions for volume production. Codify these as standards to support the design process
Configure design modules and perform structured high level design reviews to capture weak ideas and added value opportunities. – Use this to identify preferred vendor strengths and weaknesses.
Use objective testing to evaluate options and understand the strengths and weaknesses
Use DILO and simulation activities to raise understanding of cause/effect and latent design weaknesses
Process
Criticality/ targets
Sub Process A criticality(M)/
targets
Sub Process B2
criticality (h)/ targets
Sub Process C criticality(L)/
targets
Sub Process B criticality(H)/
targets
Sub Process D criticality (L)/
targets
Sub Process B1
criticality (l)/ targets
Sub Process B3
criticality (l)/ targets
Design Standard Hierarchy
Ops 6 Data Collection
Ops 7 Hygiene Standards
Ops 8 Environment
Operability
Ops 9 Ease of Operations (inc access)
Ops 10 Manning / Resource
Ops 11 Materials flow and control
Ops 12 Building Area & Fabrication
Manufacturing Process Standards Functional
Standards
Component Standards
Commercial
LCC
Maintainability
Reliability
Safety
Weaknesses/ problems/ priorities
Technical Handbook
MP Data
Subjective analysis
Objective Testing
Risk Assessment/ Foolproofing
Visual Indicators for Early Problem
Detection/ Normal conditions
Standardisation Policy
Select/Refine Specification
Update Best Practice Design Book
Mock ups Simulation
Option ShortlistOption
ShortlistOption Shortlist
Month in the Life list 3: Maintenance:
- Daily Checks
- Running Checks
- Routine servicing
Week in the Life list 2 Problem solving
- Availability
- Performance
- Quality Losses
PHYSICAL REPRESNTATION
OF REALITY/SCALE
Participants with defined roles /target areas
- Intrinsic Reliability
- Intrinsic Safety
- Ease of use
- Ease of Maintenance
- Product/Service Quality
- Product/Service Profitability
Design Feedback/Concerns
Checklist Development
Life cycle cost Innovation
Day in the Life list 1 Production:
- Start up
- Steady state
- Close Down
Experience/ Tacit knowledge

Milestones Resources,
Timing
Clarify project scope
Confirm concept
Vendor RFQ
EEM Define Steps: Getting the Right Design
Slide 56
Define Design Refine Improve
ConceptHigh Level
Design
Detailed Design
Pre fab Constructi
onInstall
Comm-ission Test
Stabilise Optimise
Concept Stage Gate
Define Design
Modules
Risk Assessment 1
LCC Update
Evaluate Options
Document concept
Evaluate Delivery Options
Flawless Operation
risks
LCC forecast and Targets
HLD Stage Gate
Concept
HLD
Fund Application
1. Mobilise Concept
2. Select preferred concept
3. Create Concept
Specification
1. Mobilise HLD
2. Select concept delivery
approach
3. Create HLD
Specification
4. Develop Project Plan
Design
Design
Specification
Specification
Project Manage
4. Develop Project Plan
Project Manage
Milestones Resources,
Timing
Define business
case
Understand Operational
Reality
Document HLD
Section Header

Slide 57
Collaborating with Vendors
Technical
Commercial
Operations
Vendor
Vendor
Vendor
What we need
Commercial
Operations
TechnicalCommercial
Operations
Technical
Common Vision
What we can get

0
1
2
3
4
5Commercial Status
Delivery Capability
Process Capability
Technical StatusCulture
Financial/Price
Support Role
Supplier ASupplier BSupplier c
Define Vendor Assessment Profile
Apply a multi factor scale and assess each vendor against
1 = Weak
3 = Acceptable
5 = Excellent
Which supplier would you rather
work with? EEM Profile

Vendor EEM Questions Code Standard Scope Module Weakness /
Issue 3. Acceptable Standard Question Answer(Yes, No, N/A)
Degree to which you comply (1-5)
Details of where standard is not met, or deemed not applicable
Safe 1 SafetyAccess, weight handling,
oven belt cleaningGeneral Risk of injury
No heavy lifting, Ergonomics considered,
lifting equipment identified for maintenance.
Does your design support good ergonomic
practicess as set out in the acceptable
standard
Rel 1Changeover
SMED
Mould change over time,
low hopper allarms, auto
splice, auto check,
accumulation lane changes
GeneralMinimise the need for
intervention Minimum manual activity, no tools required,
Does your design support minimal
changeover activity without the need for
tools
Rel 2 Materials
Material quantities and
reconcilliation, blower auto
change, confirmation of
materials,
General
Reduce risk of human error
and admin needed to
maintain traceability of
materials
Counters at key points to capture material
usage/rejects
Does your design include counters for good
and scrap materials at each production step.
Is it easy to capture and archive this
information
Rel 3 CIP Sanitisation and utilities GeneralMinimse build up of
contaminants, reduce
Optimised CIP time and frequency to achieve
zero micro failures,Does your design include optimised CIP
Rel 4Work Place
Organisation
Energy efficiency, storage,
wash facilities, networking,
mods to existing lines,
tracking label production,
CIPsplit, guide rail
adjustment, operator levels
General
Minimise movement, allow
at least 30 minutes between
intervention
Formal layout with clearly defined work
space change parts, communications, quality
checks and materials integrated with other
lines
Does your layout include recommended
space requirements for the items set ou tin
the acceptable standard
0.00
0.00 Created
0.00 Sent to vendors
0.00 Response from vendor
0.00 Evaluated
0.00 Closed
Eval Weight Score
Safe 1 Safety
Does your design support good ergonomic
practicess as set out in the acceptable standard0 0 0
0
10 0
Rel 1
Changeover
SMED
Does your design support minimal changeover
activity without the need for tools0
0 0 010 0
Rel 2 Materials
Does your design include counters for good and
scrap materials at each production step. Is it
easy to capture and archive this information
0
0 0 0
10 0
Suplier Response
Core Team
Intrinsic Safety
Intrinsic Reliability
Operability
Maintainability
Customer Value
Life Cycle Cost
EEM Standard Question
Degree to
which you
comply (1-5)
Details of where standard is
not met, or deemed not
applicable
Any further detail/supporting
evidenceFurther Questions
0.00
0.00
0.00
0.00
Summary

Detailed Design Process
Decisions made at the earliest steps of the project have the biggest impact on Life Cycle Costs (LCC)
Use Detailed Design Module Reviews
– identify the main contributors to LCC
– Explore options to
Reduce life cycle costs
Increase project value
Flush out latent design weaknesses
– Gain an insight into the route to flawless operation
DESIGN DEFINE REFINE IMPROVE
ConceptConceptHigh High
Level Level
DesignDesign
Detailed Detailed
DesignDesign
Process Process
DevelopDevelop
mentmentInstallInstall
CommComm--
issionission
TestTestStabiliseStabilise OptimiseOptimise
DESIGN DEFINE REFINE IMPROVE
ConceptConceptHigh High
Level Level
DesignDesign
Detailed Detailed
DesignDesign
Process Process
DevelopDevelop
mentmentInstallInstall
CommComm--
issionission
TestTestStabiliseStabilise OptimiseOptimise
LCC Influence
EEM Step
DESIGN DEFINE REFINE IMPROVE
ConceptConceptHigh High
Level Level
DesignDesign
Detailed Detailed
DesignDesign
Process Process
DevelopDevelop
mentmentInstallInstall
CommComm--
issionission
TestTestStabiliseStabilise OptimiseOptimise
DESIGN DEFINE REFINE IMPROVE
ConceptConceptHigh High
Level Level
DesignDesign
Detailed Detailed
DesignDesign
Process Process
DevelopDevelop
mentmentInstallInstall
CommComm--
issionission
TestTestStabiliseStabilise OptimiseOptimise
DESIGN DEFINE REFINE IMPROVE
ConceptConceptHigh High
Level Level
DesignDesign
Detailed Detailed
DesignDesign
Process Process
DevelopDevelop
mentmentInstallInstall
CommComm--
issionission
TestTestStabiliseStabilise OptimiseOptimise
DESIGN DEFINE REFINE IMPROVE
ConceptConceptHigh High
Level Level
DesignDesign
Detailed Detailed
DesignDesign
Process Process
DevelopDevelop
mentmentInstallInstall
CommComm--
issionission
TestTestStabiliseStabilise OptimiseOptimise
LCC Influence
EEM Step
LCC Influence
EEM Step

Working With Vendors on Detailed Design
Preparation
MP D
ata
Work
flow
Layout a
nd
specifica
tion
Desig
n M
odule
D
efin
ition a
nd
P&
EEM
timeta
ble
Pro
visio
nal w
ays
of w
ork
ing
Impro
vem
ent
Targ
ets
Life
Cycle
Cost D
ata
Workshop 1 to confirm understanding
of spec/standards, tease out latent
design weaknesses, improvement ideas
Provide additional guidance to Design team as necessary
Workshop 2 Confirm design meets
standards
Checklist 2: Confirm Design
Checklist 3: Confirm
Installation plans
Define Design Refine Improve
ConceptHigh Level
Design
Detailed Design
Pre fab Constructi
onInstall
Comm-ission Test
Stabilise Optimise

slide 62
1. What is Maintenance Prevention (MP)
…. and why is it important
This maintainer has had to crawl under G17 Lacquering Line to replace this
roller friction pad
Section Header

Slide 63
Normal and Optimum Conditions
Normal Conditions
• Equipment Condition Standards
• Asset Care Regime
• Operating Best Practice
• Training
• Component Modification
2. Chronic
Losses
1. Sudden Failures
Optimum Conditions
• Pre emptive control of defect source
• Visual Control, ease of detection
Equipment
Effectiveness
Usage/Time
Normal Conditions
• Equipment Condition Standards
• Asset Care Regime
• Operating Best Practice
• Training
• Component Modification
2. Chronic
Losses
2. Chronic
Losses
1. Sudden Failures
Optimum Conditions
• Pre emptive control of defect source
• Visual Control, ease of detection
Equipment
Effectiveness
Usage/Time

Slide 64
Best Practice Asset Care
Prevent Deterioration
Measure Deterioration
Restore and Repair
Look, feel listen inspection, Lubricate
Clean, Adjust, Minor repairs and
Record data
Monitoring, Prediction,
diagnose and plan maintenance
Preventive maintenance, Periodic Repairs
Correct causes of breakdowns
The route map to zero breakdowns
Prevent Deterioration
Measure Deterioration
Look, feel listen inspection, Lubricate
Clean, Adjust, Minor repairs and
Record data
Monitoring, Prediction,
diagnose and plan maintenance
Preventive maintenance, Periodic Repairs
Correct causes of breakdowns
The route map to zero breakdowns

Slide 65
Best Practice Operations
Start up Steady state Close down

slide 66
Understanding Deterioration
Natural – Normal wear out
Accelerated – Neglect
– Consequential damage
– Dirt and dust in moving parts
– Incorrect operation
Reduce the causes of accelerated deterioration to:
- Stabilise and extend component life.
- Set the foundation of zero breakdowns

slide 67
Getting to Root Cause
– Why did the cog wear out rapidly
Because the chain was loose and out of alignment
– Why? Because it had stretched and not been adjusted
– Why? Because the condition of the chain was not monitored
– Why? Because the chain could not easily be inspected
– Why? Because the importance of the adjustment was not recognised
– Why? Because there are no formalised asset care standards
Action required Short term: Replace the cog
Long term: Establish an adequate standard of asset care

slide 68
Pre start check of chain tension
Improving Maintainability
Visual check of adjustment
limits to avoid over stretching
chain
Schematic shown with guard removed
Setting for plunger gauge

slide 69
Reducing Contamination
Dirt brought in during transit
Dust falling from beams, cranes, hoists, vents
Sweat from hands, blowing out swarf
etc
Floor dust raised by movement/cleaning
Scattering of dust and
Contamination brought in on the work piece or
tooling
dirt from the process
Dirt and dust in getting into moving parts accelerates wear

Slide 70
Preventing Quality Defects
Stable Asset Condition Raising of Process Standards
Defects
Variation from
optimum
performance
Equipment
condition
Human
error
Tooling/
Process
Imperfections
Variation in
environment

slide 71
Brush sanding mach
-Problem with different
speed of pcs in machine
-Alignment of pcs
Flash-off
-Synchronization problem
with spray box and drier
Spraying box
-Roller cleaning unit
-Line control system
-Paint system (pumps, valves,
nozzles, piping etc)
Buffer
- stops & sync. problems
Out feeder
-Lifting table
-Conveyors
-Positioning & tracking
-Not optimized function
Paint Line intervention points
Extraction system
-Frequent blockages
poor extraction

Defect Prevention: Reducing Errors Define Design Refine Improve
ConceptHigh Level
Design
Detailed Design
Pre fab Constructi
onInstall
Comm-ission Test
Stabilise Optimise
1. Methods
1. Easy to establish reference planes
2. Easy to clamp
3. Easy to position in fixtures
4. Tends to stay centred
2. Materials
1. Resists damage
2. Rarely forms burrs
3. Easy to machine
4. Easy to measure
3. Machinery
1. No scattering of swarf or dust
2. Easy to remove swarf or dust
3. Easy to start up, change over, run and close down
4. Minimal cleaning required
4. Manpower
1. Easy to distinguish from other products or components
2. Easy to assemble
3. Easy to automate
Mark red/green limits on indicators for
– Roller pressure,
– Scraper pressure
– Pump pressure

slide 73
Maintenance Prevention Principles
Break out of equipment centred design and adopt a human-machine approach
Stabilise and extend component life (MTBF) – Reduce the causes of accelerated wear
– Accurately predict component life
Improve Maintainability and MTTR – Access
– Early problem detection
– Routine servicing
Improve quality maintenance (MTBI) – Control of tooling
– Critical to quality components
– Optimum conditions
Outcome: Reduction in Equipment Life Cycle Costs
Stable Asset ConditionStable Asset Condition Optimum Asset Condition Optimum Asset Condition
Defects
Variation from
optimum
performance
Equipment
condition
Human
error
Tooling/
Process
Imperfections
Variation in
environment
Defects
Variation from
optimum
performance
Variation from
optimum
performance
Equipment
condition
Human
error
Equipment
condition
Human
error
Tooling/
Process
Imperfections
Variation in
environment
Tooling/
Process
Imperfections
Variation in
environment

1. Develop the road map to develop core, intermediate and specialist competencies as part of the detailed design activity planning activity
2. Operational methods
1. Workflow, Defect prevention, Best practice development route (PDCA), Job/skill profiles, Training/skill development
3. Operations Organisation
1. Workplace information, Work Planning/Scheduling, Recording and reporting, Cost control, Stock management, operations organisation
4. Maintenance methods
1. Maintenance prevention, Best practice evolution (PDCA), Inspection, Spare parts, Machine manuals, Service Level Agreements, Maintenance organisation
5. Maintenance Organisation
1. Technical information, PM Planning/Scheduling, Recording and reporting, Cost control, Lubrication and spares control
As soon as each design module is completed, begin work on the road map to develop internal Core, Intermediate and Specialist competencies for the new operation.
Mastering New Competencies Define Design Refine Improve
ConceptHigh Level
Design
Detailed Design
Pre fab Constructi
onInstall
Comm-ission Test
Stabilise Optimise
Section Header

Slide 75
Categorise Mechanisms (Case Study)
In/Outfeed Stations
Belts
Pick/Place Sensors/Cameras
Guides/Brushes
Pneumatics
Positional Controls
Chain/Pushers
Print/Glue Applicators
Assembly
Cutting/Imprint
Process Stitch
Laminate
Drives Mechanical
Electrical
Lubrication Oil
Grease
Product Inspection
Manual
In process
Contamination control
Paper/Dust
Ink/Glue
Material Movement

Slide 76
Categorise Skill Profile Per Shift and Work Group
Focussed improvement
Foundation/ Core
Intermediate Specialist
Best practice Operations
Foundation/ Core
Intermediate Specialist
Asset Care
Routine Checks
Inspection Servicing
Competence needed by all line personnel
Competence within each line team
Competence needed within each shift team
Lean Maintenance: Traditional Skills Plus
Outer Ring Production Team Leader and Maintenance
Engineer

Slide 77
Single Point Lesson - Example
001
SPL NO.
Start up best practice operation
M201 Milling Machine How to… TASK
1.0
14.03.01
VERSION:
DATE:
Report non conformance 6.
Check tools on shadow board 5.
Switch on – check flow/direction and switch off.
Check coolant 4.
Remove and replace coolant drip tray Check coolant return hoses are in drip tray 3.
Location and confirmation Check oil levels and air pressure 2.
Where power isolated and warning light Check power on at compressor 1.
VISUAL AID KEY POINTS TO DEMONSTRATE MAIN STEPS
(who, what, why, where, when) No.
After 1 month of full operation
After 1 week of full operation
After 2 supervised start-ups
COMPETENCY STATUS
Authorised instructor Team Lead
AUTHORISATON:
1.
Power
is on

Slide 78
Define Skills Provision Policy
Training time
required
Frequency of skill used Short
Long
Frequent Infrequent
Job Requirement for new hires
Potential sub contract role
Internal training
programme/ facilities
Periodic refresher/
Single point lesson

slide 79
Coordinate Training and Competency Assessment
Date opened Date closed
Company Long meadow Asset/Shift Injection Moulding Campaign Basic Asset care Page 1 of 1
20/01/2009Training Matrix
Name
SPL1
Dai
ly
Cle
anin
g
SPL2
Hyd
raul
ic
Car
eSP
L3 S
lide
bed
care
SPL4
Gre
asin
gSP
L5:L
ubrica
ti
on typ
es
SPL6
Lu
bricat
ion
chec
ksSP
L7:
Tem
pera
ture
chec
ksSP
L8: Coa
ter
wee
kly
clea
n
SPL9
: Pi
t clea
n ou
t
1 Mike Traynor
2 George Wear
3 Mark Hogan
4 Jane Crowther
5 Darren Field
6
7
8
9
10
11
12
Aware Understands Competent

slide 80
Problem Prevention Working Methods
Refine operations and maintenance best practice as part of commissioning
Finalise visual management specification and micro layout level – Visual workplace, layout/signage
– Visual indicators/Normal Conditions
– Colour coding
– Visual Management
Carry out training and skill development cascade to deploy core skills and structure the development of team intermediate and specialist competency skills inventories.
Define Design Refine Improve
ConceptHigh Level
Design
Detailed Design
Pre fab Constructi
onInstall
Comm-ission Test
Stabilise Optimise
Date opened Date closed
Company Long meadow Asset/Shift Injection Moulding Campaign Basic Asset care Page 1 of 1
20/01/2009Training Matrix
Name
SPL1
Dai
ly
Cle
anin
g
SPL2
Hyd
raul
ic
Car
eSP
L3 S
lide
bed
care
SPL4
Gre
asin
gSP
L5:L
ubrica
ti
on typ
es
SPL6
Lu
bricat
ion
chec
ksSP
L7:
Tem
pera
ture
chec
ksSP
L8: Coa
ter
wee
kly
clea
n
SPL9
: Pi
t clea
n ou
t
1 Mike Traynor
2 George Wear
3 Mark Hogan
4 Jane Crowther
5 Darren Field
6
7
8
9
10
11
12
Aware Understands Competent
Foundation/ Core
Intermediate Specialist

Slide 81
Developing the Forward Plan
Define the Scope: Use action mapping to agree what needs the tasks and accountabilities to achieve flawless operation from day 1.
Planning the plan: Use milestone planning to explore risks, develop sequencing, identify the critical path and support top level progress reporting/risk management
Work Structuring: Design detailed work packets to a standard time interval to support work load balancing, management of site resources, progress reporting and quality assurance.
Progress Management: Establish standard progress management routines for each work package covering
– Preparation
– Safety management
– Reporting, review and action
– Feedback/lessons learned
`
Seamless start up A. Outcome
B. Goal
D. Actions
E. Issues to be resolved
99% Efficiency,
Green for lean on go live
C. Strategies
Maintenance Plan
Compliance
Documentation
Maintenance Tasks /Role
Ramp up
Case Presentation
Existing Equipment
WIP Management
Finalise Design
Skill Development
Skills Training Process
FDS
Procedure Design
8. Bar Code
Layout
Project
Resource Release
Auto Palletiser Project @ 8 May 2014
Design
AssessmentNow Future
Customer 3
LCC 3
Operability 3
Maintainability 3
Reliability 3
Safety 3
Average 1.6 3
1.8
1.6
1.2
(1= limited, 3= acceptable, 5 = Excellent)
Commissioning plan
EEM Road Map Overview Eden Valley Line 4
Goal SG Review
1 Mobilise concept
2 Select preferred concept
3 Create concept specification
4 Develop project plan
1 Mobilise HLD
2 Select concept delivery approach
3 Define HLD specification
4 Develop project plan
Eden Valley Line 4 Goal SG Review
1 Procure
2 Equipment detailed design
3 Freeze specification
4 Detailed activity planning
1 Mobilise PFP
2 Operations change management
3 Organise installation and commissioning
4 Deliver QA Plan
Eden Valley Line 4 Goal SG Review
1 Mobilise installation
2 Install
3 Pre commission
4 Installation coordination
1 Mobilise Commissioning
2 Commission
3 Flawless Operation delivery
4 Commissioning coordination
Eden Valley Line 4 Goal SG Review
1 Mobilise team
2 Stabilise "Normal" conditions
3 Technical stability
4 Coordinate handover
N D J
J J A S O N D J
2015
J J A S OM
M
D J
2015
J J A S OM
M J J A
A M
18/02/2016
24/06/2026
A M
N D J F M
N D J F
A M
0
21/11/2014
20/03/2015
20/11/2015
15/01/2016
Impr
ove
Step 7 Stabilise
Def
ine
Des
ign
Ref
ine
Step 1: Concept
Development
Step 2: High Level
Design
Step 3: Detailed
Design
Step 4: Pre Fab
Procurement
Step 5 Installation
Step 6 Commissioning
Task
Task
Task
7. To establish normal
conditions without
special support
1. To develop a
preferred concept
2. To develop a
funding application
and vendor short list
3. To select a
preferred vendor,
detailed specification
and installation plan
4. To manufacture
equipment and
prepare site for
installation
5. To Install
equipment, finalise
micro layout and
prepare glide path to
flawless operation.
6. To deliver flawless
operation on
production day 1
J A STask A MO N D J F
J A S O N D J F M
2014 2015
2014
M
MJ A S O
2014
2014
J A S O
2015
N D J
S O N F M A M J
2016
F M A M J
2016
2016
2016
F M A M J
F M A M J
Slide 82
Plant
Process
Module
Function
Work package
Process
Module
Function
Work package
Module
Function
Work package
Function
Work package
Level
1
2
3
4
5
(Prep, Assembly Packaging etc)
(Silo, Mixing, etc)
(Valve, Pipework)
Section Header

Slide 82
Installation Work Structuring
Responsibility for work
Performance Measures
Resource Estimate
Cost elements
Budget
Schedule
Scope of Work
Plant
Process
Module
Function
Work package
Process
Module
Function
Work package
Module
Function
Work package
Function
Work package
Level
1
2
3
4
5
(Prep, Assembly Packaging etc)
(Silo, Mixing, etc)
(Valve, Pipework)

Review each work packet and assess risks
Create Health & safety plan
– Work permit procedure (hot work, confined area’s height)
– Power supply / scaffolding / lifting / transport
– Emergency procedure
– Safety training required
Assign work area coordinator
Define Toolbox meeting schedule
Installation Risk Assessment Management Plan

1. The Pre Fab Procurement step includes witnessed inspection and problem prevention activities.
2. Review vendor quality plans to confirm inspection criteria for:
1. Manufacture of equipment prior to installation on site.
2. Installation plans, quality assurance milestones and inspection criteria during installation
3. Update action plan and allocation of tasks
4. Track formal sign off of witnessed inspection protocol on completion of tests
This template provides a format for coordinating the development of working methods, organisational and skill development needs for the new operation.
Version 1
Opened fill in date at Temp 3.1
Closed fill in date at Temp 3.1
Create a template based on template 3.3 for each of the following work streams and drop
down heading lists
Use standard templates for items below as applicable
Applicable Allocated to Report Completed
1
2
3
4
5
6
7
8
9
10
11
12
13
Installation testing
Checks/tests to assure:
1
2
3
4
EEM Step 3.11
SiteAsset
Construction site safety
Equipment performance targets can be
met
Factory Acceptance Testing
Equipment Manufacturing
fill in site name at template 3.1
fill in asset name at template 3.1
Best Practice Routines are developed
and trained in
Flawless operation can be achieved
Equipment/Installation
Material and specification
Welding
Pickling and passivating
Painting
Fixtures and fasteners
Insulation
Scope of delivery
Testing and inspection
Data sheets
Documentation
Transport
Modifications and Inspections
Problem Prevention: Witnessed Inspections Define Design Refine Improve
ConceptHigh Level
Design
Detailed Design
Pre fab Constructi
onInstall
Comm-ission Test
Stabilise Optimise

Getting the Design Right
Collaborate with vendors to improve design effectiveness
Include maintenance prevention and defect prevention as part of detailed design process
Structure the process to master new competencies – Categorise core, intermediate and specialist competencies
– Identify gaps, assess options for provision
Develop quality plans to assure manufacture, installation and commissioning of design modules
Slide 85
Best Practice Asset Care
Prevent
Deterioration
Measure
Deterioration
Restore and
Repair
Look, feel listen
inspection,
Lubricate
Clean, Adjust,
Minor repairs and
Record data
Monitoring,
Prediction,
diagnose and plan
maintenance
Preventive maintenance,
Periodic Repairs
Correct causes of
breakdowns
Prevent
Deterioration
Measure
Deterioration
Look, feel listen
inspection,
Lubricate
Clean, Adjust,
Minor repairs and
Record data
Monitoring,
Prediction,
diagnose and plan
maintenance
Preventive maintenance,
Periodic Repairs
Correct causes of
breakdowns
Developing Best Practice Operations
Start up Steady state Close down
Designing in Problem Prevention
Match lines
Use red lines for items
found loose more than
once
Insertion of
thermocouples
Red/green sections to
show if thermocouple is
fully inserted
Interior
Green (normal value)
Red (safety limit)
Making Best Practice Transparent
Transparent
Factory
slide 124
Designing In Early Problem Detection
Before After
Make it easy to do right
Difficult to do wrong
Technical
Commercial
Operations
Vendor
Vendor
Vendor
What we need
Commercial
Operations
TechnicalCommercial
Operations
Technical
Common Vision
What we can get
Version 1
Opened fill in date at Temp 3.1
Closed fill in date at Temp 3.1
Create a template based on template 3.3 for each of the following work streams and drop
down heading lists
Use standard templates for items below as applicable
Applicable Allocated to Report Completed
1
2
3
4
5
6
7
8
9
10
11
12
13
Installation testing
Checks/tests to assure:
1
2
3
4
EEM Step 3.11
SiteAsset
Construction site safety
Equipment performance targets can be
met
Factory Acceptance Testing
Equipment Manufacturing
fill in site name at template 3.1
fill in asset name at template 3.1
Best Practice Routines are developed
and trained in
Flawless operation can be achieved
Equipment/Installation
Material and specification
Welding
Pickling and passivating
Painting
Fixtures and fasteners
Insulation
Scope of delivery
Testing and inspection
Data sheets
Documentation
Transport
Modifications and Inspections
Foundation/ Core
Intermediate Specialist

Core Skill Development
Refine BPR and layout
Induct new team
members
EEM Refine Steps: Delivering Flawless Operation
Slide 86
Define Design Refine Improve
ConceptHigh Level
Design
Detailed Design
Pre fab Constructi
onInstall
Comm-ission Test
Stabilise Optimise
Installation complete?
Document Management
Flawless Op Glide Path
Induct new team
members
Issue capture and resolution
Transfer and Acceptance
Hand over
Day 1 Readiness
Review
Install
Commission
1. Mobilise Installation
2. Install 3. Pre
Commission
1. Mobilise Commissioning
2. Commission
3. Flawless Operation Delivery
4. Commissioning Coordination
Design
Design
Specification
Specification
Project Manage
4. Installation
Coordination
Project Manage
Control Plan Achievement
Control Plan Achievement
Issue capture and resolution
Test functionality
Test ways of working
Flawless Op readiness
review
Section Header

Slide 87
Installation Management Preparation
– Make arrangements for materials and equipment – Provide scaffolding, lighting, power, positioning/lifting equipment where
they are needed – Install temporary piping for purging/cleaning – Organise waste disposal routes – Statutory inspections
Safety Management – Carry out risk assessment – Review and amend safety policy/briefing as appropriate – Organise safety patrols, safety partners and daily accident prevention
activities – Arrange resources to carry out safety inspections of contractor equipment – Provide safety training/induction facilities
Reporting – Daily/weekly progress, delays, resource usage vs. budget for each work
package, progress against quality plan milestones; – Record resources used and potential for improvement – Record safety patrols, incidents and action taken – Work completion/start up report planned vs. actual, problems
opportunities; – Post installation report, pre planning for next project
Define Design Refine Improve
ConceptHigh Level
Design
Detailed Design
Pre fab Constructi
onInstall
Comm-ission Test
Stabilise Optimise

Operations LRM/Work Planning
Logistics Project Administration
Slide 88
Customer Sign off
Contract Management
Inbound Logistics
Job Planning Inspection
Return Plant and Equipment
Daily Schedule
Managing Underpinning Systems
Credit Check
Release Order
Receive Order
Allocate Teams
Update Master Schedule
Check availability
Week 1 and 6 Schedule
Call off materials
Coordinate work packet
Work completion
Close Down/ Clean out
Await QC release
Invoicing
Project Completion RM Invoices
Document Management
Record Costs
Tender Management
Case study Example
Delays
Late Changes
Delays
Accuracy

Toyota Visual Project Management Processes

Project Visualisation: Oobeya Room

Commissioning Management
Effective organisation
– Induction of team members,
– Cross functional teams located together
– Formal roles and test/handover protocols
– Central storage of paper documentation
– Appropriate IT system support
Extensive and integrated planning
– Single cross functional planning process
– Milestone plans supported by detailed work packet activity planning and critical path analysis
– Visual scheduling to show early completions, delays, next steps at a glance
Good communications
– Daily meeting: progress, delays, defect management, query resolution, defect recording, next steps.
– Single point of contact, regular honest 1 page progress reports
Contingency planning
– Risk assessment and what to do if things go awry
– Raise understanding of process chemistry
– Time to practice critical drills, handover protocols and safety and recovery routines
Problem solving
– Be prepared to stop and take stock
– Apply structured documented problem solving process
– Document lessons learned (Equipment and project process)
Systems for assuring progress quality and controlling changes – Test/audit results
– Change approval and documentation update
Define Design Refine Improve
ConceptHigh Level
Design
Detailed Design
Pre fab Constructi
onInstall
Comm-ission Test
Stabilise Optimise

Flawless Operation
Flawless operation means no sporadic failures and stable operation
To achieve that we need to manage the glide path to establish • Equipment condition standards
• Tested past infant mortality failure mode
• Functional profile confirmed
• Asset care regime • Start up checks, running checks, servicing
standard practices in place
• Operating best practice • Standard practices for start up, steady state,
close down/clean out
• Competency • Core competencies in place
• Intermediate and specialist support in place
• Skills transfer/competency development road
map in place.
Slide 92
Define Design Refine Improve
ConceptHigh Level
Design
Detailed Design
Pre fab Constructi
onInstall
Comm-ission Test
Stabilise Optimise
(%)
Efficiency
Problems
0
Target
Test run
Installation
Commissioning
Acceptance
Start-up period
TimeProblems
Fabrication
Design
After application of After application of
EEMEEM
(%)
Efficiency
Problems
0
Target
Test run
Installation
Commissioning
Acceptance
Start-up period
TimeProblems
Fabrication
Design
After application of After application of
EEMEEM

KPI: Measurement of Vertical Start Up Vertical Start up % =
Actual start up time X 100%
Planned (vertical) start up
Project Example Vertical Start up
Single B or C machine
Laser coder, fermentation tank Air compressor
<1 day
Single A machine Labeller, mash filter <1 week
Full Line Packaging line, Brew house, Power Distribution
<1 month
Complete Brewery Brewery < 1 year
90% of Spec Performance
Planned time
Actual time
Installation completed
Quality and Performance
Achieved

Commissioning Process

Plan steps to Optimum Conditions
Mobilise Team
Improve Steps: Delivering Stable Operation
Slide 95
Define Design Refine Improve
ConceptHigh Level
Design
Detailed Design
Pre fab Constructi
onInstall
Comm-ission Test
Stabilise Optimise
Site Acceptance
Induct new team
members
Define Optimum Conditions
Update Documentation
Stabilise
Optimise
1. Mobilise Stabilisation
2. Stabilise Normal
Conditions
3. Technical Stability
1. Mobilise Route to Optimum Conditions
Design
Design
Specification
4. Coordinate Handover
Project Manage
Develop intermediate and specialist skills
Transfer Operational
Roles
SpecificationProject Manage
Performance analysis and
tracking Control Plan Achievement

slide 96
Update Documentation
Technical data – Catalogues, patents, journals – Technical literature – Design reviews, debugging reports, test
reports – Equipment capacity data, market requirements
Criticality data – Safety, Reliability, Maintainability and
Operability data – Assessment of weak components
Reliability maintenance information – Condition appraisal reports and action lists – OEE data and analysis of hidden losses – MTBF analysis and repairs
Operations MP Data – inspection and servicing routines – Operating manuals – Failures and defects – Equipment surveys (e.g. capacity/energy) – Problem prevention and improvement actions – MTBF/MTTR/MTBI analysis – Corrective maintenance
Safety action reports – Accident reports – Situation reports – Safety improvements
Best Practice Design Books – Stage gate checklists – Drawing check dates – Common parts lists – Standards
EEM Design standards CAD automated design Standard drawings
Processes and Procedures – Standard Operating Sheets – Asset care – Process control parameters
Define Design Refine Improve
ConceptHigh Level
Design
Detailed Design
Pre fab Constructi
onInstall
Comm-ission Test
Stabilise Optimise
Specification

Key Learning Points
Extensive integrated planning in detail – Single plan, include contingency plans and understand the critical path
Structure the assurance process to capture and resolve latent weaknesses and control engineering change as a routine activity.
Set out the glide path to flawless operation – Manage the development of new competencies as part of the installation and
commissioning process
– Be prepared to stop and take stock if progress is not as expected
Capture lessons learned in best practice design books including: – Stepwise evolution of operational design;
– Updated standards and processes
– Relevant company team and vendor knowledge
Slide 97
(%)
Efficiency
Problems
0
Target
Test run
Installation
Commissioning
Acceptance
Start-up period
TimeProblems
Fabrication
Design
After application of After application of
EEMEEM
(%)
Efficiency
Problems
0
Target
Test run
Installation
Commissioning
Acceptance
Start-up period
TimeProblems
Fabrication
Design
After application of After application of
EEMEEM

0
1
2
3
4
5
Design Specification
Project Structure
Latent Weaknesses
Project Problem Prevention
Design Effectiveness
Project Handover
EEM Diagnostic ProfileModel Answer
HLD/funding sign off acceptable
Formalise steps to tease out design weaknesses and increase project value
Formalise vendor QA review/witnessed testing
Improve visibility of snagging issues and test runs. Use to refine best
practice
Improve sign off process (Sometimes impractical)
Widen scope of design brief to allow input from project team
EEM Step Totals
A Concept 2.50
B High level design 3.00
C Detailed design 2.50
Sub Total Planning 8.00
D Pre fab procurement 2.50
E Install 2.50
F Commission/test 2.00
Sub Total Implementation 7.00
Section Header

Interpreting Priorities for Action
Define Design Refine Improve
1.Concept2.High Level
Design
3.Detailed Design
4. Pre fabConstructi
on5.Install
6.Comm-ission Test
7. Stabilise
8. Optimise
Funding Day 1
Steps 1 and 2 focus on
getting the right design
Design Specification
Steps 3 and 4 focus on getting
the design right
Project Manage
Steps 5 and 6 focus on
delivering flawless
operation
Steps 7 and 8 focus on
delivering year on year
performance improvement
Deciding what to do Making it happen
EEM Step Totals
A Concept 2.50
B High level design 3.00
C Detailed design 2.50
Sub Total Planning 8.00
D Pre fab procurement 2.50
E Install 2.50
F Commission/test 2.00
Sub Total Implementation 7.00
OK but could be improved
Poor Discipline
Informal Processes
Diagnostic Score

Slide 100
Early Equipment Management Implementation Milestones
Pilot Project Roll out Condition
1. EEM Readiness
Review
Review existing design process and select initial projects and personnel
Involve key personnel in leading their first early management project. Define cross project improvement targets
Use case studies as part of the induction process for new team members and project sponsors. All new projects use EEM
2. Mobilise EEM Project
Mobilise initial project team(s), develop initial project standards and checklists.
Launch teams and facilitate cross project learning to support delivery of flawless operation from day 1.
Develop EEM facilitators skills to reduce project delivery times.
3. Learn through doing
Use practical project to enhance current capital delivery process.
Focussed improvement teams resolve chronic losses and structure knowledge base. Apply knowledge learned through each EEM milestone plan step.
All new product development projects carried out using EEM principles and techniques to deliver flawless operation from day 1 with less resources.
4. Develop site level
competencies
Site level core and stage gate team development, capture of lessons learned and stage gate review process.
Establish site level EEM master plans and deploy. Reviews as part of business planning process.
Reinforce ways of working, record and apply focussed improvement outputs to update EEM standards

Action Planning
Benefits
Concerns
Next Steps
Slide 101
Section Header

Early Equipment Management Key Learning Points
EEM improves design effectiveness and delivery of Flawless Operation from production day one through the use of cross functional teams, clear processes to capture issues early and stage gate governance to prevent them passing onto later stages
EEM Activities concern: – Getting the Right Design
Systematic assessment and selection of options
Encourage creativity and innovation
– Getting the Design Right
Capture and develop ideas, assess risks and communicate effectively
Collaborate to tease out latent design weaknesses and reduce life cycle costs
– Managing the route to flawless operation
Clear plans, resources, timings and key decision points;
Project organisation and accountabilities and collate support plans;
Measure progress to business goals, coordinate next steps and actions to deal with road blocks .
EEM Implementation – Identify performance gaps
– Use pilot project(s) to enhance current ways of working and deploy new roles/accountabilities
– Develop site level EEM master plans and best practice design books to support the targeting of design weaknesses
Slide 102
Project Manage
Specification
Design
Define Design Refine Improve
1.Concept2.High Level
Design
3.Detailed Design
4. Pre fabConstructi
on5.Install
6.Comm-ission Test
7. Stabilise
8. Optimise
Funding Day 1
EEM Project Organisation
EEMCore Team
Project Functional SupportInvolvement fluctuates
depending on project step needs
Remain with the project from
Concept to Stable Operation
Consult, Inform,
Engage
1
Process Purpose 1. Weak 3. Acceptable 5. Excellent
1 Design management
The systematic identification of a preferred operational design capable of delivering commercial goals through the most suitable technology.
Informal or missing design development steps. Heavy reliance on vendor to deliver what is needed. Emphasis on technical performance. Little or not front line involvement pre installation.
Design standards used to raise vendor understanding of operational needs. Cross functional teams select and refine design options from concept step.
History of improved design standards leading to industry leading performance
2 Specificationand LCC Management
The application of commercial, operational and technical knowledge to achieve a robust specification capable of delivering the full potential of the preferred design.
Rely on contractor documentation, limited attempts to tease out latent design weaknesses/refine
Formal specificationdevelopment process used to reduce LCC and enhance project value.
Significant history of reduced life cycle costs and increased project value
3 Project and Risk Management
A collaborative project management approach to deliver flawless operation from production day 1 and lowest operational life cycle cost.
Use contractor projectmanagement processes, rely on contractual clauses to manage risk.
Formal project templates and checklists used with stage gate reviews to trap oversights and opportunities
Systematic reduction in resources needed to deliver flawless operation

DAK Consulting, Chiltern House, 45 Station Road, Henley on Thames, RG9 1AT, UK.
+44 (0) 1491 845504 [email protected], website: www.dakconsulting.co.uk