an intelligent system to detect the type of devices sending
TRANSCRIPT

Network Protocols and Algorithms
ISSN 1943-3581
2013, Vol. 5, No. 2 2013, Vol. 5, No. 2
www.macrothink.org/npa 72
An Intelligent System to Detect the Type of Devices
Sending and Receiving Data in the Network
Diana Bri1, Alejandro Canovas
2, Jesus Tomas
3 and Jaime Lloret
4
Integrated Management Coastal Research Institute, Polytechnic University of Valencia
C/ Paranimf, 1, Gandia, Valencia (Spain)
E-mail: [email protected],
Received: May 25, 2013 Accepted: June 19, 2013 Published: June 30, 2013
DOI: 10.5296/npa.v5i2.3833 URL: http://dx.doi.org/10.5296/npa.v5i2.3833
Abstract
Nowadays mobile and fixed devices are used interchangeably for surfing the web due to the
huge improvements performed in mobile devices in the recent years. Both mobile and fixed
devices with Internet connectivity are supplied with different types of connection, thus users
can select the best one at any time depending on their environment. In general, the mobile
devices allow users access to Internet using the 3G network or a common WiFi connection,
and the fixed ones generally use a wireless or wired connection. Selecting one or another type
of connection implies different features of the network environment, so Internet Service
Providers need to adapt their infrastructure to guarantee acceptable levels of Quality of
Service in every type of connection. In this paper we study the behavior of the devices
according to their nature, that is, if it is a mobile or fixed device. First, we have classified the
most significant network parameters and software application values in order to know the
nature of the device. Our proposal uses an intelligent system based on neural networks and
finite state machines that lets the Internet Service Provider know the type of device belongs
to the traffic going to its network. The system analyzes the transport and application layers
from TCP packets to discriminate the percentage of Internet traffic generated by mobile and
fixed devices. Test results show the success of the developed system.
Keywords: Device detection, Network Protocols, Traffic classification, Traffic Engineering.

Network Protocols and Algorithms
ISSN 1943-3581
2013, Vol. 5, No. 2 2013, Vol. 5, No. 2
www.macrothink.org/npa 73
1. Introduction
Internet traffic generated by mobile devices has grown impressively in recent years. They
can access to Internet using 3G or any other technology such as WiFi. It is important for
mobile phone providers and Internet Service Providers to know which device is using their
infrastructure in order to accommodate it to the user’s demand or even study the most
appropriate offers [1].
Traffic classification mechanisms allow allocating resources according to the service
provider rules in TCP/IP networks. Moreover, it lets providers control and manage these
resources, and enhance the security by knowing the type of traffic or device accessing
Internet. In addition, it will help to deploy QoS-aware mechanisms successfully.
Most papers seek different techniques to classify IP traffic [2,3,4] and several methods
have been researched. First of all, the port-based classification [5] was considered in order to
identify the application that generated each flow by its transport level source and destination
ports, but today this method has been rejected because well-known port numbers cannot be
assumed to indicate the application reliably [6]. Then, other methods have been studied, such
as statistical classification in order to probabilistically assign flows to classes, e.g., machine
learning [2] or statistical clustering [3,4,6,7], payload-classification [8] or multi-level
methodology [9].
But, our goal is to identify the type of device connected to Internet because we consider
that, by knowing this information, it is easier to predict the behavior of users on the network,
or foresee the connection time or level of attention to the requested service [10], regardless of
the type of traffic which is generating. Moreover, providers will be able to offer better
services for users adapting the transmission to the end-device because usually mobile devices
have fewer resources than fixed ones.
The first problem that must be solved is to know if it is possible to recognize the
operating system of the host connected behind a router by monitoring small variations in
certain variables. Some recent studies have proved that some type of traffic classification can
be performed [11,12]. Moreover, traffic variations generate patterns based on the operating
system, which can be recognized by an intelligent system. The main issue is to determine the
appropriate variables to be included in the intelligent system.
The objective of this work is to develop a TCP/IP classifier that is capable to distinguish
between mobile devices (phones, smartphones, tablets, etc...) and fixed devices (running
Windows, Linux or Mac OS). In order to achieve our goal, we will use statistical techniques
applied to artificial intelligence. This paper is an extension of the paper published in [13].
The remainder of this paper is structured as follows. Section 2 shows the main related
works. Section 3 explains the experiments performed to know the variables that can be used
in the intelligent system. Our device recognition system is introduced in Section 4. Section 5
describes the experimental framework used to validate our approach. Finally, section 6 shows
the conclusion and future work.

Network Protocols and Algorithms
ISSN 1943-3581
2013, Vol. 5, No. 2 2013, Vol. 5, No. 2
www.macrothink.org/npa 74
2. Related Works
Device fingerprinting identification can be classified into two groups: active and passive
approach.
In active approach the system send specific requests to the device and analyzes the
response to detect implementation-specific characteristics. D. E. Comer and J. C. Lin
demonstrated in [11] that active probing can be used to recognize TCP implementations.
Therefore, this technique is only applicable to devices acting as server.
In the passive approach, the system only analyzes the traffic sent by devices. In [12],
authors developed a naive Bayesian classifier based on TCP/IP fingerprints. This classifier is
able to count the number of host devices masquering behind a Network Address Translation
(NAT) router, analyzing the network messages, based on four variables: time to live (TTL),
don’t fragment bit (DF), window size (WS) and options block size (OBS).
Some statistical techniques applied to artificial intelligence have been implemented in
several works with success. An example is the work presented by E. Hjelmvik and W. John in
[14]. They introduce a statistical protocol identification algorithm using various statistical
flow and application layer data features.
Most published studies focus on detecting some characteristic parameters of the software
implementation, such as the browser type or the TCP/IP stack. In [15], the author introduces
the HTTP fingerprinting technique to identify the server operating system. In [16], the author
demonstrates that browser fingerprinting is a powerful technique that reveals quite a lot of
information that remains overwhelmingly tractable with the implementation of a new browser
fingerprinting method. Moreover, J. Oshio et al. [17] propose a new clustering method for
controlling the congestion window, identifying different versions of TCP at the relay router in
real time.
It is very important for Internet Service Providers to know which types of devices are
using their infrastructure in order to provide the best quality of experience to the end user. In
this line we propose a method to identify whether the traffic has been generated by a mobile
device or by a fixed device. Our system uses a passive approach to capture the network traffic
and artificial intelligence techniques to classify the Internet packets into two classes: mobile
device and fixed device. But, as far as we know there is not any device fingerprint detection
system like the one described in this paper.
3. Test bench Measurements
In order to see where we can find the information that can be used for our purpose, we
performed several experiments. The topology used in these experiments is shown in Fg 1. We
placed all devices in a local area network using a single public IP address for Internet access.
The local area network has 2 networks separated by a router. One of them uses Network
Address Translation and is used to place all devices to be monitored: a PC with Windows XP,
and a PC with Ubuntu 10.04, and a WiFi access point to connect the wireless devices: Nokia

Network Protocols and Algorithms
ISSN 1943-3581
2013, Vol. 5, No. 2 2013, Vol. 5, No. 2
www.macrothink.org/npa 75
C7-00 with Symbian OS 9.5 Symbian^3, iPhone with OS 6_1_2, SonyEricsson with Android
2.3.7, Nokia C6 SymbOS with S60, LG-p700 with Android 4.0.3, a tablet Acer with Android
3.2.1 and a MacBook Pro with Mac OSX 10.6.8. They use private IP addresses. In Internet
there is a PC with a video streaming server. It allows us to measure the different features of
each device. All devices start to watch a video from the server at the same time and
meanwhile Wireshark [18] is used to sniff the network traffic for monitoring purposes.
Figure 1. Network Topology
3.1. QoS Parameters Experiment
This experiment let us measure the round trip time, delay and jitter of mobile and fixed
devices. Fig. 2, 4 and 6 show these parameters for the group of mobile devices and Fig. 3, 5
and 7 for the fixed devices.
As expected, these figures show that the time required for mobile devices to transmit and
receive packets from a network is higher than for fixed devices because their packets have to
cross the wireless network.
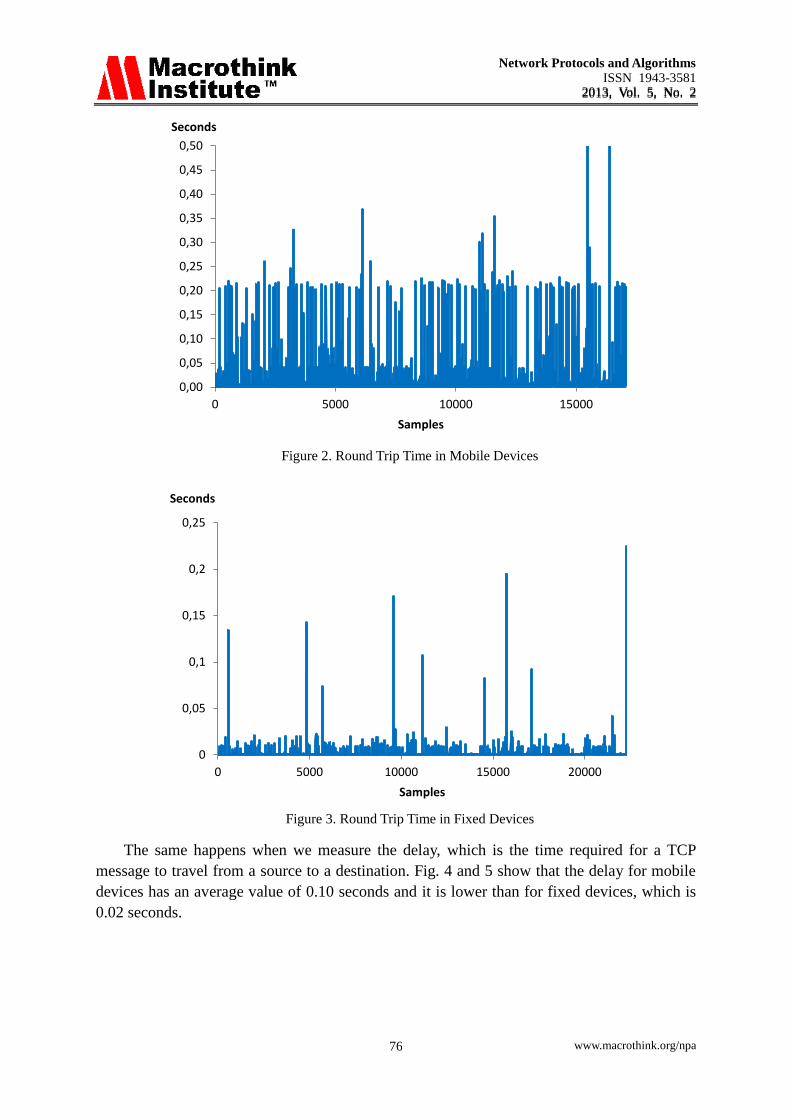
The round trip time is the time required to transmit one TCP packet from a source device
to a specific destination plus the time required for the acknowledgment to get back to the
source from the destination. Fig. 2 and 3 show this time for mobile and fixed devices
respectively. As we can see, the round trip time for fixed devices is almost zero, lower than
0.05 seconds, apart from some specific peaks; in contrast, this time has an average of 0.2
seconds for mobile devices.
Network Protocols and Algorithms
ISSN 1943-3581
2013, Vol. 5, No. 2 2013, Vol. 5, No. 2
www.macrothink.org/npa 76
Figure 2. Round Trip Time in Mobile Devices
Figure 3. Round Trip Time in Fixed Devices
The same happens when we measure the delay, which is the time required for a TCP
message to travel from a source to a destination. Fig. 4 and 5 show that the delay for mobile
devices has an average value of 0.10 seconds and it is lower than for fixed devices, which is
0.02 seconds.
0,00
0,05
0,10
0,15
0,20
0,25
0,30
0,35
0,40
0,45
0,50
0 5000 10000 15000
Seconds
Samples
0
0,05
0,1
0,15
0,2
0,25
0 5000 10000 15000 20000
Seconds
Samples

Network Protocols and Algorithms
ISSN 1943-3581
2013, Vol. 5, No. 2 2013, Vol. 5, No. 2
www.macrothink.org/npa 77
Figure 4. Delay in Mobile Devices
Figure 5. Delay in Fixed Devices
When we measured the jitter, which is the difference between the delay of two
consecutive packets, we also obtained different values. Fig. 6 shows that these values are 0.10
seconds in the most of cases for mobile devices and, in Fig. 7, it is shown that these values
are around zero for fixed devices.
0,00
0,05
0,10
0,15
0,20
0,25
0 5000 10000 15000
Seconds
Samples
0
0,02
0,04
0,06
0,08
0,1
0,12
0 5000 10000 15000 20000
Seconds
Samples

Network Protocols and Algorithms
ISSN 1943-3581
2013, Vol. 5, No. 2 2013, Vol. 5, No. 2
www.macrothink.org/npa 78
Figure 6. Jitter in Mobile Devices
Figure 7. Jitter in Fixed Devices
As expected, the throughput needed is also different for mobile and fixed devices. But, as
we can see in Fig. 8 and 9, this difference is not so significant in this case.
Fig. 8 and 9 show the overall packets and bytes transmitted by mobile and fixed devices
while they are watching the video received from the video server. As we can see the
throughput is a little bit higher for fixed devices than for mobile devices at the beginning of
the transmission. It makes sense because the bandwidth is usually greater in fixed devices.
However, it decreases slightly at the end of the transmission in fixed devices and it remains
similar during all the transmission in mobile devices.
-0,25
-0,2
-0,15
-0,1
-0,05
0
0,05
0,1
0,15
0,2
0,25
0 5000 10000 15000
Seconds
Samples
-0,1
-0,05
0
0,05
0,1
0,15
0 5000 10000 15000 20000
Seconds
Samples

Network Protocols and Algorithms
ISSN 1943-3581
2013, Vol. 5, No. 2 2013, Vol. 5, No. 2
www.macrothink.org/npa 79
Figure 8. Consumed throughput in packets per second
Figure 9. Consumed throughput in bytes per second
3.2. Application Layer Experiment
The goal of this experiment is to find differences at the application layer. We have found
that for the HTTP protocol, the user-agent field allows us to identify both the operating
system and the device. Moreover, we have found differences in the TTL, WS and OBS
variables. The presence of the DF bit determines that these messages are the first ones of the
communication.
0
500
1000
1500
2000
2500
3000
0 20 40 60 80 100
Packets
Time (seconds)
Packets_Fixed devices
Packets_Mobile devices
0
500000
1000000
1500000
2000000
2500000
3000000
0 20 40 60 80 100
Bytes
Time (seconds)
Bytes_Fixed devices
Bytes_Mobile devices

Network Protocols and Algorithms
ISSN 1943-3581
2013, Vol. 5, No. 2 2013, Vol. 5, No. 2
www.macrothink.org/npa 80
The following list shows the information obtained in the field user-agent for all tested
devices:
• SonyEricsson ST 25i: Mozilla/5.0 (Linux; U; Android 2.3.7; es-es; SonyEricssonST25i Build/6.0.B.1.564)
• iphone 5: com.google.ios.youtube/1.2.1.5201 (iPhone5,2; U; CPU iPhone OS 6_1_2 like Mac OS X; es_ES)
• Nokia C7: Mozilla/5.0 (Symbian/3; Series60/5.3 NokiaC7-00/111.030.0609; Profile/MIDP-2.1 Configuration/CLDC-1.1)
• Nokia C6: Opera/9.80 (S60; SymbOS; Opera Mobi/SYB-1204232254; U; es-ES)
• LG-P700: Mozilla/5.0 (Linux; U; Android 4.0.3; es-es; LG-P700 Build/IML74K)
• Macbook Pro: Mozilla/5.0 (Macintosh; Intel Mac OS X 10_6_8)
• Acer A500: Mozilla/5.0 (Linux; U; Android 3.2.1; es-es; A500 Build/HTK55D)
• PC (Windows XP): Mozilla/5.0 (Windows NT 5.1)
• PC (Linux Ubuntu 10.04): Mozilla/5.0 (X11; Linux x86_64)
Moreover, in our laboratory, after several experiments, we have confirmed that the three
variables used by R. Beverly in [12] to classify operating system have slight differences
depending on the device and the operating system that is being connected to Internet. Table 1
shows the obtained values for these variables.
Table 1. TTL, Window Size and Options Block Size Comparison.
Device (Operating System) TTL WS OBS
Smartphone (Nokia C6 Symbian S60) 69 64,980 12
Iphone (iOS 6) 64 8,192 12
Smartphone (Nokia C7 Symbian OS 9.5 Symbian^3) 69 12,227 12
Smartphone (LG-p700 Android 4.0) 64 229 12
Smartphone (SonyEricsson Android 2.3) 64 2,920 12
Tablet (Acer A500 Android 3.2) 64 1,004 12
PC (Windows XP) 128 65,535 0 / 8
PC (Linux Ubuntu 10.04) 64 501 12
MacBook Pro (OSX 10.6.8) 64 524,280 12
3.3. Transport Layer Experiment
The aim of this second experiment is to confirm that the values of TTL, WS and OBS are
independent of the used protocol. Using the same configuration shown in Fig. 1 we have
taken several messages from the nine devices using different protocols. In order to do this
experiment we have used Skype, Google Talk and Youtube.
We have observed the same values for TTL, WS and OBS (TTL=63, WS=524280 and
OBS=12). They are the same values than the ones used by Mac OSX 10.6 for HTTP protocol
(see Table 1).
Network Protocols and Algorithms
ISSN 1943-3581
2013, Vol. 5, No. 2 2013, Vol. 5, No. 2
www.macrothink.org/npa 81
In one of our experiments, we saw a TTL value of 68. We know from Table 1 that TTL =
69 represents Nokia smartphones. So, it is not possible to know the type of device only using
the TTL value, but it is possible comparing this value with the value in others messages in the
network. For example, in our experiments we were able to identify Nokia devices when there
are more messages from others devices (including fixed devices), because they have higher
TTL values.
Next, we performed some experiments in order to detect which device is used to watch a
video from Youtube. We observed that Youtube uses the HTTP protocol, for this reason the
values that we observe are the same than in Table 1.
We also obtained OBS=0, which indicates the absence of the options block. The values
of these variables are comparable with the values of a computer with Windows XP for HTTP
protocol (shown in Table 1).
3.4. Data Flow Experiment
Last experiments permit to identify the device only on the first message of the
communications. In this experiment we wanted to identify the device responsible of the data
flow in two senses. In order to perform it, we used the identification of the device to
determine the class of the device (Fixed device / Mobile device) and the sockets information
in the first message to make a 5-tuple (IP direction / port source, IP direction / port
destination, class) and we have stored this information on a connection tracking table.
4. Device Recognition System
Bearing in mind all performed experiments, we have developed a system that lets us
know which type of device is the origin of the traffic.
In order to achieve our goal we have designed and developed an intelligent system that is
able to classify and measure the TCP/IP messages that come from different mobile devices
and computers, by using the available information in the application and transport layers [19].
In this intelligent classifier, we use a neural network in order to take the most accurate results.
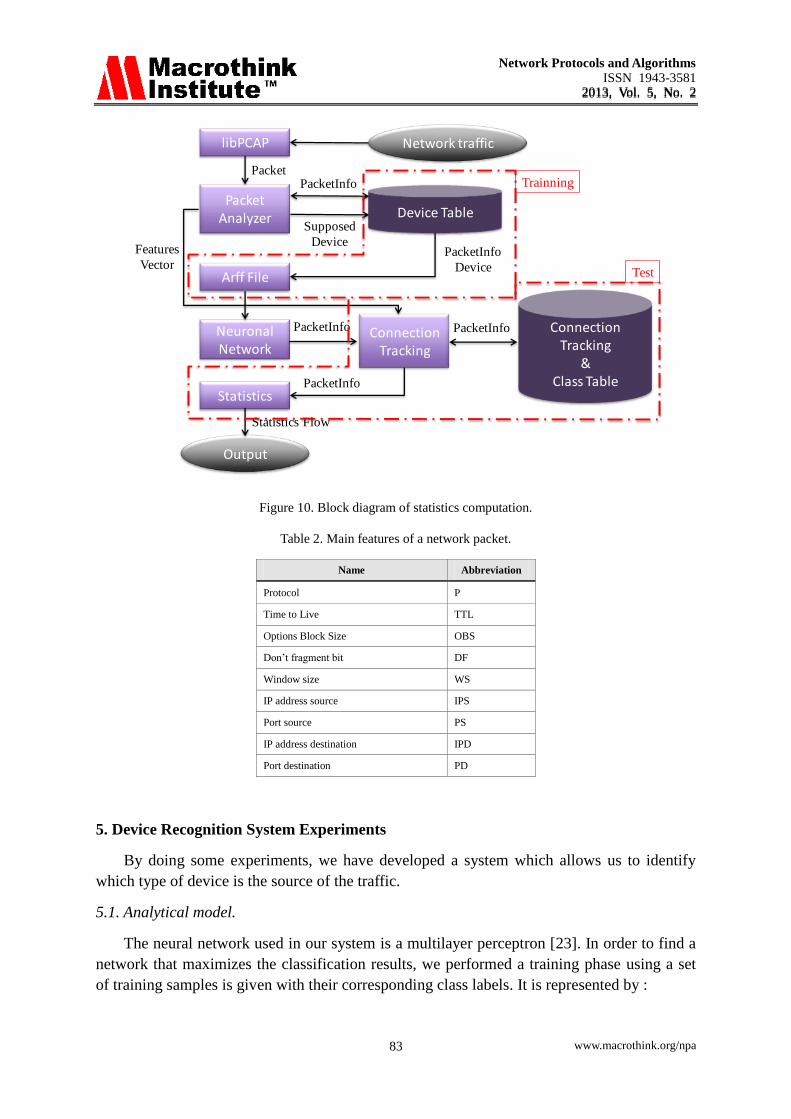
The block diagram structure is shown in Fig. 10. As we can see, our system is composed
by seven blocks:
• libPCAP: Monitor the network traffic and capture packets.
• Packet analyzer: Extracts the main features shown on Table 2 of the network packet.
• Neural Network: Estimates the device class for the packets containing don’t
fragment bit.
• Connection Tracking: Finite state machine with two states (Computer and Mobile
device) that uses the information on the connection tracking & class table as state transition
rules. This block sends the packet class to statistics block.

Network Protocols and Algorithms
ISSN 1943-3581
2013, Vol. 5, No. 2 2013, Vol. 5, No. 2
www.macrothink.org/npa 82
• Connection Tracking & Class Table: Table where the sockets communication
information and class is stored in a 5-tuple.
• Statistics: Count the amount of packets of each class in the net from the start of the system.
• Output: Shows statistics information to the user.
In other words, by using libPCAP [20], our system can read network packets. Then, these
packets are sent to the analyzer block. Next the analyzer block extracts the main features (see
Table 2) and builds features vectors. These features vectors are send to the neural network
block and to the connection-tracking block. Our neural network is able to recognize which
device is the origin of the communication by the first packet of this communication, but it is
not able to do it for the others packets. For this reason, it is necessary to work also with a
flow TCP basis [21]. The connection-tracking block is a finite state machine with two
possible states: computer and mobile device, which uses the information on the connection
tracking & class table as state transition rules. The flow information is represented by a
5-Tuple (IP address / port source, IP address / port destination, state), and the current state is
saved on the connection-tracking table. The statistics block is responsible for counting the
packets received from each class, and prepares the system output, which is the percentage of
each class.
The main features of the network packets needed to recognize the device class and to
monitor the traffic flow are shown on Table 2. The automatic labeling method used to label
the features vectors for the training of the neural network is shown in Fig. 10. This block
diagram is composed by:
• libCAP.
• Packet analyzer.
• Device Table.
• Output: Builds an arff file with the information on Device table to train the neural
network using Weka [22].
During the packet-labeling period, the set of packets captured by libCAP are examined
by the packet analyzer to build the set of main features vectors with the values of the TTL,
OBS and WS of the packets with the DF. Next, it labels features vectors according to the
value of the user-agent. This field has two classes: Computer and Mobile device.
All these vectors were collected in the device table and used to make the arff file to train
the neural network with Weka.
Network Protocols and Algorithms
ISSN 1943-3581
2013, Vol. 5, No. 2 2013, Vol. 5, No. 2
www.macrothink.org/npa 83
Figure 10. Block diagram of statistics computation.
Table 2. Main features of a network packet.
Name Abbreviation
Protocol P
Time to Live TTL
Options Block Size OBS
Don’t fragment bit DF
Window size WS
IP address source IPS
Port source PS
IP address destination IPD
Port destination PD
5. Device Recognition System Experiments
By doing some experiments, we have developed a system which allows us to identify
which type of device is the source of the traffic.
5.1. Analytical model.
The neural network used in our system is a multilayer perceptron [23]. In order to find a
network that maximizes the classification results, we performed a training phase using a set
of training samples is given with their corresponding class labels. It is represented by :
libPCAP
PacketAnalyzer
Neuronal Network
Statistics
ConnectionTracking
Arff File
Network traffic
Output
Device Table
PacketPacketInfo
Supposed
DevicePacketInfo
Device
PacketInfo PacketInfo ConnectionTracking
&Class TablePacketInfo
Statistics Flow
Trainning
Test
Features
Vector
Network Protocols and Algorithms
ISSN 1943-3581
2013, Vol. 5, No. 2 2013, Vol. 5, No. 2
www.macrothink.org/npa 84
(1)
Where,
are the training samples that will be used as inputs in our network
are the class labels
are the family class discriminant functions
The class labels are defined by:
(2)
Our aim is to find a probabilistic approach, where given an input sample, the network
will provide us the corresponding class, fulfilling .
The activation function used in our neural network to carry out the training phase is a
linear function. Therefore, it fulfills that:
(3)
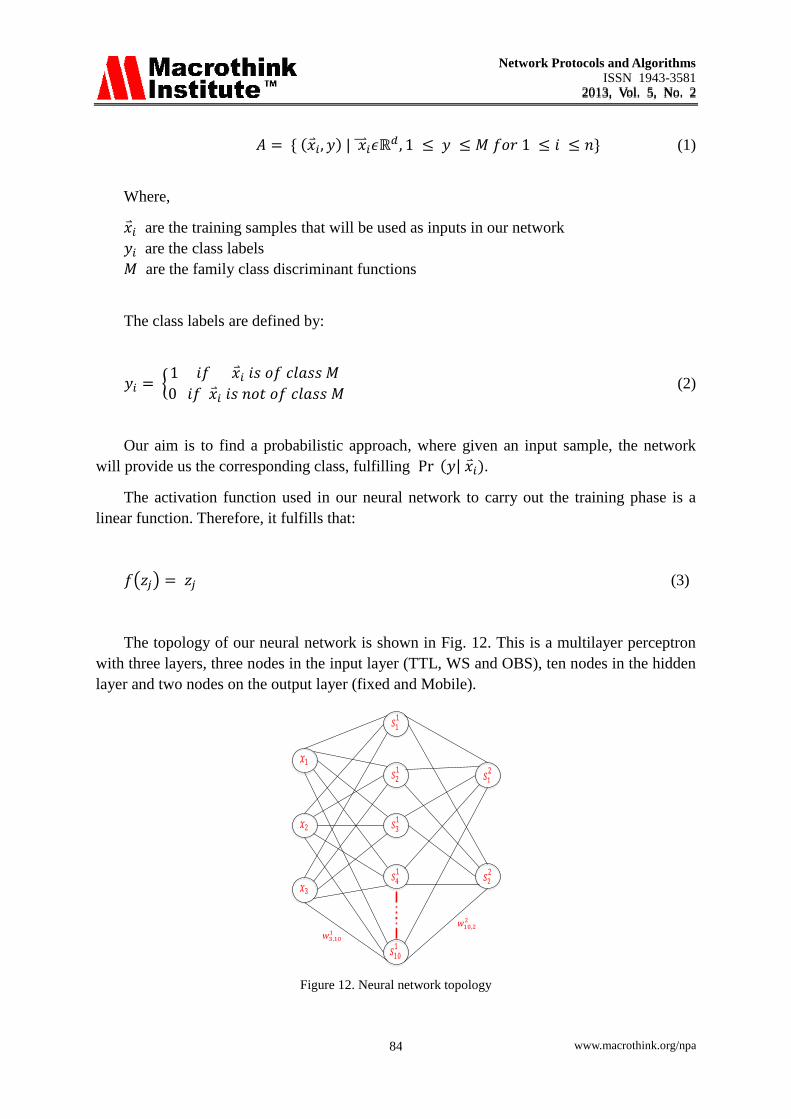
The topology of our neural network is shown in Fig. 12. This is a multilayer perceptron
with three layers, three nodes in the input layer (TTL, WS and OBS), ten nodes in the hidden
layer and two nodes on the output layer (fixed and Mobile).
Figure 12. Neural network topology

Network Protocols and Algorithms
ISSN 1943-3581
2013, Vol. 5, No. 2 2013, Vol. 5, No. 2
www.macrothink.org/npa 85
This topology is defined by , where,
are the set of input nodes,
are the rest of the nodes defined by discriminant functions,
are the connectors
are the weights of each connection
The algorithm procedure is shown in Fig. 13. For each input pattern, the system performs
a forward sweep to find the actual output. Then, it estimates the network error. If it is higher
than a threshold then it executes the backpropagation to determine weight changes and update
them.
Figure 13. Algorithm procedure.
The multilayer perceptron is defined by a combination of linear discriminant functions
grouped into two layers as it is given in:
(5)
Because the activation functions are linear, equation (4) can be expressed as:
(5)
Start
Are there
changes?
For each imput patern -> forward sweep
Yes
No
Do Backpropagation
Estimate network errors
Any networkerror is
higher thana threshold?
No
Update weights
Yes

Network Protocols and Algorithms
ISSN 1943-3581
2013, Vol. 5, No. 2 2013, Vol. 5, No. 2
www.macrothink.org/npa 86
The neurons of the hidden layer are between , where . The
neurons of the input layer are between , where , and the ones of the
output layer are between , where
Finally, we define the learning algorithm which minimizes the classification error.
Backpropagation has been the used algorithm. Therefore, given the topology of
the multilayer perceptron and the set , with
,
the objective is to find which minimizes the mean square error for n training
samples.
So, given the error in:
(6)
we minimize it by the descending gradient method:
(7)
In this algorithm, the update of the weights in both hidden and output layer, for all
training samples (n=40920), each iteration is defined by the sigmoidal function-common in
Multi Layer Perception (the sigmoidal function gives a value in range of 0 to 1):
1) In the output layer, for we have:
(8)
(9)
2) In the hidden layer, for we have:
(10)
(11)
Ideally, when it finds a global minimum, the function converges. It happens when
equation (12) happens.
(12)
So, if we arrive to this situation, the network will be overtraining. Therefore, in order to
avoid it, we have selected two criteria to stop the system, one based on the number of epochs

Network Protocols and Algorithms
ISSN 1943-3581
2013, Vol. 5, No. 2 2013, Vol. 5, No. 2
www.macrothink.org/npa 87
and another focused on the validation error.
To sum up, given an input conditions such as network topology, training set, learning
factor and convergence conditions and after performing the backpropagation algorithm, we
obtain the weights of the connections which minimizes the mean square error .
Because we have a balanced data model, we can take as a classification measurement the
accuracy defined in [24] by H. He and E. A. Garcia. However we will also take another error
value, which is the precision.
5.2. Test Bench
The process is divided into two parts. On the one hand the automatic labeling of samples
to perform the neural network training and on other hand the statistical calculation test.
In order to test the proposed system, we used the devices shown in Table 1 to generate
network traffic. After the automatic filtering and labeling we had a set of 14,429 samples of
packets from mobile devices, and 36,721 samples of packets from computers. We split it in
80% for training set and 20% for validation set. Table 3 contains the number of samples for
training and validation sets.
Table 3. Number of samples for training and validation sets.
Class Training set Validation set
Mobile device 11,543 2,886
Fixed device 29,377 7,344
We trained this multilayer perceptron using 10-folds cross validation. Based on the
confusion matrix shown in Table 4, we obtain the training results shown in equation (13) and
(14).
Table 4. General confusion matrix
Prediction/real Positive Negative
Positive VP FP
Negative FN VN
(13)
(14)
Finally, we have also taken into account the error obtained on the area under the ROC
(Relative Operating Characteristic) curve which has resulted in 91.3%. The ROC curve
Network Protocols and Algorithms
ISSN 1943-3581
2013, Vol. 5, No. 2 2013, Vol. 5, No. 2
www.macrothink.org/npa 88
analysis provides tools for selecting optimal models and possibly discards suboptimal models
irrespective of the cost of the distribution of the two classes is decided on. A random method
describes a ROC curve horizontally through the diagonal, with a value of 50%. The
classifiers at least should make the classification better than this, so far their performance is
related to the area under the ROC curve, the larger this area is the better the performance of
the classifier is.
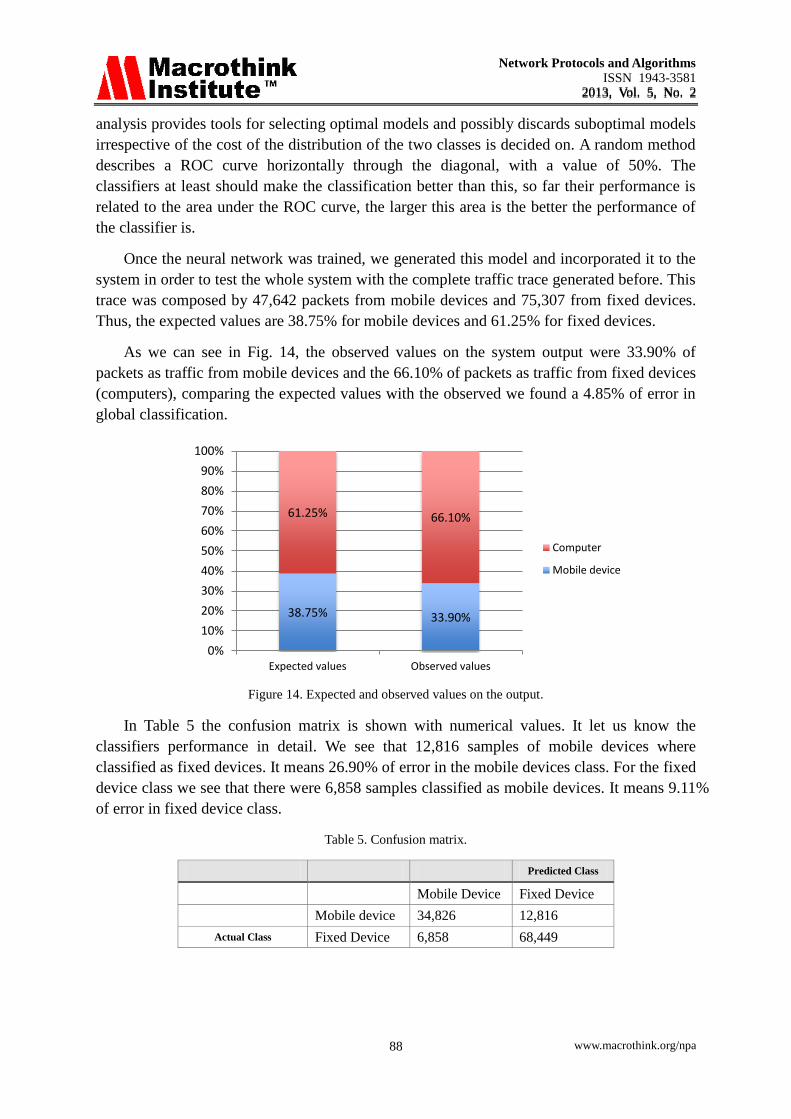
Once the neural network was trained, we generated this model and incorporated it to the
system in order to test the whole system with the complete traffic trace generated before. This
trace was composed by 47,642 packets from mobile devices and 75,307 from fixed devices.
Thus, the expected values are 38.75% for mobile devices and 61.25% for fixed devices.
As we can see in Fig. 14, the observed values on the system output were 33.90% of
packets as traffic from mobile devices and the 66.10% of packets as traffic from fixed devices
(computers), comparing the expected values with the observed we found a 4.85% of error in
global classification.
Figure 14. Expected and observed values on the output.
In Table 5 the confusion matrix is shown with numerical values. It let us know the
classifiers performance in detail. We see that 12,816 samples of mobile devices where
classified as fixed devices. It means 26.90% of error in the mobile devices class. For the fixed
device class we see that there were 6,858 samples classified as mobile devices. It means 9.11%
of error in fixed device class.
Table 5. Confusion matrix.
Predicted Class
Mobile Device Fixed Device
Mobile device 34,826 12,816
Actual Class Fixed Device 6,858 68,449
38.75% 33.90%
61.25% 66.10%
0%
10%
20%
30%
40%
50%
60%
70%
80%
90%
100%
Expected values Observed values
Computer
Mobile device

Network Protocols and Algorithms
ISSN 1943-3581
2013, Vol. 5, No. 2 2013, Vol. 5, No. 2
www.macrothink.org/npa 89
6. Conclusion
In this paper we have presented an intelligent system to detect the type of the device
generating Internet traffic in the data network of the Internet Service Provider. The neural
network used in our system is a multilayer perceptron. We have concluded that it is possible
to recognize the type of devices behind of a router using Network Address Translation by
monitoring small variations in certain variables. These variations generate patterns based on
the operating system, which can be easily recognized by an intelligent system. The success of
our implemented system demonstrates it.
In future works we will include in our system a reinforcement-learning block. This new
block will be able to learn by the use, and will reduce the error in classification, especially in
mobile devices class.
References
[1] M. Zhang, W. John, K. Claffy, and N. Brownlee, “State of the art in traffic classification:
A research review,” Passive and Acctive Measurement Conference, Seoul, South Korea, April
1-3, 2009.
[2] T.T.T. Nguyen and G. Armitage, "A survey of techniques for internet traffic classification
using machine learning," IEEE Communications Surveys & Tutorials, vol. 10, no. 4, pp.
56-76, 2008. http://dx.doi.org/10.1109/SURV.2008.080406
[3] D. Zuev and A. W. Moore, “Traffic Classification Using a Statistical Approach,” 6th
international conference on Passive and Active Network Measurement (PAM'05), Boston,
MA, USA, March 31-April 1, 2005. http://dx.doi.org/10.1007/978-3-540-31966-5_25
[4] M. Crotti, M. Dusi, F. Gringoli, and L. Salgarelli, “Traffic Classification through Simple
Statistical Fingerprinting,” ACM SIGCOMM Computer Communication Review. vol. 37,
Issue 1, pp. 5-16, January 2007. http://dx.doi.org/10.1145/1198255.1198257
[5] D. Moore, K. Keys, R. Koga, E. Lagache, and K. C. Claffy, “The CoralReef Software
Suite as a Tool for System and Network Administrators,” 15th USENIX conference on
Systems Administration (LISA’01), San Diego, CA, USA, December 2001.
[6] J. Erman, M. Arlitt, and A. Mahanti, “Traffic Classification Using Clustering Algorithms,”
Special Interest Group on Data Communication Conference (SIGCOMM’06), Pisa, Italy,
September 11-15, 2006. http://dx.doi.org/10.1145/1162678.1162679
[7] A. W. Moore and D. Zuev, “Internet Traffc Classification Using Bayesian Analysis
Techniques,” the 2005 ACM SIGMETRICS international conference on Measurement and
modeling of computer systems (SIGMETRICS’05), Banff, AB, Canada, June 06 - 10, 2005.
http://dx.doi.org/10.1145/1071690.1064220
[8] T. Karagiannis, A. Broido, N. Brownlee, K.C. Claffy, and M. Faloutsos, "Is P2P dying or
just hiding? [P2P traffic measurement]," IEEE Global Telecommunications Conference

Network Protocols and Algorithms
ISSN 1943-3581
2013, Vol. 5, No. 2 2013, Vol. 5, No. 2
www.macrothink.org/npa 90
(GLOBECOM '04), Dallas, Texas, November 29-December 3.
http://dx.doi.org/10.1109/GLOCOM.2004.1378239
[9] T. Karagiannis, K. Papagiannaki, and M. Faloutsos, “BLINC: Multilevel Traffic
Classification in the Dark,” Special Interest Group on Data Communication Conference
(SIGCOMM’05), Philadelphia, Pennsylvania, USA, August 22–26, 2005.
http://dx.doi.org/10.1145/1080091.1080119
[10] Yahoo! and The Nielsen Company, “The Mobile Shopping Framework Study: The Role
of Mobile Devices in the Shopping Process,” White paper, January 2011.
http://advertising.yahoo.com/article/the-role-of-mobile-devices-in-shopping-process.html
(Last Access, June 2013)
[11] Douglas E. Comer and John C. Lin, “Probing TCP implementations”, USENIX Summer
1994 Technical Conference, Boston, USA, June 6-10, 1994.
[12] R. Beverly, “A robust classifier for passive TCP/IP fingerprinting,” Passive and Active
Network Measurement, Lecture Notes on Computer Science, vol. 3015, pp. 158–167, 2004.
http://dx.doi.org/10.1007/978-3-540-24668-8_16
[13] Emilio Granell, Diana Bri, Jesus Tomas and Jaime Lloret, Smart Devices Fingerprint
Detection, IEEE Global Communications Conference (IEEE Globecom 2012), Anaheim,
California, USA, December 3 – 7, 2012.
http://dx.doi.org/10.1109/GLOCOMW.2012.6477587
[14] E. Hjelmvik and W. John, “Statistical protocol identification with spid: Preliminary
results,” Swedish National Computer Networking Workshop (SNCNW'09), Uppsala, Sweden,
May 4-5, 2009
[15] Saumil Shah, An Introduction to HTTP fingerprinting, Net-Square Solutions, 19th May,
2004. Available at: http://www.net-square.com/httprint_paper.html (Last Access, June 2013)
[16] P. Eckersley, “How unique is your web browser?,” 10th international conference on
Privacy enhancing technologies (PETS’10), Berlin, Germany, July 21–23, 2010
[17] J. Oshio, S. Ata, and I. Oka, “Identification of different TCP versions based on cluster
analysis,” IEEE 18th International Conference on Computer Communications and Networks
(ICCCN 2009), San Francisco, CA, August 3-6, 2009.
http://dx.doi.org/10.1109/ICCCN.2009.5235248
[18] Wireshark (2012) http://www.wireshark.org/ (Last Access, June 2013)
[19] M. Crotti, M. Dusi, A. Este, F. Gringoli, and L. Salgarelli, “Application Protocol
Fingerprinting for Traffic Classification,” GTTI Riunione Annuale 2007, Roma, Italia, June
18-20, 2007.
[20] TCPDUMP & libPCAP (2010) http://www.tcpdump.org/ (Last Access, June 2013)
[21] T.A. Beardsley and J. Qian, “The TCP Split Handshake: Practical Effects on Modern
Network Equipment,” Network Protocols and Algorithms, vol. 2, no. 1, pp. 197-217, 2010.

Network Protocols and Algorithms
ISSN 1943-3581
2013, Vol. 5, No. 2 2013, Vol. 5, No. 2
www.macrothink.org/npa 91
http://dx.doi.org/10.5296/npa.v2i1.285
[22] Weka. Available at: http://www.cs.waikato.ac.nz/ml/weka/ (Last Access, June 2013)
[23] Christopher M. Bishop, Neural Networks for Pattern Recognition, Oxford University
Press (1995). ISBN 0-19-853864-2 (Paperback).
[24] Haibo He and Edwardo A. Garcia, Learning from Imbalanced Data, Journal IEEE
Transactions on Knowledge and Data Engineering, Volume 21 Issue 9, September 2009. Pp.
1263-1284. http://dx.doi.org/10.1109/TKDE.2008.239
Copyright Disclaimer
Copyright reserved by the author(s).
This article is an open-access article distributed under the terms and conditions of the
Creative Commons Attribution license (http://creativecommons.org/licenses/by/3.0/).