an improved channel estimation technique for ieee 802.11p
TRANSCRIPT

sensors
Article
An Improved Channel Estimation Technique for IEEE802.11p Standard in Vehicular Communications
Tong Wang 1 , Azhar Hussain 1,* , Yue Cao 2,* , and Sangirov Gulomjon 3
1 College of Information and Communication Engineering, Harbin Engineering University,Harbin 150001, China; [email protected]
2 Department of Computer and Information Sciences, Northumbria University,Newcastle upon Tyne NE1 8ST, UK
3 Nokia Shanghai Bell Innovative Park, Hangzhou 310014, China; [email protected]* Correspondence: [email protected] (A.H.); [email protected] (Y.C.)
Received: 4 November 2018; Accepted: 21 December 2018; Published: 28 December 2018 �����������������
Abstract: IEEE 802.11p based Dedicated Short-Range Communication (DSRC) is considered apotential wireless technology to enable transportation safety and traffic efficiency. A major challengein the development of IEEE 802.11p technology is ensuring communication reliability in highlydynamic Vehicle-to-Vehicle (V2V) environments. The design of IEEE 802.11p does not have a sufficientnumber of training symbols in the time domain and pilot carriers in the frequency domain to enableaccurate estimation of rapidly varying V2V channels. The channel estimation of IEEE 802.11p ispreamble based, which cannot guarantee a suitable equalization in urban and highway scenarios,especially for longer length data packets. This limitation has been investigated by some researchworks, which suggest that one major challenge is determining an accurate means of updating channelestimate over the course of packet length while adhering to the standard. The motivation behind thisarticle is to overcome this challenge. We have proposed an improved Constructed Data Pilot (iCDP)scheme which adheres to the standard and constructs data pilots by considering the correlationcharacteristics between adjacent data symbols in time domain and adjacent subcarriers in frequencydomain. It is in contrast to previous schemes which considered the correlation in the time domain.The results have shown that the proposed scheme performs better than previous schemes in terms ofbit error rate (BER) and root-mean-square error (RMSE).
Keywords: IEEE 802.11p; Vehicular Networks; Intelligent Transportation Systems; constructed datapilots; vehicle-to-vehicle
1. Introduction
Dedicated Short-Range Communication (DSRC) is considered a promising short-range wirelesscommunication standard for vehicular communications [1]. Among other benefits, DSRC can providecooperative driving-safety using Vehicle-to-Vehicle (V2V) communication. Various DSRC applicationsinclude: Cooperative forward collision warning [2], impending road hazards, an upcoming trafficjam, assistance in adverse weather, blind spot warning, traffic light optimal speed advisory, andremote wireless diagnosis [3]. However, ensuring communication reliability is very important forthese mission-critical applications under highly dynamic V2V communication channels. The physical(PHY) layer design of DSRC system is inherited from the IEEE 802.11a standard, by reducing the signalbandwidth from 20 MHz to 10 MHz and operating frequency to 5.9 GHz. The main reason behind thisinheritance is to reduce the manufacturing cost of the DSRC devices by making slight changes in the802.11a based systems, which are readily available in market.
Sensors 2019, 19, 98; doi:10.3390/s19010098 www.mdpi.com/journal/sensors

Sensors 2019, 19, 98 2 of 22
The 802.11a standard was originally developed for relatively stationary indoor environments.However, V2V wireless channel is extremely challenging for signal propagation due to: (1 Vehicularmobility which leads to a short channel coherence time and (2 the presence of mobile and stationaryscatterers e.g., other vehicles and buildings, which results in a narrow coherence bandwidth. Recentchannel sounding measurements have indicated that the coherence bandwidth is about 410 to820 KHz and coherence time is about 0.3 to 1.0 ms in V2V channels, which are in direct contrastto the static indoor environments (a coherence time of 25 ms and coherence bandwidth of 1 to3 MHz) [4]. The performance of the IEEE 802.11p system would significantly suffer due to degradationof transmitted signal waveforms in V2V environments. As a well-known fact, channel estimationplays a vital role in the design of any wireless communication system. A precisely estimated channelresponse (CR) is critical for the follow-up equalization, demodulation, and decoding [5]. Generally, theaccuracy of channel estimation decides the reliability of wireless communication system. Therefore, inthe V2V environment, the primary challenge is to determine accurate means of updating the channelestimate over the course of a packet length while adhering to the standard.
Besides IEEE 802.11p, the millimeter-wave communication standard IEEE 802.11ad is alsoemerging as a preferred near-field communication system for V2V. IEEE 802.11ad is centered atthe 60 GHz radio frequency band and provides transmission bandwidth that is several GHz wide.The receivers designed to process IEEE 802.11ad waveforms employ very high rate analog-to-digitalconverters, and thus reducing the receiver sampling rate is useful. In a state-of-the-art channelestimation scheme [6], the authors have mitigated the problem of low-rate channel estimation inIEEE 802.11ad by harnessing sparsity in the channel impulse response. They investigated recoveryperformance through RMSE between the actual and estimated channel. The decrease in RMSE resultsin a performance improvement at the PHY layer. The effect of this improvement traverses its way upto the vehicular communication stack [7], and leads to a better network performance.
Recently, two approaches of channel estimation have been investigated for the IEEE 802.11p.The first approach demands modification in the structure of the IEEE 802.11p [8–13], while the secondapproach does not require such modification [1,5,13–16]. In the IEEE 802.11p, channel estimation isperformed by transmitting two predefined Long Training Symbols (LTSs) at the beginning of eachpacket. The channel is then estimated once for each packet, and this estimate is used to equalize theentire packet. IEEE 802.11p does not restrict the packet length. A channel estimate can quickly becomeless reliable for longer packets in V2V communications. Moreover, the IEEE 802.11p only allows theuse of four pilot subcarriers (intended for residual frequency offset correction). These pilot subcarriersare not spaced closely enough to sample the variations of the channel in the frequency domain, whichalso contributes to performance degradation in V2V communications.
The main motivation behind the proposed scheme is to track the channel variations in time andfrequency domain. In [5], authors have investigated that channel estimation in the IEEE 802.11pstandard can be improved by exploiting the correlation characteristics between the adjacent symbols ofthe orthogonal frequency-division multiplexing (OFDM) based data packet via constructing data pilotsin the time domain. In this article, we have investigated that the adjacent subcarriers also have strongcorrelation characteristics in a data packet. We have employed these correlation characteristics in timeand frequency domain to construct the reference data pilots for the channel estimation. In this way,an improved channel equalization can be achieved with a little complexity. The main contributions ofthis paper are listed here:
• We have proposed an end-to-end channel estimation and equalization scheme for the IEEE 802.11pstandard. It does not require modifications in the structure of the standard and keeps a balancebetween computational complexity and BER performance of the overall system.
• In the channel estimation process, we have also utilized the correlation characteristics betweenadjacent subcarriers in the frequency domain, as well as between adjacent OFDM symbols intime domain.

Sensors 2019, 19, 98 3 of 22
• The simulation results have demonstrated the performance improvement over CDP and spatialtemporal-averaging (STA) schemes for V2V communications.
• We have also presented an intuitive visualization of the V2V channel model which is used in theevaluation of the proposed scheme.
The paper is organized as follows. Section 2 describes the current system model of the IEEE802.11p transmitter and the channel. Section 3 gives an overview of the current channel estimationschemes for the IEEE 802.11p. Section 4 briefly describes the receiver and the integration of theproposed scheme. Section 5 presents the simulation results and analysis of the proposed iCDP andSection 6 discusses two important issues along with future work suggestions. Finally, Section 7 drawsthe main conclusions derived from this work.
2. System Model of the IEEE 802.11p
2.1. OFDM Frame of IEEE 802.11p
Figure 1 shows the structure of an OFDM frame of the IEEE 802.11p. The IEEE 802.11p physicallayer is nearly the same as IEEE 802.11a. The symbol duration in 802.11p is twice that of 802.11a.The data carried by the closely spaced orthogonal frequency subcarriers helps in improving thespectrum efficiency under harsh conditions of the vehicular data transmission channel. It can supportvarious data rates from 3 to 27 Mbps depending on different modulation and coding schemes,as summarized in Table 1. The Fast Fourier Transform (FFT) size is of 64 points. The packet startswith a preamble that includes Short Training Symbols (STSs) and LTSs, the Signal Field, and the DataSection. The ”Signal Field” provides information related to the type of modulation, coding rate, etc.The Data Section contains information about the transmitted data.
Nu
ll sub
carrier
14
sub
carriers sp
acing
OFDM symbol duration = 8µs Two LTS Signal Field Two STS
Fou
r P
has
e tr
acki
ng
pilo
ts
Time
Freq
uen
cy
OFD
M fram
e heigh
t in term
s of freq
uen
cy = 10
MH
z
16µs 16µs 8µs
OFDM Data Section
Figure 1. Orthogonal frequency division multiplexing (OFDM) frame format of the IEEE 802.11p.

Sensors 2019, 19, 98 4 of 22
Coarse synchronization is achieved by the ten STSs which are placed at the beginning of eachpacket. The two LTSs that follow Guard Interval (GI) of STSs are used for the channel estimation andfine synchronization. The GI is placed at this location to cope with the InterSymbol Interference ISI.The Signal Section has only one OFDM symbol. There is no specific limit on the number of OFDMsymbols in the Data Section. The block diagram of the IEEE 802.11p transmitter model is shown inFigure 2.
Table 1. IEEE 802.11p standard parameters.
Parameter Values
FFT size 64FFT period 6.4 µs
Symbol duration 8.0 µsGI duration 1.6 µs
Total subcarriers 52Pilot subcarriers 4Data subcarriers 48
Code Rate 1/2, 2/3, 3/4Modulation Schemes BPSK, QPSK, 16QAM, 64QAM
Bit Rate 3, 4.5, 6, 9, 12, 18, 24, 27Frequency spacing of subcarriers 156.25 KHz
Error correction coding k = 7 (64 states) convolution codeBandwidth 10 MHz
2.2. Transmitter Model
The transmitter consists of a convolutional encoder for the forward error correction, a puncturingmodule for higher data rates, the interleaver to oppose burst errors. Then a modulation module isadded for the selection of different schemes. The 4 phase tracking pilots are inserted to the 48 datasubcarriers in the pilot insertion module. These phase tracking pilots help in nullifying the phaserotations that are caused by the frequency offsets. Additionally, a total of 11 subcarriers and a nullsubcarrier is also added to complete a set of 64 subcarriers. After that, an Inverse FFT (IFFT) module isplaced to transform the data to the time domain and then a GI and preamble modules are placed tomake packet ready for transmission.
Convolutional Coding Section
PSDU
Pucturing Section
Interleaving Section
Modulation Section
Pilots Insertion Section
IFFT
Appending GI
Appending Preamble
802.11p Packet Waveform Generation Transmission to Channel
Figure 2. Transmitter block diagram of IEEE 802.11p.
2.3. Channel Model
Recently, the V2V channel model characteristics have been explored in the literature [17–28].Table 2 summarizes different characteristics of the seven realistic channel models [25,28] of vehicularcommunication environments. A classical Tapped Delay Line (TDL) channel model, namely, widestationary uncorrelated scattering (WSSUS), was proposed by [29]. Another closely related channelmodel is known as non-WSSUS, which is proposed by [25]. These models are accepted as standardchannel model for the IEEE 802.11p based systems. These realistic channel models were obtainedthrough a channel measurement campaign which was performed in the metropolitan Atlanta, Georgia,USA. The campaign consisted of six different scenarios. The V2V or (VTV) Expressway Oncoming,the VTV Urban Canyon Oncoming, Roadside To the Vehicle (RTV) Suburban street, the RTV Expressway,the VTV Expressway Same Direction With Wall (SDWW), and the RTV Urban Canyon.

Sensors 2019, 19, 98 5 of 22
Further experiments were done by the European Telecommunications Standards Institute (ETSI)and a comprehensive vehicular channel model was formulated [28]. This channel model is known asHIgh PERformance radio Local Area Network (HIPERLAN)/2 and it is also available in Matlab 2016version. This model has a delay profile called Model-E, that represents Non-Line-Of-Sight (NLOS)conditions with an average delay spread of 250 ns. In CDP scheme, the time-variant characteristics ofchannel models [25] have been employed, however its impact on the overall OFDM performance dueto intercarrier interference under HIPERLAN/2 SISO fading channel model [28] still needs furtherinvestigations. We have investigated this severe channel model for the proposed channel estimation.We have also tested the proposed scheme for the VTV Express oncoming channel model as shown inTable 2. The time and frequency variations have been analyzed in the paper. We will use a short-termHIPERLAN-E for the HIPERLAN/2 Model-E channel model in this article.
Table 2. Characteristics of the vehicular channel models.
Channel Model Doppler Shift(Hz)
Multipaths Velocity(km/h)
Average Path Gains (dB) Path Delays (ns)
VTV Express Oncoming 1000–1200 11 104 [0, 0, 0,−6.3,−6.3,−25.1,−25.1,−25.1,−22.7,−22.7,−22.7]
[0, 1, 2, 100, 101, 200,201, 202, 300, 301, 302]
RTV Expressway 600–700 12 104 [0, 0, 0, −9.3, −9.3, −9.3,−20.3, −20.3, −21.3, −21.3,−28.8, −28.8]
[0, 1, 2, 100, 101, 102,200, 201, 300, 301,400, 401]
VTV Express SDWW 900–1150 12 104 [0, 0, −11.2, −11.2, −19, −21.9,−25.3, −25.3, −24.4, −28.0,−26.1, −26.1]
[0, 1, 100, 101, 200,300, 400, 401, 500, 600,700, 701]
RTV Urban Canyon 300 12 32–48 [0, 0, 0, −11.5, −11.5, −11.5,−19.0, −19.0, −25.6, −25.6,−28.1, −28.1]
[0, 1, 2, 100, 101, 102,200, 201, 300, 301,500, 501]
RTV Suburban street 300–500 12 32–48 [0, 0, −9.3, −9.3, −14, −14,−18, −18, −19.4, −24.9,−27.5, −29.8]
[0, 1, 100, 101, 200,201, 300, 301, 400, 500,600, 700]
VTV Urban Canyon Oncoming 400–500 12 32–48 [0, 0, −10, −10, −10, −17.8,−17.8, −17.8, −21.1, −21.1,−26.3, −26.3]
[0, 1, 100, 101, 102,200, 201, 202, 300, 301,400, 401]
HIPERLAN−E 1000–1200 18 109.83 [−4.9, −5.1, −5.2, −0.8, −1.3,−1.9, −0.3, −1.2, −2.1, 0.0,−1.9, −2.8, −5.4, −7.3, −10.6,−13.4, −17.4, −20.9]
[0, 10, 20, 40, 70, 100,140, 190, 240, 320, 430,560, 710, 880, 1070,1280, 1510, 1760]
3. Overview of Current Channel Estimation Schemes
Recently, a number of channel estimation schemes have been devised for the IEEE 802.11p.The pilot symbols placement in the time-frequency plane is very important for the estimation ofthe channel. However, the placement of pilots in the current IEEE 802.11p standard appears to beinsufficient for tracking under the rapid motion of vehicles. One of the main reasons is that the twoLTSs cannot provide enough information in the frequency domain. Two kinds of channel estimationscenarios are discussed in the literature. The first scenario demands modification in the IEEE 802.11pstandard and the second scenario does not require such modification. The IEEE 802.11a chips are lowcost and readily available in the market. These chips can be modified in a cost-efficient way if wefollow the second kind of scenario.
3.1. Scenario 1: Modification in IEEE 802.11p
3.1.1. The Midamble Based Channel Estimation Scheme (MBCE)
This work was proposed in [10,11] to mitigate the effects of time-varying channels. The midamblepilots are placed periodically in the data symbols. If the number of these midamble sequences issufficient, then there is no limit on the length of Data section. At first, the channel estimation isperformed based on the two LTS, and then the estimated channel response is used to equalize the nextdata symbols. Afterward, the midamble pilots are used to update and track the channel, using the
Sensors 2019, 19, 98 6 of 22
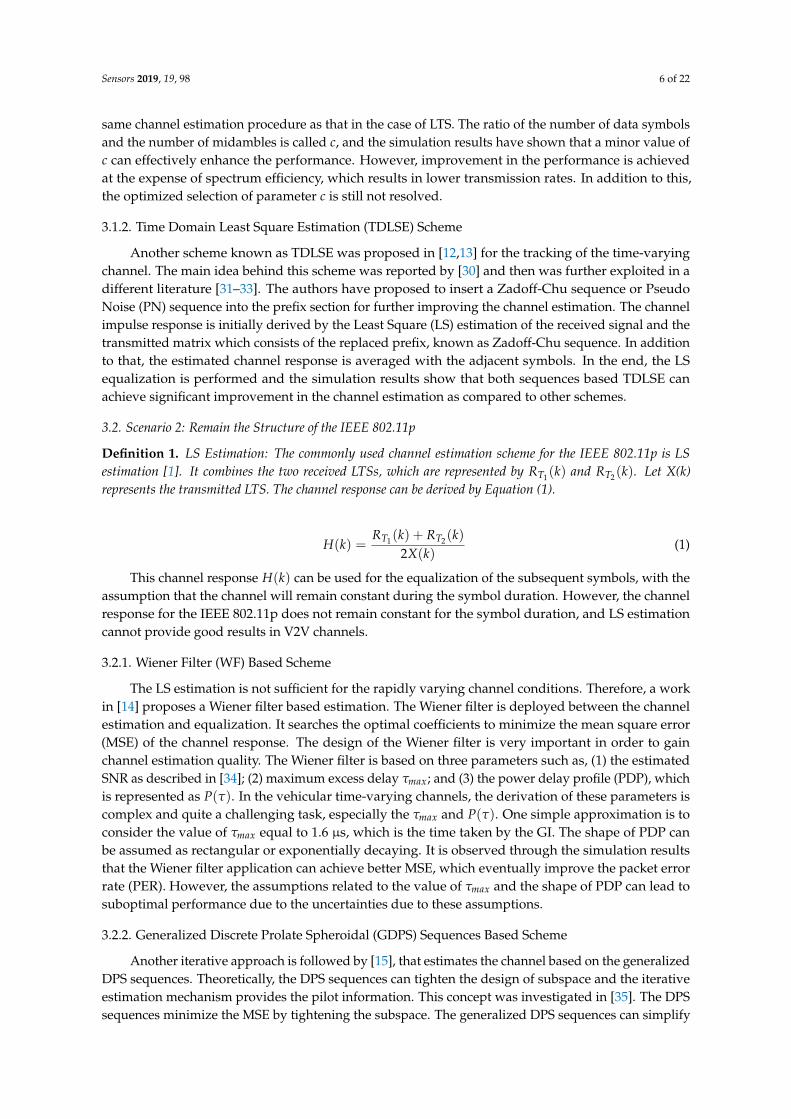
same channel estimation procedure as that in the case of LTS. The ratio of the number of data symbolsand the number of midambles is called c, and the simulation results have shown that a minor value ofc can effectively enhance the performance. However, improvement in the performance is achievedat the expense of spectrum efficiency, which results in lower transmission rates. In addition to this,the optimized selection of parameter c is still not resolved.
3.1.2. Time Domain Least Square Estimation (TDLSE) Scheme
Another scheme known as TDLSE was proposed in [12,13] for the tracking of the time-varyingchannel. The main idea behind this scheme was reported by [30] and then was further exploited in adifferent literature [31–33]. The authors have proposed to insert a Zadoff-Chu sequence or PseudoNoise (PN) sequence into the prefix section for further improving the channel estimation. The channelimpulse response is initially derived by the Least Square (LS) estimation of the received signal and thetransmitted matrix which consists of the replaced prefix, known as Zadoff-Chu sequence. In additionto that, the estimated channel response is averaged with the adjacent symbols. In the end, the LSequalization is performed and the simulation results show that both sequences based TDLSE canachieve significant improvement in the channel estimation as compared to other schemes.
3.2. Scenario 2: Remain the Structure of the IEEE 802.11p
Definition 1. LS Estimation: The commonly used channel estimation scheme for the IEEE 802.11p is LSestimation [1]. It combines the two received LTSs, which are represented by RT1(k) and RT2(k). Let X(k)represents the transmitted LTS. The channel response can be derived by Equation (1).
H(k) =RT1(k) + RT2(k)
2X(k)(1)
This channel response H(k) can be used for the equalization of the subsequent symbols, with theassumption that the channel will remain constant during the symbol duration. However, the channelresponse for the IEEE 802.11p does not remain constant for the symbol duration, and LS estimationcannot provide good results in V2V channels.
3.2.1. Wiener Filter (WF) Based Scheme
The LS estimation is not sufficient for the rapidly varying channel conditions. Therefore, a workin [14] proposes a Wiener filter based estimation. The Wiener filter is deployed between the channelestimation and equalization. It searches the optimal coefficients to minimize the mean square error(MSE) of the channel response. The design of the Wiener filter is very important in order to gainchannel estimation quality. The Wiener filter is based on three parameters such as, (1) the estimatedSNR as described in [34]; (2) maximum excess delay τmax; and (3) the power delay profile (PDP), whichis represented as P(τ). In the vehicular time-varying channels, the derivation of these parameters iscomplex and quite a challenging task, especially the τmax and P(τ). One simple approximation is toconsider the value of τmax equal to 1.6 µs, which is the time taken by the GI. The shape of PDP canbe assumed as rectangular or exponentially decaying. It is observed through the simulation resultsthat the Wiener filter application can achieve better MSE, which eventually improve the packet errorrate (PER). However, the assumptions related to the value of τmax and the shape of PDP can lead tosuboptimal performance due to the uncertainties due to these assumptions.
3.2.2. Generalized Discrete Prolate Spheroidal (GDPS) Sequences Based Scheme
Another iterative approach is followed by [15], that estimates the channel based on the generalizedDPS sequences. Theoretically, the DPS sequences can tighten the design of subspace and the iterativeestimation mechanism provides the pilot information. This concept was investigated in [35]. The DPSsequences minimize the MSE by tightening the subspace. The generalized DPS sequences can simplify
Sensors 2019, 19, 98 7 of 22
the channel estimation and it only requires DSP coefficients. The iterative algorithm requires highercomputational complexity and in order to deal with such problem, an enhanced pilot symbol patternwas proposed as well in [35]. The overall kernel is postamble appended after the Data section. However,such reduction in computational complexity will lead to a decrease in the efficiency and incompatibilitywith the standard.
3.2.3. Spectral-Temporal Averaging (STA) Based Scheme
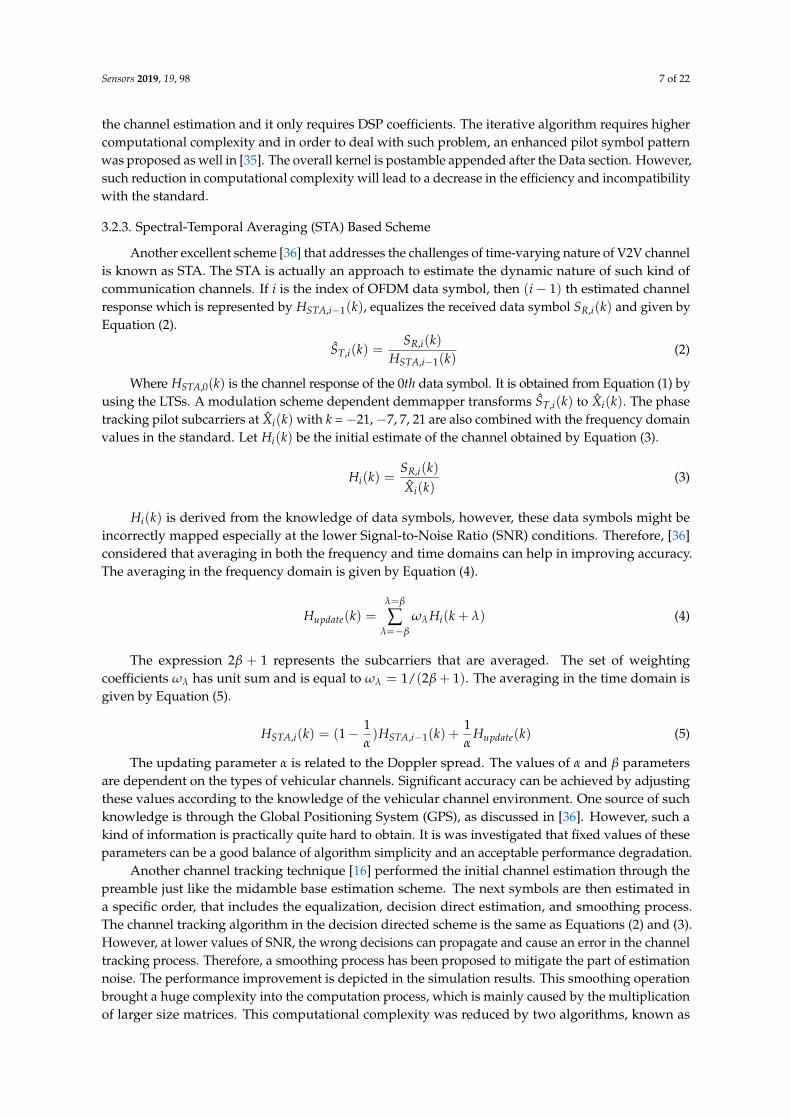
Another excellent scheme [36] that addresses the challenges of time-varying nature of V2V channelis known as STA. The STA is actually an approach to estimate the dynamic nature of such kind ofcommunication channels. If i is the index of OFDM data symbol, then (i− 1) th estimated channelresponse which is represented by HSTA,i−1(k), equalizes the received data symbol SR,i(k) and given byEquation (2).
ST,i(k) =SR,i(k)
HSTA,i−1(k)(2)
Where HSTA,0(k) is the channel response of the 0th data symbol. It is obtained from Equation (1) byusing the LTSs. A modulation scheme dependent demmapper transforms ST,i(k) to Xi(k). The phasetracking pilot subcarriers at Xi(k) with k =−21,−7, 7, 21 are also combined with the frequency domainvalues in the standard. Let Hi(k) be the initial estimate of the channel obtained by Equation (3).
Hi(k) =SR,i(k)Xi(k)
(3)
Hi(k) is derived from the knowledge of data symbols, however, these data symbols might beincorrectly mapped especially at the lower Signal-to-Noise Ratio (SNR) conditions. Therefore, [36]considered that averaging in both the frequency and time domains can help in improving accuracy.The averaging in the frequency domain is given by Equation (4).
Hupdate(k) =λ=β
∑λ=−β
ωλ Hi(k + λ) (4)
The expression 2β + 1 represents the subcarriers that are averaged. The set of weightingcoefficients ωλ has unit sum and is equal to ωλ = 1/(2β + 1). The averaging in the time domain isgiven by Equation (5).
HSTA,i(k) = (1− 1α)HSTA,i−1(k) +
1α
Hupdate(k) (5)
The updating parameter α is related to the Doppler spread. The values of α and β parametersare dependent on the types of vehicular channels. Significant accuracy can be achieved by adjustingthese values according to the knowledge of the vehicular channel environment. One source of suchknowledge is through the Global Positioning System (GPS), as discussed in [36]. However, such akind of information is practically quite hard to obtain. It is was investigated that fixed values of theseparameters can be a good balance of algorithm simplicity and an acceptable performance degradation.
Another channel tracking technique [16] performed the initial channel estimation through thepreamble just like the midamble base estimation scheme. The next symbols are then estimated ina specific order, that includes the equalization, decision direct estimation, and smoothing process.The channel tracking algorithm in the decision directed scheme is the same as Equations (2) and (3).However, at lower values of SNR, the wrong decisions can propagate and cause an error in the channeltracking process. Therefore, a smoothing process has been proposed to mitigate the part of estimationnoise. The performance improvement is depicted in the simulation results. This smoothing operationbrought a huge complexity into the computation process, which is mainly caused by the multiplicationof larger size matrices. This computational complexity was reduced by two algorithms, known as

Sensors 2019, 19, 98 8 of 22
lossless complexity reduction and lossy complexity reduction. The lossless complexity reductiondeployed the Singular Value Decomposition (SVD) to lower the burden of matrix multiplication.The lossy complexity reduction, on the other hand, ignores some subcarriers to reduce complexitywith little degradation in the performance.
3.2.4. Pseudo-Pilot Based Scheme
Besides TDLSE scheme, a pseudo pilot based channel estimation scheme was proposed in [13].The basic algorithm of the pseudo-pilot based scheme was proposed in [37,38] and the pseudo pilotswere assumed as true pilots. This scheme is based on the regression polynomial to estimate thechannel response [39]. Further, in [39,40], the least square fitting was investigated to calculate theregression polynomial coefficients. The algorithm of pseudo pilot scheme is based on three steps,such as (1) precalculation; (2) real-time estimation; and (3) channel tracking. The first step needspredefinition of the regression polynomial and the prescoring of the related matrix. The second stepat first calculates the channel impulse response on the pilot subcarriers, and then it estimates thecomplete channel impulse response. Afterward, this complete response is used to derive a betterchannel response by using a scheme that is similar to the decision directed (DD) scheme. The third andfinal step is an improvement of the pseudo-pilot algorithms [37,38]. The initial coefficients are derivedfrom the preamble and then the pilots are deployed to track the channel variations in the adjacentsymbols with performance improvement in the pseudo-pilot algorithm.
3.2.5. DFT Based Scheme
To obtain a trade-off between performance and complexity in vehicular communication, a DiscreteFourier Transform (DFT) based channel estimation technique was introduced in [41]. In this scheme,the channel response obtained by LS estimation is converted back to the time domain by taking itsinverse Fourier transform. In this scheme, the coefficients for the maximum channel delay are selectedafter ignoring the noise-containing coefficients of the time domain channel response. These selectedcomponents are then returned back to the frequency domain and the equalization is performed withthe simulation results better than LS estimation. This scheme performs better than LS, STA, and CDPunder the conditions when the maximum Doppler shift is under 10 Hz, however, as the Doppler shiftincreases above 10 Hz, its performance degrades severely.
3.2.6. CDP Based Scheme
In [5], the preamble-based channel response is utilized to construct data pilots in subsequentdata symbols. The high correlation characteristics of the channel response between the adjacent datasymbols are employed by exploiting the four-phase tracking pilots to achieve better performance thanSTA. The estimation process in the CDP scheme is composed of five steps, including (1) equalization;(2) constructing data pilot; (3) LS estimation; (4) demapping; and (5) comparison. The first threesteps in the CDP scheme are similar to the STA scheme. In the next two steps, the high correlationcharacteristic is utilized to achieve performance improvement over STA and decision directed schemes,especially in the higher SNR region.
Table 3 presents the comparison of the discussed schemes. The Computational Complexity Levelis represented by CCL, and the BER Performance Level is represented by PL. CCL 0.1 means verylow computational complexity (e.g., LS) and CCL 0.5 means very high computational complexity(e.g., GDPS and DD). Please note that this grading is for understanding the difference between thecomputational complexities of various schemes. PL 0.1 means excellent performance and 0.5 means asevere performance degradation (e.g., LS). The terms SM and CSI denote System Modification andChannel State Information respectively in Table 3.

Sensors 2019, 19, 98 9 of 22
Table 3. Comparison of the proposed scheme with existing schemes for the Vehicle-to-Vehicle (V2V)channel Estimation.
Scheme SM Requirement CSI Requirement CCL PL Compatibility
STA No Yes 0.3 0.2 InvariantMBCE Yes No 0.2 0.1–0.3 ReducedTDLSE Yes No 0.2 0.2 Reduced
LS No No 0.1 0.5 InvariantWF No Yes 0.3 0.3 Invariant
GDPS No Yes 0.5 0.3 InvariantImproved GDPS Yes Yes 0.4 0.3 Invariant
DD No Yes 0.5 0.3 InvariantDD Lossless reduction No Yes 0.4 0.3 Invariant
DD Lossy reduction No Yes 0.5 0.3–0.4 InvariantPseudo-pilot No Yes 0.5 0.3–0.4 Invariant
CDP No Yes 0.2 0.1–0.2 InvariantProposed No Yes 0.3 0.1 Invariant
4. The Proposed Scheme
The block diagram of the receiver is shown in Figure 3. The pink shaded box depicts the proposedchannel estimator. It is placed after the 64 point FFT block. Table 4 presents the timing parametersused in the simulation of the proposed scheme, and they are in accordance with Section 18 of the IEEEstandard 802.11p [1].
Packet Detection and Coarse Frequency Correction
Timing Synchronization and Fine Frequency Correction
Offset Known Channel Delay
FFT 64 Point
Proposed Channel Estimation
Demodulation
Data Recovery Section
PSDU Depuncture
Deinterleaver
Viterbi Decoder
Figure 3. IEEE 802.11p receiver block diagram.
The timing synchronization and fine frequency correction are performed based on the outputof packet detection and coarse frequency correction block. The detail about this block can be foundin [42].
Definition 2. Packet Detection: The process of detecting a packet based on the information in the received timedomain signal Xt, such as channel bandwidth. The output of this process is the offset, from the start of thereceived input waveform to the start of the detected preamble using auto-correlation.
Figure 4 shows a single IEEE 802.11p packet waveform, where the upper part is the transmittedtime domain signal and the lower part is the received time domain signal ready for channel estimationblock. It should be noted that the transmitted time domain waveform Tx(t) is a vector composed ofcomplex numbers, therefore we have taken the absolute of the transmitted waveform i.e.,
√Tx(t)2 and
plotted in the upper part of Figure 4.
Definition 3. Coarse Frequency correction: It is the correction in terms of frequency error which is estimated byutilizing the pre-known STS training field. The estimate contains the carrier frequency offset in Hertz. The shortlength of the periodic sequence in the STS allows coarse frequency offset estimation.

Sensors 2019, 19, 98 10 of 22
TSHORT = 16µs TLONG = 16µs
TPREAMBLE = 32µs
TSIGNAL = 8µs
Data 1 Data 2 Data 3 Data 4 Data 5
TSYMBOL = 8µs
TGI2 = 3.2µs TGI = 1.6µs
10 Short Training Symbols 2 Long Training Symbols Data Signal
TGI = 1.6µs
Figure 4. Transmitted and Received IEEE 802.11p packet.
Similarly, the received waveform signal Rx(t) that is modulated by channel [28] and atSNR = 35 dB is drawn in the lower part of Figure 4 as
√Rx(t)2. For the purpose of clarity,
we have plotted only 5 data symbols. Figure 4 also gives the detailed timing information in terms ofparameters that are described in Table 4. The output of the FFT block is SR,i(k), which is the frequencydomain representation of the received symbol at kth subcarrier. In contrast to the CDP scheme, theproposed scheme also includes the 4 phase tracking pilots and therefore k represents 52 subcarriers.
The proposed estimator updates the ith symbol’s channel estimate by using the channel responseHCDP,i−1(k), obtained from the previous (i − 1)th symbol. The equalization process is given byEquation (6).
ST,i(k) =SR,i(k)
HCDP,i−1(k)(6)
Since ST,i(k) contains a total of 52 subcarriers. In order to construct 52 pilots, the ST,i(k) isdivided into two groups of subcarriers, i.e., the data subcarriers group ST,i(kD) and the phase trackingpilots subgroup ST,i(kP). These groups are then demodulated separately and then demapped to therespective constellation points to generate the two groups of pilots, i.e., one for the data subcarriersand the other for the phase tracking pilots. The reason behind the construction of the phase trackingpilots is to get more information for the comparison block. The process flow chart of the proposedchannel estimator algorithm is shown in Figure 5. It is clear from the process flowchart in Figure 5 thatthe time domain signal in Figure 4 is now converted to the frequency domain by taking the 64 pointsFFT. Then the LS estimation is performed on this signal using Equation (1). As stated earlier, the nexttask is to perform the equalization to get a rough estimate of the transmitted LTS. The initial Data pilotsare created and then again LS estimation is performed which is based on the constructed data pilots.

Sensors 2019, 19, 98 11 of 22
Table 4. Timing parameters used in the proposed scheme.
Parameter Value 10 MHz Channel Bandwidth
NSD Number of data subcarriers 48 48NSP Number of pilot subcarriers 4 4NST Number of total subcarriers NSD + NSP 52∆F Subcarrier frequency spacing 10 MHz/64 0.15625 MHz
TFFT : FFT,IFFT period 1/∆F 6.4 µsTGI : GI duration TFFT / 4 1.6 µs
TSIGNAL: Duration of the Signal section TFFT + TGI 8 µsTGI2: Training symbol GI duration TFFT / 2 3.2 µs
TSYM: Symbol duration TFFT + TGI 8 µsTSHORT : STS duration 10×TFFT / 4 16 µsTLONG: STS duration 2×TFFT + TGI2 16 µs
TPREAMBLE: Duration of PLCP preamble TSHORT + TLONG 32 µs
Since the adjacent subcarriers to the phase tracking pilots have a higher correlation with them, sothe constructed phase tracking pilots and the originally known phase tracking pilots are compared todecide the channel response in those regions, which helps in improving the accuracy of the overallsystem. In the CDP estimation scheme, the assistance of demapping is used to partially alleviatethe impact of noise from the other interferences. Then, the remaining error is further reduced byexploiting the correlation characteristics of the channel for the two adjacent symbols. The constructeddata pilot Xi(k) in [5] are then employed to obtain the ith data symbol’s channel response by using theEquation (3). We further investigated that even though Hi(k) is a relatively accurate estimate of thechannel response, however, it is can be improved by exploiting the high correlation characteristics ofthe channel. Therefore, Hi(k) is used to equalize SR,i−1(k) in Equation (7).
S′C,i−1(k) =SR,i−1(k)
Hi(k)(7)
Again, the SR,i−1(k) is then equalized by HCDP,i−1(k), i.e., the previous symbol’s estimated CR,which has been used before in Equation (6). In order to make a comparison , SR,i−1(k) is also equalizedby the HCDP,i−1(k) and the resulting equalized S′′C,i−1(k) is given by Equation (8).
S′′C,i−1(k) =SR,i−1(k)
HCDP,i−1(k)(8)
The one to one comparison of S′C,i−1(k) and S′′C,i−1(k) is made by appropriately demapping themto their respective constellation points X′ i(k) and X′′ i(k). The proposed demapping process starts byusing constellation demodulation of S′C,i−1(k) and S′′C,i−1(k), using the information from the standardIEEE 802.11 modulation coding scheme (MCS) table. Let us take the case of mcs = 2, so that afterthe demodulation the S′C,i−1(k) is now represented by S′Cdn,i−1(k) and S′′C,i−1(k) is represented byS′′Cdn,i−1(k). For this particular configuration, S′Cdn,i−1(k) can take four different values representedby (n = 1, 2, 3, 4) Equation (9) to Equation (12).
S′Cd1,i−1(k) ≈1√2+
i√2
(9)
S′Cd2,i−1(k) ≈1√2− i√
2(10)
S′Cd3,i−1(k) ≈ −1√2+
i√2
(11)
S′Cd4,i−1(k) ≈ −1√2− i√
2(12)

Sensors 2019, 19, 98 12 of 22
Start
Coarse Frequency Correction
Timing Synchronization
802.11p Packet Detection
64 Point FFT
LS Channel Estimation
Data pilots construction
Equalization
Spectral Temporal Averaging
Equalization
R,iS k
ˆT,iS k
ˆiX k
iH k
,STA iH k
LS Channel Estimation
Demapping
' ''1 1,ˆ ˆ
i iX k X k
' '', 1 , 1
ˆ ˆ,C i C iS Sk k
' ''1 1
ˆ ˆi iX k X k Choose Decision 2
Choose Decision 1
No
Yes
Recover Bits
Figure 5. Process flow of the proposed algorithm.

Sensors 2019, 19, 98 13 of 22
Let say P1, P2, P3, and P4 represent the values 1√2+ i√
2, 1√
2− i√
2, − 1√
2+ i√
2, and − 1√
2− i√
2respectively. In order to choose the best value, we need to take the absolute difference of S′Cdn,i−1(k)(where n can take any value from 1 to 4) from P1, P2, P3, and P4 to get G1, G2, G3, and G4 as shownin Equation (13).
Gn = abs(S′Cdn,i−1(k)− Pn)∀n (13)
Then the argument or index of the minimum value from G1, G2, G3, G4 is selected as shown inEquation (14).
index = argmin(G1, G2, G3, G4) (14)
The prediction of the actual value of X′ i(k) and similarly that of X′′ i(k) can be found fromEquation (15).
X′ i(k) = Pn, i f {index == n} ∀n (15)
If X′ i(k) 6= X′′ i(k) , it means that the kth subcarrier’s X′ i(k) is not valid and the assumption ismade that HCDP,i(k) = HCDP,i−1(k). Additionally, if the X′ i−1(k) = X′′ i(k), then it can be assumedthat HCDP,i(k) = Hi(k), which is indicated as Decision 1 in Figure 5. We argue that the two adjacentdata symbols have high correlation in frequency as well. Therefore if X′ i(k) 6= X′′ i(k), it indicatesthat the kth subcarrier’s X′ i(k), which demapped after Equation (6) is incorrect and we shoulddefine that HiCDP,i(k) = HiCDP,i−1(k), i.e., the previous symbol’s estimated CR. It is indicated asDecision 2 in Figure 5. Moreover, in contrast to the CDP scheme where otherwise, if X′ i−1(k) =
X′′ i(k) then HCDP,i(k) = Hi(k). We argue that the superior performance over CDP scheme can beobtained by taking into consideration Hi(k) obtained previously from Equations (3) and (5) throughthe Equation (16).
HiCDP,i(k) =12 HSTA,i−1(k) + 1
2 Hupdate(k) + Hi(k)2
(16)
where HiCDP,i(k) is the proposed channel estimate. The next section evaluates the proposed estimatorover the severe channel conditions of [28] and also provides comparisons with the closely relatedschemes. Let us assume that |H(i,k)| represents the absolute of the estimated channel.
5. Simulation Results and Analysis
The simulation platform used in this article is Matlab 2016b. The BER simulation results ofdifferent configurations are presented in this section. We have compared the proposed iCDP schemewith LS, DFT, STA, and CDP schemes. The value of parameters α and β is set to 2 for the optimalperformance of the STA scheme as discussed in [36]. The performance of IEEE 802.11p is analyzedunder the different length of packets i.e., from 10, 20, 30, and up to 200 OFDM data symbols.The simulation results reveal that LS and DFT channel estimation schemes have higher BER values,whereas STA, CDP, and iCDP are comparatively better under all symbol lengths as shown in Figure 6.
The value of maximum Doppler shift is set to 1200 Hz for the HIPERLAN-E channel and themodulation coding scheme is mcs = 2. It is also obvious from Figure 6 that the BER values for STA,CDP, and iCDP remain almost same for the 10 and 20 data symbol lengths, however, as the lengthincreases, iCDP tends to perform better than STA and CDP. The next test is performed for the VTVexpress oncoming channel model as shown in Figure 7. It is also clear from the results that under thelower SNR regions the STA scheme performs better than CDP scheme, however, the proposed iCDPscheme performs better than CDP scheme and nearly similar to the STA scheme.
In the higher SNR regime, the CDP scheme outperforms the STA scheme. This is due to the factthat under the lower SNR the noise and interferences are strong enough to move the ST,i(k) to theincorrect locations, which results in demapping of Xi(k) to the incorrect constellation points.
The increase in SNR reduces these incorrect demappings and the CDP scheme performs betterin this regime. In contrast to the CDP scheme, the iCDP is inherently SNR aware. This is due to thereason that the construction of data pilots is followed by LS channel Estimation and STA equalization,

Sensors 2019, 19, 98 14 of 22
which reduces the error demapping probability of Xi(k) to the constellation points. The results showthat the STA and iCDP schemes perform equally well as compared to CDP up to the SNR value of18 dB. On the other hand, CDP and iCDP perform better than STA from the SNR greater than 26 dB.The iCDP overall performs better than the CDP scheme. Due to the page limit, the result of the rest ofthe 5 channel models are skipped and the next results are for the HIPERLAN-E channel model.
0 20 40 60 80 100 120 140 160 180 200
Data Symbols
0
0.05
0.1
0.15
0.2
0.25
0.3
0.35
0.4
BE
R
Data Symbols vs BER
LSDFTCDPSTAiCDP
Figure 6. Bit Error Rate (BER) vs. length of data symbols for HIgh PERformance radio Local AreaNetwork (HIPERLAN-E) Channel and fd = 1200 Hz.
5 10 15 20 25 30 35 40
SNR(dB)
10 -2
10 -1
100
BE
R
VTV Express oncoming
LSDFTCDPSTAiCDP
Figure 7. Vehicle-to-Vehicle (VTV) Express oncoming Channel, Data Symbols = 100.

Sensors 2019, 19, 98 15 of 22
Under urban traffic scenario the number of buildings and vehicles increases, hence scattering andreflection of the transmitted signals also increase. This phenomenon leads to an increase in the numberof multi-path fading. The HIPERLAN-E channel model has a total of 18 multi-paths. Figure 8 showsthe result of the BER performance curves of different schemes for this channel model. The results showthat the STA and iCDP schemes perform equally well as compare to CDP up to the SNR value of 20 dB.On the other hand, CDP and iCDP perform better than STA from the SNR greater than 22 dB.
HIPERLAN-E Channel Model
Figure 8. HIPERLAN-E channel model with Data Symbols = 100.
The performance comparison in terms of RMSE is shown in Figure 9. The method to obtainRSME is described in [6]. It is clear that at an SNR of −10 dB, the DFT scheme performs better thanothers. The RMSE value DFT scheme is 0.4381 at −10 dB, while the other schemes have roughlythe same value of 0.4994. It is due to the fact that DFT ignores the noise-containing coefficients ofthe time domain channel response. However, the RMSE performance of DFT degrades as the SNRbecomes bigger. The iCDP and STA schemes perform almost similar till the value of SNR equal to8 dB. However, CDP scheme performs similarly to LS scheme until SNR equal to 8 dB. The RMSEvalues obtained at SNR equal to 8 dB for LS, DFT, CDP, STA, and iCDP are: 0.2111, 0.2046, 0.209,0.1865, and 0.1860 respectively. If we go on further at the point where SNR is 26 dB, then the STAand CDP schemes have roughly similar RMSE value of 0.1227 and the iCDP scheme has a value of0.1071. The RMSE values of DFT and LS schemes are 0.1916 and 0.1943 respectively. Finally, at anSNR of 40 dB, the RSME value of iCDP is 0.0899 and corresponding RMSE values for CDP and STAare 0.9796 and 0.1112 respectively. The RMSE for LS and DFT seems saturated at roughly 0.1916 withno further improvement in performance. This result demonstrates the performance improvement ofthe proposed scheme over DFT/LS, STA, and CDP schemes with the RMSE percentage differences of72.3%, 21.1%, and 8.5% respectively at SNR of 40 dB.

Sensors 2019, 19, 98 16 of 22
HIPERLAN-E Channel Model
Figure 9. Root-mean-square error (RMSE) comparison for HIPERLAN-E channel model with DataSymbols = 200.
It is equally important to visualize the 3-dimensional image of the actual HIPERLAN-E channeland its estimation by the proposed iCDP scheme to show that it tracks the channel in time andfrequency domain for the different SNR values. Figure 10 shows the effect of lower and higher SNR onthe HIPERLAN-E channel model. Figure 10a shows the actual channel conditions at under fd = 1200,data symbols = 200, and SNR = 15 dB. Figure 10b shows the estimation of the actual channel inFigure 10a through the proposed scheme. On the other hand, Figure 10c shows another channelconditions at SNR = 35 dB and Figure 10d shows its estimation through the proposed scheme. It isevident from Figure 9 that at lower SNR, the correlation among the data symbols and frequencysubcarriers suffers due to the randomness of the noise. The proposed scheme performs relativelybetter than CDP under lower SNRs because it constructs the data pilots after taking into considerationthe front and previous data symbol in time domain and front and previous frequency carrier in thefrequency domain.
Figure 11 shows the multipath components of the HIPERLAN-E channel used in the simulationof the proposed scheme. The bandlimited impulse response in Figure 11a shows 18 different pathsthat are arriving at the receiver vehicle with different amplitudes and delays. Figure 11b shows thecontribution of these components with the passage of time up to 850 µs. The delay of the first pathis set to 0 µs. For subsequent paths, a 1 µs delay corresponds to a 300 m difference in path length.In vehicular communication, the multipath environments have reflected paths that can be up to severalkilometers longer than the shortest path. With the path delays specified above, the last path is 528 mlonger than the shortest path, and thus arrives 1.76 µs later which is also obvious from the specificationsin Table 2. The path delays and path gains specify the channel’s average delay profile.
Typically, the average path gains decay exponentially with delay (i.e., the dB values decay linearly),but the specific delay profile depends on the propagation environment. In the delay profile specifiedin Figure 11, we assumed the specifications of Table 2 HIPERLAN-E channel model.

Sensors 2019, 19, 98 17 of 22
(a) (b)
SNR = 15 dB Actual HIPERLAN-E Channel
(Data Symbols = 200) iCDP Estimated HIPERLAN-E Channel
(Data Symbols = 200)
|H(t
,f)|
Ch
ann
el M
agn
itu
de
(c) (d)
|H(t
,f)|
iCD
P C
han
nel
Mag
nit
ud
e
Actual HIPERLAN-E Channel
(Data Symbols = 200)
SNR = 35 dB iCDP Estimated HIPERLAN-E Channel
(Data Symbols = 200) |H
(t,f
)|iC
DP
Ch
ann
el M
agn
itu
de
|H(t
,f)|
Ch
ann
el M
agn
itu
de
Figure 10. Actual and Estimated HIPERLAN-E channels: (a) Actual channel at SNR = 15 dB.(b) Estimated channel at SNR = 15 dB. (c) Actual channel at SNR = 35 dB. (d) Estimated channelat Signal-to-Noise Ratio (SNR) = 35 dB.
Last Path No. 18 at 1.76µs corresponds to path difference of 528m
Delay(s)
Delay(s)
Delay(µs)
Figure 11. Multipath components of the HIPERLAN-E channel: (a) Bandlimited impulse response.(b) Multipath fading components after 850 µs.

Sensors 2019, 19, 98 18 of 22
Computational Complexity
Figure 12 shows the comparison of computation complexity in terms of the number of additions,as a function of the number of data symbols Nd. Table 5 summarizes the comparison of the computationcomplexity of different scheme in terms of divisions, multiplications, additions, and subtractions.
1 2 3 4 5 6 7 8 9 10
Data Symbols Nd
0
200
400
600
800
1000
1200
1400
1600
1800
2000
Com
puta
tion
com
plex
ity in
term
s of
Div
isio
ns
Computational complexity comparison
LS/DFTCDPSTAiCDP
Figure 12. Computation complexity comparison of different schemes.
Table 5. Computation complexity comparison of the schemes.
Scheme Divisions Multiplications Additions Subtractions
LS 48Nd + 96 - 48 -DFT 48Nd + 96 - 48 -STA 104Nd + 104 148Nd − 2βNd 52 + 2(β + 1)(52 − 2β)Nd 48NdCDP 192Nd + 48 - 48 -iCDP 104Nd + 104 144Nd 52+240Nd 48Nd
The higher Doppler shift causes stronger variation in the time domain as well. It is thereforeessential to visualize how the value of fd effects the channel conditions in time domain or along thelength of data symbols. Figure 13 shows this effect for different values of fd i.e., 1, 100, 200, 300,and 400 Hz.
The impact of these values on the channel conditions is shown in Figure 13a–e. It is interestingto notice that at a very low value of fd = 1 Hz, the channel remains almost invariant in the time axis.Then the variations become larger as the value of fd increases.
HIPERLAN-E Channel
(Data Symbols = 200)
|H(t
,f)|
Ch
ann
el M
agn
itu
de
|H(t
,f)|
Ch
ann
el M
agn
itu
de
|H(t
,f)|
Ch
ann
el M
agn
itu
de
|H(t
,f)|
Ch
ann
el M
agn
itu
de
|H(t
,f)|
Ch
ann
el M
agn
itu
de
(a) (b) (c) (d) (e)
Maximum Doppler Shift = 1Hz Maximum Doppler Shift = 100Hz Maximum Doppler Shift = 200Hz Maximum Doppler Shift = 300Hz Maximum Doppler Shift = 400Hz
Figure 13. Impact of fd on the channel conditions. (a) fd = 1 Hz, (b) fd = 100 Hz, (c) fd = 200 Hz,(d) fd = 300 Hz, and (e) fd = 400 Hz.

Sensors 2019, 19, 98 19 of 22
6. Issues and Future Work
There are two main issues of the discussion and future work. The first issue is related to thecomputational complexity of the channel estimation process. The schemes that follow scenario 1achieve better BER curves at the expense of the computation complexity, which is the outcome ofcomplex matrix multiplications. The higher computational complexity leads to a higher requirementof hardware resources, which ultimately requires more energy. This energy demand becomes a criticalissue for electric vehicles as discussed in [43]. The proposed scheme keeps the requirement of hardwareresources low. However, if computational complexity is not the major concern then the proposedscheme can be further improved by constructing data pilots using Deep Learning techniques.
The second issue is related to the proper utilization of the α and β parameters, which representthe time and frequency variations. Most of the current schemes utilize these parameters, with theassumption of prior knowledge. However, those schemes not mentioned the determination process ofthese parameters. Some authors [36] determined these parameters from a difficult realization of mapknowledge and GPS. However, due to mobility and highly random road scattering variants, theseparameters are hard to determine. One future consideration is to devise an algorithm to determine orpredict these parameters or lower their dependence on the overall system performance.
7. Conclusions
This article presents an improved CDP channel estimation scheme for vehicular communications.The vehicular channel is dynamic in terms of frequency and time. An overview of the state-of-the-artvehicular channel estimation schemes is presented briefly in this article. Even though these schemesperform considerably well, however, there are still limitations and challenges. We have discussed thesechallenges and proposed a scheme which constructs improved pilots from the data and phase trackingsymbols through the exploitation of correlation characteristics of vehicular channels. The proposedscheme keeps the structure of IEEE 802.11p physical layer standard intact independent to the nature ofthe channel. This makes the proposed scheme a suitable candidate for the IEEE 802.11p and differentvehicular channel models. The performance evaluation shows that it outperforms the related schemese.g., CDP scheme, STA scheme, LS scheme, and DFT scheme both in the lower and high SNR regions.In addition to that, the proposed scheme has the little computational complexity as compared to thevarious V2V channel estimation schemes, e.g., decision-directed scheme, Pseudo pilot scheme, andgeneralized DPS based scheme.
8. Materials and Methods
The source code used in this article will be made available on github. We have used Matlabversion 2016b. The CPU used is Intel’s core i7.
Author Contributions: Conceptualization, T.W. and A.H.; Methodology, A.H.; Software, A.H., S.G and Y.C.;Validation, A.H., Y.C. and S.G.; Formal Analysis, T.W., A.H., Y.C., and S.G; Investigation, A.H. and S.G.; Resources,A.H.; Data Curation, A.H., W.T. and S.G.; Writing-Original Draft Preparation, T.W. and A.H.; Writing-Reviewand Editing, A.H., and Y.C.; Visualization, A.H.; Supervision, T.W.; Project Administration, T.W.; FundingAcquisition, T.W.
Funding: This research was funded by National Natural Science Foundation grant number (61102105, 51779050),and The Harbin Science Fund for Young Reserve Talents (No. 2017RAQXJ036).
Acknowledgments: We deeply acknowledge the National Natural Science Foundation for kind support inthis work.
Conflicts of Interest: The authors declare no conflict of interest.

Sensors 2019, 19, 98 20 of 22
Abbreviations
The following abbreviations are used in this manuscript:
BER Bit Error RateCDP Constructed data pilotsDFT Discrete Fourier TransformDPS Generalized Discrete Prolate SpheroidalDSRC Dedicated Short Range CommunicationsGI Guard IntervaliCDP Improved constructed data pilotedLS Least square estimationLTS Long Training SymbolsMBCE The Midamble Based Channel Estimation SchemeMCS Modulation Coding SchemeNLOS Non line of sightOFDM Orthogonal frequency division multiplexingPHY PhysicalPLCP Physical layer convergence procedureSTS Short Training SymbolsSTA Spatial temporal AveragingTDL Tapped Delay LineTDLSE Time Domain Least Square Estimation SchemeVTV Vehicle to vehicleWSSUS Wide sense stationary uncorrelated scattering
References
1. IEEE Standard for Information Technology Telecommunications and Information Exchange Between Systems Localand Metropolitan Area Networks Specific Requirements Part 11, Wireless LAN Medium Access Control and PhysicalLayer Specifications; IEEE Standard 802.11p; IEEE: Piscataway, NJ, USA, 2010.
2. Patra, S.; Veelaert, P.; Calafate, C.T.; Cano, J.C.; Zamora, W.; Manzoni, P.; Gonzalez, F. A Forward CollisionWarning System for Smartphones Using Image Processing and V2V Communication. Sensors 2018, 18, 2672.[CrossRef] [PubMed]
3. Hartenstein, H.; Laberteaux, K.P. T. A tutorial survey on vehicular ad hoc networks. IEEE Commun. Mag.2008, 46, 32–58. [CrossRef]
4. Li, Z.; Bai, F.; Fernandez, J.A.; Kumar, B.V.K.V. Tentpoles Scheme: A Data-Aided Channel EstimationMechanism for Achieving Reliable Vehicle-to-Vehicle Communications. IEEE Trans. Wirel. Commun. 2015, 14,2487–2499 . [CrossRef]
5. Zhao, Z.; Cheng, X.; Wen, M.; Jiao, B.; Wang, C.-X. Channel Estimation Schemes for IEEE 802.11p Standard.IEEE Trans. Intell. Transp. Syst. 2013, 5, 38–49.
6. Mishra, K.V.; Eldar, Y.C. Sub-Nyquist channel estimation over IEEE 802.11ad link. In Proceedings of the IEEEInternational Conference on Sampling Theory and Applications (SampTA), Tallin, Estonia, 3–7 July 2017.
7. Wang, T.; Hussain, A.; Bhutta, M.N.; Cao, Y. Enabling bidirectional traffic mobility for ITS simulation insmart city environments. Future Gener. Comput. Syst. 2018, 92, 342–356. [CrossRef]
8. Choi, J.Y.; Mun, C.; Yook, J.G. Adaptive Channel Estimation Based on a Decision Method Using a LongPreamble for the IEEE 802.11p. In Proceedings of the IEEE 85th Vehicular Technology Conference (VTCSpring), Sydney, NSW, Australia, 4–7 June 2017.
9. Yang, Y.; Fei, D.; Dang, S. Inter-Vehicle Cooperation Channel Estimation for IEEE 802.11p V2I Communications.IEEE J. Commun. Netw. 2017, 19, 227–238 .
10. Kim, S.I.; Oh, H.S.; Choi, H.K. Mid-amble aided OFDM performance analysis in high mobility vehicular channel.In Proceedings of the 2008 IEEE Intelligent Vehicles Symposium, Eindhoven, The Netherlands, 4–6 June 2008;pp. 751–754.

Sensors 2019, 19, 98 21 of 22
11. Cho, W.; Kim, S.I.; Choi, H.K.; Oh, H.S.; Kwak, D.Y. Performance evaluation of V2V/V2I communications:The effect of midamble insertion. In Proceedings of the 2009 1st International Conference on WirelessCommunication, Vehicular Technology, Information Theory and Aerospace & Electronic Systems Technology,Aalborg, Denmark, 17–20 May 2009; pp. 793–797.
12. Lin, C.; Sun, C.; Lin, J.; Chen, B. Performance evaluations of channel estimations in IEEE 802.11penvironments. In Proceedings of the 2009 International Conference on Ultra Modern Telecommunications &Workshops, St. Petersburg, Russia, 12–14 October 2009; pp. 1–5.
13. Lin, C.; Lin, J. Novel channel estimation techniques in IEEE 802.11p environments. In Proceedings of the2010 IEEE 71st Vehicular Technology Conference, Taipei, Taiwan, 16–19 May 2010; pp. 1–5.
14. Nuckelt, J.; Schack, M.; Kurner, T. Performance Evaluation of wiener filter designs for channel estimationin vehicular environments. In Proceedings of the 2011 IEEE Vehicular Technology Conference (VTC Fall),San Francisco, CA, USA, 5–8 September 2011; pp. 1–5.
15. Zemen, T.; Bernad, L.; Czink, N.; Molisch, A.F. Iterative time-variant channel estimation for 802.11p usinggeneralized discrete prolate spheroidal sequences. IEEE Trans. Veh. Technol. 2012, 61, 1222–1233. [CrossRef]
16. Bourdoux, A.; Cappelle, H.; Dejonghe, A. Channel tracking for fast time-varying channels in IEEE802.11psystems. In Proceedings of the 2011 IEEE Global Telecommunications Conference-GLOBECOM, Kathmandu,Nepal, 5–9 December 2011 pp. 1–6.
17. Wang, C.X.; Cheng, X.; Laurenson, D.I. Vehicle-to-vehicle channel modeling and measurements: Recentadvances and future challenges. IEEE Commun. Mag. 2009, 47, 96–103. [CrossRef]
18. Cheng, X.; Wang, C.X.; Laurenson, D.I.; Salous, S.; Vasilakos, A.V. An adaptive geometry-based stochasticmodel for non-isotropic MIMO mobile-to-mobile channels. IEEE Trans. Wirel. Commun. 2009, 8, 4824–4835.[CrossRef]
19. Cheng, X.; Wang, C.X.; Wang, H.; Gao, X.; You, X.; Yuan, D.; Ai, B.; Huo, Q.; Song, L.; Jiao, B. CooperativeMIMO channel modeling and multi-link spatial correlation properties. IEEE J. Sel. Areas Commun. 2012,30, 388–396. [CrossRef]
20. Cheng, X.; Wang, C.X.; Ai, B.; Aggoune, H. Envelope level crossing rate and average fade duration ofnon-isotropic vehicle-to-vehicle ricean fading channels. IEEE Trans. Intell. Trans. Syst. 2013, 99, 1–11.
21. Ge, X.; Huang, K.; Wang, C.X.; Hong, X.; Yang, X. Capacity analysis of a multi-cell multi-antenna cooperativecellular network with co-channel interference. IEEE Trans. Wirel. Commun. 2011, 10, 3298–3309. [CrossRef]
22. Wang, C.X.; Hong, X.; Ge, X.; Cheng, X.; Zhang, G.; Thompson, J.S. Cooperative MIMO channel models:A survey. IEEE Commun. Mag. 2010, 48, 80–87. [CrossRef]
23. Cheng, X.; Yao, Q.; Wang, C.X.; Ai, B.; Stuber, G.L.; Yuan, D.; Jiao, B. An improved parameter computationmethod for a MIMO V2V rayleigh fading channel simulator under non-isotropic scattering environments.IEEE Commun. Lett. 2013, 17, 265–268. [CrossRef]
24. Qu, F.; Yang, L. On the estimation of doubly selective fading channels. IEEE Trans. Wireless Commun. 2010,9, 1261–1265. [CrossRef]
25. Acosta-Marum, G. Measurement, Modeling, and OFDM Synchronization for the Wideband Mobile-to-MobileChannel. Ph.D. Thesis, Georgia Institute of Technology, Atlanta, GA, USA, 2007.
26. Sen, I.; Matolak, D.W. Vehicle-vehicle channel models for the 5 GHz band. IEEE Trans. Intell. Trans. Syst.2008, 9, 235–245. [CrossRef]
27. Cheng, X.; Yao, Q.; Wen, M.; Wang, C.-X.; Song, L.; Jiao, B. Wideband channel modeling and ICI cancellationfor vehicle-to-vehicle communication systems. In IEEE J. Sel. Areas Commun. 2013, 31, 434–448. [CrossRef]
28. ETSI. 2015. Available online: http://www.etsi.org/technologies-clusters/technologies/intelligent-transport/ (accessed on 2 Jan 2018).
29. Acosta-Marum, G.; Ingram, M.A. Six time-and frequency-selective empirical channel models for vehicularwireless LANs. IEEE Veh. Technol. Mag. 2007, 2, 4–11. [CrossRef]
30. Muck, M.; de Courville, M.; Debbah, M.; Duhamel, P. A pseudo random postfix OFDM modulatorand inherent channel estimation techniques. In Proceedings of the GLOBECOM ’03. IEEE GlobalTelecommunications Conference (IEEE Cat. No. 03CH37489), San Francisco, CA, USA, 1–5 December2003; pp. 2380–2384.
31. Lin, J. Channel estimation assisted by postfixed pseudo-noise se- quences padded with null samples formobile OFDM communications. In Proceedings of the 2008 IEEE Wireless Communications and NetworkingConference, Las Vegas, NV, USA, 31 March–3 April 2008 ; pp. 846–851.

Sensors 2019, 19, 98 22 of 22
32. Lin, J. Least-squares channel estimation for mobile OFDM communication on time-varying frequency-selectivefading channels. IEEE Trans. Veh. Tech. 2008, 57, 3538–3550.
33. Lin, J.; Lin, C. LS channel estimation assisted from chirp sequences in OFDM communications. In Proceedingsof the 2009 1st International Conference on Wireless Communication, Vehicular Technology, InformationTheory and Aerospace & Electronic Systems Technology; Aalborg, Denmark, 17–20 May 2009; pp. 222–226.
34. Ren, G.; Zhang, H.; Chang, Y. SNR estimation algorithm based on the preamble for OFDM systems infrequency selective channels. IEEE Trans. Commun. 2009, 57, 2230–2234. [CrossRef]
35. Zemen, T.; Mecklenbrauker, C.F. Time-variant channel estimation using discrete prolate spheroidal sequences.IEEE Trans. Signal Process. 2005, 53, 3597–3607. [CrossRef]
36. Fernandez, J.A.; Borries, K.; Cheng, L.; Kumar, B.V.K.V.; Stancil, D.D.; Bai, F. Performance of the 802.11pPhysical layer in vehicle-to-vehicle environments. IEEE Trans. Veh. Technol. 2012, 61, 3–14. [CrossRef]
37. M. Chang; T. Hsieh. Detection of OFDM signals in fast fading with low-density pilot symbols. In Proceedingsof the 2007 IEEE Wireless Communications and Networking Conference, Kowloon, China, 11–15 March2007; pp. 1422–1427.
38. Chang, M.; Hsieh, T. Detection of OFDM signals in fast-varying channels with low-density pilot symbols.IEEE Trans. Veh. Tech. 2008, 57, 859–872. [CrossRef]
39. Chang, M.; Su, Y. Model-based channel estimation for OFDM signals in rayleigh fading. IEEE Trans. Commun.2002, 50, 540–544. [CrossRef]
40. Chang, M. A new derivation of least-squares-fitting principle for OFDM channel estimation. IEEE Trans.Wirel. Commun. 2006, 5, 726–731. [CrossRef]
41. Kang, Y.; Kim, K.; Park, H. Efficient DFT-based channel estimation for OFDM systems on multipath channels.IET Commun. 2007, 1, 197–202. [CrossRef]
42. Chiueh, T.-D.; Tsai, P.-Y. OFDM Baseband Receiver Design for Wireless Communications; John Wiley and Sons:Singapore, 2007.
43. Cao, Y.; Wang, T.; Kaiwartya, O.; Min, G.; Ahmad, N.; Abdullah, A.H. An EV Charging Management SystemConcerning Drivers Trip Duration and Mobility Uncertainty. IEEE Trans. Syst. Man Cybern. Syst. 2018, 48,596–607. [CrossRef]
c© 2018 by the authors. Licensee MDPI, Basel, Switzerland. This article is an open accessarticle distributed under the terms and conditions of the Creative Commons Attribution(CC BY) license (http://creativecommons.org/licenses/by/4.0/).