an image is everything: a tutorial on choosing and using
TRANSCRIPT
44 doi:10.1017/S1551929520001558 www.microscopy-today.com • 2020 November
Microscopy101
An Image is Everything: A Tutorial on Choosing and Using the Components of a Dynamic Data Capture SystemDuncan Stacey* and Robert GurneyLinkam Scientific Instruments Ltd
Abstract: Dynamic imaging—acquiring images and simultaneously recording relevant sensor parameters—is a powerful way to extend the information and insight available over and above optical micros-copy. It improves understanding and correlates how properties of materials alter with, for example, changing temperature, pressure, humidity, tensile forces, shear stress, or aging. The basics of an imag-ing setup are the microscope, a relevant stage, a camera of appro-priate performance, and suitable software to acquire, synchronize, and analyze the images and data collected. However, many factors need to be considered and optimized to ensure reliable experiments. These include basic features of the microscope—objective resolution and magnification, for example, as well as the accuracy and repro-ducibility of the stage, the camera format, dynamic range, and reso-lution. In this tutorial, we discuss the components of a dynamic data and image capture system and present examples where researchers have used this approach to better understand their materials.
Keywords: Dynamic imaging, image capture, thermal microscopy, sCMOS cameras, resolution
IntroductionThey say “a picture is worth a thousand words.” For
materials changing under a range of environmental condi-tions, this certainly holds true. Dynamic imaging—acquiring images and simultaneously recording relevant sensor param-eters—is a powerful way to understand and correlate how the properties of materials alter with, for example, changing temperature, pressure, humidity, tensile forces, shear stress, or aging. This often requires an integrated system capable of recording and imaging dynamic processes that occur during an experiment.
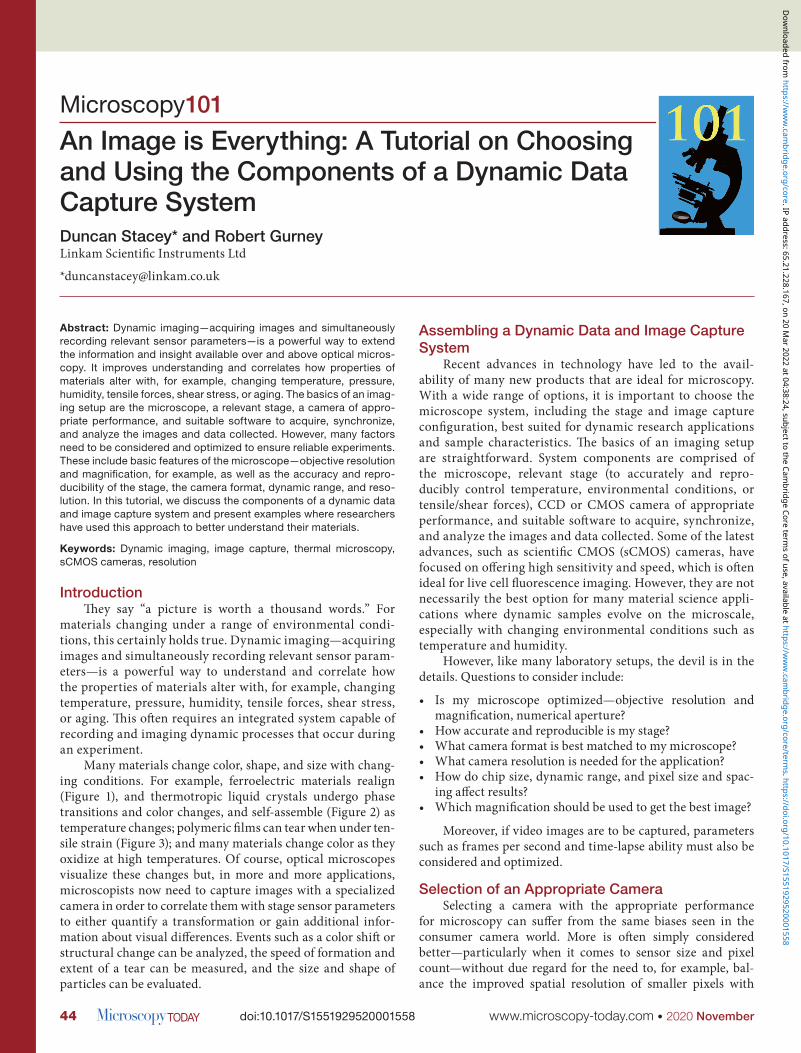
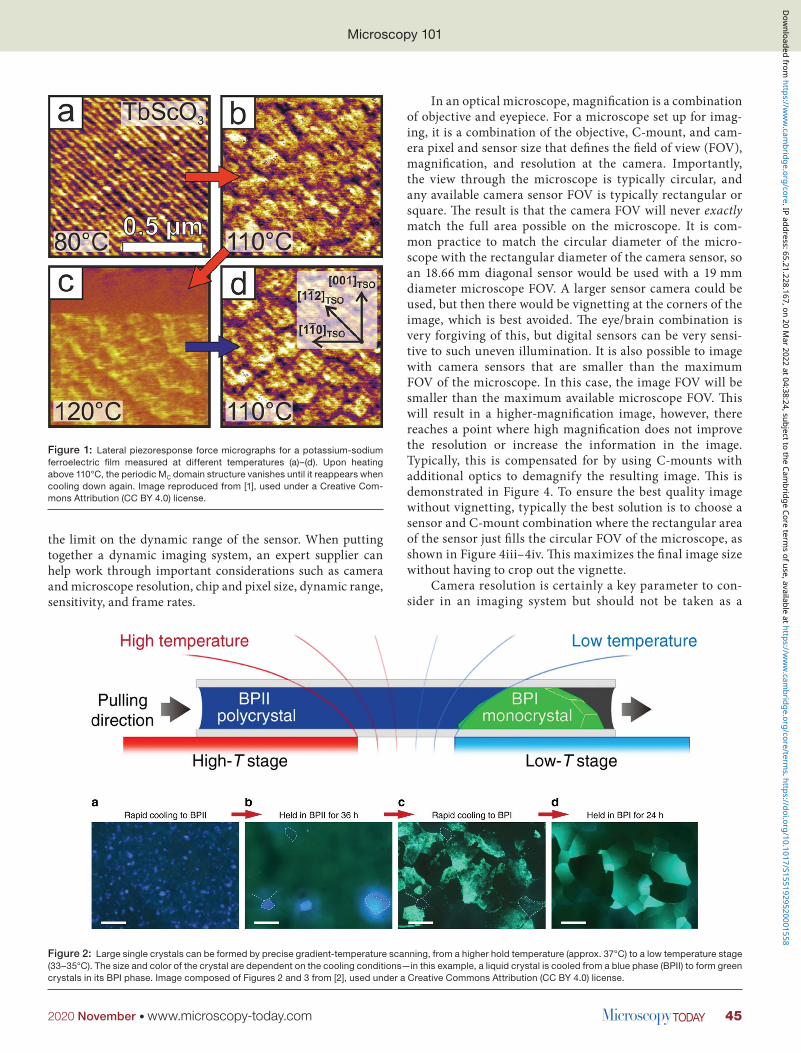
Many materials change color, shape, and size with chang-ing conditions. For example, ferroelectric materials realign (Figure 1), and thermotropic liquid crystals undergo phase transitions and color changes, and self-assemble (Figure 2) as temperature changes; polymeric films can tear when under ten-sile strain (Figure 3); and many materials change color as they oxidize at high temperatures. Of course, optical microscopes visualize these changes but, in more and more applications, microscopists now need to capture images with a specialized camera in order to correlate them with stage sensor parameters to either quantify a transformation or gain additional infor-mation about visual differences. Events such as a color shift or structural change can be analyzed, the speed of formation and extent of a tear can be measured, and the size and shape of particles can be evaluated.
Assembling a Dynamic Data and Image Capture System
Recent advances in technology have led to the avail-ability of many new products that are ideal for microscopy. With a wide range of options, it is important to choose the microscope system, including the stage and image capture configuration, best suited for dynamic research applications and sample characteristics. The basics of an imaging setup are straightforward. System components are comprised of the microscope, relevant stage (to accurately and repro-ducibly control temperature, environmental conditions, or tensile/shear forces), CCD or CMOS camera of appropriate performance, and suitable software to acquire, synchronize, and analyze the images and data collected. Some of the latest advances, such as scientific CMOS (sCMOS) cameras, have focused on offering high sensitivity and speed, which is often ideal for live cell fluorescence imaging. However, they are not necessarily the best option for many material science appli-cations where dynamic samples evolve on the microscale, especially with changing environmental conditions such as temperature and humidity.
However, like many laboratory setups, the devil is in the details. Questions to consider include:
• Is my microscope optimized—objective resolution and magnification, numerical aperture?
• How accurate and reproducible is my stage?• What camera format is best matched to my microscope?• What camera resolution is needed for the application?• How do chip size, dynamic range, and pixel size and spac-
ing affect results?• Which magnification should be used to get the best image?
Moreover, if video images are to be captured, parameters such as frames per second and time-lapse ability must also be considered and optimized.
Selection of an Appropriate CameraSelecting a camera with the appropriate performance
for microscopy can suffer from the same biases seen in the consumer camera world. More is often simply considered better—particularly when it comes to sensor size and pixel count—without due regard for the need to, for example, bal-ance the improved spatial resolution of smaller pixels with
Dow
nloaded from https://w
ww
.cambridge.org/core . IP address: 65.21.228.167 , on 20 M
ar 2022 at 04:38:24 , subject to the Cambridge Core term
s of use, available at https://ww
w.cam
bridge.org/core/terms . https://doi.org/10.1017/S1551929520001558
2020 November • www.microscopy-today.com 45
Microscopy 101
the limit on the dynamic range of the sensor. When putting together a dynamic imaging system, an expert supplier can help work through important considerations such as camera and microscope resolution, chip and pixel size, dynamic range, sensitivity, and frame rates.
In an optical microscope, magnification is a combination of objective and eyepiece. For a microscope set up for imag-ing, it is a combination of the objective, C-mount, and cam-era pixel and sensor size that defines the field of view (FOV), magnification, and resolution at the camera. Importantly, the view through the microscope is typically circular, and any available camera sensor FOV is typically rectangular or square. The result is that the camera FOV will never exactly match the full area possible on the microscope. It is com-mon practice to match the circular diameter of the micro-scope with the rectangular diameter of the camera sensor, so an 18.66 mm diagonal sensor would be used with a 19 mm diameter microscope FOV. A larger sensor camera could be used, but then there would be vignetting at the corners of the image, which is best avoided. The eye/brain combination is very forgiving of this, but digital sensors can be very sensi-tive to such uneven illumination. It is also possible to image with camera sensors that are smaller than the maximum FOV of the microscope. In this case, the image FOV will be smaller than the maximum available microscope FOV. This will result in a higher-magnification image, however, there reaches a point where high magnification does not improve the resolution or increase the information in the image. Typically, this is compensated for by using C-mounts with additional optics to demagnify the resulting image. This is demonstrated in Figure 4. To ensure the best quality image without vignetting, typically the best solution is to choose a sensor and C-mount combination where the rectangular area of the sensor just fills the circular FOV of the microscope, as shown in Figure 4iii–4iv. This maximizes the final image size without having to crop out the vignette.
Camera resolution is certainly a key parameter to con-sider in an imaging system but should not be taken as a
Figure 1: Lateral piezoresponse force micrographs for a potassium-sodium ferroelectric film measured at different temperatures (a)–(d). Upon heating above 110°C, the periodic MC domain structure vanishes until it reappears when cooling down again. Image reproduced from [1], used under a Creative Com-mons Attribution (CC BY 4.0) license.
Figure 2: Large single crystals can be formed by precise gradient-temperature scanning, from a higher hold temperature (approx. 37°C) to a low temperature stage (33–35°C). The size and color of the crystal are dependent on the cooling conditions—in this example, a liquid crystal is cooled from a blue phase (BPII) to form green crystals in its BPI phase. Image composed of Figures 2 and 3 from [2], used under a Creative Commons Attribution (CC BY 4.0) license.
Dow
nloaded from https://w
ww
.cambridge.org/core . IP address: 65.21.228.167 , on 20 M
ar 2022 at 04:38:24 , subject to the Cambridge Core term
s of use, available at https://ww
w.cam
bridge.org/core/terms . https://doi.org/10.1017/S1551929520001558

Microscopy 101
46 www.microscopy-today.com • 2020 November
single quantitative value. Pixel size and pitch of the cam-era should be matched to the resolution of the microscope, which is governed by the numerical aperture (NA) of the
optical system. Due to the optical limitations of the micro-scope, increasing the number of pixels or decreasing their size does not necessarily provide higher resolution with, for example, a “high-resolution” camera often better suited to a low-magnification system such as a stereomicroscope, whereas a “low-resolution” camera with larger pixels is often better suited to a high-magnification compound microscope system where high dynamic range and high sensitivity may be required.
The overall dynamic range, that is, the ability to discrimi-nate between dark and light areas of an image, is also a key parameter to consider. This can be affected by pixel size, so while having small pixels may improve resolution, this gener-ally decreases the dynamic range. This is especially important in material science applications where observations of small changes in color are often a key measurement parameter. Cam-eras are generally limited to 8 bits per color in an RGB image, so it is important to ensure the camera can fill the full 8 bits in each channel.
Frame rate determines the smoothness of operation in live-view imaging. While higher frame rates produce smoother transitions, matching frame rate to the demands of the intended application is important, as is understanding the consequences of certain choices. For example, dimensionally larger images typically result in slower frame rates, while high frame rates
can quickly produce extremely large and unwieldly image data sets.
Integrated Dynamic Data and Image Acquisition Solutions
Linkam offers several integrated stage and image capture modules that are optimized for different applications. Their high-performance image capture module includes a new 3.2 Mp camera with a 4:3 aspect ratio that is an ideal fit for micro-scope imaging. The new camera provides an integrated imaging solution when combined with Linkam’s LINK software package and image capture module to enable image capture, synchronized with temperature control of a sample and cor-related with other controlled and mea-sured parameters.
LINK system control and image capture software supports a number of modules to optimize image-based sample characterization, making it extremely easy to automatically capture images at specified points during an experiment. Input triggers are stored and marked on a chart for easy synchronization with other equipment, and each image is stamped with the current temperature and other measured parameters so offline analysis is straightforward.
In addition, the LINK Extended Measurements module enables precise
Figure 3: An up-close image revealing the fracture and propagation of a crack in a thin polymeric film under tension on Linkam’s MFS tensile device, with mea-surements carried out using LINK extended measurements software module. Image © Linkam 2019.
Figure 4: Pathway from microscope view to captured image, demonstrating how (ii) the eye piece or C-mount contribute to vignetting and (iii) the camera sensor FOV should be positioned for optimal imaging of the region of interest (ROI).
Dow
nloaded from https://w
ww
.cambridge.org/core . IP address: 65.21.228.167 , on 20 M
ar 2022 at 04:38:24 , subject to the Cambridge Core term
s of use, available at https://ww
w.cam
bridge.org/core/terms . https://doi.org/10.1017/S1551929520001558

2020 November • www.microscopy-today.com 47
Microscopy 101
measurements to be taken from recorded images, providing information on changing size, shape, number and location of particles, and points of interest. These data can then be corre-lated with changing environmental parameters such as tempera-ture, humidity, vacuum, and pressure, as well as other measured parameters such as tensile or compressive force from Linkam’s MFS tensile stage and shear forces from the CSS450 shear stage.
Combining these imaging tools with one of Linkam’s tem-perature control stages provides a powerful sample character-ization platform across a broad range of applications, including geology, materials science, pharmaceuticals, and semiconduc-tor research.
In PracticeWith an optimized instrument setup in place, there are
many applications where dynamic imaging can add insight. Four examples of imaging involving samples are outlined below:
1. Flexible polymer thin films. Flexible electronic devices are becoming more widely used, with examples such as foldable phones and rollable LCD panels already commer-cially available, and wearable flexible devices for sensing and energy collection potentially available in the near future. In recent years, a great deal of research has been dedicated to the study of the mechanical failure of brittle thin films on a polymer substrate typically used for such devices. Tensile testing is one method that can be used to reveal the film properties. In recent work researchers at École Polytechnique Fédérale de Laus-anne in Switzerland were able to stretch thin polyethylene naphthalate (PEN) films, adhered to indium tin oxide (ITO) coatings, to strains of 120% of their origi-nal length and temperatures up to 150°C while observing their suitability as flexible semiconductors [3]. This allowed simu-lation of the environmental factors that these films should be able to withstand throughout the life of the flexible devices
in which they will be used. By imaging the samples under strain at an elevated temperature (Figure 5), the adhesion of PEN to the ITO coating was found to be dependent on temperature due to a soften-ing of the polymer substrate. They quan-tified the crack density—indicative of the material failure—using the images taken during the experiment. The fact that the material was more flexible but still func-tional at 150°C bodes well for its use, but as temperature increased, thermal expan-sion increased resistance and resulted in greater crack density as seen in Figure 5b.
2. Stress tests. Researchers in the Poly-mer Technology Group at the University of Salerno captured images of isotactic poly-propylene while the material underwent
shear stress in order to study the phenomenon of flow-induced crystallization [4]. This is an area of research that has attracted much interest because of an ability to control the morphology of these polymers and inform improved production processes like injection molding and extrusion.
A commercial-grade i-PP resin (T30 G from Montell Ferr-ara, Italy) was used for the experiments, and the observation of morphology and measurement of nucleation density was made with a polarized light microscope (Olympus BH-41) and a shear cell (Linkam CSS450). Images were captured with a color CCD camera. Images from these video sequences (Figure 6) allowed, for the first time, the group to quantitatively determine the crystal nucleation rate under different shear conditions and temperatures. They found that nucleation improved under continuous shearing and increased as a function of shear rate. Furthermore, they observed that nucleation density decreases on increasing the crystallization temperature.
3. Cryo-preservation. Red blood cells (RBCs) are an essential lifesaving resource. They are transfused into patients to increase RBC numbers because of acute blood loss, decreased RBC production in bone marrow, or decreased RBC survival, which places an individual at risk. The normal preservation strategies for collection and storage of RBCs have enabled blood banks to ensure a readily available and safe blood supply.
Figure 5: Optical micrographs of PEN taken at 18% strain, showing crack density at saturation for ITO/PEN samples at room temperature, 23°C (a) and at 150°C (b). The micrographs were taken with a green filter to emphasize contrast, and the loading direction was parallel to the scale bar in the micrographs. Sequential still images were captured at various temperatures between 23°C and 250°C using a Linkam TST350 tensile stage with an Olympus BX60 microscope, and CCD camera.
Figure 6: Micrographs of isotactic polypropylene (iPP) collected during the crystalization test under shear conditions at 140°C and shear rate of 0.11 s−1 at different shearing times. Images were captured with a color CCD camera on a shear cell (Linkam CSS450) under a polarized light microscope (Olympus BH-41).
Dow
nloaded from https://w
ww
.cambridge.org/core . IP address: 65.21.228.167 , on 20 M
ar 2022 at 04:38:24 , subject to the Cambridge Core term
s of use, available at https://ww
w.cam
bridge.org/core/terms . https://doi.org/10.1017/S1551929520001558
Microscopy 101
48 www.microscopy-today.com • 2020 November
However, the shelf life of RBCs stored in this way is limited to 42 days, potentially resulting in shortages of blood when high numbers of emergency blood transfusions are required. Cryo-preservation of RBC units can extend storage time to ten years, but this preservation method is not routinely used in transfu-sion medicine because current cryopreservation protocols do not permit the direct transfusion of RBCs immediately after thawing.
Current cryopreservation protocols rely on glycerol and controlled cooling rates prior to storage at −80°C. After thaw-ing and prior to transfusion, glycerol must be removed to avoid intravascular hemolysis. This is a time-consuming pro-cess requiring specialized equipment. Much interest has been shown in small molecule ice recrystallization inhibitors (IRIs) such as β-PMP-Glc and β-pBrPh-Glc. These inhibitors can prevent ice recrystallization, a process that contributes to cel-lular injury and decreased cell viability after cryopreservation.
Researchers at the University of Ottawa and Canadian Blood Services have used dynamic imaging to follow the prog-ress of the ice front, monitoring and measuring events in real time. In their work, cryomicroscopy was performed using a Linkam FDCS196 cryostage with a Nikon microscope [5]. Ice was nucleated using a liquid nitrogen-cooled probe.
Results show that the addition of 110 mM β-PMP-Glc or 30 mM β-pBrPh-Glc to a 15% glycerol solution increases post-thaw RBC integrity by 30–50% using slow cooling rates. They were able to conclude that small molecule IRIs show significant potential to preserve RBCs.
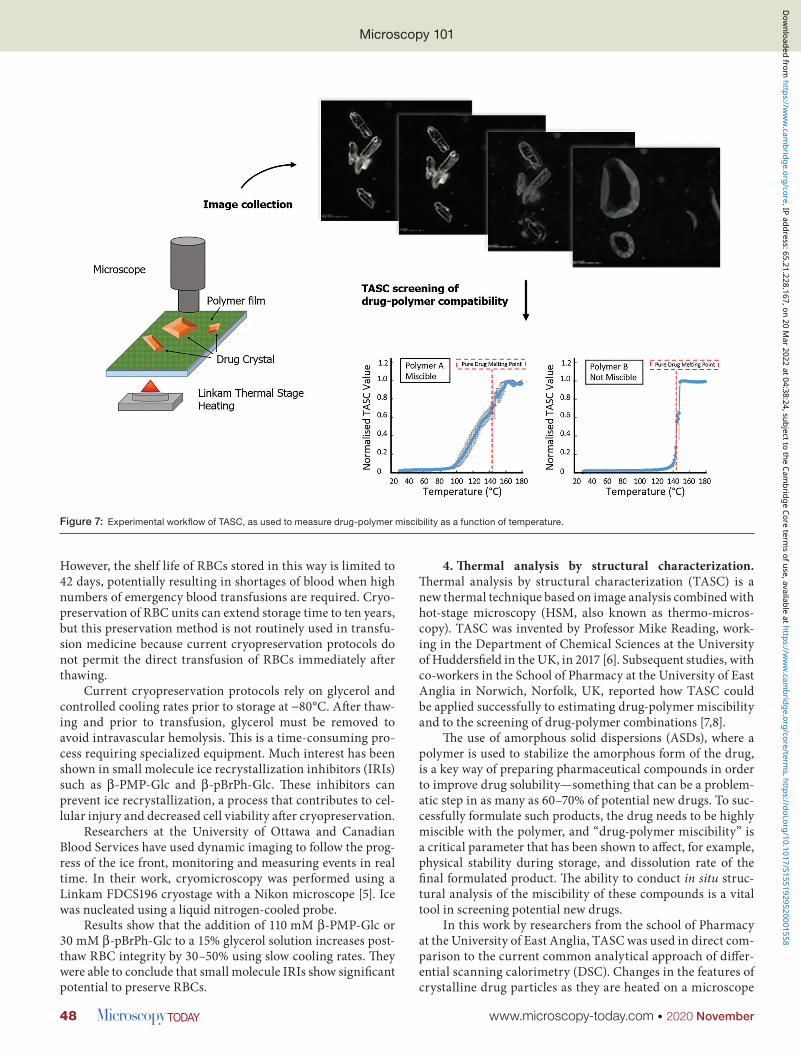
4. Thermal analysis by structural characterization. Thermal analysis by structural characterization (TASC) is a new thermal technique based on image analysis combined with hot-stage microscopy (HSM, also known as thermo-micros-copy). TASC was invented by Professor Mike Reading, work-ing in the Department of Chemical Sciences at the University of Huddersfield in the UK, in 2017 [6]. Subsequent studies, with co-workers in the School of Pharmacy at the University of East Anglia in Norwich, Norfolk, UK, reported how TASC could be applied successfully to estimating drug-polymer miscibility and to the screening of drug-polymer combinations [7,8].
The use of amorphous solid dispersions (ASDs), where a polymer is used to stabilize the amorphous form of the drug, is a key way of preparing pharmaceutical compounds in order to improve drug solubility—something that can be a problem-atic step in as many as 60–70% of potential new drugs. To suc-cessfully formulate such products, the drug needs to be highly miscible with the polymer, and “drug-polymer miscibility” is a critical parameter that has been shown to affect, for example, physical stability during storage, and dissolution rate of the final formulated product. The ability to conduct in situ struc-tural analysis of the miscibility of these compounds is a vital tool in screening potential new drugs.
In this work by researchers from the school of Pharmacy at the University of East Anglia, TASC was used in direct com-parison to the current common analytical approach of differ-ential scanning calorimetry (DSC). Changes in the features of crystalline drug particles as they are heated on a microscope
Figure 7: Experimental workflow of TASC, as used to measure drug-polymer miscibility as a function of temperature.
Dow
nloaded from https://w
ww
.cambridge.org/core . IP address: 65.21.228.167 , on 20 M
ar 2022 at 04:38:24 , subject to the Cambridge Core term
s of use, available at https://ww
w.cam
bridge.org/core/terms . https://doi.org/10.1017/S1551929520001558
2020 November • www.microscopy-today.com 49
Microscopy 101
slide in a linear fashion and melted on a thin layer of the poly-mer of interest were investigated. All experimental work was conducted using a Linkam MDSG600 motorized heating/freezing stage connected to an imaging station equipped with a reflective LED light source and a 10× magnification lens. A summary of the experimental workflow is shown in Figure 7, along with the images generated and two example traces—one for a polymer with good miscibility and one for a polymer that is immiscible. Here, alongside thermomechanical information provided by DSC, structural analysis of specific regions of the optical images is facilitated by TASC, allowing precise char-acteristics of the temperature-dependent phase changes to be quantified for particular points on the sample. This ensures an accurate observation of the drug melting point and is useful in cases where samples are inhomogeneous and may have local phase transitions not picked up by standard DSC.
SummaryDynamic imaging offers microscopists a powerful tech-
nique to extend their insight into materials of all kinds. Changes can be visualized, captured, and, in many cases, quantified. System selection and optimization is a multi- faceted process where traditional optical parameters must be considered together with detailed specifications of cameras and software. With an optimized system, dynamic imaging looks set to become a standard approach in many previously intractable applications.
References [1] L von Helden et al., Appl Phys Lett 114 (2019) 232905-1-5:
https://doi.org/10.1063/1.5094405. [2] C-W Chen et al., Nat Commun 8 (2017) 727–34: https://
doi.org/10.1038/s41467-017-00822-y. [3] Y Leterrier, Linkam Application Note Fragmentation
test method for adhesion analysis of coatings in situ in a microscope. Laboratoire de technology des composites et polymers, École Polytechnique Fédérale de Lausanne, Switzerland (2015). http://bit.ly/Linkam-Fragmentation-AppNote.
[4] A Arabino et al., Linkam Application Note Study of the effect of temperature and a steady state shear flow on the nucleation rate of spherulites in isotactic polypropylene. Polymer Technology Group of the Dept. of Chemical and Food Engineering, University of Salerno, Italy (2020). http://bit.ly/Linkam-ShearAppNote
[5] JG Briard et al., Sci Rep 6 (2016) 23619–28. [6] M Reading et al., “Local Thermal Analysis by Structural
Characterization (TASC)” in Thermal Physics and Thermal Analysis. Hot Topics in Thermal Analysis and Calorimetry, vol 11, eds. J Šesták et al., Springer, Cham. Switzerland, 2017.
[7] M Alhijjaj et al., Mol Pharmaceutics 15 (2018) 5625–36. [8] M Alhijjaj et al., Anal Chem 87 (2015) 10848–55.
Consumables & ServiceFIB or SEM - any OEM
Reduce maintenance costs with PBS&T™ components:• Extractors• Suppressors• Apertures• Precursor Refills
• Etching (XeF2, Bromine, Iodine)• Deposition (C, Pt, W, Mo, Cu, SiOx)• Custom Chemistries
We can support you with:• DIY maintenance training• On-site service and repairs• Installation and relocation• High voltage power supplies• Ion and electron optics• Preventive maintenance• Custom-made components• Aftermarket upgrades• Process development• Remote support
MEO Engineering Company, Inc.High Technology on a Small Scale since 2004
C
M
Y
CM
MY
CY
CMY
K
MEO Engineering Ad Consumables v030620 4Print.pdf 1 3/6/20 12:31
High Voltage PowerFIB, SEM or TEM - any OEM
Integrated Power Supplies:• High Voltage 3kV to 200 kV• Positive and Negative Polarity• FIB, SEM, TEM, SIMS, Auger• Ultra-low Noise for Source Testing and Electron/Ion Beam Lithography
• Ripple and Noise in PPM range• Long-term Stability in PPB range• True Micro-arc and Ripple Monitors
• Compact Versions for X-Ray Sources• Water-cooled High Power
Bipolar High Voltage Modules:• Voltage Output up to 30kV• True Zero Crossing• TOF-SIMS and Particle Accelerator
MEO Engineering Company, Inc.High Technology on a Small Scale since 2004
Fast Module +/- 10kV 1mSec
TEM 200kV: Ultra-stable,Ultra-quiet and Compact
50kV Field Emission Electron Source Testing
C
M
Y
CM
MY
CY
CMY
K
MEO Engineering HVPS v030620 4Print.pdf 1 3/6/20 12:44
Dow
nloaded from https://w
ww
.cambridge.org/core . IP address: 65.21.228.167 , on 20 M
ar 2022 at 04:38:24 , subject to the Cambridge Core term
s of use, available at https://ww
w.cam
bridge.org/core/terms . https://doi.org/10.1017/S1551929520001558