an exploratory evaluation of economic and environmental · pdf file ·...
TRANSCRIPT

The Centre For Business Relationships, Accountability, Sustainability and Society
WORKING PAPER SERIES No. 31
An Exploratory Evaluation of Economic and Environmental Efficiency of Solid
Waste Management in Welsh Small and Medium-sized Enterprises
Joseph Sarkis and Jeroen Dijkshoorn


2
An Exploratory Evaluation of Economic and Environmental Efficiency
of Solid Waste Management in Welsh Small and Medium-Sized
Enterprises
Joseph Sarkis1 and Jeroen Dijkshoorn
Abstract This paper provides an efficiency analysis of practices in Solid Waste Management of
manufacturing companies in Wales. We apply data envelopment analysis (DEA) to a data
set compiled during the National Waste Survey Wales 2003. We explore the relative
performance of small and medium sized manufacturing enterprises (SME; 10-250
employees) in Wales. We determine the technical and scale environmental and economic
efficiencies of these organizations. Our evaluation focuses on empirical data collected
from companies in a wide diversity of manufacturing industries throughout Wales. We
find significant differences in industry and size efficiencies. We also find correlations that
exist among environmental and economic efficiencies. These variations show that
improvements can be made using benchmarks from similar and different size industries.
Further pursuit of an investigation of possible reasons for these differences is
recommended.
1 This work was completed while Joseph Sarkis was a Visiting Scholar at the BRASS Institute at Cardiff University and Supported by ESRC Grant No. M568285001

3
About the BRASS Centre
In 2001, Cardiff University won £3.1 million in research funds from the Economic and Social Research Council to develop a Research Centre for Business Relationships, Accountability, Sustainability and Society (BRASS). The Centre is a joint venture between the University’s Schools of Business, City & Regional Planning and Law. It brings together the three Schools’ existing research expertise on issues of sustainability, business ethics, company law, corporate reporting and business communication. The Centre started work in October 2001 under the leadership of Professor Ken Peattie of the Business School, Professor Terry Marsden of the Department of City and Regional Planning and Professor Bob Lee of the Law School. The funding of the Centre covers an initial five-year period, but this should just mark the beginning of BRASS’ contribution to creating more sustainable and responsible businesses locally, nationally and globally.
Published by
The Centre for Business Relationships, Accountability, Sustainability & Society (BRASS)
Cardiff University 55 Park Place
Cardiff CF10 3AT United Kingdom
http://www.brass.cf.ac.uk
© BRASS Centre 2005
ISBNs 1 904393 66 7 (print) 1 904393 67 5 (web)

4
Introduction
Resources for essential environmental programs are in short supply in most small and
mediums sized manufacturing enterprises (SMEs). Competitiveness is vital for businesses
and most SMEs can’t afford to invest time or money to assess their environmental
performance, let alone improve it. In many cases SMEs put resources targeted for
environmental purposes into activities relating to environmental compliance; a reactive
approach. Businesses can manage better in these environments if they can become aware
of, and learn how well they are managing environmental and economic factors in their
organisations. Benchmarking processes can aid in this process and Data Envelopment
Analysis (DEA) can help in the benchmarking process for environmental and economic
efficiency assessment. This paper deals with provid ing such an analysis in solid waste
management efficiency using DEA techniques, providing some evidence of variations in
environmental and economic efficiencies of solid waste management among SMEs within
Wales. An assessment of these performance characteristics in a broad-scale study helps
both policy makers and organizations understand some characteristics of SME efficiencies
with some general guidance on comparative benchmarking directions.
With this goal in mind, we provide an analysis of economic and environmental efficiency
in solid waste management over a number of industrial sectors among SMEs in Wales.
This analysis can be used to raise the awareness for various industrial sectors and
organisations that under-perform in this field. Also, more broadly, the findings of this
study can contribute to the literature by providing further insights on how industries are
performing, especially among the somewhat neglected SME organizational sector.
Industrial sectors and organizations that perform well can arrive at conclusions that they
are ‘on the right track’ and continue to progress. DEA can, to a certain extent, explain
possib le reasons for these efficiency or inefficiency results by examining industrial and
organizational size characteristics and influences. We also investigate the general
relationship between economic and environmental efficiency, or whether ‘win-win’ exists
in this situation. In addition, an examination of scale economies (returns to scale) can
provide insights into whether SMEs should be growing their efforts in this area by
investing additional resources to make further environmental or economic gains. We find
that environmental and economic efficiency, and indeed inefficiency, is related to the size
of the company or the industrial environment.

5
In presenting our study and findings we begin with a general discussion of the regulatory
and environmental context that these organizations face. This issue is important since it
lays the foundation on why these studies have become increasingly relevant to SMEs. We
then provide details on the study methodology including discussion of data acquisition, the
modelling approach used and its execution to arrive at our results. A presentation of the
results then follows with implications discussed in this and later sections.
The Regulatory and Environmental Context
In Wales, the UK and throughout the European Union (EU), the issue of solid waste
arisings has received continuous attention from policymakers, legislators, communities,
and industry. EU legislation (see Table 1 for regulatory policies from the EU, UK and
Wales that influence solid waste management practices), the prime source for
approximately 75% of UK environmental regulations, is the principle driving force behind
current changes to achieving sustainable waste management in the United Kingdom (UK).
Since the early 1990s, the EU has undertaken a proactive course of passing a number of
new directives relating to management of solid waste. The main challenge is the de-
coupling of economic growth and rising waste output i.e. to maintain the quality of life for
current and future generations with continuing economic growth and at the same time
decreasing waste output, in other words economic and environmental sustainability. The
EU’s environment policy is based on the win-win belief that high environmental standards
stimulate innovation and business opportunities. Waste is one area where such economic
and environment benefits may be achievable. This is partly due to the range of materials
involved, but also to the scale of the waste problem in Europe. For example, a total of 1.3
billion tonnes of waste is disposed annually within the EU, 40 million tonnes of this waste
is hazardous. The EU plans to achieve a 20% reduction in waste for final disposal
between 2000 and 2010, increasing to 50% by 2050 (European Commission, 2002), but
materials will still be available for recycling and treatment through other methods.
Currently, in the U.K. landfilling is the preferred method of waste disposal. However,
landfilling not only takes up valuable land space, it also causes air, water and soil
pollution, discharging greenhouse gases such as carbon dioxide (CO2) and methane (CH4)
into the atmosphere and toxic leachate into the earth and groundwater. A comprehensive

6
summary of environmental implications of solid waste for a variety of situations is shown
in Table 2. Landfilling is not a sustainable option; once in the ground the wastes or
resources are mostly lost. In addition, economically, UK landfill in tax is set to rise on an
annual basis (excluding gate fees up to £35 by 2010) but with an annual increase of just £3
per tonne it will remain in most cases the cheapest option. It remains to be seen if the tax
rise will cause ‘waste to be pushed up the waste hierarchy’ as envisaged by central
government.
Localized waste management requirements
In response to these solid wastes based issues, legislation from the EU has included an
avalanche of regulations. In addition, England and Wales waste regulations deriving from
Part II of the Environmental Protection Act 1995, control many aspects of how the
environment is protected and regulated in daily life. This Act provides the main statutory
waste framework. There are current and pending regulations under consideration to
implement the harmonisation requirements of the EU directives (see table 1). Wales is
also implementing its own ‘secondary’ legislation. Wales does not have any primary
legislative powers but it can and does pass secondary legislation. The Welsh Assembly
Government however is bound Central UK Government. This can restrict the options
available in Wales in how to tackle waste issues. For example, as the Welsh Assembly
Government has no tax raising powers, it cannot increase the Landfill Tax if it felt that in
Wales the level of taxation was still too low. Altogether though, it is obvious that with
these new regulations the cost of compliance and proper waste management is set to rise
and drive up the cost of running a business (e.g. pre-treatment of all hazardous wastes,
compliance with packaging regulations ). Environmental efficiency (resource efficiency,
process control, waste reduction) is the way to contain or even reduce the rising cost of
waste disposal and thus becomes economic efficiency.
Wales Waste Strategy and Industrial Pressures
The Welsh waste strategy recognises that “waste is Wales’ biggest environmental problem2” and
that Wales has to improve how it manages waste. The Assembly Government’s intention
for the waste strategy is:
2 Welsh Assembly Government, Wise about Waste: The National Waste Strategy for Wales, Part One, June 2002, v

7
“…to move Wales from an over-reliance on landfill to a position where it will be a model for
sustainable waste management…it will achieve this by adopting and implementing a sustainable, integrated
approach to waste production, management and regulation…that minimises the production of waste and its
impact on the environment, maximises the use of unavoidable waste as a resource…. (pg. vii)”
Wales is the only country in Europe where the devolved government has a duty (under
section 121 of the Government of Wales Act 1998) to promote sustainable development in
the exercise of its functions. Thus the Welsh waste strategy sets stricter targets (see Table
3) than those set in the UK Waste Strategy. More significantly, it also sets targets for the
commercial and industrial sector. Some of these targets are classed as ‘secondary targets’.
To meet the targets, the Assembly Government is relying not solely on how companies
will respond to the pressures from current European waste directives, but also from a
package of incentives and assistance to encourage Welsh businesses to adopt sustainable
waste management practices. The UK Waste Strategy encourages business to aggregately
achieve these reductions.
Economic Issues
In the last two decades Wales has undergone an economic transformation and today has an
economy based on a wider range of business sectors than was the case in the 1970s and
early 1980s. The transformation has included an aim to attract foreign owned corporations
via inward investment. Currently in Wales, manufacturing and construction employ about
28% of the workforce and represents over 28% of GDP in Wales, and therefore has a
substantial impact on the amount of waste generated. However, manufacturing in Wales is
undergoing decline and any opportunity to retain material (waste) value in Wales, and to
support businesses designed to use such wastes as secondary materials would help support
the economy, as well as meeting environmental targets.
As many management researchers have argued (e.g. van der Linde and Porter, 1995) waste
quantities are influenced by how efficiently resources are used in production and by the
quantities of goods produced and consumed. Waste is ultimately a reflection of the loss of
materials and can be a tangible representation of inefficient production practices and
unsustainable consumption and production. It imposes both economic and environmental
costs on society for its collection, treatment and disposal. A report published by the

8
Environment Agency in 2003 indicated that British manufacturing could increase profits
by as much as £2 - £3 billion per year from resource productivity.
Current Welsh practices of disposing waste to landfills are unsustainable, and landfill
capacity is declining (one anecdotal argument is that with ‘lots’ of holes from the Welsh
mining industry, this was not an issue, until very recently). There are currently no landfill
sites left in Wales that accept hazardous wastes, resulting in higher management cost
(transport, supply and demand imbalance). The majority of Welsh companies continue to
dispose of large quantities of waste to landfill (see Table 4) and as a result, Wales is near
the bottom of the European list of solid waste disposal best practice. At the heart of
current waste policies is the need for businesses to recognise that resource efficiency is a
central issue in the sustainability challenge. The impetus is to enhance competitiveness
through the better use of physical, human and financial resources, the reby creating equal
value with less impact.
SMEs’ Environmental Impacts
The EU defines SMEs as organizations between 10 and 250 employees, companies with
less than 10 employees are defined as micro-enterprises. Corporate environmental
research on SMEs, even though it continues to grow in recent years, still lacks the research
involving larger and multinational organisations, and in many ways has been largely
overlooked (Lefebvre et al., 2003; Williamson and Lynch-Wood, 2001; Worthington and
Patton, 2005). Investigation of environmental and economic efficiencies and some of the
characteristics of SMEs has been virtually non-existent.
It has become increasingly apparent that the environmental implications of SMEs can no
longer be ignored or ‘fall through the cracks’ of regulatory policy, especially in the UK.
There are approximately 3.7 million businesses in the UK, of which only about 7000 are
larger than 250 employees. SMEs represent about 38% of the UK’s Gross Domestic
Product and estimates are that they represent 70% of the pollution generated (Williamson
and Lynch-Wood, 2001). According to the UK government’s Small Business Services
department, in 2001 in Wales, 67% of employment and 61% of revenue was generated by
SMEs, with over 25% of the contribution derived from manufacturing SMEs. These
figures are quite significant because large numbers of SMEs that generate waste in

9
aggregate terms pose challenges to management resolution at policy as well as company
level. In addition to policy issues, SMEs also feel ‘greening’ pressures from industrial
customers in their supply chain to improve their environmental performance. Further
understanding of SMEs and their environmental efficiencies can benefit the SMEs,
regulators, and researchers.
‘You can’t manage what you can’t measure’
Efficiency evaluation through benchmarking and comparative evaluation of SMEs on
economic and environmental performance can prove valuable to SMEs in understanding
how to improve their own operations. Such evaluation may also help policy makers to
identify issues when developing environmental business support required to assist SME
environmental performance. It is important to choose the most appropriate benchmarks
for each industrial sector in which SMEs operate. Also, realising that a relationship exists
between environmental and economic efficiencies can help further motivate SMEs to
adopt practices that can be both environmentally and economically beneficial to these
organizations. This result may encourage proactive, not just reactive, reasons for the
adoption of environmentally sound practices.
Study Methodology
In the methodology discussion we shall first discuss the approach used to gather the data.
Then the methodological approach to calculate the performance and efficiency is broadly
presented.
Survey and Data Acquisition Methodology
In 2003 the BRASS Centre conducted the National Waste (Commercial and Industrial)
Survey Wales on behalf of the Environment Agency Wales (EAW). The EAW has a
statutory duty to report waste data statistics to the EU and also provides other stakeholders
with waste data.

10
The survey instrument was organized into three parts, part I required general information
from the company including confirming SIC code and full time employment equivalent
(FTE). Part II of the questionnaire noted the waste details, particularly:
• Types of waste (EWC Code);
• Quantity (either by weight or container type, size and quantity;
• Whether waste was special;
• The physical form of the waste;
• The waste management option;
• The waste contractor;
• Initial and final destination of the waste; and
• The cost of or income from the disposal.
Part III of the questionnaire asked the company questions about its general approach to
management of environmental issues.
After full agreement by facilities to be involved in this study, data was acquired by a team
of 13 surveyors who went through an intensive two-week training program. The training
program provided guidance into the survey, the data within the survey, and standardization
of the data collection process, and the data integrity process. This standardization reduced
the errors and bias that might occur with multiple surveyors gathering data. The surveys
were completed by the surveyors with observations (site inspections) made to confirm
waste stream data. Site inspection details are presented in Appendix A.
Data integrity was included in the follow-up to data acquisition from the facilities. The
project manager in the BRASS Centre carried out rigorous quality assurance on the data
and requested additional information where discrepancies in data were identified.
A stratified sampling procedure was designed drawing a random sample provided by the
British Office of National Statistics (ONS) interdepartmental business register database.
The data for this study was collected using broad-based site visits throughout Wales, using
a short survey questionnaire. To ensure consistency in data collection the data collected
was based on a series of predetermined categories:

11
• Standard Industrial Classification (SIC95) codes were used to identify business
sectors;
• European Waste Catalogue codes (EWC) were used to identify waste type;
• A standard set of conversion factors were developed by the EAW to calculate
weight from volume data;
• Standard lists were developed to define -
• waste management options;
• skip and container types;
• waste form (solid, liquid, sludge, etc.);
• hazardous/non hazardous ;
• waste contractor and waste carrier names; and
• initial and end destination local authority names.
The waste survey sample was designed to include 2210 companies. In this project it was
decided that sectors with a high economic impact on the Welsh economy would be
highlighted. The survey methodology used a stratified random sampling approach based
on SIC codes and number of employees (size) of a company. Each company within a
survey cell (SIC Code/size sub-sample) was randomly chosen. The ONS were provided
with the sample categorizations and were requested to provide the necessary randomly
generated populations, in this instance a total of 2210 companies. The sample was also
proportioned to each region within Wales. This breakdown allowed the sample to be
representative of Wales as it reflected the Welsh economy.
To ensure no bias appeared in the survey, the randomness of company selection had to be
maintained throughout the life of the survey. As a result, all companies had to be
approached in the order provided by the ONS. With a target of 2210 companies to be
surveyed, a sample of 7237 companies were randomly allocated by the ONS. Only the
companies on the first list of live 2210 companies, identified by appropriate coding could
be approached first. The remaining companies could only be approached in the necessary
order determined by the ‘Replacement company’ process. This was either to
‘Abandoned’, ‘Refused’ or ‘Uncontactable’. An explanation of these terms is as follows:

12
1. Abandoned companies were classified as those companies that had ceased to exist.
2. Duplicate companies were those companies who appeared more than once.
3. Uncontactable companies were not accessible by phone or postal.
4. Refusals – either due to unavailability of people or time frame of study or other
reasons.
In the overall study a total 2122 surveys were completed after site visits to SMEs in a
broad variety of industries and organisations. There were 1198 SMEs who did not
participate in the survey with 2122 respondents, a response rate of 64% (2122/3320). Of
these 1198 non-participants, 82 were abandoned because the companies did not exist, 76
were duplicates of other companies already included in the sample, 368 were
uncontactable for various reasons and 672 companies refused to participate. By removing
the abandoned, duplicate, and uncontactable companies from the sample size, the response
rate only including those that either responded or refused to respond for the total sample
was 85%. That is, the overall initial sample from this included a broad variety of
companies and sizes, including non-manufacturing and service organisations.
Since we wished to study manufacturing oriented companies we narrowed down our SIC
coded respondent companies (from the total survey respondents of 2122) to those
organizations that had between 10 and 250 employees. Using the EU designation
companies from 10-50 employees were defined as small, while those that ranged from 51-
250 employees were medium sized companies. We also eliminated companies that had
reported zero costs or wastes from our analysis. This reduced the total number of SMEs in
our sample to 299 companies.
A breakdown of the totals of respondent companies and response rates for each SIC and
Size category is shown in Table 5. In Table 5 we see that for the population we are
considering, the total actual sample that was originally selected was for 543 small
companies and 345 medium sized companies. The overall response rate for these samples
were 394 (73%) for the small companies and 276 (82%) of medium sized companies, for a
total of 670 responding companies. The individual SIC/Company response rate ranged
from 100% at the upper end to 47%. After further elimination of companies with missing
data we arrived at our final sample sizes. These included 178 small companies (33% of
the originally designated small enterprise sample population) and 121 medium-sized

13
enterprises (37% of the medium enterprise population). An evaluation of the final
eliminated companies with some missing data showed that their percentage of reported
waste was only 3% of the total responding companies 97% of the waste is accounted for in
the 299 reporting companies. These eliminated companies averaged 64 employees, a
similar average size to the remaining data set we use in our investigation.
Environmental and Economic Efficiency Models
The evaluation of the solid waste practices by Welsh SMEs will first require that we
examine the performance of these organizations by determining their environmental and
economic efficiencies. We will complete this process using DEA, a multifactor
productivity evaluation tool. The DEA methodology is useful here since we can
determine relative efficiencies of organizations by aggregating multiple factors of
performance into one measure of relative performance. It is also a valuable methodology
in that it allows a comparison of whether productivity characteristics exhibit varying
returns to scale. Detailed descriptions of the DEA methodologies are in the Appendix.
(For a more detailed discussion of applying DEA for environmental efficiency see
Dyckhoff and Allen, 2001; Sarkis and Talluri, 2004). What we shall describe here are the
factors and relationships we will be using to describe environmental and economic
efficiency.
The relative efficiency scores will first require that we determine input and output factors
that will be evaluated in a relative fashion amongst the various facilities we will be
investigating. DEA attempts to find weights that will maximize a given facility’s
productivity ratio making it look as good possible when compared to the productivity
ratios of other facilities. We shall now describe the multi- factor productivity ratios for the
environmental and economic efficiency scores.
Environmental Efficiency Model
In this study we have defined environmental efficiency on how well a facility or
organization can manage its wastes on a per employee basis. To do this we use a
multifactor environmental productivity model. For the multifactor environmental
productivity model we will utilize one input (employees) and two outputs. One output is

14
what we define as a ‘desirable’ output which is material that has been handled using
environmentally sound approaches. This output we describe as ‘recycled’ material. In the
survey we inquired about the waste management option organisations used and how much
waste was recycled, recovered, or reused. Other, less environmentally sound waste
management options included incineration and landfilling (either on site or off-site
treatment). Thus, in our model recycling practices are more preferable than the other
disposal techniques, based on the ‘waste management hierarchy’.
The second output for the environmental efficiency ratio is total waste generated, but is an
‘undesirable’ output. To incorporate total waste as an output we will take its inverse value
(i.e. now the larger value is more preferable as should be the characteristics of all outputs,
(see Ball et al. (1994) and Dychoff and Allen (2001), for various measures to deal with
undesirable outputs). Thus the environmental efficiency model is how effective they are
at managing their operations based on a per employee basis. We did not use other inputs,
e.g. costs, product units, or revenues due to the variations that exist among organizations
and facilities. For example, revenues may not be appropriate since some facilities were
stand alone facilities, while other facilities were subdivisions of larger organizations and
revenues would have been difficult to estimate for these types of organizations. Other
environmental factors may have been utilized, but since our study is focused on the
management of solid wastes, we focused on these aspects for our study.
Thus, the multifactor environmental productivity ratio to be evaluated is:
Envk = k
envk
kenvk
k
envk
EMPu
RvW
v
1
211
+ (1)
Where:
Envk is the environmental efficiency score for facility k;
Wk is the total waste generated for facility k;
Rk is the total amount of waste treated in an environmentally sound way by facility
k;
EMPk is the input of labor (number of employees) for facility k; envkv 1 = the weight to be assigned to environmental ratio output factor 1 by facility k.
envkv 2 the weight to be assigned to environmental ratio output factor 2 by facility k.

15
envku 1 = the weight to be assigned to environmental ratio input factor 1 by facility k.
Economic Efficiency Model
We have defined economic efficiency in our study as the capability to manage the wastes
generated and their management in a cost effective manner. Thus, an organization is
being economically efficient if it can manage its wastes on a low per unit cost measure.
Costs were arrived at by asking how much the facility spent on managing its solid waste
streams. Thus, these costs include only direct waste management expenses. This was the
only input factor. Three output factors were used, total waste generated, total waste
recycled, and hazardous waste generated. We do not view total waste generated as an
undesirable factor since we want to see how efficient they are on a waste (by weight) per
unit cost. In this situation the more waste they can manage on less cost the more
economically efficient they are. We also include more proactive management items like
recycled wastes. We include hazardous wastes as an output factor so that companies that
deal with these types of waste are not penalized because their cost structures may cause
them to pay more per unit. Incorporating hazardous wastes could actually benefit those
organizations who are cost efficient in managing these wastes.
Thus our multifactor economic productivity ratio to be evaluated is:
Ecok = k
ecok
kecokk
ecokk
ecok
CostuHvRvWv
1
321 ++ (2)
Where:
Ecok is the economic efficiency score for facility k;
Wk is the total waste generated for facility k;
Rk is the total amount of waste treated in an environmentally sound way by facility
k;
Hk is the total hazardous waste generated for facility k;
Costk is the input of waste management costs for facility k; ecokv 1 = the weight to be assigned to economic ratio output factor 1 by facility k.
ecokv 2 the weight to be assigned to economic ratio output factor 2 by facility k.
ecokv 3 the weight to be assigned to economic ratio output factor 3 by facility k.
ecoku 1 = the weight to be assigned to economic ratio input factor 1 by facility k.

16
Descriptive statistics, mean and standard deviations, for the input and output factors used
in this study are shown in Table 6. We show the statistics for the overall sample in our
study (between 10 to 250 employee number range) as well as the statistics for each group
of medium and small sized companies. The values for all three groups are presented due
to investigations within each full set of groups. We decided to also consider groupings of
smaller and medium sized groups, since DEA results may be sensitive to various issues
such as heterogeneity of data (e.g. widely different sizes of organizations). Thus, our first
test will be to determine if size differences (i.e. small versus medium organizations) are
related to efficiency differences.
Results and Discussion
In the results portion of this study we will focus on three primary results relating to
industry/size comparisons, a returns to scale evaluation, and an overview of the
relationships between economic and environmental efficiency performance. Some major
implications from our results are further divulged in our discussion section.
Industry-Size Comparisons
There are a series of results which we will consider in this study. We utilize the GTR
method of DEA (see Appendix B for further discussion) to determine the initial efficiency
scores for the complete data set of 299 companies. We complete a comparison of these
initial results to determine whether significant differences in efficiency score occur
between the small and medium sized enterprises sub-samples. To complete this initial
analysis, we use the Mann-Whitney U-test since DEA data is considered to be non-
parametric (Brockett and Golany, 1996). These results are shown in Table 7. We can see
that there are significant differences in the efficiency scores among small and medium
sized enterprises for both environmental and economic efficiencies. Thus, we will do
much of our testing using the overall data set, as well as separate data sets for small and
medium sized organizations to control for various size influences in our data set. In these
initial results we also find that smaller size organizations seem to be more efficient than
larger organizations (larger average ranks represent higher efficiency scores) in both
relative efficiency measures. The mean efficiency scores for environmental efficiency

17
seem to be larger than those for economic efficiency. This result signifies that SMEs are
actually closer to best practice when it comes to environmental efficiency per person
employed. The smaller the average score, the further away from the ‘most efficient’ unit
the average unit is. One other observation to make at this point is that even though the
mean economic efficiency score for small companies is less than the medium-sized
companies (-0.955 versus -0.950, respectively), the mean ranks clearly show better
(higher) average rank scores for smaller companies.
A second analysis involves evaluating industrial variations in environmental and economic
efficiency scores. Mean efficiency score results, by industry (SIC code) are shown in
Table 8. For each industry we report six scores, the means of the environmental and
economic efficiency scores for all size enterprises (EVA, ECA), small-sized enterprises
(EVS, ECS), and medium-sized enterprises (EVM, ECM) industries. The rankings for
each industry, using Kruskal-Wallis mean rank scores3 are shown in Table 9. As we can
see from these tables SIC 19 performed the best overall in almost all categories. But, in
this data sample the industry only included 2 enterprises. The industry with a substantial
number of companies in the cells (greater than 5) that consistently did well on mean rank
scores was the Other Non-Metallic Minerals (SIC 26) industry. Two industries, with a
significant number of respondents per cell, that performed relatively poorly in the various
efficiency scores were the Food Product and Beverages (SIC 15) and the Rubber and
Plastic (SIC 25) industries. A reason for this may lie in the fact that both these sectors
produce large quantities of wastes that are difficult to reduce or recycle and costly to
manage. Landfill is often the only option for these wastes.
Most industries and sizes seemed to be performing somewhat consistently in terms of their
relative environmental and economic rankings, no matter the size of the company or
sample set. Yet, counter examples do exist. For example manufacture of wood and wood
products (SIC 20) arrived relative results showing they were doing better in environmental
performance for medium sized enterprises but poorly in economic performance for their
medium sized enterprises. The small companies in SIC 20 seemed to be more balanced in
their relative rankings when compared to other industries. Yet another industry,
manufacture of fabricated metal products (SIC 28) seemed to be doing relatively poorly
3 We use Kruskal Wallis mean rank scores to do a relative evaluation across industries because determination of differences across industries will be evaluated using the Kruskal-Wallis non-parametric test.

18
on its small company environmental and economic performance, but relatively better than
average in its medium sized companies. Manufacture of radio, television and
communication equipment (SIC 32) was also enigmatic in that it did best on the average
ranks of its economic performance for medium sized companies, but relatively poorly in
economic performance for its small sized companies (it performed just the opposite for
environmental where it was one of the best for small and relatively worse for medium-
sized companies). A reason for this might be the fact that although a lot of the waste is
recycled, the output quantities are of such low volume that the companies cannot generate
any income from these wastes.
These results show that there might be benchmarking and learning opportunities not only
between industries, but also within industries among different sized organizations. Given
the scores and rankings for each industry, we will now determine if these differences are
significant. To determine whether significant differences occur for non-parametric DEA
data among a group of industries we apply the Kruskal-Wallis non-parametric test. The
results for each of the various efficiency scores of the three samples are shown in Table
10. In all cases we see that there are significant overall industry differences when it comes
to economic performance. Yet, no overall statistically significant industry differences
occur for the environmental efficiencies. Even though paired comparisons between best
and worst industries in each do show significant differences.
Returns to Scale
The next set of results that were calculated focus on the returns to scale for each of the
model categories. DEA-based returns to scale calculation procedures are described in
Appendix B. The results are shown in Table 10. Here we see that the preponderance of
the facilities in our study exhibit decreasing returns to scale, ranging from 86.5% of
facilities for the small company environmental efficiency evaluations, to 98.3% of
facilities for the small company economic efficiency evaluations.
When looking at the average size of the companies with each of these characteristics (the
final column of Table 11), we see that for the environmental efficiency evaluations in each
of our model categories (i.e. all companies, small only, medium only) the average size of
the companies that exhibit increasing returns to scale are smaller than the average size of

19
all companies in that model category. This result implies that smaller companies may
actually wish to expand to take advantage of their economies of scale related to improving
their environmental performance based on a per employee basis. The returns to scale for
the economic efficiency evaluations are more dispersed for the ‘all companies’ model
category, but clearly show an increasing returns to scale for larger when looking at small
and medium sized organizations. Here true economics of scale exist when organizations
seem to reach the upper ends of the scale (only 3 companies for each, but at the extreme
end of the size of the companies for these size categories). This result implies that there is
a threshold level where companies may start to take advantage of economically efficient
returns to scale and these levels are at the upper ends of the small and medium sized
company categories.
Correlations between Economic and Environmental Performance
To evaluate the relationship between the economic and environmental performance of
companies within our investigation we calculated the Kendall’s–Taub rank correlation
coefficient for the various environmental and economic efficiency scores. Positive and
significant correlations were found in all three samples; the full sample (.321 correlation
statistic, significant at .01 level), the medium-sized enterprise sample (.140 correlation
statistic, significant at the .05 level), and the small-sized enterprise sample (.156
correlation statistic, significant at the .01 level). These positive relationships support the
propositions that the relationship between good environmental and economic performance
is real and occurs, even within SMEs.
Discussion
Our first point of discussion is on the result that there are size differences in efficiency and
more interestingly, in both cases of environmental and economic efficiency, that smaller
organizations performed better. This result is consistent with results that show a
decreasing returns-to-scale for a vast majority of enterprises in our study, where these
larger enterprises are not taking advantage of their size.
A couple possible reasons for this occurrence may provide clues. The first is that smaller
enterprises may not have as complex a set of waste streams as medium sized enterprises.

20
Trying to manage a diversity of streams, many of which are not large enough to maintain
economically effective control of these streams, may be an ineffective strategy. However,
because some SMEs dispose of most their wastes through the Local Authority through
municipal trade / commercial waste routes, their costs are in fact far lower than for those
companies who use commercial waste disposal routes, meaning that such results may offer
a rather artificial picture of economic efficiency. Another reason may be evident if we
observe the descriptive statistics in Table 6. We see that the medium-sized enterprises
have to manage almost 25 times as much hazardous waste tonnage, on average, than
smaller organizations. This additional consideration may make them less economically
efficient due to the larger costs of managing hazardous wastes, but may also make them
less environmentally efficient since their worries are focused on managing the hazardous
wastes and not necessarily the total waste or introducing recycling type programs (the two
measures that were used for environmental efficiency). The other ratios of the statistics
were approximately at 4 or 5:1 medium to small sized ratio (for size, costs, total wastes,
recycled wastes measures). This is one area of study that needs to be advanced, but will
be left for future investigation.
Other, operational, explanations may also exist. For example smaller-sized enterprises
typically have less complex production processes and less diverse raw material input
resulting in less start-up/close down (set-up costs) waste, less maintenance down time,
easier to control resources management, all together providing an environment that
produces less waste. Also, smaller organizations tend to be operated as ‘job-shops’ that
focus on low output high value products, where raw materials and waste may be
substantially more valuable and thus managed more closely.
Practically, medium-sized enterprises should observe what makes smaller-sized
enterprises (both internally and external to their industries) are doing to manage these
streams. If simplification and removal of waste streams is the reason, then making some
of these streams disappear (through prevention programs) may be both environmental and
economic opportunities. If it is the hazardous waste difference, then prevention programs
focusing on these types of waste streams should take precedence, e.g. regeneration and/or
substitution of mineral oils, solvent s and paints.
Using inter- industry benchmarks is an improvement exercise that should also be pursued
for environmental performance management. There are clearly industries that have top

21
practices and some that do not perform so well. This situation occur s for both
environmental and economic efficiencies. That there are industrial differences is not truly
a surprising finding, yet, given that these companies are in the same situation with the
pressures they face from regulatory policy and size limitations /resources, they should
benchmark each other to see what operational and strategic characteristics may be
transferable from one industry to the other. For example, the availability of private or
public programs to aid industries in managing wastes may be available to a particular
industry and not to another. If we return to our hazardous waste argument, manufacturing
the materials rubber and plastics requires numerous hazardous chemical ingredients. This
may be the reason for the poor performance of this (SIC 25) industry. Another operational
factor that has a great influence on environmental as well as economic performance is the
residual value, the desirability or the recyclability of the wastes in question. For example,
an engineering company that uses significant amounts of aluminium will perform better
than a similar sized engineering company that uses mild steel as their main ingredient
because the income from residual wastes materials is higher. On top of that more valuable
material will motivate organisations to implement resource recovery programs and thus
balance their waste management costs.
We have also found that intra- industry differences also exist in a number of circumstances.
Industries have shown that they may perform better in some circumstance on
environmental performance, while poorly for economic performance. This situation may
also vary depending on whether we are considering smaller or larger organizations in the
same industry. One aspect to consider and research is why some industries are
consistently good performers (or bad performers) across the board. This may be a
systemic issue faced for all industry members and gets to the core of industrial differences
(rather than organizational differences). Industries that show variations in performance
based on size or whether they perform better on economic or environmental measures
clearly have room for improvement based on intra-industry comparisons. Thus, they may
be able to control their performance more effectively through management of operational
resources (e.g. management implementing an auditing system) that these enterprises can
control. One aspect of operational and strategic decision making, with industrial ecology
implications, is the proximity and location of facilities. Some companies are so rurally
located that transport cost made by recyclers or by themselves drive down the resale value

22
of the recyclate, often making it cheaper to landfill the waste. If this is the case, these
companies should actively try to prevent these wastes from being generated.
Another situation, that may be beyond the control of specific enterprises focuses on
infrastructural and regulatory policy that may influence the performance of organizations.
One of the bad performing industries, the food business, generates large quantities of
biodegradable waste. Apart from composting, for which the packaging would have to be
removed, there are no other true re-use or recycling, potentially profitable routes.
Traditionally this material would have been used as animal feed but this route is closed
since the foot and mouth crisis of a few years ago in the U.K.
Either way, it is clear that further investigation into the characteristics of good performers
and poor performers (whether they are industry or organizational-size based), would
provide additional insights into what good and bad operational and strategic practices
exist. The initial information from this study can be used to further evaluate data for
determination if certain programs (e.g. environmental management system
implementation) may help or hinder performance from both an environmental or
economic perspective.
One final finding in this study that supports the ‘win-win’ propositions is the apparent and
strong significance of the relationships between organizations that did well
environmentally and those that did well economically. There isn’t a direct relationship,
with numerous counter-examples, but there is a definite statistically significant pattern.
This is encouraging to both policy makers and industries who may wish to encourage solid
waste management improvements. Yet, within some industries (and this may be due to a
sample size issue) the relationships may not be as strong. To tease out this information on
why it may hold for some industries, and varying size organizations, while not holding for
other industries is something that should also be investigated.
Summary and Conclusion
Solid waste management is an important issue in most of Europe, the United Kingdom,
and especially Wales, which has had a history of poor performance in environmental
management. The negative impact of SMEs on solid waste management has not gone

23
unnoticed. A comparative evaluation of environmental and economic efficiencies using
industry and organizational-size characteristics for an initial investigation provides initial
policy and managerially valuable findings that can be used to improve the solid waste
management performance of SMEs. To explore these issues we used a sub-sample of a
broad-based study from Wales on waste management practices for SMEs. We applied
DEA to arrive at relative environmental and economic performance scores. Results
showed that various differences existed between small- and medium-sized enterprises,
various industries (but not as much as we initially thought would occur) and a significant
correlation between environmental and economic efficiencies. We also provided a
number of potential reasons based on operational, organizational, industry and regulatory
reasons for these differences. Teasing out these differences and relating them to other
organizational practices and programs is an avenue for furthering this exploratory
research.
There are some limitations in our research that need to be recognized. Even though we
had a broad-based sample from a wide variety of industries, many industries had only a
few representative enterprises in our sample. These smaller sizes may bias the results. In
addition, in our evaluation of the DEA models the selection of inputs and outputs that are
used to determine the efficiency scores can cause significant variations in the results. We
only used a small set of factors for inputs (e.g. cost and/or number of employees),
additional factors such as capital equipment investment, general environmental program
investments, not just costs of waste elimination, number of employees focused on
environmental issues, and other factors, may provide a more accurate, or at least variable
picture of the efficiencies. The same argument can be made for the output measures,
where other measures of environmental performance (emissions to air or water, for
example) could have been used. Investigating variations in input and output measures is
open for future research as well.
This research contributes to the body of literature to more fully understand the role that
SMEs play in the broader environmental management landscape.

24
References Ball VE, Lovell CAK, Nehring RF, Somwaru A. (1994) Incorporating undesirable outputs
into models of production: An application to U.S. agriculture. Cahiers d'Economique et
Sociologie Rurales 31: 59-73.
Banker, R.D., Charnes, A., and Cooper, W.W., (1984), “Some models for estimating
technical and scale inefficiencies in data envelopment analysis,” Management Science,
Vol. 30, pp. 1078-1092.
Brockett, P.L., and Golany, B., (1996), “Using rank statistics for determining
programmatic efficiency differences in data envelopment analysis,” Management Science,
Vol. 42, No. 3, pp. 466-472.
Charnes, C., Cooper, W.W., and Rhodes, E., (1978) “Measuring the efficiency of decision
making units,” European Journal of Operational Research. Vol. 2, pp. 429-444.
DEFRA, (2005), “Recycling and Waste” homepage
http://www.defra.gov.uk/environment/waste/index.htm.
Dyckhoff, H. and Allen, K. 2001. “Measuring ecological efficiency with data envelopment
analysis (DEA).” European Journal of Operational Research, vol. 132, No. 2, pp. 69-82.
European Commission, (2002), Choices for a greener future – the European Union and
the environment. European Commission, Brussels, Belgium.
Lefebvre, E., Lefebvre, L.A., and Talbot, S., (2003), “Determinants and Impacts of
Environmental Performance in SMEs,” R&D Management, Vol. 33, pp. 263-283.
Porter, M.E., and C. van der Linde (1995) ‘Green and Competitive: Ending the Stalemate’,
Harvard Business Review, Vol. 75, No. 3, pp. 120-134.

25
Sarkis, J., and S. Talluri, (2004), “Ecoefficiency Measurement Using Data Envelopment
Analysis: Research and Practitioner Issues,” Journal of Environmental Assessment Policy
and Management, Vol. 6, No. 1, pp. 91-123.
Seiford, L.M., Zhu, J., (1999a), “An investigation of returns to scale in data envelopment
analysis,” OMEGA, Vol. 27, No. 1, pp. 1-11.
Seiford, L.M., Zhu, J., (1999b), “Profitability and narketability of the top 55 U.S.
commercial banks,” Management Science, Vol. 45, No. 9, pp. 1270-1288.
Williamson, D., and Lynch-Wood, G., (2001), “A new paradigm for SME environmental
practice,” The TQM Magazine, Vol. 13, No. 6, pp. 424-432.
Worthington, I., and Patton, D., (2005), “Strategic intent in the management of the green
environment within SMEs,” Long Range Planning, Vol. 38, pp. 197-212.

26
Appendix A: Site Inspection and Observation Protocol The purpose of the site inspection is to ensure that all waste producing activities and waste
streams are identified and quantified and Part 2 of the form is completed accurately. The
visit would usually consist of an administrative part in which Parts I and III of the survey
were completed. Also at this moment in the survey there would be an initial discussion
about all possible waste streams, supported by available paperwork such as Duty of Care
(waste transfer) notes, waste management bills and permits and licences. The following
site inspection should then:
a) Ensure that all waste is accounted for;
b) Act as a check of the data (e.g. number of containers, waste types, size of
containers);
c) Assess the composition in percentage of mixed waste streams;
d) Identify all wastes associated with the waste producing activities;
e) Identify all wastes associated with non-producing activities;
f) Identify all one-off wastes that may have arisen once within that year (for example
refurbishment/new computers).
Inspection of operational and non-operational areas and waste storage areas is necessary to
identify and obtain key information on associated waste streams.
The site inspection also assisted the surveyor to determine the type and composition of
waste streams, which had already been identified. It was to ensure that all wastes were
identified and if the surveyor saw or expected a waste type from the activity, they could
then discuss with the company as to whether they did produce this waste type and if so
what they did with it.
The surveyors were also encouraged to look into mixed waste containers and with the
company representative assess the five main components with a percentage value. In
addition, where no container size was available, they were required to measure the
container.

27
After the site visit, the surveyor had to confirm all details required from Part II,
particularly expected wastes types that had not been identified by the company
representative. This also provided an opportunity for the company to ask any questions
and if assistance was required, passing on the relevant contact details for the EA Regional
Officers. Finally, if any data were missing, requests were made for the surveyor to make
arrangements to obtain the data in the future by e-mail or telephone follow-up.
In the ‘How to Complete a Site Visit’ guidance manual, the surveyors were provided with
a list of wastes commonly overlooked and were informed to ensure that they always asked
about these waste types.
After completion of the site visit and the data integrity procedure a computer generated
waste stream report of the collected data is sent to participating companies.

28
Appendix B: DEA Models and Extensions Basic Ratio-Based Technical and Scale Efficiency DEA Models
DEA productivity models for a given decision-making unit (DMU) can use ratios based on
the amount of outputs per given set of inputs. The definition of a DMU can vary greatly,
from individuals to countries, as long as the unit can be modeled with input and output
values. The definition in our case is a facility or company surveyed in our study. DEA
allows for the simultaneous analysis of multiple inputs to multiple outputs, a multi- factor
productivity approach. The general efficiency measure used by DEA is best summarized
by equation (B1).
EO v
I uks
sy kyy
sx kxx
=∑∑
(B1)
where:
(Eks) is the efficiency or productivity measure of DMU s, using the weights of test DMU k;
(Osy ) is the value of output y for DMU s;
(Isx ) is the value for input x of DMU s;
(vky ) is the weight assigned to DMU k for output y; and
(ukx) is the weight assigned to DMU k for input x.
In the basic DEA ratio model developed by Charnes, Cooper, and Rhodes (1978) (CCR),
the objective is to maximize the efficiency value of a test DMU k from among a reference
set of DMUs s, by selecting the optimal weights associated with the input and output
measures. The maximum efficiencies are constrained to 1. The formulation is represented
in expression (B2).
maximize EO v
I ukk
ky kyy
kx kxx
=∑∑
subject to:
E ks ≤ 1 s DMUs ∀ (B2)
u vkx ky, ≥ 0

29
This nonlinear programming formulation (B2) is equivalent to formulation (B3) (see
Charnes et al. (1978) for a complete transformation explanation):
maximize E O vkk ky kyy
= ∑
subject to:
E ks ≤ 1 s DMUs ∀
I ukx kxx
=∑ 1 (B3)
u vkx ky, ≥ 0
The transformation is completed by constraining the efficiency ratio denominator from
(B2) to a value of 1, represented by the constraint ∑ =x
kxkxuI 1.
The result of formulation (B3) (the CCR formulation) is an optimal simple or technical
efficiency value (Ekk*) that is at most equal to 1 (this formulation has also been defined as
the constant returns to scale formulation). If Ekk* = 1, then no other DMU is more
efficient than DMU k for its selected weights. That is, Ekk* = 1 has DMU k on the optimal
frontier and is not dominated by any other DMU. If Ekk* < 1, then DMU k does not lie on
the optimal frontier and there is at least one other DMU that is more efficient for the
optimal set of weights determined by (B3). The formulation (B3) is executed s times,
once for each DMU.
The dual of the CCR formulation (also defined as the envelopment side) is represented by
model (B4):
minimize θ
subject to:
s
OOO
III
s
kys
sys
sxs
sxs
DMUs 0
Outputs 0
Inputs 0
∀≥
∀≥−
∀≤−
∑
∑
λ
λ
θλ
(B4)
The CCR model has an assumption of constant returns to scale for the inputs and outputs.
To take into consideration variable returns to scale, a model introduced by Banker,

30
Charnes, and Cooper (1984) (BCC) is utilized. The BCC model aids in determining the
scale efficiency of a set of units (which is a technically efficient unit for the variable
returns to scale model). This new model has an additional convexity constraint defined by
limiting the summation of the multiplier weights (λ) equal to one, or:
∑ =s
s 1λ (B5)
The use of the CCR and BCC models together helps determine the overall technical and
scale efficiencies of the DMU respondents and whether the data exhibits varying returns to
scale.
A DEA-based model that can help discriminate among efficient and inefficient units is one
proposed by Rousseau and Semple (1995), which focuses on preservation of a unit’s
classification (e.g., changes required to input and output values to maintain a unit’s
classification as efficient or inefficient). This approach is based on determining a unit’s
sensitivity to changes in the data values. The formulation used here to evaluate the data
set is the generalized Tchebycheff radius of classification preservation (GTR) model (B6).
minimize α α+ −−
subject to:
λ α α
λ α α
λ
λ α α
s sx kx kxs k
kx
s sy ky kys k
ky
ss k
s
I I I I I
O O O O O
− + − ≤ ∀
+ − − ≥ ∀
=
≥
+ −
≠
+ −
≠
≠
+ −
∑
∑
∑
0
0
1
0
Inputs
Outputs
, ,
(B6)
where α+ is the distance of an efficient unit from the Pareto frontier and α− is the distance
of an inefficient unit from the Pareto frontier.
Unlike the other DEA models discussed above, the optimal value for this formulation can
be either negative (inefficient unit) or positive (efficient unit). The magnitude of the
objective value is also significant because it defines the robustness of the unit’s score.
Magnitudes of objective va lues can serve as good measures to discriminate among units
with similar classifications, and thus to rank the various units either efficient or inefficient.
Whereas the RCCR model is based on the CCR formulation, the GTR model is
underpinned by the BCC formulation.
31
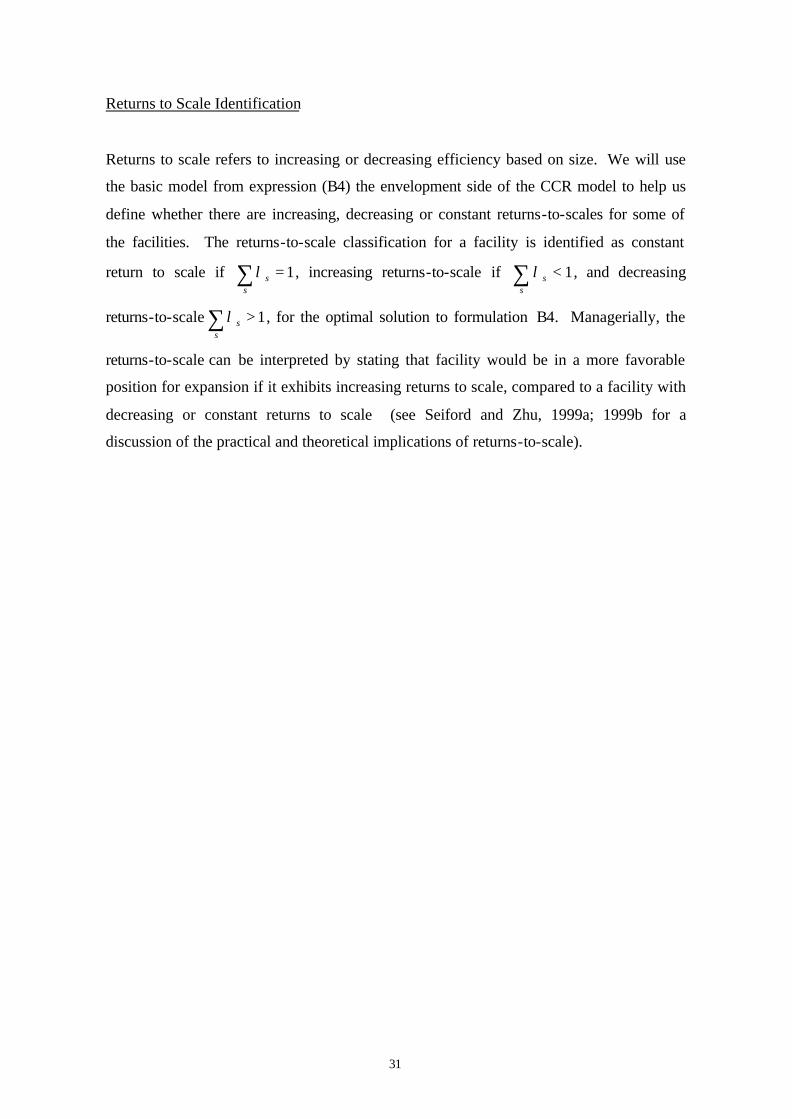
Returns to Scale Identification
Returns to scale refers to increasing or decreasing efficiency based on size. We will use
the basic model from expression (B4) the envelopment side of the CCR model to help us
define whether there are increasing, decreasing or constant returns-to-scales for some of
the facilities. The returns-to-scale classification for a facility is identified as constant
return to scale if ∑ =s
s 1λ , increasing returns-to-scale if ∑ <s
s 1λ , and decreasing
returns-to-scale ∑ >s
s 1λ , for the optimal solution to formulation B4. Managerially, the
returns-to-scale can be interpreted by stating that facility would be in a more favorable
position for expansion if it exhibits increasing returns to scale, compared to a facility with
decreasing or constant returns to scale (see Seiford and Zhu, 1999a; 1999b for a
discussion of the practical and theoretical implications of returns-to-scale).

32
Table 1. Current and Pending Legislation effecting Wales Corporate solid waste management practices: Batteries Directive (1991/157/EEC) Consultation on proposed Landfill (England & Wales) Regulations 2005 Directive on Integrated Pollution Prevention and Control (1996/61/EC) ELV- end of life vehicles Directive (2000/53/EC) End of Life Vehicles Regulation 2003, SI 2635 Environmental Protection (Duty of Care) (Amendment) (Wales) Regulation 2003, SI 1720 Environmental Liability Directive (2004/35/EC) Hazardous Waste Directive 91/689/EC (‘HWD’) Hazardous Waste Regulations (2005) Landfill Directive (1991/31/EC) Landfill (England & Wales) Regulation 2002, SI 1559 Packaging (Essential Requirements) Regulation 2003, SI 1941 Packaging Directive (94/62/EC) Producer Responsibility Obligations (Packaging Waste) (Amendment) (Wales) Regulation
2003, SI 3238 The European Waste Catalogue (2000/532/EC) The Restriction of Hazardous Substances in Electrical and Electronic Equipment (ROHS)
Directive (2002/95/EC) Waste Electrical and Electronic Equipment (WEEE) Directive (2002/96/ EC) Waste Framework Directive (75/442/EEC) Waste Incineration Directive (2000/76/EC) Waste Incineration (England & Wales) Regulation 2002, SI 2980 Waste Management Licensing (Amendment) (Wales) Regulation 2004, SI 70 Waste Statistics Regulation (2150/2002/EC).

33
Table 2: Impact of solid waste management activities on various media and geography4
Solid Waste Management Activities
Landfill Composting Incineration Recycling Transportation
Air Emission of CH4 Emission of CH4, CO2 odours
Emission of SO2, Nox, HCI, HF, CO, CO2, N2O, dioxins.
Emission of dust
Emission of dust Nox, SO2, release of hazardous substances from accidental spills
Water Leaching of salts, heavy metals, biodegradable and persistent organics to ground water
Deposition of hazardous substances on surface water
Waste water discharges
Risk of surface water and ground water contamination from accidental spills
Soil Accumulation of hazardous substances in soil
Landfilling of potentially hazardous slags, fly ash and scrap
Landfilling of final residues
Risk of soil contamination from accidental spills
Landscape Soil occupancy; restriction on other land use
Soil occupancy; restriction on other land use
Visual intrusion; restriction on other land uses
Visual intrusion
Traffic
Eco-systems Contamination and accumulation of toxic substances
Contamination and accumulation of toxic substances
Contamination and accumulation of toxic substances
Risk of contamination from accidental spills
Med
ia a
nd G
eogr
aphy
Urban Areas
Exposure to hazardous substances
Exposure to hazardous substances
Noise Risk of exposure to hazardous substances from accidental spills, traffic
4 Adapted from the Directorate-General Environment, Nuclear Safety and Civil Protection, European Commission, EU focus on waste management , 1999, 9
34
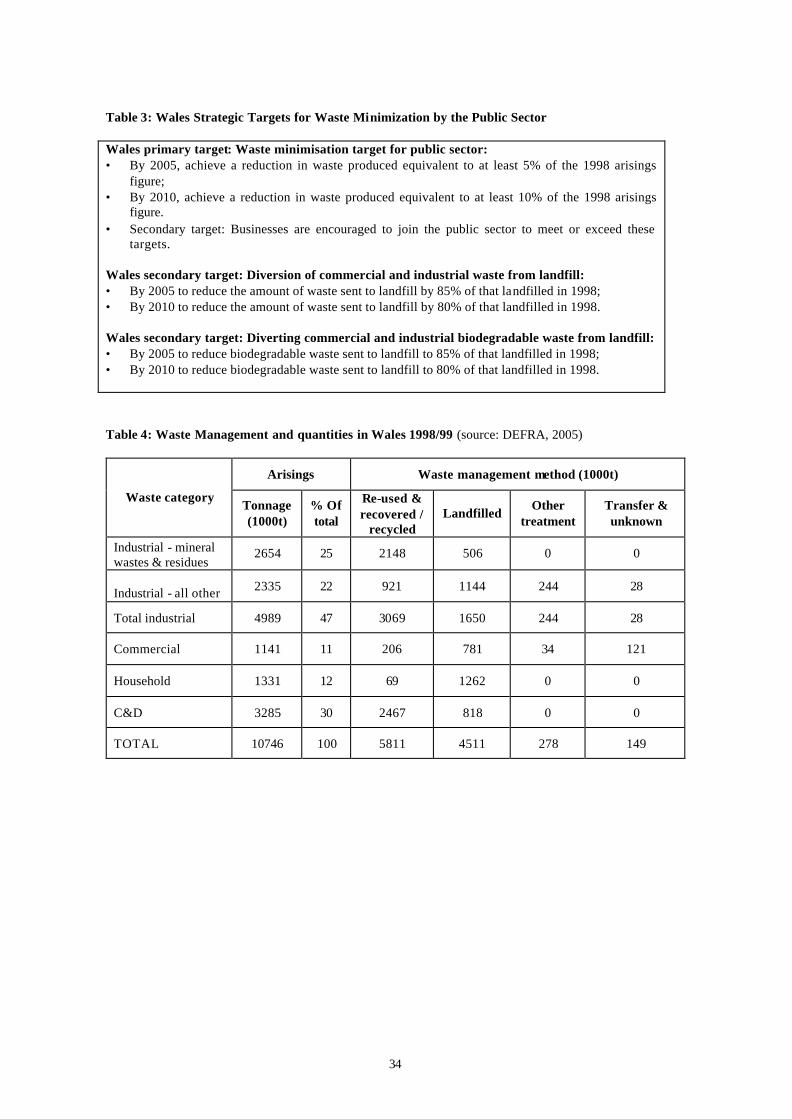
Table 3: Wales Strategic Targets for Waste Minimization by the Public Sector Wales primary target: Waste minimisation target for public sector: • By 2005, achieve a reduction in waste produced equivalent to at least 5% of the 1998 arisings
figure; • By 2010, achieve a reduction in waste produced equivalent to at least 10% of the 1998 arisings
figure. • Secondary target: Businesses are encouraged to join the public sector to meet or exceed these
targets. Wales secondary target: Diversion of commercial and industrial waste from landfill: • By 2005 to reduce the amount of waste sent to landfill by 85% of that landfilled in 1998; • By 2010 to reduce the amount of waste sent to landfill by 80% of that landfilled in 1998. Wales secondary target: Diverting commercial and industrial biodegradable waste from landfill: • By 2005 to reduce biodegradable waste sent to landfill to 85% of that landfilled in 1998; • By 2010 to reduce biodegradable waste sent to landfill to 80% of that landfilled in 1998.
Table 4: Waste Management and quantities in Wales 1998/99 (source: DEFRA, 2005)
Arisings Waste management method (1000t)
Waste category Tonnage (1000t)
% Of total
Re-used & recovered /
recycled Landfilled
Other treatment
Transfer & unknown
Industrial - mineral wastes & residues
2654 25 2148 506 0 0
Industrial - all other 2335 22 921 1144 244 28
Total industrial 4989 47 3069 1650 244 28
Commercial 1141 11 206 781 34 121
Household 1331 12 69 1262 0 0
C&D 3285 30 2467 818 0 0
TOTAL 10746 100 5811 4511 278 149

35
Table 5: Sample characteristics of industries and survey respondents
Total Sample Size Response Rate Final Sample Size SIC
SIC Classification Name
Small
Enterprises Medium
Enterprises Small
Enterprises Medium
Enterprise Small
Enterprises Medium
Enterprises Total
per SIC
15 Food Products and Beverages 65 43 49 (75%) 39 (91%) 26 (40%) 20 (47%) 46 17 Textiles 18 10 13 (72%) 10 (100% ) 6 (33%) 3 (30%) 9 18 Wearing Apparel Manufacture 8 5 5 (63%) 5 (100%) 1 (13%) 3 (60%) 4 19 Tanning and Dressing Leather 4 0 3 (75%) 2 (50%) 2 20 Wood Products 41 4 31 (76%) 4 (100%) 10 (24%) 2 (50%) 12 22 Pulp and Paper 36 13 21(58%) 12 (92%) 8 (22%) 4 (31% 12 24 Publishing and Printing 32 31 29 (91%) 22 (71%) 14 (44%) 12 (39%) 26 25 Rubber and Plastic 23 33 21 (91%) 28 (85%) 10 (43%) 16 (48%) 26 26 Other Non-Metallic Minerals 37 15 22 (59%) 11 (73%) 11 (30%) 6 (40%) 17 27 Basic Metals 26 22 21 (81%) 18 (82%) 7 (27%) 7 (32%) 14 28 Fabricated Metal (no machinery) 84 46 63 (75%) 36 (78%) 27 (32%) 18 (39%) 45 29 Machinery and Equipment 61 20 37 (61%) 14 (70%) 18 (30%) 5 (25%) 23 30 Office Machinery/Computers 3 3 2 (67%) 3 (100%) 1 (33%) 2 (67%) 3 31 Other Electrical Machinery 16 22 12 (75%) 16 (73%) 6 (38%) 3 (14%) 9 32 Radio, Television and Communication 8 7 8 (100%) 4 (57%) 4 (50%) 3 (43%) 7 33 Medical, Precision, Optical 14 12 11 (79%) 8 (67%) 5 (36%) 3 (25%) 8 34 Motor Vehicles, Trailers 15 14 7 (47%) 12 (86%) 4 (27%) 5 (36%) 9 35 Other Transport 12 9 9 (75%) 7 (78%) 3 (25%) 1 (11%) 4 36 Furniture and other 40 36 30 (75%) 27 (75%) 15 (38%) 8 (22%) 23
Total Number of Companies 543 345 394 (73% ) 276 (82%) 178 (33%) 121 (37%) 299

36
Table 6: Descriptive Statistics of Input and Output Factors for Various Organizational Size Samples in DEA Runs
Employee Size Ranges
(N= Employee #)
Employees (# FTE)
Costs (£)
Total
Wastes (Tons)
Recycled Wastes (Tons)
Hazardous Wastes (Tons)
Mean 61.8 12930.8 3289.9 402.3 44.1 10<=N<=250 Std. Dev. 54.9 34297.2 33525.3 2780.6 232.5
Mean 25.9 5506.5 1452.9 167.9 4.5 10<=N<=50 Std. Dev. 11.8 14172.0 15024.4 1151.4 15.8
Mean 114.5 23852.5 5992.3 747.2 102.4 50<N<=250 Std. Dev. 50.9 49322.0 49549.7 4136.2 358.5
Table 7: Statistical Results of Differences in Environmental and Economic Efficiency Scores by Size of Company Category
Efficiency Type
Size Number of Companies
Mean Score
Mean Rank
Sum of Ranks
M-W Test Statistic
Significance
Environmental Efficiency using GTR
Small Medium
178
121
-0.498
-0.874
209.4
62.6
37270
7580
199
.000**
Economic Efficiency using GTR
Small Medium
178
121
-0.955
-0.950
172.4
117.0
30692
14158
6777
.000**
Significance levels (two-tailed): ** = .05 or better

37
Table 8: Environmental and Economic Mean Efficiency Scores of Small and Medium Enterprises Categorized by Industry SIC codes
SIC EVA+ ECA EVS ECS EVM ECM
Mean -0.693 -0.980 -0.500 -0.879 -0.538 -0.992 15 Std. Dev. 0.290 0.050 0.379 0.367 0.226 0.014
Mean -0.538 -0.970 -0.377 -0.743 -0.313 -0.990 17 Std. Dev 0.399 0.028 0.399 0.519 0.232 0.002
Mean -0.700 -0.952 -0.135 -0.815 -0.421 -0.995 18 Std. Dev. 0.379 0.091 * * 0.276 0.004
Mean -0.177 -0.557 -0.177 -0.533 ** ** 19 Std. Dev 0.597 0.388 0.597 0.401 ** **
Mean -0.544 -0.951 -0.485 -0.903 -0.325 -0.998 20 Std. Dev. 0.250 0.087 0.227 0.090 0.366 0.001
Mean -0.616 -0.987 -0.479 -0.923 -0.474 -0.994 22 Std. Dev 0.290 0.009 0.260 0.089 0.276 0.002
Mean -0.665 -0.903 -0.482 -0.791 -0.379 -0.813 24 Std. Dev. 0.269 0.361 0.242 0.318 0.260 0.528
Mean -0.765 -0.991 -0.541 -0.984 -0.535 -0.990 25 Std. Dev 0.234 0.009 0.245 0.010 0.174 0.013
Mean -0.492 -0.743 -0.419 -0.615 -0.189 -0.529 26 Std. Dev. 0.411 0.573 0.226 0.639 0.594 0.779
Mean -0.666 -0.969 -0.453 -0.945 -0.495 -0.960 27 Std. Dev 0.300 0.038 0.294 0.048 0.285 0.056
Mean -0.655 -0.969 -0.513 -0.894 -0.361 -0.962 28 Std. Dev. 0.260 0.032 0.248 0.225 0.206 0.044
Mean -0.602 -0.971 -0.526 -0.952 -0.357 -0.954 29 Std. Dev 0.244 0.035 0.219 0.048 0.234 0.073
Mean -0.790 -0.992 -0.565 -0.988 -0.521 -0.989 30 Std. Dev. 0.197 0.004 * * 0.183 0.005
Mean -0.616 -0.972 -0.481 -0.566 -0.486 -0.990 31 Std. Dev 0.287 0.030 0.254 0.439 0.384 0.006
Mean -0.597 -0.904 -0.379 -0.976 -0.443 -0.675 32 Std. Dev. 0.329 0.156 0.258 0.024 0.257 0.434
Mean -0.688 -0.966 -0.552 -0.888 -0.562 -0.958 33 Std. Dev 0.209 0.025 0.121 0.106 0.073 0.059
Mean -0.724 -0.967 -0.522 -0.954 -0.414 -0.932 34 Std. Dev. 0.214 0.047 0.147 0.073 0.195 0.107
Mean -0.828 -0.988 -0.787 -0.979 -0.746 -0.983 35 Std. Dev. 0.083 0.002 0.014 0.010 * *
Mean -0.655 -0.969 -0.536 -0.871 -0.384 -0.976 36 Std. Dev 0.254 0.080 0.239 0.418 0.217 0.035
Mean -0.650 -0.950 -0.494 -0.864 -0.437 -0.931 Total Std. Dev. 0.285 0.188 0.269 0.313 0.260 0.261
+EVA – Environmental Efficiency Score for all SME’s; ECA – Economic Efficiency Score for all SME’s. EVS - Environmental Efficiency Score for small SME’s; ECS – Economic Efficiency Score for small SME’s. EVM - Environmental Efficiency Score for medium SME’s; ECS – Economic Efficiency Score for medium SME’s. * Only 1 company in this category **No companies in this category.

38
Table 9: Industry Results of Sample Industries using Kruskall-Wallis Mean Ranks (higher numbers represent better performing ranks)
SIC Code
EVA Rank
ECA Rank
EVS Rank
ECS Rank
EVM Rank
ECM Rank
15 131 93 77 64 46 30 17 176 177 104 110 82 64 18 115 105 157 155 66 35 19 251 292 130 162 ** ** 20 197 159 98 113 79 15 22 164 139 96 106 55 42 24 147 164 95 103 71 78 25 107 106 81 50 48 47 26 184 198 108 114 74 81 27 142 176 97 97 51 76 28 154 178 86 98 75 80 29 178 167 88 88 74 76 30 103 108 93 41 52 65 31 165 172 98 131 50 58 32 162 194 120 61 62 105 33 146 192 90 123 48 75 34 131 153 96 62 68 73 35 98 147 10 61 8 84 36 155 129 81 63 72 62

39
Table 10: Kruskal-Wallis Tests for Statistically Significant differences Among Industry
Efficiency Score+
χ2 statistic
Degrees of Freedom
Significance
EVA 25.36 18 0.115 ECA 53.29 18 0.000* EVM 17.45 17 0.424 ECM 42.73 17 0.001* EVS 16.77 18 0.539 ECS 40.07 18 0.002*
+EVA – Environmental Efficiency Score for all SME’s; ECA – Economic Efficiency Score for all SME’s. EVS - Environmental Efficiency Score for small SME’s; ECS – Economic Efficiency Score for small SME’s. EVM - Environmental Efficiency Score for medium SME’s; ECS – Economic Efficiency Score for medium SME’s. * Statistically Significant difference at < .005 level
Table 11: Number and Percentage of Companies Exhibiting Various Returns-to-scale Results of (CCR) Constant Returns-to-scale Model for Environmental and Economic Efficiencies for Model Groupings
Model Category
Efficiency Type
Returns-to-scale*
Number of Companies
Average Size of Company
IRS 37 20.6 Environmental DRS 260 67.7
(EVA) CRS 2 50.5 All Companies IRS 31 50.2
Economic DRS 262 62.7 (ECA) CRS 2 125.5
IRS 22 11.8 Environmental DRS 154 28
(EVS) CRS 2 21.5 Small-size Companies
Only IRS 3 50 Economic DRS 175 25.5
(ECS) CRS 0 --
IRS 5 55.4 Environmental DRS 113 118.4
(EVM) CRS 3 65.3 Medium-size Companies
Only IRS 3 244.7 Economic DRS 118 111.2 (ECM) CRS 0 --
*IRS = Increasing Returns-to-scale DRS = Decreasing Returns-to-scale CRS = Constant Returns-to-scale

40

41

42
Previously published in the BRASS Centre Working Paper series:
1. The power to panic: the Animal Health Act 2002 David Campbell and Bob Lee 2. Governance and sustainability: an investigation of the role of policy
mediators in the European Union policy process Andrew Williams 3. Exploring the 'limits to growth' in UK organics: beyond the statistical image Everard Smith and Terry Marsden 4. Shouldering the burden of corporate social responsibility: what makes business get committed? Heledd Jenkins and Frances Hines 5. The politics of divestment: passing the buck along the railway line Everard Smith 6. Linking the environmental and social dimensions of corporate social responsibility Andrew Williams 7. The SRI dilemma for pension fund trustees: some perceptions of their evolving role Aris Solomon and Jill Solomon 8. Waste policy in Wales: the case of construction and demolition waste Caroline Cohen, Andrew Flynn and John Ryder 9. Living differently?: an assessment of the first four years of the Welsh Assembly Government's sustainable development duty Andrew Flynn 10. A sustainable development agenda for the second term of the Welsh Assembly Government Andrew Flynn 11. System innovation in the automotive industry: achieving sustainability through micro-factory retailing Andrew Williams 12. An annotated bibliography of the accountability of multinational corporations: a review of international human rights law
Tamara Egede and Celia Wells

43
13. Manufacturing and trade in Wales: briefing paper for the Welsh Affairs Committee Jane Bryan, Calvin Jones, Max Munday and Annette Roberts
14. In search of ethical business leadership: time to mix our metaphors? Ken Peattie
15. The food supply chain and innovation: a case study of potatoes Natalia Yakovleva and Andrew Flynn 16. Communities and their quality of life: how local government is delivering sustainable development Andrew Flynn and Alan Netherwood 17. The battle for the consumers: building relationships in a new phase of contested accountability in the UK food chain
Samarthia Thankappan, Terry Marsden, Andrew Flynn and Robert Lee
18. Corporate social responsibility: engaging small and medium sized enterprises in the debate Heledd Jenkins 19. Trade and sustainability: promoting closer co-operation between the trade and environment regimes Andrew Williams 20. Innovation and the food supply chain: a case study of chicken Natalia Yakovleva and Andrew Flynn 21. The Food Standards Agency: making a difference? Andrew Flynn, Lisa Carson, Robert Lee, Terry Marsden and Samarthia Thankappan 22. Measuring sustainability: the role of ecological footprinting in Wales,
UK Andrea Collins and Andrew Flynn 23. Dichotomy between attitudes and environmental performance: a case of European SMEs Samarthia Thankappan, David Hitchens and Mary Trainor 24. Small businesses and stakeholders: towards successful, sustainable companies Heledd Jenkins 25. Understanding closed-loop supply chain management: a theoretical discussion
Margarete Seitz

44
26. Climbing the ESD pyramids: an exploration of the context for sustainable business education Ken Peattie 27. The contested regulation and the fresh fruit and vegetable sector in Europe
Samarthia Thankappan and Terry Marsden
28. The strategic management of product service systems Andrew Williams 29. Is waste minimisation a challenge too far?: the experience of household waste management and purchasing in the UK
Louise Obara
30. Bank lending and environmental liability Robert Lee and Tamara Egede

45

46

47
ISBN 1 904393 67 5