an examination of minneapolis-saint paul metro residents
TRANSCRIPT

2009 Metro Residents Survey An examination of Minneapolis-Saint Paul metro residents’ concerns and attitudes about the region
February 2010

Metropolitan Council Members Peter Bell, Chair
Roger Scherer District 1 Tony Pistilli District 2 Robert McFarlin District 3 Craig Petersen District 4 Polly Bowles District 5 Peggy Leppik District 6 Annette Meeks District 7 Lynette Wittsack District 8
Natalie Haas Steffen District 9 Kris Sanda District 10 Georgeanne Hilker District 11 Sherry Broeker District 12 Richard Aguilar District 13 Kirstin Sersland Beach District 14 Daniel Wolter District 15 Wendy Wolff District 16
The mission of the Metropolitan Council is to develop, in cooperation with local communities, a comprehensive regional planning framework, focusing on transportation, wastewater, parks and systems, that guides the efficient growth of the metropolitan area. The Council operates transit and wastewater services and administers housing and other grant programs.
General phone 651-602-1000
Regional Data Center 651-602-1140
TTY 651-291-0904
E-mail [email protected]
Council Web site www.metrocouncil.org
On request, this publication will be made available in alternative formats to people with disabilities. Please call the Metropolitan Council Data Center at 651-602-1140 or TTY 651-291-0904. Printed on recycled paper with a minimum of 20% post-consumer waste. Publication No. 74-10-017
390 Robert Street North, Saint Paul, Minnesota 55101

Executive Summary i
Executive Summary 2009 Metro Residents Survey Quality of Life Positive feelings about the Twin Cities region have been consistent over three decades
of Metropolitan Council surveys; 96 percent of residents said the region is a better or much better place to live than other metropolitan areas.
When asked about the Twin Cities region’s most attractive feature, 35 percent
identified the region’s parks, trails, lakes and natural environment. Other assets cited include arts and cultural opportunities (7 percent), people and population diversity (7 percent), beautiful cities and downtown areas (7 percent), good neighborhoods and neighborhood characteristics (7 percent), and other quality of life characteristics (6 percent). These results are fairly consistent over repeated, annual polls of the region’s residents.
Issues Facing the Region Asked about issues facing the region, 29 percent named traffic congestion, road
conditions, limited transit options or other transportation challenges as the region’s single most important problem. Still, the incidence of transportation problems identification has trended downward for the past six years.
Overall concern: Top three problems identified, 2009
0% 10% 20% 30% 40% 50%
Environment
Housing
Taxes
Government
Education
Growth Issues
Social Issues
Economy
Crime
Transportation
Share of respondents concerned
Most important
Top 2
Top 3
n=1337, confidence +/-3%
This is a different way of looking at problems. Survey respondents identified a most important problem, as well as second and third additional problems.
Respondents could list up to three problems, so the total will be greater than 100%.

Executive Summary ii
The Metro Residents Survey asks participants to name up to three major problems facing the region. This allows a broader scan of emerging regional concerns. As in past years, substantial pluralities of the public are concerned about transportation (50 percent) and crime (37 percent). However, the full set of opinions expressed was more diverse in 2009 than in the six preceding years.
Foremost as an emerging concern is the economy: In 2009, 29 percent named the
economy as a “top 3” concern. Concern over the regional economy recurs in tandem with national recessions. There was a similar level of worry during the recessions of 1992 and 2001.
Commuting Solutions The Twin Cities has an auto-dominated transportation environment: 78 percent of
commuting workers drive alone. Drive-alone incidence is highest in rural areas (86 percent) and developing communities (85 percent) where vehicles slightly outnumber adult drivers.
Survey participants were asked about the likelihood of trying cost-reducing commuting
solutions. Fuel-efficient vehicles are the most popular cost-reducing solution: 41 percent of commuters said they are very likely to try a more fuel-efficient vehicle or have already switched to a more fuel-efficient vehicle.
In 2009, 27 percent of commuters said they are very likely to try public transit or
already use transit. The number of Twin Cities’ commuters who said they are very likely to try transit is larger than the number of commuters who currently take buses and LRT to work.
Residential Preference Five percent of survey respondents indicated they live in a rural setting; 8 percent in a
small town; 32 percent in a growing suburb; 30 percent in an older suburb; 20 percent in a central cities neighborhood; and 5 percent in a very urban or downtown setting.
One-quarter of Twin Cities’ residents said they would prefer to relocate or live in a
different type of area. A trend of rural or small town preference is apparent. If all residents who said they
preferred a rural setting actually lived in a rural setting, the region would experience a doubling of its rural population. The preference is problematic since greater population is what transforms rural areas and small towns into something else.
The Role of the Metropolitan Council Public approval of the Council’s performance in addressing regional issues is at a
historical high point: 47 percent think that the Council is doing a good or very good job; 38 percent think the Council is doing a fair job; and 15 percent think the Council is doing a poor job or worse.

Executive Summary iii
Rural residents in the region and those who expressed pessimism about the region’s quality of life are the most critical of the Council’s performance.
When Council programs and responsibilities are specifically listed, 9 out of 12 are
considered “very important” to majorities of Twin Cities residents. The highest ratings went to water supply and quality monitoring (82 percent said very important) and wastewater treatment (76 percent said very important). Also enjoying a substantial public consensus: natural resources and land conservancy, planning to accommodate the region’s growth, and the Metro Transit service network. These five programs received the highest overall importance scores in previous years as well.
For some programs, perceived importance varies with geographic situation. For all
programs, perceived importance is statistically associated with opinions of the Council’s performance serving the region. .

iv
Contents
Executive Summary ................................................................................................................ i
Section 1: Introduction.......................................................................................................... 1
Section 2: Quality of Region................................................................................................. 2
Section 3: Commuting Solutions ........................................................................................ 16
Section 4: Residential Preferences ...................................................................................... 22
Section 5: Metropolitan Council ......................................................................................... 26
Section 6: Methodology ...................................................................................................... 31
Appendix: Survey Questionnaire ......................................................................................... 34

Section 1: Introduction 1
Section 1: Introduction The Metropolitan Council conducts the Metro Residents Survey to assess what residents think about the region’s quality of life, leading regional problems and solutions, and the Council’s portfolio of responsibilities. The survey provides public opinion measurement that the Council can use to make the case for regional solutions. This report describes the findings of the 2009 Metro Residents Survey. The survey is an annual effort dating back to 1982. Many of the questions asked have been asked in past years and historical comparisons are provided. Metro area residents were randomly selected for inclusion in the survey’s geographically stratified sample. Survey data collection, via mail-returned survey questionnaires, online and telephone interviews, took place between October 16 and December 4, 2009. A complete discussion of the survey methodology is found in Section 6 of this report. The survey instrument is found in the Appendix.
Reading data in this report The report is organized by topic. Each section features a summary of key findings, followed by a discussion of sub-topics within that section. Data tables are found in each section, after the discussion of findings. Percentages are rounded to whole numbers; some tables may not add up to 100 percent. Not all respondents answered every question. The number of respondents answering any given question in 2009 is listed with each table and is noted as “n =.” Most results are reported through frequencies of responses and cross-tabulations. Segment analyses comparing public opinion in four geographic areas (central cities, developed suburbs, developing communities, and rural areas) are presented where results showed a meaningful difference between areas. Further analysis and survey datasets are available by contacting Todd Graham (651-602-1000) at the Metropolitan Council.

Section 2: Quality of Region 2
Section 2: Quality of Region Key Findings Positive feelings about the Twin Cities region have been consistent over three decades
of Metropolitan Council surveys; 96 percent of residents said the region is a better or much better place to live than other metropolitan areas.
The Twin Cities region has many attractive features and amenities. A variety of these
were mentioned by survey participants; 35 percent identified the region’s parks, trails, lakes and natural environment. Other assets cited include arts and cultural opportunities (7 percent), people and population diversity (7 percent), beautiful cities and downtown areas (7 percent), good neighborhoods and neighborhood characteristics (7 percent), and other quality of life characteristics (6 percent). These results are fairly consistent over repeated, annual polls of the region’s residents.
There is continuing concern that the region’s quality of life is slipping: 24 percent felt
that the quality of life has gotten worse in the past year. As a follow-up, survey participants were asked about problems facing the region.
Asked about issues facing the region, 29 percent named traffic congestion, road
conditions, limited transit options or other transportation challenges as the region’s single most important problem. Still, the incidence of transportation problems identification has trended downward for the past six years. The peak level of concern was in 2003.
The Metro Residents Survey asks participants to name up to three major problems
facing the region. This allows a broader scan of emerging regional concerns. As in past years, substantial pluralities of the public are concerned about transportation (50 percent) and crime (37 percent). However, the full set of opinions expressed was more diverse in 2009 than in the six preceding years.
Foremost as an emerging concern is the economy: In 2009, 29 percent named the
economy as a “top 3” concern. Concern over the regional economy recurs cyclically, in tandem with national recessions. There was a similar level of worry during the recessions of 1992 and 2001.
Taxes as a concern has varied minimally over the past decade. However, in 2009,
more residents (15 percent) identified government's function or effectiveness as a “top 3” concern. Among specific problems or complaints named by survey participants were: government spending, functional performance, politicians and political conduct, and stadium-building.
A minority of Twin Cities residents (22 percent in 2009) disapprove of growth in their
local community. This concern is down from peak levels in 2004-2006 as new construction and development activity have slowed dramatically.

Section 2: Quality of Region 3
Discussion Survey participants were asked how the Twin Cities compares to other metropolitan areas, what makes the region attractive, what problems are currently facing the region, and how those problems should be addressed.
The Twin Cities compared to other metro areas Positive feelings about the Twin Cities region have been consistent over three decades of Council surveys. The vast majority of Twin Cities residents (96 percent) consider this region a better place to live than other metropolitan areas. Most (53 percent) think that it is a “much better” place to live (Figure 1 and Table 2.01).
What makes the Twin Cities area an attractive place to live? Survey participants were asked to indicate what they think is the most attractive feature of the Twin Cities metro area today. The question was open-ended; the survey did not provide a pre-set list of choices. Responses were coded into summary categories and the results are presented in Figure 2 and Table 2.03. A combined 35 percent of residents think parks, trails, lakes or other aspects of the natural environment are the region’s most attractive feature (parks or trails, 22 percent; natural environment, 13 percent). Also highly rated were: arts and cultural opportunities (7 percent), people and population diversity (7 percent), beautiful cities and downtown areas (7 percent), good neighborhoods and neighborhood characteristics (7 percent), and other quality of life characteristics (6 percent). The distribution of responses in 2009 was very similar to and consistent with the distributions found in recent years’ surveys (Table 2.03). Few significant changes are notable: More residents are indicating appreciation of the cities and downtown areas (7 percent). Also 5 percent named professional sports; specifically residents indicated excitement about the 2009 Vikings season, a new Twins ballpark, and a new stadium at the University of Minnesota.
Changes in the quality of life More volatile than appreciation of the region is the perception of change: Is the quality of life holding steady or diminishing? Metropolitan Council originally asked this question to measure the perceived seriousness of the region’s problems. However, the response pattern over time has been counter-cyclical to national economic health (Table 2.02). Response to this question may say more about perceived security or insecurity of the world beyond the Twin Cities. In 2009, most residents (64 percent) think the Twin Cities’ quality of life stayed the same; 24 percent think it worsened. The opinion of declining quality of life peaked during 2005-2007. As a follow-up, survey participants were asked about problems facing the region. Over the past decade, substantial shares of the public have identified transportation or crime as the foremost major problems facing the region. Still, the full set of opinions expressed by survey participants is diverse.

Section 2: Quality of Region 4
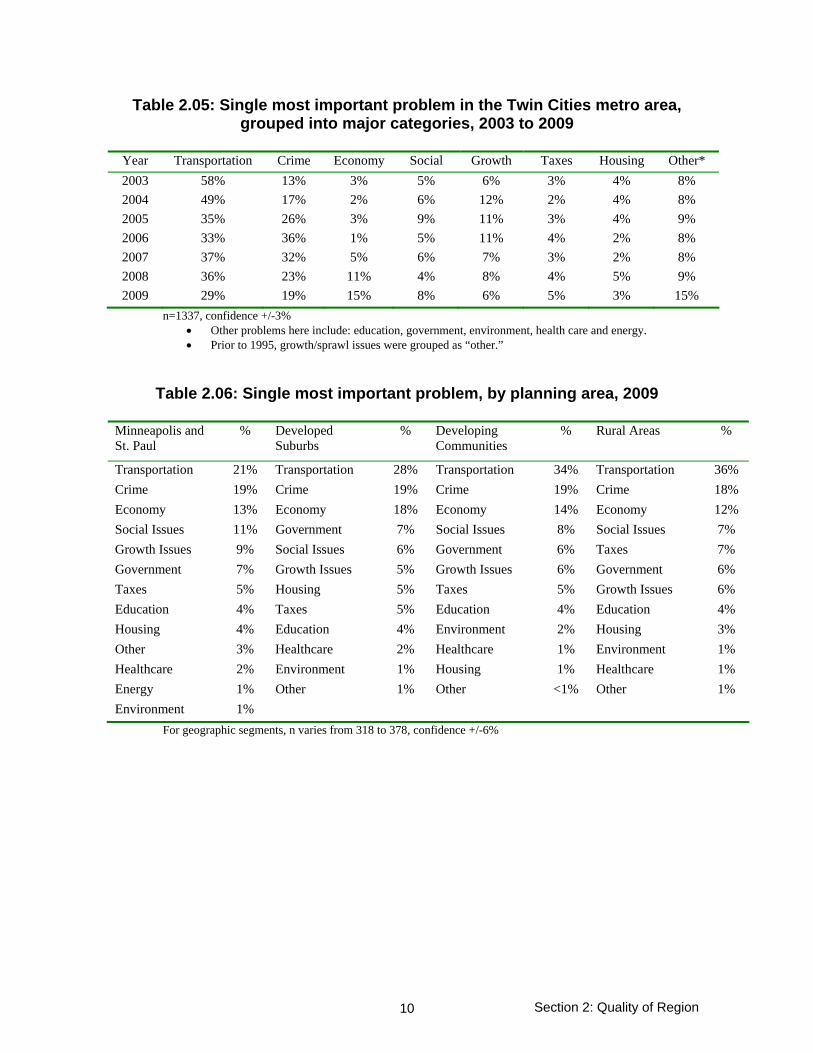
Top issue facing the Twin Cities metro area Residents were asked to identify the single most important problem facing the Twin Cities metro area today. They were then asked to suggest a solution to that problem. Residents were also asked to list up to three other important problems facing the region. Each of these questions was open-ended, with survey respondents describing issues and solutions in their own words. For analysis, all open-ended responses were categorized. (See Table 2.04 for categories and sub-categories used to code responses.) Transportation, which includes traffic congestion, road conditions, limited transit options, and related issues, was identified as the most important problem by 29 percent of survey participants. Still, the incidence of transportation problems identification has trended downward for the past six years. The peak level of public concern was in 2003. Figure 3 and Table 2.05 provide a time-series perspective of the single most important problem in recent years.
Top issue by sub-regional area To better understand local variations in public opinion, responses can be segmented by where respondents live. The 2009 Metro Residents Survey was designed to enable segment analysis for Minneapolis and St. Paul, developed suburbs, developing communities, and the remaining rural areas combined. Table 2.06 shows opinions on the most important issues by sub-region. In 2009, responses were similar in all parts of the region. In all parts of the region, transportation, crime and economy were the first, second, and third problems of greatest concern to residents. As in past years, concern over transportation issues grows with distance from the central cities and, presumably, with time spent commuting.
Top three issues facing the Twin Cities metro area The Metropolitan Council asks survey participants about the single most important problem, but also about second and third problems facing the Twin Cities. Identifying the “top 3” problems allows a broader survey of overall concern – the share of all residents who have an issue on their minds. Traffic congestion and other transportation problems are still the leading concerns when problems are considered cumulatively. Fifty percent expressed concern about transportation problems in 2009 (Table 2.07 and Figures 4 and 5). Concern was substantial in all parts of the region: 56 percent majorities in developing communities identified transportation as a first, second or third issue; 46 percent in the central cities were concerned about transportation problems (Table 2.08). Figure 6 shows a time series for traffic congestion, specifically, as one of the “top 3” problems facing the region. Traffic congestion began to emerge in the public consciousness in the late- 1990s. Measured time delays suffered by Twin Cities drivers

Section 2: Quality of Region 5
doubled between 1996 and 2000. Public concern about the issue followed suit, reaching a peak in Metropolitan Council’s 2003 survey. The trend of public opinion since 2004 seems to indicate either an acceptance or recognition that congestion levels and travel times have reached equilibrium or are no longer worsening (Figure 6). Travel times have not significantly worsened the past eight years (see Section 3 of report). Also notable in Figure 6 is the large share of residents who identify transportation as a regional issue without reference to traffic congestion. That is, respondents are naming transportation issues other than traffic congestion, or they are identifying transportation as a multi-faceted problem (extending beyond simply congestion), or in many cases they are identifying transportation generically (for example, with a one word answer: “transportation”).
Other problems Public concern over crime, as well as crime incidence, was very high in the 1990s. Like crime itself, the public concern persists. In 2009, 37 percent considered crime among the region’s “top 3” problems. Among emerging concerns – those mentioned more in 2009 than in past years – the economy was foremost on residents’ minds: In 2009, 29 percent named the economy as a “top 3” concern. This is up significantly from 12 percent in 2007; and 24 percent in 2008. Concern over the regional economy recurs in tandem with national recessions. There was a similar level of worry during the recessions of 1992 and 2001. Taxes as a concern varies minimally from year to year. Every year, 11 to 16 percent of Residents Survey participants comment on taxes (in 2009, 14 percent). However, in 2009 more residents (15 percent) identified government's function or effectiveness as a “top 3 concern.” This could mark an emergent shift in public opinion. Among specific problems or complaints named by survey participants were: government spending, functional performance, politicians and political conduct, and stadium-building. Growth and social issues were concerns for one in five residents. Most of these listed growth or social issues as second- or third-choice concerns.
Solutions to problems facing the Twin Cities area Participating residents were asked to suggest potential solutions to their single most important problem. Solutions related to transportation problems are listed in Table 2.09. In coding the responses, Council researchers worked to identify the primary solution emphasized, or otherwise, the first solution mentioned. Among Twin Cities residents most concerned about transportation issues, many suggested improving or increasing mass transit service (48 percent), or improving the road network (16 percent), or both (3 percent). Transit and roads are interdependent aspects of the problem. Respondents’ detailed responses provide evidence of broad public understanding of the complex systems nature of transportation networks and mobility.

Section 2: Quality of Region 6
Among residents who suggested mass transit solutions, their solutions can be split into two sub-groups, with half recommending mass transit generally, and half indicating LRT or commuter trains specifically. To resolve transportation issues, residents consistently suggest system solutions, rather than changing behavior or changing their own routines. However, elsewhere in this survey, many respondents did express interest in transit or car-pooling solutions (Section 3: Commuting Characteristics and Choices). Some of the suggestions for expanding or improving the transit system suggest a widespread, latent receptiveness of residents to transit service.
Perceptions regarding growth in the region and local communities Seventy percent of the region’s residents think the Twin Cities area, as a whole, is growing at about the right pace. Others indicate dissatisfaction: 25 percent think the Twin Cities area is growing too fast. Participants were also asked about growth in their own local communities: 69 percent think local growth is happening at about the right pace; 22 percent think local growth is advancing too fast. Growth patterns remain a concern for a substantial minority in newer suburban communities on the developing edge of the region (Table 2.10). Concern over local growth has moved in tandem with the boom and bust of new development activity (Figure 7). As a result, dissatisfaction is now at low ebb.

Section 2: Quality of Region 7
Figure 1: How would you rate the Twin Cities as a place to live, compared to other metro areas? 1982-2009
0%
10%
20%
30%
40%
50%
60%
70%
80%
90%
100%
82 84 87 89 92 94 96 98 '00 '03 '05 '07 09
Much worseSlightly worseSlightly betterMuch better
n=1427, confidence +/-3%
Table 2.01: How would you rate the Twin Cities as a place to live, compared to other metro areas? 2000-2009
2000 2001 2003 2004 2005 2006 2007 2008 2009
A much better place 47% 55% 47% 52% 48% 56% 52% 52% 53%
A slightly better place 50% 42% 49% 45% 48% 41% 42% 45% 43%
A slightly worse place 2% 2% 3% 3% 3% 3% 5% 3% 3%
A much worse place <1% <1% 1% <1% <1% 1% 1% 1% <1%
n=1389, confidence +/-3%
Table 2.02: Over the past year, do you think the quality of life in the Twin Cities has gotten better, stayed the same, or gotten worse? 2003-2009
2000/ 2001
2003 2004 2005 2006 2007 2008 2009
Gotten better 15% 12% 14% 17% 14% 13% 12%
Stayed the same 57% 64% 55% 51% 52% 61% 64%
Gotten worse
Not asked
28% 24% 31% 32% 34% 26% 24%
n=1394, confidence +/-3%

Section 2: Quality of Region 8
Table 2.03: What do you think is the single most attractive feature of the Twin Cities metro area today? 2005-2009
Most attractive feature: 2005 2006 2007 2008 2009
Parks and trails 23% 21% 26% 22% 22% Natural environment 14% 13% 9% 18% 13% Arts & culture 8% 10% 7% 7% 7% People or population diversity 5% 5% 4% 5% 7% Beautiful cities or downtowns 5% 4% 4% 3% 7% Good neighborhoods, clean, safe or family-friendly 8% 6% 5% 8% 7% Quality of life--good balance, spacious, convenient 2% 6% 7% 4% 6% Professional sports 2% 2% 2% 1% 5% Variety of things to do 7% 8% 8% 9% 4% Mall of America, retail in the metro 7% 5% 5% 4% 4% Good economy 4% 5% 5% 5% 3% Accessibility & closeness of destinations <1% <1% 2% 3% 3% Weather or climate 3% 2% 3% 2% 3% Education 1% 2% 2% 3% 2% Other positive responses 10% 12% 10% 7% 7% Negative response given 1% <1% 1% <1% 1%
n=1291, confidence +/-3%
Figure 2: What do you think is the single most attractive feature of the
Twin Cities metro area today? 2009
Natural environment13%
Professional sports5%
Quality of life--good balance, spacious,
convenient6%
Good neighborhoods,
clean, safe or family-friendly
7%
Arts & culture7%
Beautiful cities or downtowns
7%
People or population diversity
7%
Variety of things to do4%
Mall of America, retail in the metro
4%
Other responses18%
Parks and trails22%

Section 2: Quality of Region 9
Table 2.04: What do you think is the single most important problem facing the Twin Cities metro area today? 2009
Single most important problem: Percent Single most important problem: Percent Transportation – Total 29.0% Growth Issues – Total 6.4% Traffic congestion 13.0% Sprawl, outward growth 2.0% Mass transit 7.4% Immigration 1.6% Transportation (general) – including road adequacy, maintenance 7.3% Population, crowding, density 1.3%
Construction is too prevalent 1.0% Infrastructure, public spaces deterioration 0.6%
Bicycle-related issues 0.2% Urban decay 0.3% Amenities and attractions 0.3% Crime – Total 18.8% Not enough parks, open space 0.2% Crime (general) 14.9% Gangs 2.8% Taxes – Total 5.0% Drug related crime 0.4% Taxes (general) 4.1% Policing and criminal justice 0.3% Property taxes 0.9% Crimes by youth 0.2% Education - Total 4.0% Economy – Total 14.8% Education (general) 2.0% Unemployment, lack of jobs 11.4% Finance, support of education 1.6% Economy (general) 2.4% Quality of education 0.4% Business climate 0.5% High cost of living 0.5% Housing – Total 3.3%
Social Issues – Total 7.8% Housing cost and affordable housing availability 1.8%
Homeless, homelessness 1.9% Foreclosure crisis, market instability, declining values 1.2%
Welfare use, welfare abuse 1.2% Housing (general) 0.2% Poverty and social disintegration 1.1% Drug use (not including crime) 0.9% Health care – Total 1.5% Community, social compact 0.5% Health care cost and access 0.9% Discrimination or segregation 0.5% Health care (general) 0.6% Minorities 0.4% Abuse and family violence 0.3% Environment – Total 1.4% Politeness, neighborly consideration 0.2% Pollution (general) 0.4% Youth problems 0.2% Trash, litter, graffiti 0.4% Child rearing 0.2% Environment (general) 0.2% Air pollution 0.2% Government – Total 6.7% Water quality 0.2% Government funding, spending 2.8% Government (general) 1.2% Energy – Total 0.2% Politics, politicians 1.1% Energy prices, conservation 0.2% Stadium issues 0.6% Metropolitan Council 0.5% Other 1.1% Federal government 0.2% Minnesota's governor 0.2% Total 100.0%
n=1337, confidence +/-3%
Section 2: Quality of Region 10
Table 2.05: Single most important problem in the Twin Cities metro area, grouped into major categories, 2003 to 2009
Year Transportation Crime Economy Social Growth Taxes Housing Other*
2003 58% 13% 3% 5% 6% 3% 4% 8%
2004 49% 17% 2% 6% 12% 2% 4% 8%
2005 35% 26% 3% 9% 11% 3% 4% 9%
2006 33% 36% 1% 5% 11% 4% 2% 8%
2007 37% 32% 5% 6% 7% 3% 2% 8%
2008 36% 23% 11% 4% 8% 4% 5% 9%
2009 29% 19% 15% 8% 6% 5% 3% 15%
n=1337, confidence +/-3% Other problems here include: education, government, environment, health care and energy. Prior to 1995, growth/sprawl issues were grouped as “other.”
Table 2.06: Single most important problem, by planning area, 2009
Minneapolis and St. Paul
% Developed Suburbs
% Developing Communities
% Rural Areas %
Transportation 21% Transportation 28% Transportation 34% Transportation 36%
Crime 19% Crime 19% Crime 19% Crime 18%
Economy 13% Economy 18% Economy 14% Economy 12%
Social Issues 11% Government 7% Social Issues 8% Social Issues 7%
Growth Issues 9% Social Issues 6% Government 6% Taxes 7%
Government 7% Growth Issues 5% Growth Issues 6% Government 6%
Taxes 5% Housing 5% Taxes 5% Growth Issues 6%
Education 4% Taxes 5% Education 4% Education 4%
Housing 4% Education 4% Environment 2% Housing 3%
Other 3% Healthcare 2% Healthcare 1% Environment 1%
Healthcare 2% Environment 1% Housing 1% Healthcare 1%
Energy 1% Other 1% Other <1% Other 1%
Environment 1%
For geographic segments, n varies from 318 to 378, confidence +/-6%

Section 2: Quality of Region 11
Figure 3: Single most important problem, 1986 to 2009
0%
10%
20%
30%
40%
50%
60%
70%
1986 1988 1990 1993 1995 1997 1999 2001 2004 2006 2008
Transportation
Crime
Economy
Growth
n=1337, confidence +/-3%
Figure 4: Overall concern: Top three problems identified of issues facing the Twin Cities, 1986 to 2009
0
10
20
30
40
50
60
70
80
90
100
1986 1988 1990 1993 1995 1997 1999 2001 2004 2006 2008
Transportation
Crime
Economy
Growth
n=1337, confidence +/-3%

Section 2: Quality of Region 12
Table 2.07: Overall concern: Top three problems identified of issues facing the Twin Cities, 2003 to 2009
Tra
nspo
rtat
ion
Cri
me
Eco
nom
y
Soc
ial I
ssue
s
Gro
wth
Iss
ues
Edu
cati
on
Gov
ernm
ent
Tax
es
Hou
sing
Env
iron
men
t
Hea
lthc
are
Ene
rgy
Oth
er
2003 87 34 14 12 17 21 10 16 18 10 4 1 3
2004 71 37 14 13 22 25 11 11 20 6 5 1 6
2005 62 44 14 21 23 13 11 14 17 7 4 4 4
2006 64 59 9 16 20 21 7 15 10 6 8 1 4
2007 65 54 12 19 19 16 9 12 11 8 4 1 4
2008 57 40 24 15 15 15 8 13 17 7 3 1 3
2009 50 37 29 21 19 16 15 14 12 6 6 1 3
n=1337, confidence +/-3% This is a different way of looking at problems. Survey respondents identified a most important
problem, as well as second and third additional problems. Respondents could list up to three problems, so the total will be greater than 100%.
Table 2.08: Overall concern by planning area, 2009
Minneapolis and St. Paul
% Developed Suburbs
% Developing Communities
% Rural Areas %
Transportation 46% Transportation 45% Transportation 56% Transportation 54%
Crime 41% Economy 32% Crime 40% Crime 37%
Economy 28% Crime 30% Economy 29% Economy 26%
Social Issues 27% Social Issues 19% Social Issues 19% Taxes 20%
Growth Issues 25% Government 18% Taxes 17% Growth Issues 19%
Education 19% Growth Issues 17% Growth Issues 16% Social Issues 18%
Government 13% Education 16% Government 14% Government 15%
Housing 12% Housing 13% Education 14% Housing 13%
Taxes 12% Taxes 12% Housing 12% Education 10%
Environment 8% Healthcare 6% Environment 7% Environment 7%
Healthcare 6% Environment 4% Healthcare 5% Healthcare 4%
Other 6% Other 4% Other 1% Other 2%
Energy 1% Energy 2% Energy 1% Energy 1%
For geographic segments, n varies from 318 to 378, confidence +/-6%

Section 2: Quality of Region 13
Figure 5: Overall concern: Top three problems identified, 2009
0% 10% 20% 30% 40% 50%
Environment
Housing
Taxes
Government
Education
Growth Issues
Social Issues
Economy
Crime
Transportation
Share of respondents concerned
Most important
Top 2
Top 3
n=1337, confidence +/-3%
This is a different way of looking at problems. Survey respondents identified a most important problem, as well as second and third additional problems.
Respondents could list up to three problems, so the total will be greater than 100%.
Figure 6: Traffic congestion and transportation as concerns (top three
problems identified), 2003 to 2009
87%
71%
62% 64% 65%
57%
50%54% 52%
41%
32% 31%28%
21%
0%
10%
20%
30%
40%
50%
60%
70%
80%
90%
100%
2003 2004 2005 2006 2007 2008 2009
Sh
are
of
pu
bli
c id
enti
fyin
g a
s is
sue
Any transportationissue as top 3 concern
Traffic congestion astop 3 concern
n=1337, confidence +/-3%

Section 2: Quality of Region 14
Table 2.09: Solutions suggested for dealing with traffic congestion and transportation issues, 2009
Suggested solutions
Among those who think traffic congestion
the No. 1 problem*
Among those who think any transportation issue
the No. 1 problem
Improve/increase road infrastructure 24% 16%
· More lanes on existing highways 8% 5%
· Build more roads 8% 5%
· Better design and layout 5% 4%
· Better roads, and better maintained 3% 2%
Improve/increase mass transit 43% 48%
· Increase/improve mass transit 28% 24%
· More LRT and/or commuter trains 15% 24%
Roads AND transit both mentioned 4% 3%
Other transportation suggestions 22% 25%
· Better long range planning 6% 5%
· Increase funding for transportation 3% 6%
· Reduce road construction time 1% 3%
· Other miscellaneous 12% 11%
Don’t know 7% 8%
n for traffic congestion only = 188, confidence +/-8% n for all transportation issues = 384, confidence +/-5%
* Traffic congestion is a subset of the larger set of transportation problems.
Table 2.10: Do you think the Twin Cities metro area is
growing too fast, at the right pace, or too slow? How about the city, suburb or town where you live?
Twin Cities area growth: Local community growth:
Respondents’ place of residence: Too
fast About right
Too slow
Too fast
About right
Too slow
Minneapolis and St. Paul 26% 62% 12% 15% 72% 13%
Developed Suburbs 24% 72% 4% 16% 75% 10%
Developing Communities 25% 73% 3% 33% 63% 5%
Rural Areas 33% 65% 2% 22% 60% 18%
Twin Cities Region 25% 70% 5% 22% 69% 9%
For geographic segments, n varies from 311 to 368, confidence +/-6%

Section 2: Quality of Region 15
Figure 7: Public opinion on metro area and local pace of growth, compared to actual housing growth rate: 2004-2009
19,9
57
21,0
40
16,7
36
11,7
14
7,75
3
4,60
0
37% 38%36%
31%
24%
48%45%
43%41%
31%
25%
22%
2004 2005 2006 2007 2008 2009
Regional housing growth (units)Opinion: community growing too fastOpinion: region growing too fast
n = 1368 (metro area question), n = 1340 (community question), confidence +/-3%

Section 3: Commuting Solutions 16
Section 3: Commuting Solutions Key Findings The Twin Cities has an auto-dominated transportation environment: 78 percent of
commuting workers drive alone. Drive-alone incidence is highest in rural areas (86 percent) and developing communities (85 percent) where vehicles slightly outnumber adult drivers.
Survey participants were asked about the likelihood of trying cost-reducing commuting
solutions. Fuel-efficient vehicles are the most popular cost-reducing solution: 41 percent of commuters said they are very likely to try a more fuel-efficient vehicle or have already switched to a more fuel-efficient vehicle.
In 2009, 27 percent of commuters said they are very likely to try public transit or
already use transit. The number of Twin Cities’ commuters who said they are very likely to try transit is larger than the number of commuters who currently take buses and LRT to work.
Discussion Commuting modes While transit ridership is high – 73 million rides in 2009 – transit use is still outweighed by almost one billion car-based commute trips. There has not been significant change in the overall commuting mode distribution. (Slight fluctuations measured by past years’ surveys have not been statistically significant changes.) Of residents who worked outside the home, 78 percent got to work by driving alone; 10 percent took transit (9 percent on bus, 1 percent on LRT); 7 percent car-pooled, van-pooled or rode with others; 2 percent walked; and 2 percent bicycled (Table 3.01). Commute mode choice is shaped by at least two factors: personal access to a vehicle and location. Among central cities residents, 18 percent of commuters took transit to work (16 percent on bus, 2 percent on LRT); 8 percent biked; 6 percent car-pooled, van-pooled or rode with others; and 6 percent walked. In contrast, among rural commuters 1 percent walked and less than 1 percent biked or took transit to work (Table 3.02). In households with only one vehicle, 65 percent of commuters got to work by driving alone. In households with two vehicles, it was 81 percent (Table 3.03).
Cost-reducing and traffic-reducing commute solutions Receptiveness to commuting alternatives is on the rise. Public attitudes and behavior are adjusting – the result of volatile fuel prices and possibly greater environmental awareness. The survey asked participants to assess their interest in various cost-reducing commute solutions. Driving a more fuel-efficient vehicle was of interest to 26 percent of survey

Section 3: Commuting Solutions 17
participants in 2005. That share has risen to 41 percent in 2009. Over time, the largest gains in public interest occurred mid-decade, when gas prices were above $3 per gallon or rising toward that mark (Figure 8). In 2009, the second and third most-commonly cited solutions were to use transit (28 percent said they sometimes use transit or are very likely to try) and to work at home or telecommute (21 percent do this or are very likely to try) (Table 3.05).
As discussed above, there are Twin Cities' commuters who already practice alternative commuting solutions. The 2009 survey reveals the market potential for traffic-reducing solutions. Based on the number of Twin Cities commuters who said they are “very likely” to try transit, but do not currently do this, amounts to 16 percent of all commuters.
Differences between geographic areas Location is a key factor in travel behavior and stated preferences. Central cities residents were significantly more receptive to trying transit, biking and walking than were suburban and rural residents. Forty-three percent of central cities commuters said they sometimes use transit or are very likely to try; 33 percent of central cities commuters said they sometimes walk or bike or are very likely to try (Table 3.06). These numbers are two to three times higher in the central cities than in the suburbs and rural areas. Location and accessibility to destinations are major determinants of the stated preferences. Transit service is far more convenient in the central cities than in the outlying suburbs. Walking and biking may also be more viable due to pedestrian-friendly urban design and proximity of amenities and relevant destinations. Geographic comparisons of receptiveness to other commuting solutions – such as telecommuting and driving a fuel-efficient vehicle – did not show statistically significant differences.
Commuting time The 2009 Metro Residents Survey did not include a question on perceived commuting time. Journey-to-work survey data is available, with a one year delay, from US Census Bureau’s American Community Survey. Twin Cities area statistics from the Census are presented in this section (Table 3.07 and Figure 10). The most striking finding of the American Community Survey data on commute time is that the distribution in 2008 was very similar to the distribution in 2000. The share of commuters driving 30 minutes or more each way was 31 percent in 2000 and 33 percent in 2006 and 2008.

Section 3: Commuting Solutions 18
Table 3.01: If you work outside of your home, how do you normally get to work? 2007-2009
Mode of travel 2007 2008 2009
Drive alone 83% 82% 78% Take the bus 6% 9% 9% Drive/ride with others or car/van pool 7% 5% 7% Bicycle 1% 1% 2% Walk 1% 2% 2% Take the LRT <1% <1% 1% Some other way <1% <1% <1%
n = 889, confidence +/-4%
.
Table 3.02: Commuting mode, by planning area, 2009
Mode of travel Minneapolis and St. Paul
Developed Suburbs
Developing Communities
Rural Areas
Drive alone 62% 78% 85% 86% Take the bus 16% 10% 4% <1% Drive/ride with others or car/van pool
6% 6% 10% 10%
Bicycle 8% 1% <1% <1% Walk 6% 3% <1% 1% Take the LRT 2% 2% <1% <1% Some other way <1% <1% <1% 2%
For geographic segments, n varies from 213 to 233 confidence from +/-7%
Table 3.03: Commuting mode, by vehicles available to household, 2009
Mode of travel 1 vehicle 2 vehicles 3+ vehicles All households
Drive alone 65% 81% 86% 78% Take the bus 19% 6% 3% 9% Drive/ride with others or car/van pool
7% 7% 9% 7%
Bicycle 4% 2% 1% 2% Walk 4% 3% <1% 2% Take the LRT 2% 1% <1% 1% Some other way <1% <1% 1% <1%
For demographic segments above, n varies from 183 to 425, confidence from +/-7% (one vehicle) to +/-5% (two vehicles). Very few survey participants reported no vehicles available; therefore this group is not presented above.

Section 3: Commuting Solutions 19
Table 3.04: Vehicles available to household, by planning area, 2009
Mode of travel Vehicles per adult in
household
No vehicle available
1 vehicle 2 vehicles 3+ vehicles
Minneapolis and St. Paul 0.86 11% 34% 44% 11% Developed Suburbs 0.96 1% 27% 55% 17% Developing 1.04 3% 15% 52% 30% Rural Areas 1.13 <1% 10% 52% 37% Twin Cities Region 0.98 4% 23% 51% 22%
For geographic segments, n varies from 317 to 395, confidence from +/-6% to +/-5%
Table 3.05: “If you work outside of your home, how likely are you to try new
commuting solutions to reduce your transportation costs?”
Not at all likely
Slightly likely
Moderatelylikely
Very likely
Made change
Drive in a more fuel-efficient vehicle
21% 18% 20% 21% 20%
Take transit (buses or LRT) 53% 11% 9% 16% 12%
Work at home or telecommute 58% 14% 8% 13% 8%
Drive/ride with others or car/van pool
53% 21% 9% 10% 8%
Bicycle or walk to work 67% 10% 7% 7% 9%
Change jobs to be closer to home 60% 15% 7% 10% 8%
Change homes to be closer to work
69% 10% 7% 7% 7%
n varies from 874 to 897, confidence +/-4%
Table 3.06: “Very likely to try” or “made change” to
new commuting solutions: All commuters, by planning area, 2009
Minneapolis
and St. Paul Developed Suburbs
Developing Communities
Rural Areas
Drive a more fuel-efficient vehicle 40% 42% 40% 44%
Take transit (buses or LRT) 43% 25% 22% 15%
Work at home or telecommute 19% 24% 17% 21%
Drive/ride with others or car/ van pool
20% 16% 17% 17%
Bicycle or walk to work 33% 13% 10% 4%
Change jobs to be closer to home 21% 21% 14% 14%
Change homes to be closer to work 20% 14% 11% 12%
For geographic segments, n varies from 206 to 245, confidence +/-7%

Section 3: Commuting Solutions 20
Figure 8: “Very likely to try” or “made change” to new commuting solutions: 2005, 2007, 2009
16%
18%
18%
20%
27%
41%
13%
13%
18%
25%
26%
42%
10%
9%
12%
18%
21%
26%
0% 10% 20% 30% 40%
Bicycle or walk to work
Change jobs to becloser to home
Drive/ride with others orcar/van pool
Work at home ortelecommute
Take transit (buses orLRT)
Drive in a more fuel-efficient vehicle
2005
2007
2009
n varies from 874 to 897, confidence +/-4% Note: For 2009, responses of “very likely” and “already made change” are added together. “Already made” change was not a response option in the 2005-07 surveys.
Figure 9: “Already made change” and “very likely” to try new commuting solutions: All commuters, 2009
7%
9%
8%
8%
8%
12%
20%
7%
7%
10%
10%
13%
16%
21%
0% 5% 10% 15% 20% 25% 30% 35% 40% 45%
Change homes to be closer to work
Bicycle or walk to work
Change jobs to be closer to home
Drive/ride with others or car/ van pool
Work at home or telecommute
Take transit (buses or LRT)
Drive a more fuel-efficient vehicle
Already made change
Very likely
n varies from 874 to 897, confidence +/-4%

Section 3: Commuting Solutions 21
Table 3.07: Commute time among commuting workers: 7-County Twin Cities area, 2000, 2006 and 2008
Census 2000 ACS 2006 ACS 2008
Less than 5 minutes 2% 3% 2%
5 to 9 minutes 9% 9% 9%
10 to 14 minutes 15% 14% 14%
15 to 19 minutes 17% 17% 16%
20 to 24 minutes 18% 17% 18%
25 to 29 minutes 8% 8% 8%
30 to 34 minutes 15% 15% 15%
35 to 39 minutes 3% 4% 3%
40 to 44 minutes 4% 4% 4%
45 to 59 minutes 6% 6% 7%
60 or more 3% 4% 4%
Source: US Census Bureau, Census 2000; American Community Survey 2006 and 2008. ACS 2006 published confidence varies by data cell, from +/-2% to +/-7% ACS 2008 published confidence varies by data cell, from +/-2% to +/-7%
Figure 10: Commute time among commuting workers: Twin Cities area, 2000, 2006 and 2008
0% 20% 40% 60% 80% 100%
2000
2006
2008
Under 14 minutes 15 to 29 minutes
30 to 44 minutes Over 45 minutes
Source: US Census Bureau, Census 2000; American Community Survey 2006 and 2008. ACS 2006 published confidence varies by data cell, from +/-2% to +/-7% ACS 2008 published confidence varies by data cell, from +/-2% to +/-7%

Section 4: Residential Preferences 22
Section 4: Residential Preferences Key Findings Five percent of survey respondents indicated they live in a rural setting; 8 percent in a
small town; 32 percent in a growing suburb; 30 percent in an older suburb; 20 percent in a central cities neighborhood; and 5 percent in a very urban or downtown setting.
One-quarter of Twin Cities’ residents said they would prefer to relocate or live in a
different type of area. A trend of rural or small town preference is apparent. If all residents who said they
preferred a rural setting actually lived in a rural setting, the region would experience a doubling of its rural population. The preference is problematic since greater population is what transforms rural areas and small towns into something else.
Discussion Where people currently live The Twin Cities region includes a continuum of communities at different stages of development, with varying patterns of community form. As distance from the region’s center increases, community form becomes less urban and more rural. For this section, analysis draws on survey respondents’ self-identified community type. Survey participants were asked to characterize their community by choosing one of six descriptions: a very urban or downtown setting, a central city neighborhood, an older suburb, a growing suburb, a small town or a rural setting. (For example, the Metropolitan Council considers Dayton, Minnesota, to be a developing community. Hypothetically, survey participants from Dayton could also self-identify as small town or growing suburb). Figures 11 and 12 show most survey participants living in either an older suburb (30 percent) or a growing suburb (32 percent). Twenty percent live in a central cities neighborhood and 5 percent in a very urban or downtown setting. The remainder identify themselves as rural area (5 percent) or small town residents (8 percent).
Where people would prefer to live Survey participants were asked whether they would like to relocate to a different kind of area. Most Twin Cities residents are satisfied with their community setting. However, 25 percent said they would prefer to relocate to a different type of area (Table 4.01). Relocation interest was lowest among rural area residents (13 percent), small town and growing suburb residents (24 percent each) and senior citizens (12 percent) (Table 4.02). Table 4.03 and Figure 13 show preferred areas compared with where people currently live. A trend of rural or small town preference is apparent. If all residents who said they preferred a rural setting actually lived in a rural setting, the region would experience a

Section 4: Residential Preferences 23
doubling of its rural population. The preference is problematic since greater population is what transforms rural areas and small towns into something else.
Figure 11: "How would you describe the area where you now live?"
Source: Metropolitan Council's 2009 Annual Residents Surveyn= 1,389, confidence +/- 3%
Central City or Urban Downtown
Older Suburb
Growing Suburb
Small City or Town
Rural Setting

Section 4: Residential Preferences 24
Figure 12: “How would you describe the area where you now live?”
Small city or town 8%
Growing suburb 32%
Older suburb30%
Central city neighborhood
20%
Very urban or downtown
setting5%
Rural setting5%
n = 1,389, confidence +/-3%
Table 4.01: “Would you prefer to live in a different kind of area?”
Currently living in: No Yes, prefer
different area Respondents living in:
A rural setting 87% 13%
A small city or town 76% 24%
A growing suburb 76% 24%
An older suburb 73% 27%
A central cities neighborhood 74% 26%
A very urban/downtown setting N/A*
All areas combined 75% 25%
n varies from 165 to 329, confidence from +/-8% (small city or town) to +/-6% (growing suburb, older suburb) There were too few respondents to accurately represent very urban/downtown residents.

Section 4: Residential Preferences 25
Table 4.02: Interest in relocation, by age cohort
No Yes, prefer different area
Age 65+ 88% 12%
Ages 50-64 76% 24%
Ages 40-49 77% 23%
Ages 18-39 69% 31%
n for age cohorts varies from 267 to 491, confidence varies from +/-6% (age 18-39) to +/-5% (age 65 and over)
Table 4.03: Where people live and where they would prefer to live
Rural setting
Small town
Growing suburb
Older suburb
Central cities neighborhood
Very urban/
downtown
Area of current residence 5% 8% 32% 30% 20% 5%
Preferred area, including relocators and current residents
14% 12% 27% 24% 17% 6%
n= 1,389 for current area, n= 1,383 for preferred area, confidence +/- 3%
Figure 13: Where people live and where they would prefer to live
n= 1,389 for current area, n= 1,383 for preferred area, confidence +/- 3%
5% 8%
32%30%
20%
5%
14% 12%
27%
24%
17%
6%
0%
5%
10%
15%
20%
25%
30%
35%
Rural setting Small city ortown
Growing suburb Older suburb Central city neighborhood
Very urban ordowntown setting
Current
Preferred area

Section 5: Metropolitan Council 26
Section 5: Metropolitan Council Key Findings Public approval of the Council’s performance in addressing regional issues is at a
historical high point: 47 percent think that the Council is doing a good or very good job; 38 percent think the Council is doing a fair job; and 15 percent think the Council is doing a poor job or worse.
Rural residents in the region and those who expressed pessimism about the region’s
quality of life are the most critical of the Council’s performance. When Council programs and responsibilities are specifically listed, 9 out of 12 are
considered “very important” to majorities of Twin Cities residents. The highest ratings went to water supply and quality monitoring (82 percent said very important) and wastewater treatment (76 percent said very important).
For some programs, perceived importance varies with geographic situation. For all
programs, perceived importance is statistically associated with opinions of the Council’s performance serving the region.
Discussion Awareness of the Metropolitan Council Seventy-one percent of Twin Cities residents have heard of the Metropolitan Council. This awareness or name recognition has fluctuated over the past decade (Table 5.01). Familiarity with the Council in 2009 was highest among older Baby Boomers, ages 50-64 (86 percent recognition); and lowest among Twin Citians who identify as minority or multi-racial (57 percent recognition). There were not significant differences across geographic sectors or other demographic characteristics (Table 5.02).
Public opinion on the Metropolitan Council The 71 percent of participants who indicated awareness of the Metropolitan Council were asked to rate the Council’s performance addressing and resolving regional issues. Of that group, 47 percent think that the Council is doing a good or very good job; 38 percent think the Council is doing a fair job; and 15 percent think the Council is doing a poor job or worse. This is the highest level of approval measured in the years that Metropolitan Council has asked these questions (Table 5.01 and Figure 14). Public approval can be analyzed by demographic segment. Generally, there were not significant differences across demographic characteristics. There was, however, a geographic factor: Rural residents in the region were less likely than urban and suburban residents to approve of Council performance (37 percent approval, 25 percent disapproval among rural residents).

Section 5: Metropolitan Council 27
More strikingly, those who expressed that the region’s quality of life has diminished are the most critical of the Council’s performance (28 percent approval, 29 percent disapproval). These were the only statistically significant differences uncovered in analysis of the survey data (Table 5.02).
Rating of importance of Council programs Survey participants were asked about 12 Council responsibilities and program areas. Program importance was rated using a four-point scale: not at all important, slightly important, moderately important and very important. Nine out of 12 Council programs were rated as very important to majorities of residents. The largest majorities in 2009 thought that water supply and quality monitoring (82 percent) and wastewater treatment (76 percent) are very important programs (Table 5.03). Also enjoying a substantial public consensus: natural resources and land conservancy, planning to accommodate the region’s growth, and the Metro Transit service network. These five programs received the highest overall importance scores in previous years as well. For some programs, perceived importance varied with geographic situation. In particular, rural and developing suburban residents were less likely to consider important Metro Transit, LRT, and grants to develop and preserve housing.
Stated importance related to approval Public consensus around the Metropolitan Council’s responsibilities is related to the Council’s approval rating, discussed above. That is, one’s opinion of the Council’s mandate and responsibilities influences what one thinks of the Council overall. The evidence of this relationship is represented with correlation scores, measuring the statistical association between opinion on the Council’s performance and perceived importance of Council programs. The correlation between perceived importance of the Council’s responsibilities (composite importance rating) and performance approval was calculated at 0.49 (on a scale of 0 to 1). Correlation scores are generally lower as programs are considered one at a time (Table 5.03). These correlations can be interpreted as measuring the relative political weight of specific programs. For example, public approval of the Council may be slightly boosted by the popularity of, for example, regional parks and trails. This valorization is independent of the actual performance of the agency. On the other hand, public valuation of wastewater treatment has lower correlation. While there is a solid consensus around the importance of the core responsibility of wastewater treatment, the importance does not seem to influence approval (or disapproval) of the Council.

Section 5: Metropolitan Council 28
Figure 14: Public opinion of Metropolitan Council performance, 1997-2009
47%
47%
41%
42%
36%
37%
28%
30%
19%
29%
36%
31%
38%
37%
40%
43%
46%
43%
54%
52%
46%
50%
51%
54%
15%
16%
19%
15%
18%
20%
18%
18%
35%
21%
13%
15%
0% 20% 40% 60% 80% 100%
2009
2008
2007
2006
2005
2004
2003
2001
2000
1999
1998
1997
Good or very good
Fair
Poor or very poor
n = 771 for performance approval, confidence +/- 4%

Section 5: Metropolitan Council 29
Table 5.01: Name recognition and public approval of Metropolitan Council performance, 2001-2009
2001 2003 2004 2005 2006 2007 2008 2009
Name recognition 68% 74% 78% 69% 73% 74% 74% 71%
“What is your impression of the Metropolitan Council’s
performance addressing regional issues?”
Very good job 4% 2% 3% 5% 6% 6% 7% 9%
Good job 26% 26% 34% 32% 36% 35% 40% 38%
Fair job 52% 54% 43% 46% 43% 40% 37% 38%
Poor job 12% 14% 14% 14% 12% 13% 12% 9%
Very poor job 6% 4% 6% 4% 3% 6% 4% 6%
n = 1387 for name recognition, confidence +/- 3% n = 771 for performance approval, confidence +/- 4%
For comparison over time, the table excludes “no opinion/don’t know.
Table 5.02: Name recognition and public approval of Metropolitan Council performance, by demographic segment, 2009
Impression of Council’s performance
Name recognition
Very good or good
Fair Poor or very poor
Optimistic outlook – believe quality of life has improved or stayed the same
68% 54% 36% 10%
Pessimistic – believe quality of life has gotten worse
78% 28% 43% 29%
Minority or Multi-Race 57% N/A N/A N/A
White, Non-Hispanic 74% 48% 38% 14%
Senior citizens (65+) 77% 51% 39% 10%
Older Boomers (50-64) 86% 47% 40% 13%
Young Boomers (40-49) 71% 44% 40% 16%
Gen X and Gen Y (18-39) 67% 47% 33% 20%
Minneapolis and St. Paul 71% 48% 35% 17%
Developed suburbs 71% 50% 39% 11%
Developing communities 69% 45% 39% 16%
Rural areas 71% 37% 38% 25%
All residents of region 71% 47% 38% 15%
n for name recognition varies from 128 to 1027, confidence ranges are +/-9% (minority or multi-trace), +/-6% (age cohorts, planning areas, also pessimistic segment) to +/-4% (optimistic outlook)
n for performance approval varies from 105 to 558, confidence ranges are +/-10% (for age 18-39), +/-8% (other age cohorts, planning areas), +/-7% (pessimistic outlook), +/-5% (optimistic)

Section 5: Metropolitan Council 30
Table 5.03: How important are the following Council programs for
maintaining the quality of life in the Twin Cities metro area?
Council Program Not at all important
Slightly important
Moderately important
Very important
Correlation with approval
rating Monitoring water supply
and water quality 1% 3% 13% 82% 0.30
Wastewater treatment 1% 5% 19% 76% 0.26
Planning to accommodate a growing population
4% 10% 22% 65% 0.32
Natural resources and land conservancy
3% 10% 22% 64% 0.34
Metro Transit (bus system) 7% 9% 21% 63% 0.33
Regional parks and trails 3% 12% 24% 61% 0.36
Grants to clean up and reuse polluted lands
3% 10% 27% 60% 0.31
Development that connects housing, jobs and services
7% 11% 27% 55% 0.36
Light Rail Transit 10% 12% 24% 54% 0.32
Grants for transportation projects
6% 14% 31% 49% 0.37
Coordinating development across neighboring communities
6% 13% 33% 49% 0.38
Grants to develop and preserve housing
8% 16% 31% 45% 0.39
n for importance scores varied between 1292 and 1363 for the various programs, confidence +/-3% Correlations between program importance and performance utilized 766 records. Correlation scores measure the statistical association, on a scale of 0 to 1, between perceived importance of each program and approval of Council’s performance.
Section 6: Methodology 31
Section 6: Methodology This report describes the findings of the 2009 Metro Residents Survey; 3,300 addresses in the seven-county Twin Cities area were randomly selected and residents were invited to participate in this study. Sampled addresses were stratified by zip codes to provide balanced numbers in four geographic sectors: Central Cities, Developed Suburbs, Developing Communities, and Rural Areas. In October 2009, each sampled resident was sent a postcard announcing the coming survey. One week later (October 16), each sampled resident was sent a survey packet: a letter from the Council Chairman, a survey questionnaire to be completed, and a postage-paid return envelope. To encourage participation by recent immigrant groups, the questionnaire included instructions in Spanish, Somali and Hmong languages. The instructions offered the reader the opportunity to arrange an interview in another language. Data collection began October 22. Throughout the process, received responses and returned mail were tracked by Metropolitan Council’s survey contractor, Information Specialists Group Inc. One week after the October survey packet was mailed, non-respondents were flagged for telephone follow-up. Information Specialists Group Inc. conducted telephone interviews through December 4, and accepted mail-returned survey questionnaires for inclusion through this date. Of the initial 3,300 sampled residents, 215 were determined to be unlocatable. This left 3,085 active records in the sample database.
Survey participation In total, 420 telephone interviews, 786 mail-returned surveys, and 105 online user surveys were completed and received. The combined pool of 1,311 responses represents a 42 percent response rate among those receiving the initial 2009 survey questionnaire. Ninety-nine useable cell phone interviews were collected as well. Cell phone users were approached through an independent, random sampling. Response rate within the cell phone user sample was 10 percent. Both the sample size and response rate are relevant to the reliability of survey analysis. With a respondent pool of 1,410, the margin of error due to sample sufficiency is +/-3 percent, with 95 percent confidence. Margins of error increase where questions were answered by a smaller number of respondents. (Table 6.01) The response rate is considered acceptable. However, Council researchers are concerned that the survey under-represents certain demographic segments. This concern is addressed through targeted over-sampling, through the addition of cell phone user survey interviews, and through weighting of response data. Comparing the response distributions of the telephone interview and mail-return participants, there are some observed differences in demographic characteristics, behavior (for example, commute mode), and public opinion (for example, Metropolitan Council

Section 6: Methodology 32
name recognition). Some respondents are more likely to answer a mail-in survey, while others are more willing to respond in a telephone interview. Therefore, a multi-modal data collection method was employed to achieve a higher response rate and to more completely capture residents’ views and experiences.
Preparation for analysis: weighting Weighting of the data was necessary to correct for sample design – specifically the deliberate over-sampling of rural areas and the small size of an independent sample of cell phone users – as well as demographic imbalances in response and participation. Individual survey responses are given greater (or lesser) weight in order to represent population segments. The unadjusted pool of collected survey responses under-represented people under 40 and minority-identified residents. The raw, unadjusted pool over-represented senior citizens and people living alone. Weight factors were independently calculated for age and gender combination, race, household size, telephone market segment, and geographic sector. For most of these variables the distribution of survey participants was benchmarked against 2008 American Community Survey statistics for adults in the Twin Cities region. For geographic sector, the distribution was benchmarked against the Metropolitan Council’s own 2008 population estimates. The five factors were then multiplied together (age and gender weight X minority weight X household size weight X telephone market weight X geographic weight) to yield “case weights” for each of the 1,410 survey responses. The end product is a survey dataset that fairly represents the region’s demographic diversity: Survey participants from each age cohort fairly represent their share of the region’s population; minority participants and white, non-Hispanic segments fairly represent their share of the population. The survey instrument is found in the Appendix section of this report.
Table 6.01: Margin of error for various sample sizes
Sample of “n” Margin of error, with 95% confidence
1,067 +/- 3%
600 +/- 4%
384 +/- 5%
267 +/- 6%
196 +/- 7%
150 +/- 8%
119 +/- 9%
96 +/- 10%

Section 6: Methodology 33
Table 6.02: Distribution of 2009 survey sample and regional population
Unadjusted distribution of
survey participants
Demographic distribution of region’s adult population*
Weighted, valid distribution of survey data, excluding blank
responses White only, Non-Hispanic 89% 83% 83%
Minority or multi-racial 9% 17% 17%
Refused/ missing information 2%
Male 51% 49% 49%
Female 48% 51% 51%
Refused/ missing information 1%
65+ 23% 14% 14%
50-64 35% 25% 25%
40-49 22% 22% 22%
30-39 13% 18% 18%
18-29 6% 21% 21%
Refused/ missing information 1%
Live alone 23% 15% 15%
2 in household 34% 35% 35%
3 in household 13% 19% 19%
4 in household 16% 18% 18%
5 or more in household 10% 13% 13%
Refused/ missing information 4%
Cell phone only (no land-line) 11% 23%** 26%
Cell phone + land-line in home
72% 63%** 62%
No cell phone (including land-line only)
14% 14%** 12%
Refused/ missing information 3%
Central cities 28% 23%*** 23%
Developed suburbs 25% 36%*** 36%
Developing 24% 35%*** 35%
Rural 23% 6%*** 6%
* For race, age, gender, and household size, 2008 adult population distributions from Census Bureau’s American Community Survey are used as benchmarks. ** For telephone market segments, a regional distribution was not available. National survey estimates provided the benchmark for weights adjustment. *** For geographic sub-region, the 2008 all-ages population in households, estimated by Metropolitan Council, is used as the benchmark. The residents’ survey’s stratified sampling is designed to yield statistically significant data for each of the four geographic sub-regions.

Appendix 34
Appendix: Survey Questionnaire The questionnaire is an eight-page document with 30 questions. (See following pages.)

35
2009 Annual Residents Survey
Twin Cities Metropolitan Area You’ve been selected to participate in a survey on life in our region. Please provide your responses in this questionnaire booklet. Your responses will be used only for research. Thank you for participating.
Para informacion en Español, vea el reverso de este folleto.
Xav paub cov xovxwm no txhais us lus Hmoob, saib nraum qab daim ntawv no.
Warbixin ku saabsan Somali kafiiri dhinaca danbe ee form-kan.

36
Q1 How would you rate the Twin Cities as a place to live, compared to other metro areas? (check one)
A much better place
in which to live A slightly better place
in which to live A slightly worse place
in which to live A much worse place
in which to live
Q2 Over the past year, do you think the quality of life in the Twin Cities has gotten better, stayed the same, or gotten worse? (check one)
Gotten better
Stayed the same
Gotten worse
Q3 What do you think is the single most attractive feature of the Twin Cities metro area today? ______________________________________________________________________________
Q4 What do you think is the single most important problem facing the Twin Cities metro area today? ______________________________________________________________________________
Q5 In your opinion, what is the best solution to this problem? ______________________________________________________________________________ ______________________________________________________________________________
Q6 What other important problems are facing the Twin Cities today?
Please list up to three additional problems, in order of importance:
1. _______________________________________________________________________
2. _______________________________________________________________________
3. _______________________________________________________________________

37
Q7 Have you heard of the Metropolitan Council? Yes Please go to Question 8
No Please skip to Question 9
Q8 What is your impression of the Metropolitan Council’s performance addressing regional issues? (check one)
Very Poor Poor Fair Good Very Good No opinion/Don’t know
Q9 The Metropolitan Council plans or manages a variety of regional programs. How important is each program to the quality of life in the region? (check one box on each line)
Council programs Not at all important
Slightly important
Moderately important
Very important
Don’t know
Metro Transit (bus system)
Light Rail Transit (LRT)
Planning to accommodate a growing population
Coordinating development across neighboring communities
Wastewater treatment
Regional parks and trails
Natural resources and land conservancy
Monitoring water supply and water quality
Grants for transportation projects
Grants for development that connects housing, jobs and services
Grants to develop and preserve housing
Grants to clean up and reuse polluted lands

38
Q10 Do you work outside of your home?
Yes Please go to Question 11
No Please skip to Question 13
Q11 If you work outside of your home, how do you normally get to work? Drive alone Drive/ride with others or car/van pool Take the bus Walk Bicycle Take LRT Some other way
Q12 If you work outside of your home, how likely are you to try the following commute solutions to reduce your costs? If you have already made this change to reduce your costs, please check “Made change.” (check one box on each line)
Commuting solutions Made
change Not at all
likely Slightly likely
Moderately likely
Very likely
Don’t know
Work at home or telecommute
Change jobs to be closer to home
Change homes to be closer to work
Bicycle or walk to work
Drive in a more fuel-efficient vehicle
Drive/ride with others or car/van pool
Take transit (buses or LRT)
Q13 Have you moved or changed address in the past 5 years?
Yes No
Q14 Do you own or rent your residence? Own Rent
Q15 (A) What type of housing do you live in? (check one) Single family home Please skip to Question 16 Townhome, duplex, triplex or fourplex Apartment Condominium or cooperative Mobile home / Manufactured home Please skip to Question 16 Group housing, assisted living, or other institutional housing Please skip to Question 16 Other:_________________________
(B) If you live in a condo or apartment building or other attached housing, how many housing units are in your specific building (or townhouse block)? (check one)
2 5-9 50-99 3 10-19 100 or more 4 20-49 Don’t Know

39
Q16 What is the finished area size (square footage) of your home? (check one)
� Less than 900 square feet � 1,500 – 1,799 square feet � 2,600 – 3,600 square feet
� 900 – 1,199 square feet � 1,800 – 2,199 square feet � Over 3,600 square feet
� 1,200– 1,499 square feet � 2,200 – 2,599 square feet � Don’t know
Q17 Do you think the Twin Cities area as a whole is growing too fast, at the right pace, or too slow?
How about the city, suburb or town where you live?
Growth in the Twin Cities area as a whole is… Too slow About right Too fast
Growth in the city, suburb or town where you live is…. Too slow About right Too fast
Q18 How would you describe the area where you now live? Please check the description that best describes your community or neighborhood. (check one)
A rural setting A growing suburb A central city neighborhood
A small city or town An older suburb A very urban or downtown setting
Q19 Would you prefer to live in a different kind of area? Yes Please go to Question 20
No Please skip to Question 21
Q20 What type of area would you prefer to live in?
A rural setting A growing suburb A central city neighborhood
A small city or town An older suburb A very urban or downtown setting
Q21 Have you visited a regional park or trail in the last 12 months?
Yes No Don’t know/unsure
Q22 How important is it to purchase land now for future regional parks and park expansion?
Not at all important
Slightly important Moderately important
Very important Don’t Know

40
Q23 Are you male or female? Male Female
Q24 In what year were you born? ________ Year (e.g., 1977)
Q25 Including you, how many household members are in each of these age groups?
___ 0 to 17 ___ 18 to 39 ___ 40 to 64 ___ 65 and over
Q26 How many vehicles does your household have available for personal travel?
_______ # of Vehicles
Q27 (A) Do you have a cell phone for personal use? Yes No Please skip to Question 28
(B) Is the cell phone your only phone or do you also have a regular telephone (landline) at home that you can receive calls?
Cell is only phone
Regular phone at home
(C) Of all the phone calls that you receive, about how many are received on your cell phone?
All or almost all More than half About half Less than half Very few/none
Q28 What was your annual total household income before taxes, in 2008? (check one)
� Less than $25,000 � $50,000 to $74,999 � $100,000 to $150,000 � $25,000 to $49,999 � $75,000 to $99,999 � Over $150,000
Q29 How would you identify your race/ethnicity? (check all that apply)
White/Caucasian Asian/Asian American Hispanic/Latino Black/African American American Indian Other
Q30 What city, ZIP code, and county do you live in?
City and ZIP code: ________________________________________________
County: ________________________________________________

41
Your survey responses will be used only for research. Metropolitan Council will not share or release your personal information. Thank you for completing this survey. Usted ha sido seleccionado para participar en una encuesta sobre la vida en nuestra region. Si le
gustaría una traducción al Español, favor de llamar al 1-800-439-3185 para hablar con un entrevistador. Sus respuestas serían completamente confidenciales. Gracias por participar.
Waxa laguu doortey in aad ka qayb qaadatid tiro-koob ku saabsan nolosha oo lagu qabanayo
gobolkan. Hadii aad rabtid in laguugu turjumo af Soomli, fadlan wac 1-800-439-3185 si aad ula hadashid qofka wareystaha. Xogwarankaagu waa sir aanay cid kale oganeyn.
Koj tau raug xaiv los koom hauv ib qho kev nug txog kev ua neej hauv peb cheeb tsam. Yog hais tias
koj xav tau ib tug neeg nyeem daim ntawv no ua lus Hmoob, thov hu rau 1-800-439-3185 es nrog ib tug neeg nug cov lus nug no tham. Koj cov lus teb yuav muab khaws cia kom zoo uas tsis pub neeg paub. Ua tsaug rau koj txoj kev koom tes.
Please return the survey in the addressed, postage paid return envelope. The mailing address is:
2009 Metro Residents Survey, P.O. Box 5703, Hopkins MN 55343-7063