an evoked potential study of the cross- race effect of...
TRANSCRIPT

An Evoked Potential Study of the Cross-
Race Effect of Facial Recognition in the
South African Context
Daniel John Greenslade

EVOKED POTENTIAL, FACIAL RECOGNITION & CROSS-RACE EFFECT
i
Declaration
“A research project submitted in partial fulfilment of the requirements for the degree of
Master of Arts in Research Psychology, for the Faculty of Humanities, University of the
Witwatersrand, Johannesburg, December 2011”.
“I declare that this research entitled “An Evoked Potential Study of the Cross-Race Effect
of Facial Recognition in the South African Context” is my own, unaided work. It has not
been submitted before for any other degree or examination at this or any other
university”.
Signed: ____ _____ 15 December 2011
Daniel John Greenslade
0600260G

EVOKED POTENTIAL, FACIAL RECOGNITION & CROSS-RACE EFFECT
ii
Abstract
This research aimed to explore and contextualise research on the electrophysiological
potentials evoked in response to human face recognition within the South African
context. Previous research provides evidence that there is a measurable difference in the
electrophysiological response to faces of people of other racial groups when compared to
the response to one‟s own race group. The difference is seen in greater peak amplitudes
in response to one‟s own-race (indicating greater attention being granted) in comparison
to the other-race. This has been labelled the Cross-Race Effect. This research also
attempted to expand on previous research in the use of a mixed-race sample and realistic
colour images, in contrast to previously used greyscale images. A purposive sample of 40
students at the University of the Witwatersrand was split equally between gender and
race (Black and White) with an Indian control group. The electrical potentials elicited by
the facial stimuli were extracted from the ongoing electroencephalograms. The results
obtained displayed inverse results to those found internationally, with Black participants
eliciting no differences between racial groups, and White participants eliciting a greater
peak amplitude to Black (other-race) faces. A gender effect was also seen, with White
participants eliciting greater peak amplitudes towards female faces, while Black
participant again showed no differences between male and female faces. Trends
displayed in the results, and the significance thereof, are discussed, and the importance of
the effect of society of developmental neurology is highlighted, with the rephrasing of
cultural neuroscience to Socio-Cultural Neuroscience. The results ultimately suggest that
the internationally seen cross-race effect is absent in a young South African population
(with the principle of increased exposure leading to increased attention still in effect),
indicating that South Africa is beginning to move away from racial discrimination, and
moving towards a future of true integration and equality.

EVOKED POTENTIAL, FACIAL RECOGNITION & CROSS-RACE EFFECT
iii
Acknowledgements and dedication
I would firstly like to thank Adam Kokkas, of SSEM Mthembu, for his invaluable
assistance in this research. For the use of the Electroencephalogram, for the modifications
allowing Evoked Response Potential extraction, the multiple phone calls and after hours
meetings to fix and tune equipment.
Next thanks need to go to Bradley Carpenter. Your help in understanding EEGlab and all
your work in converting the EEGs into Evoked Potentials was, again invaluable.
To Mike Greyling for his help with the statistics, from writing the SAS code to helping to
interpret the results.
To Tammi Mayson, for helping with all the data sorting and input, for our movie night
that kept me sane, and for being an awesome friend.
Without the support of you all, this research would not have been possible. Thank you for
your hard work.
To God, who is always there for me. Without my faith I would never have made it
through this.
To my parents. For supporting me over the past two years while I was completing this
research, and paying for the needed extensions. And for putting up with me and my
frustrations over uncontrollable technical holdups, and my sleep-deprived grouchiness
and snapping over the past few months as I attempted to meet my deadline.
And finally to my supervisor and friend, Enid Schutte. You are a constant support going
above and beyond to help me and my usual last-minute write-up. For staying up all night
checking my work, for finding article after article to fill my gaps, and for your boundless
knowledge. Without your continuous support I would not have got through this research.
I am looking forward to yet another year with you as we embark together in the first ever
Masters in Clinical Neuropsychology.

EVOKED POTENTIAL, FACIAL RECOGNITION & CROSS-RACE EFFECT
iv
Contents Table
Declaration ....................................................................................................................... i
Abstract ............................................................................................................................... ii
Acknowledgements and dedication ............................................................................... iii
Contents Table ............................................................................................................... iv
Research Aims ................................................................................................................ 1
Chapter 1: Literature Review .............................................................................................. 2
Rationale ......................................................................................................................... 2
Literature Review ............................................................................................................ 6
Social Importance ....................................................................................................... 6
Underlying Cognitive Framework .............................................................................. 8
Neurology of Facial Recognition ................................................................................ 9
Previous Research ..................................................................................................... 12
Evoked-Response/Event-Related Potentials ............................................................. 13
Colour versus Black and White ................................................................................ 16
Cultural Neuroscience ............................................................................................... 17
Sample....................................................................................................................... 18
Research Questions ....................................................................................................... 20
Chapter 2: Methodology ................................................................................................... 21
Electroencephalogram and Evoked Response Potential ........................................... 21
Instruments ................................................................................................................ 22
Sample....................................................................................................................... 23
Exclusion Criteria ..................................................................................................... 25
Research Design........................................................................................................ 25
Procedure .................................................................................................................. 25
Chapter 3: Results ............................................................................................................. 27
Results ........................................................................................................................... 27
Chapter 4: Discussion ....................................................................................................... 35
Discussion ..................................................................................................................... 35
The Cross-Race Effect .............................................................................................. 35

EVOKED POTENTIAL, FACIAL RECOGNITION & CROSS-RACE EFFECT
v
A Gender Effect ........................................................................................................ 40
Inter- and Intra-group Differences ............................................................................ 41
Socio-Cultural Neuroscience .................................................................................... 44
Limitations and Suggestions for Future Research .................................................... 46
Conclusions ................................................................................................................... 48
References ..................................................................................................................... 50
Appendices .................................................................................................................... 56
Appendix 1:Participant Consent Form...................................................................... 56
Appendix 2: Participant Information Sheet .............................................................. 57
Appendix 3: Sample Face Stimuli ............................................................................ 58
Appendix 4: Racial Prejudice Questionnaire ............................................................ 59
EVOKED POTENTIAL, FACIAL RECOGNITION & CROSS-RACE EFFECT
1
Research Aims
The aims of this research was to explore and contextualise research on the
electrophysiological potentials evoked in response to human face recognition. Previous
research provides evidence that there is a measurable difference in the peak amplitudes
between recognition of faces of people of another race group and recognition of faces of
one‟s own race group, called the Cross-Race Effect (Ito, Thompson & Cacioppo, 2004).
This research performed an evoked potential study on the cross-race effect on South
African University students, thereby contextualising it within the South African climate.
The implications of those results within that context were explored.

EVOKED POTENTIAL, FACIAL RECOGNITION & CROSS-RACE EFFECT
2
Chapter 1: Literature Review
Rationale
“Faces are of essential importance for human social life. They provide valuable
information about the identity, expression, gaze, health, and age of a person.” (Grüter,
Grüter & Carbon, 2008, p. 79).
There exists a well documented phenomenon called the „Cross-Race Effect‟ (also known
as Cross-Race Bias and Other-Race bias) (Ito et al, 2004). This phenomenon is
responsible for the creation of the stereotype that states that people of other races all look
alike (for example: „All X people look the same‟). However, this stereotype has an actual
basis in science, from social, cognitive and neurological paradigms (Ito et al, 2004;
Herrmann et al, 2007; Anthony, Copper & Mullen, 1992).
South Africa has an infamous history of legalised racial segregation and discrimination
favouring the white race, called Apartheid. Apartheid, which lasted 46 years from 1948 to
1994, was unique not only in the manner in which is was a legalised discrimination, but
also because the dominant race was a minority race (Whites) whilst the races
discriminated against constituted the majority (Wilson, 2001). This has, since 1994,
changed, and now South Africa is enjoying equality for all. Despite this history, and to
some extent possibly as a reaction to this, in the “New South Africa” the younger
generation have developed in an environment that propagates equality, and from this
equality an integrated “Rainbow Nation”. The implication is thus that a generation of
young South Africans have had the opportunity to develop in a country where different
racial groups have equality, which has therefore lead to integration. This integration has
naturally has created the by-product of increased cross-societal exposure, albeit currently
would only be completely reflective in an urban and suburban environment of South
Africa, rather than in township and more rural areas (Christopher, 2005). The sample
chosen for this study reflected this, and was drawn from sub/urban upbringings. The

EVOKED POTENTIAL, FACIAL RECOGNITION & CROSS-RACE EFFECT
3
international research has generally been in societies where the “White” racial group is
dominant both socially and relative to numbers (Caldara et al, 2004; Ito et al, 2004;
Kubota & Ito, 2007; Miyoshi, Katayama & Morotomi, 2004; Shriver, Young, Hugenberg,
Bernstein & Lanter, 2008). The integration of our new generation of young South African
adults facilitates a multi-directional investigation of the phenomenon, and hence the
design of the present study including the two dominant racial groupings (Black and
White) and the control (Indian). This is not representative of the current South Africa as a
whole, as research based on the South African census illustrates a slow residential
reintegration (Christopher, 2005), but rather a representative of what could eventually
become a nationwide reality rather than an ideal in generations to come.
Much of the research on the cross-race effect of facial recognition has been performed by
social and cognitive researchers. As can be seen in the work of Wright, Boyd and
Tredoux (2001, 2003) as well as Hugenberg, Miller and Claypool (2007), this has
generally taken the form of line-up identification procedures. This type of research,
however, depends on conscious decision making. One must question whether there is a
pre- or unconscious aspect to this. This would best be addressed through an exploration
of the neurological basis for the cross-race effect. Despite the vast amount of social and
cognitive research on facial recognition and own-race bias, electro-physiological
correlates do not appear to have enjoyed the same degree of attention, as literature survey
produced no published literature on evoked potential studies of the cross-race effect of
facial recognition within the New South African context. Electrophysiological research
enjoys much attention in the developed world, however comparative studies emanating
from a different socio-cultural setting are limited, and the understanding with regard to
the specific gaps in the literature could possibly addressed through this focus. This
research therefore conducted neuropsychological exploration of the cross-race effect of
facial recognition within the South Africa context in an attempt to add to literature and
research.
Cross-racial adoption studies, taken from a social-cognitive perspective, have shown that
the cross-race effect is the most plastic during childhood (Sangrigoli, Pallier, Argenti,

EVOKED POTENTIAL, FACIAL RECOGNITION & CROSS-RACE EFFECT
4
Ventureyra, & de Schonen, 2005). The results of their studies established that children
who were adopted cross-racially (Korean children to White families in this case)
displayed an inverse cross-race effect, favouring their adopted other-race rather than their
own biological race. Their research demonstrated that the cross-race effect can be
changed or completely removed, depending on social circumstances, during this
childhood period.
Changes brought about and upheld by specific post-apartheid legislation have created
cross-racial integration. Specifically the South African Schools Act of 1996 (RSA, 1996)
which made interracial schooling a legal right. This integration for any person under the
age of 24 has occurred during the cross-race effect‟s period of highest plasticity (pre-
primary age). One must thereby question whether this integration has affected the
standard cross-race effect for this integrated generation, and, if there has been an effect,
one must question whether it is a positive effect, being the integration has caused
increased exposure, and thereby decreased the cross-race effect (Sangrigoli et al, 2005);
or negative effect, being the sudden increase in exposure has increased the them-us rift
and therefore increased the cross-race effect. South Africa has a unique exposure set with
which to challenge the previously published findings, and lend empirical support, or not,
to what they concluded. These results would be important in the exploration of ways in
which South Africa can move forward from its history.
The constant neurological electrochemical activity underlies, and is indicative of, the
constant workings of the brain (nervous system) (Jasper & Carmichael, 1935). This
activity can be measured through an electroencephalogram (EEG), which records the
ongoing neuroelectric activity within the brain though the scalp via attached surface
electrodes (Morgan, Hansen & Hillyard, 1996. Evoked Potentials (also known as Evoked
Response or Evoked Response Potentials [ERPs]) are the electrical potentials recorded
from the brain of humans in response to a stimulus, and are specifically time-locked to
that stimulus. It does this by extracting and averaging the time-locked stimulus potentials
from the ongoing EEG). Neuroelectric studies have shown that it takes 300ms for a
reaction to a stimulus to become conscious (Lamme, 2003). With regards to the evoked

EVOKED POTENTIAL, FACIAL RECOGNITION & CROSS-RACE EFFECT
5
potential of the cross-race effect on facial recognition, previous research has shown that
the cross-race effect occurs earlier than 300 milliseconds, with significant peaks at 170
milliseconds as well as 250 milliseconds (Caldara, Rossion, Bovet & Hauert, 2004; Ito et
al, 2004), which indicates that the significant aspects of facial recognition are at a
preconscious stage. This distinction has important implications. The results of previous
social-cognitive research are based on conscious decision making, due to the non-
neuroanalytic methods used, and therefore do not take the preconscious differentiation
into account. The temporal accuracy of the evoked potential will allow preconscious
measurements which will therefore accurately measure this effect. Therefore ERPs were
employed for this research as the exceptionally accurate temporal measurements of the
differences between recognition of in-group and out-group faces, will displayed
differences between races.
This research is interesting in that as an individual in South Africa one has the
opportunity to enjoy the benefit of a broader multicultural and multiracial society, and
one must therefore be able to live, adapt and integrate on into the society. The cross-race
effect existing in this context would make this decidedly more difficult, as it would
highlight (if only on an unconscious level) that there is a difference between oneself and
the out-group other (Hugenberg & Sacco, 2008). Therefore the implications of this,
specifically for the upcoming generations, are significant, as it will indicate if the ideal
non-discriminatory society is coming close to reality. Dependant on the results, insight
could be obtained as to the state of the cross-race effect, and whether it plagues South
African youth, or is diminishing and thereby helping to seal the interracial rift that is
apartheid‟s legacy.
EVOKED POTENTIAL, FACIAL RECOGNITION & CROSS-RACE EFFECT
6
Literature Review
The perception of a face allows us to recognize the person, infer his or her
emotional state, better understand what the person is saying, and derive general
information, such as age and gender. This unique visual stimulus has generated a
wealth of research, and subsequently theoretical and methodological debate.
(Young, De Haan & Bauer, 2008, p. 1)
Social Importance
The functional organization of this [Face Recognition] system embodies a
distinction between the representation of invariant aspects of faces, which is the
basis for recognizing individuals, and the representation of changeable aspects,
such as eye gaze, expression, and lip movement, which underlies the perception of
information that facilitates social communication…Of regions in the extended
system for face perception, the amygdala plays a central role in processing the
social relevance of information gleaned from faces, particularly when that
information may signal a potential threat. (Haxby, Hoffman & Gobbini, 2002, p
59)
Facial information is important for humans to be functionally social, from going to the
shops, to being aware of potential attackers on the street. This can be traced along
evolutionary lines where humans, as they began to evolve into a society, had to begin to
distinguish friend from foe, not just human from animal (Zhao, Chellappa, Phillips &
Rosenfeld, 2003). From this point the need to distinguish faces become more and more
important, to the point where in today‟s society it would be exceptionally difficult, if not
impossible, to make do without the ability. Any disruption to this ability would be to the
detriment of the person involved, and their interaction within their society. This is
illustrated in research by Yardley, McDermott, Pisarski, Duchaine, and Nakayama (2008)
which explores the social confidence and interaction of people suffering from
prosopagnosia (inability to recognise faces). Their research explored the traumatic social
EVOKED POTENTIAL, FACIAL RECOGNITION & CROSS-RACE EFFECT
7
interaction difficulties, the fear and avoidance of social interactions, and the negative
psychosocial consequences and occupational difficulties caused by the inability to
recognise faces. Their research highlights the social importance of the human ability to
recognise faces. This therefore can be seen to be one of the primary motivations behind
the research into facial recognition, and more specifically the cross-race effect, in other
countries (Kubota & Ito, 2007).
The cross-race effect is the phenomenon whereby a person will more easily recognise the
face of someone of their own race group than the face of a person from another race
group (Chiroro, Tredoux, Radaelli & Meissner, 2008). Social psychology believes that
this is due to the fact that one is generally around people of ones own race group more
often, specifically in childhood, and one therefore becomes accustomed to the faces of
ones own race group (Wright et al, 2003). Therefore by this logic, the cross-race effect
would be more visible in countries that have almost exclusively one race (such as China
or India), or countries where there is, or was, extreme racial segregation, such as South
Africa (Leibowits, Rohleder, Bozalek, Carolissen & Swartz, 2007). For most of South
Africa, there still exists a large amount of segregation in all areas of life, from segregated
residential areas (Christopher, 2005), to segregation in various aspects of University life
(Finchilescu, Tredoux, Mynhardt, Pillay & Muianga, 2007). This segregation should
create a clear cross-race effect within the population.
Yet one must also consider other aspects, such as that presented in „the contact
hypothesis‟ (Allport, 1954). This hypothesis essentially predicts that increased intergroup
contact, under the right (positive) conditions, leads to reduced prejudice. The contact
hypothesis has been the centre of a considerable body of work, and a meta-analysis of
this literature can be seen to conclude that intergroup contact does result in reduced
prejudice (Pettigrew & Tropp, 2006). Leading from this hypothesis, with regards to the
cross-race effect, one could theorise that the more contact one has with people from other
races the more familiar one becomes with them, and therefore one would expect a
decrease in the cross-race effect. The research performed by Wright et al (2003) confirms
EVOKED POTENTIAL, FACIAL RECOGNITION & CROSS-RACE EFFECT
8
this theory at sociological/conscious level, and the question that remains to be addressed
is whether this is also true at a pre-conscious electrophysiological level.
In South Africa where racial integration has become an everyday reality for many people,
one should theoretically expect to see differences within the cross-race effect, specifically
a decreased effect, following from the contact hypothesis. Therefore, the discussed
sample, taken as a representative of the future South African generations, should display
this decreased effect due to the amount of early interracial contact in the sample.
Underlying Cognitive Framework
Cognitive researchers have theorised that there are different processes, and thereby
models, used for object recognition and facial recognition. One of the basic and most
used models of facial recognition was created by Bruce and Young (1986). This cognitive
model is the underlying principle behind many of the newer models (Reisberg, 2006).
The model is described as such:
We have presented a functional framework for face recognition, in which a
number of components are distinguished. Different processes are involved in the
generation and storage of different kinds of information, or „codes‟. We have
described seven codes that can be distinguished in face processing, which we
label pictorial, structural, identity-specific semantic, visually derived semantic,
name, expression and facial speech codes. The last two of these are not directly
involved in face recognition, though they are clearly important for other aspects
of face perception…Everyday face recognition is seen as involving use of
structural codes to access identity-specific semantic information and names,
where available, in that order. (Bruce & Young, 1986, p 19)
As described, one can see that, according to cognitive theorists, facial recognition
employs a number of different processes to gather information about, and thereby
recognise, a face. One must however note that this description more closely reflects the

EVOKED POTENTIAL, FACIAL RECOGNITION & CROSS-RACE EFFECT
9
recognition of a familiar face. Presumably facial recognition of the face of a stranger
would be limited to the first two codes that were described: pictorial and structural. Facial
recognition is seen as a bottom-up process (Bar, 2003; Reisberg, 2006) as first the face is
recognised as a face before more specific and detailed information about the face is
gathered, such as characteristics and, if available, the identity of the face.
Cognitive theorists agree with the social theorists that the more one is forced to recognise
a certain thing, the more easily and efficiently it is recognised. This is known as priming
(Reisberg, 2006). The more frequently a cognitive system is accessed, the more readily
and easily it is accessed, thereby requiring far less time and effort. These cognitive
frameworks have neurological correlates, which will be examined next. With regards to
the cross-race effect, this would apply as the more the systems for cross-race facial
recognition are activated (that is the more contact one has with people of another race)
the more easily activated those systems will be. Recognising a common object (for
example, a shoe) is very different from the requirements of a face-recognition task (for
example, recognising your friend). Faces are visually confusable because they all have
the same component parts (eyes, mouth, nose, and so on). In contrast, a shoe is composed
of different parts compared with the objects you are asked to distinguish it from (for
example, trousers and dogs). Identifying common objects might also be regarded as
simpler because it is recognition at a supra-ordinate level (the category „shoe‟ has many
exemplars in the world), but face recognition requires the identification of a single
instance of an object (only one person is your friend) (Gazzaniga, Ivry & Mangun, 2009;
Reisberg, 2006). As there is a difference in the processes used for object recognition and
facial recognition, one must examine whether the neurology of these different types of
recognitions agree with this.
Neurology of Facial Recognition
There has been a vast amount of research on the neurology of a human‟s ability to
recognise other human faces (Zhao et al, 2003). This research has included most of the
conceivable aspects of this phenomenon. Research in the field has essentially agreed that

EVOKED POTENTIAL, FACIAL RECOGNITION & CROSS-RACE EFFECT
10
humans have a completely separate cognitive and neural system for indentifying human
faces than the system used for indentifying other objects or non-human faces.
Normal object recognition is generally understood as a bottom-up process (Bar, 2003).
This process is such that visual information that enters the eye travels along the optic
nerve to the primary visual cortex in the occipital lobe. From there the visual information
splits into parallel streams of where and what. The where stream travels dorsally to the
parietal lobe, where spatial and sensory-motor processing occurs, whilst the what stream
travels ventrally to the inferotemporal cortex where object processing occurs (Walsh &
Butler, 1996). It is here in the inferotemporal cortex where the process of normal object
recognition begins. The brain first recognises something as an object, before sending the
information to the memory centres where information about the object is retrieved, and
the object is finally recognised.
Facial recognition uses a similar process to that of object recognition. Yet there are
differences, as object recognition can uses both bottom-up (holistic analysis) and top-
down (analysis by parts) analysis (Bar, 2003), where facial recognition is a purely
bottom-up, or holistic analysis (a face is recognised as a face before the parts are analysed
to recognise an identity) (Tanaka, Kiefer & Bukach, 2004). Information travels from the
V1 in the occipital lobe along the ventral „what‟ stream to where is further analysed.
Functional imaging studies have revealed areas of specific functional specialisation
within the ventral stream. These areas of specialisation each deal with different forms of
recognition. Examples of these areas are the Fusiform Face Area, which shows increased
activation for faces of humans, the Parahippocampal Place Area for scenes vs. objects,
the Extrastriate Body Area for body parts vs. objects, MT+/V5 for moving stimuli vs.
static stimuli, and the Lateral Occipital Complex for discernable shapes vs. scrambled
stimuli (Spiridon, Fischl & Kanwisher 2006). Facial information therefore travels to the
fusiform gyrus which is the main neurological area localised for facial recognition, which
is in the occipitotemporal area of the cerebral cortex (Allison et al, 1994). Specifically
there the information goes to the fusiform face area, which is part of the fusiform gyrus,
located in the inferior temporal gyri (Walsh & Butler, 1996; Zillmer, Spiers &
Culbertson, 2008). This area of the brain is specifically designed to process and recognise

EVOKED POTENTIAL, FACIAL RECOGNITION & CROSS-RACE EFFECT
11
the uniqueness that is the human face. Research has suggested that the right hemisphere is
activated for upright and unfamiliar faces, while the left hemisphere is activated for facial
expression (Gazzaniga et al, 2009). Yet there are many areas within the two hemispheres
that contribute to facial recognition, and therefore the facial recognition system is made
up of a complex system of neural networks. “Recent face-processing models assume
highly interconnected neural structures between different temporal, occipital, and frontal
brain areas with several feedback loops” (Grüter et al, 2008, p. 1). This is due to the
nature of recognition within the brain, which involves links between visual areas,
recognition areas and finally memory areas. As previously stated recognition of a face as
a face, as opposed to non-face stimuli, occurs at a preconscious level (Bruce & Young,
1986). With evoked potential research focusing on neuroelectrical events occurring
between 150 and 300 ms after the presentation of the stimulus (although it is possible that
the preconscious activity could be a precursor for the opinions and biases), this is an
important aspect of this research as it facilitated an exploration into cross-race effect, in
the absence of the confounding issues arising from personal opinions and biases.
As mentioned, the fusiform face area is very specific in that it can only recognise faces
that are the right way up. If a face is presented inverted (upside down) humans battle to
recognise the facial features (as per gestalt, one would still see it as a face) (Sinha, Balas,
Ostrovsky & Russell, 2010). This can be seen in the famous pictures of Margret Thatcher
whereby one picture was merely inverted while the other was inverted and modified. Yet
these differences could only be seen when the pictures were put right side up (Reisberg,
2006). This phenomenon helps to highlight the exact specificity required by the fusiform
face area to accurately recognise faces. From the above, is it clear that the neurology of
object and facial recognition differ, and therefore agree with the theories proposed by
cognitive researchers.
Another phenomenon that highlights this point is that of a disorder called prosopagnosia.
Prosopagnosia which, although it may be accompanied by other types of recognition
problems (such a place recognition, car recognition, facial expression of emotion and so
on) often manifests solely as an inability to recognise faces (Grüter et al, 2008). This
EVOKED POTENTIAL, FACIAL RECOGNITION & CROSS-RACE EFFECT
12
renders the afflicted individual reliant on non-facial information such as hair, gait,
clothing or voice to identify others .Reflecting impaired functioning of the mid-fusiform
gyrus (fusiform face area) and/or the inferior occipital gyrus, the deficit may be acquired
as part of a degenerative process, following trauma (such as a stroke) or present as a
congenital developmental disorder (Hadjikhani & de Gelder, 2002). This phenomenon
displays the sensitivity of the ability to recognise faces, where all other objects are able to
be recognised other than faces due entirely to the malfunction of one small neurological
area.
Previous Research
An examination of the research methodology used in previous studies is an integral part
of conducting one‟s own research. Two separate studies that previously examined the
cross-race effect with the use of electroencephalograms were conducted by Caldara et al
in 2004, and Ito et al also in 2004. The study by Ito et al was conducted in the United
States of America, at the University of Colorado, while the Caldara et al study was
conducted in Switzerland, at the University of Geneva. The first noticeable link is that
both studies used university students as their sample. Caldara et al included only White
subjects in their research, while Ito el al, although they included both Black and White
participants, included only males. The second notable point is that both of these studies
occurred in countries where the White people are both the dominant and majority race
group. This can be seen in America where 72.4% of the population is White (UScensus,
2010), and in Switzerland where 83.4% of the population are White or European (Swiss
Confederation, 2010).
Regarding the electrophysiological recording procedures adopted in the research, they
tended to differ in this. The Caldara et al study used 62 silver/silver-chloride electrodes
embedded in a cap. The sampling rate was 500 Hz. Ocular artefacts were recorded on
bipolar electrodes by each eye. An electrode placed on the tip of the nose was used as the
reference electrode. Ito et al however differed from this procedure. They used tin
electrodes in their study, but they were also embedded in an electrode cap. The details of

EVOKED POTENTIAL, FACIAL RECOGNITION & CROSS-RACE EFFECT
13
the electrode placement are left vague in this study, only stating “Data were recorded at
sites over midline frontal (Fz), central (Cz), and parietal (Pz) areas” (Ito et al, 2004, p.
1270). Ito et al had a sampling rate of 1000 Hz, while Caldara had a sampling rate of 500
Hz. Both studies employed greyscale images for use as stimuli, as greyscale images were
standardised in the studies that both Ito et al and Caldara et al referenced, as well as
referring to the seminal Bruce and Young research (1986) which employed greyscale
images.
Where these two studies indicated more agreement was with their results. Relevant to
findings, both studies demonstrated significant differences in the amplitudes of the peaks
recorded at 170 and 250 milliseconds, for recordings in response to own and other race
facial stimuli. The significance appeared where own-race faces had greater peak
amplitudes in comparison to the peak amplitudes for other-race faces. The researchers
postulated that the greater amplitudes for own-race faces were inductive of greater
preconscious attention being given to own-race faces. Another area of agreement was
which electrode‟s data resulted in significance. Both studies state that the significant
electrodes were located in the temporal electrode sites, which is where the fusiform face
area is located (Hadjikhani & de Gelder, 2002).
By examining and understanding the methods and results of previous research, new
research is able to learn, replicate, and possibly improve on past research. As newer
research is able to draw on ever growing amounts of past research, theories and methods
may vary from previous research, yet the strong theoretical grounding that previous
research provides is invaluable.
Evoked-Response/Event-Related Potentials
Evoked response potentials have been used to measure cross-race effect of facial
recognition as they are one of the few types of neuroanalytic techniques that give strength
(amplitude of neuroelectric activity) and temporal (time of neuroelectric activity in
milliseconds) readings (Kubota & Ito, 2007). Results from previous research have

EVOKED POTENTIAL, FACIAL RECOGNITION & CROSS-RACE EFFECT
14
demonstrated a difference in the amplitude of the electrical potentials evoked at specific
latencies in response to faces of one‟s own race when compared to those evoked in
response to faces of another racial grouping (Caldara et al, 2004; Ito et al, 2004). Based
on this phenomenon researchers have established neurological evidence to correlate with
what was previously just a social-cognitive theory (Young et al, 2008). Social-cognitive
research has shown that there is a definite difference in the ability to recognise faces of
ones own race (better ability) than faces of another race (worse ability). Evoked potential
research has shown preconscious neuroelectric activity differences between recognition
of same-race and other-race faces in conjunction to this, which thereby supports the
social-cognitive theories. Therefore an evoked response potential is used instead of other
neuroanalytic technology, as it allows one to get accurate readings of the differences of
the peak amplitudes in facial recognition, thereby displaying the cross-race effect.
Evoked Potentials (also known as Evoked Response or Evoked Response Potentials) are
the electrical potentials recorded from the brain (nervous system) of humans in response
to a stimulus. Researchers specifically examine the latency and amplitude of peaks to
understand the neurological response. The brain‟s response to a single stimulus (such as a
face) is not usually visible in the electroencephalograph, as an electroencephalograph
essentially takes readings of all neuroelectric activity during the assigned time via the
attached electrodes, reflecting thousands of simultaneously ongoing brain processes,
which do not allow the peak evoked in response to a stimulus to be visible (Luck, 2005).
The response to a specific stimulus is time-locked to that stimulus, and a visible response
can be elicited though an averaging process (over about 100 trials) whereby the ongoing
activity is averaged out and the relevant event-related potential summated. In this way the
normal neurelectric activity present in every functioning brain is screened out allowing
the specific neuroelectric activity evoked from the stimulus to appear and thereby be
studied (Di Russo, Martínez, Sereno, Pitzalis & Hillyard, 2001).
Evoked potentials are also used to give rough spatial data, to show where neurologically
the stimulus evokes a response, but this does not give good specificity, unlike other tests
such as the PET (Positron Emission Tomography) scan. An electroencephalogram
EVOKED POTENTIAL, FACIAL RECOGNITION & CROSS-RACE EFFECT
15
functions by measuring electrical activity though the scalp via attached surface electrodes
(Morgan et al, 1996). The scalp locations of these electrodes are important, as they
measure the neuroelectric activity in the directly underlying brain structures. Therefore in
research such as this, where the reactions of a specific brain area (the fusiform face area)
are being examined, the placement of these electrodes is important. Dependant on what is
being examined, different electrode montages (number and placement of electrodes) are
be used. There are two functions of electrodes electroencephalograms, active electrodes
(which are actively recording activity) and reference electrodes (to which the other
electrodes are referenced). The electroencephalogram can be performed with either a
bipolar montage or a referential montage. Bipolar means that there are two electrodes per
recodring channel, therefore having a reference electrode for each channel. In a
referential montage there is a common reference electrode for all of the recording
channels (Jasper & Carmichael, 1935). In this research a referential montage was used,
with active electrodes placed at T3 and T5 on the left hemisphere, and T4 and T6 on the
right hemisphere. These electrode placements were chosen due to their proximity to the
fusiform face area in the occiptio-temporal cortex, as well as to be standardised with
previous research (Caldara et al, 2004; Ito et al, 2004)
Previous international research on the evoked potentials of the cross-race effect of facial
recognition has generated very similar results. In this line of research, the evoked
potentials are triggered with pictures of in-group and out-group faces. The response to
facial stimuli is first noticed is at 170 milliseconds, where there is a negative amplitude
peak, called N170. Previous research has suggested that the significant of this peak is that
at this time faces are distinguished from non-face stimuli (Caldara et al, 2004; Ito et al,
2004). The second peak of significant was located at 250 milliseconds. It is here where
previous research has postulated that the cross-race effect becomes visible, as it is at this
time that in-group faces are differentiated from out-group faces (Caldara et al, 2004; Ito
et al, 2004).
Results from previous research have suggested that there are larger peak amplitudes at
250 milliseconds in response to in-group faces, in comparison to the response for out-
EVOKED POTENTIAL, FACIAL RECOGNITION & CROSS-RACE EFFECT
16
group faces. In line with the suggestion that this peak represents a process of specific
analysis, research has demonstrated that morphology of the peak is also susceptible to an
analysis of emotional expression. For this reason, in studies of cross-race effect, it is
important that the stimuli utilised reflect a neutral expression (Miyoshi, Katayama &
Morotomi, 2004). Therefore in an attempt to control for this, all faces that will be used as
stimuli for the ERP will have a neutral facial expression.
Colour versus Black and White
In line with the seminal research by Bruce and Young (1986), standard procedure in
evoked potential studies focusing on cross-race effect in facial recognition is to use
greyscale stimuli (Caldara et al, 2004; Ito et al, 2004; Kubota & Ito, 2007; Miyoshi,
Katayama & Morotomi, 2004; Shriver, Young, Hugenberg, Bernstein & Lanter, 2008).
The advantage of this is that it allows one‟s research to be comparable, both with
previous research, and with the seminal research, theoretically strengthening the results of
all the research.
Basing one‟s research on strong seminal research is, of course, the usual and accepted
manner of conducting research. Yet in this case it actually presents a methodological
problem in that using greyscale images in the research would have serious negative
consequences on the internal validity of the study. Human beings see the world in colour,
therefore using images that are not in realistic colour compromise the ecological validity
of the research (Frey, Honey & König, 2008), and therefore one must question whether
the results of such studies actually show empirically meaningful results. Research by
Frey, Honey and König (2008) explored the differences in visual attention in humans
between greyscale and coloured images. Their results illustrated that there is a significant
difference in the visual attention saliency maps between coloured and greyscale images.
The differences varied over the types of images, but images of faces showed one of the
greatest differences. “The improvement seen in saliency-based discrimination when color
information is present means that subjects look at those locations more often in colored
images than greyscale images” (Frey, Honey & König, 2008, p. 14). This implies that the
EVOKED POTENTIAL, FACIAL RECOGNITION & CROSS-RACE EFFECT
17
subjects devoted greater attention to the coloured images, thereby conforming to what is
seen daily in human vision. This mean that greater neurological activity was devoted to
the coloured images. These results therefore display important information with regards
to this research. If, as suggested, the visual attention that a subject gives to an image is
greater when the picture is in life-like colour, it stands to reason that the results obtained
from using coloured images would elicit greater neurological activity. This increased
neurological activity would allow theoretically one to record improved and more realistic
results with regard to the neuroelectric activity associated with facial recognition.
Cultural Neuroscience
Cultural neuroscience is a relatively new term within the fields of psychology and
neurology. This field could be constructed as an offshoot of the classic nature versus
nurture debate on behaviour. That debate essentially states that the interchange between
ones genetic makeup (nature) and ones environment (nurture) are what defines one‟s
neurology and therefore one‟s behaviour (Chiao, 2011). Cultural neuroscience, however,
seeks to change that dichotomy. Cultural neuroscience states that it is the interplay
between genes and specific cultural traits that affects neural activity, which therefore
affects behaviour (Chiao, 2011). This approach can obviously be seen to take root in the
original, as one‟s culture is a part of one‟s environment. Yet this approach defines culture
as the specific part of one‟s environment that is the affecter of neural activity. If one
considers culture to represent a set of beliefs and behaviours shared within a community,
then one must assume that culture has the power to alter the basic structure and function
of the biological process (Chiao, 2010). Practitioners in the field adopt a co-constructivist
approach in their understanding of the synergistic power of cultural and biological factors
as mediators of behaviour (Losin, Dapretto & Iacoboni, 2010).
This approach has both strong positive and negative influences with regards to this
research. South Africa is multicultural society, commonly dubbed the „Rainbow Nation‟.
By the definition of this theory each specific culture will influence the neurology and
therefore behaviour of the person who is part of that culture. This then creates a whole

EVOKED POTENTIAL, FACIAL RECOGNITION & CROSS-RACE EFFECT
18
host of different behaviours. One must question whether individual cultural identities are
retained, or whether a universal culture emerges out of the melting pot of South African
society, or whether prevalent cultural norms and values differentially impact on
individual sectors mutating specific cultural representations.
Following from this, one could theorise that South Africa has a specific united culture of
its own. This can be seen through the things that are uniquely „South African‟ (such as
the Vuvuzela), and the many things that unite the country, such as sport. An example of
this, was in the months leading up to the FIFA 2010 Soccer World Cup held in South
Africa, every Friday became Football Friday where everyone wore a soccer shirt in
support of both the South African team and the country itself (SouthAfrica.info, 2010).
This unity displays a country-wide culture, which would affect behaviour.
Although there are many different cultures within South Africa, evidence suggests that
there is a united country-wide culture as well. Both of these would have an effect on a
person‟s neurology, and behaviour (in accordance with the theory of cultural
neuroscience). One could postulate that research will help define this theory further by
providing evidence as to which has the greater effect on a person‟s neurology and
behaviour: the microcosm of one‟s individual culture, or the macrocosm of the united
country-wide culture (society).
Sample
Similarly to previous research in the area (Caldara et al, 2004; Kubota & Ito, 2007;
Shriver, Young, Hugenberg, Bernstein & Lanter, 2008), the present study drew its sample
from a university population. This ensured that the results established through previous
research are comparable to this study. There was another purpose to using participants in
this age range. Previous research demonstrates that the White race in general suffers more
from the cross-race effect than the Black race (Anthony et al, 1992). This research, based
on the past segregation and discrimination, assumed that the same could be applied in
South Africa. In addition relative to the present South African socio-political climate, this

EVOKED POTENTIAL, FACIAL RECOGNITION & CROSS-RACE EFFECT
19
particular cohort (below the age of 24 years) have acculturalised within a legally
integrated society.
One must question whether this integration has affected the standard cross-race effect for
this integrated generation. University students were used as they fit into the criterion of
previous research as well as fitting into the integrated age range. The University of the
Witwatersrand (WITS) is one of the most integrated universities in South Africa showing
the greatest racial student diversity (WITS, 2009). In 2009 out of the 28204 students
enrolled at wits, 15251 were Black, 960 were Coloured, 4063 were Indian, and 7910 were
White (with 20 unknowns). Students from WITS have received daily interracial exposure
at university. Although the cohort used in this research is not representative of the general
population, they have been exposed to specific acculturation variables making them a
representation of a possible future general population.

EVOKED POTENTIAL, FACIAL RECOGNITION & CROSS-RACE EFFECT
20
Research Questions
-Does the cross-race effect for facial recognition exist in South African youth?
-Is there a gender effect with regards to facial recognition in South African youth?
-Is there a difference in the cross-race effect of facial recognition between Black and
White South Africans?

EVOKED POTENTIAL, FACIAL RECOGNITION & CROSS-RACE EFFECT
21
Chapter 2: Methodology
Electroencephalogram and Evoked Response Potential
A Nihon Kohden Neurofax Electroencephalograph was used to record neuroelectric
activity from silver-silver chloride disc electrodes individually attached at predetermined
positions in accordance with the international 10-20 classification system (Jasper, 1958),
with a sampling rate was 1000 Hz. Electrode placements were in the tempero-parietal
area, specifically C3, T3 and T5 (left hemisphere) and C4, T4 and T6 (right hemisphere),
all referred to Cz (the reference electrode), and a forehead grounding electrode. A1 and
A2 were attached for the purpose of impedance checks (as required by the
electroencephalogram), but were not recorded, and C3 and C4 were attached due to the
recording requirements of the electroencephalogram, but were not analysed. Electrode
impedance was all kept below 5 KΩ, in accordance to international standards. (Caharel et
al, 2002).
The Stimulus was displayed on a High Definition 1080p screen at a resolution of
1366x768. All images were the same size and aspect ratio, and showed a frontal view,
with eyes aligned on the horizontal midline of the image. Participants were seated
approximately one meter from the screen, with their eyes aligned to the centre of the
screen. A photo-sensor (light-sensor) was attached to the screen and then to the EEG
setup, where the readings from the photo-sensor were measured via a special DC channel
in the EEG montage. The stimuli pictures all had white strips bordering the sides.
Whenever a picture was displayed on screen, the photo-sensor would send a current to the
EEG setup, registering the increased voltage, and a black screen resulted in the machine
registering a lowered voltage. This created a square-waveform. This waveform was used
to extract the ERPs from the EEG. ERP extraction, filtering and ERP analysis was
performed using EEGLAB version 9.0.2.3b (Delorme & Makeig, 2004).
The results of previous research on the evoked potential of the cross-race effect have
displayed similar significant findings with regards to the latencies of peaks which display

EVOKED POTENTIAL, FACIAL RECOGNITION & CROSS-RACE EFFECT
22
significant results. As discussed, the first area of significance, where faces are
distinguished, is at the N170, and the second area of significance is at 250 milliseconds,
where in-group faces were differentiated from out-group faces (Caldara et al, 2004; Ito et
al, 2004). From this a time base of 500 milliseconds was used (Evoked potentials were
extracted for the 500 milliseconds after the onset of the stimulus). The results obtained
were one latency-amplitude graph with a time base of 500 milliseconds (see figure 1 for
example) per electrode (T3, T4, T5 and T6) per stimulus (the four sets of pictures). That
is one graph recorded in response to Black Female faces, one for Black Male faces, one
for White Female faces and one for White Male faces per electrodes. Graphs combined
for race only and gender only faces were also obtained.
Faces used as stimuli were in the form of digital identity or passport photographs,
obtained, with permission, from various photographers in and around Johannesburg.
These photographs were used as, due to the requirements for passport and identification
photographs from the Department of Home Affairs (2011), the faces used as stimuli all
had a neutral facial expression (Miyoshi, Katayama & Morotomi, 2004), open eyes, clear
lighting, frontal view and no hair touching the face, with all photographs being in equal
proportions, with the face in the centre of the photograph.
Instruments
Two modified scales, combined referred to as the Racial Prejudice questionnaire in this
study (See Appendix 4), were used as part of the exclusion criteria (see below with
regards to the sample (Finchilescu et al, 2007). The sample was purposively selected as
having specific acculturation variables and theoretically high interracial exposure. These
scales were used to ensure that none of the participants were racially prejudiced.
The first scale was the Affective Prejudice Scale based on the original scale by Zanna
(1994). This scale consisted of 6 items, where each item consisted of two bipolar
adjectives (example: Trusting and Suspicious) at each ends of a 7-point Likert scale.
Participants indicated their feelings on this scale using the provided words. The scale was
EVOKED POTENTIAL, FACIAL RECOGNITION & CROSS-RACE EFFECT
23
scored so that a lower score indicated a higher level of prejudice. The second scale was
based on the Social Distance Scale created by Bogardus (1925). This scale consisted of
six items answered on a 5-point descending scale (Any to None). The items essentially
measure how close the participants are willing to allow the other racial group (or groups
with regards to the Indian sample) into their lives. Again, a lower score indicated a high
level of prejudice/desired social distance. Both these scales have been successfully used
in the South African context in both White and Black samples. The Affective Prejudice
scale and the Social Distance Scale have both obtained very good psychometric results in
previous research, obtaining alpha coefficients averaging 0.83 and 0.88 respectively
(Finchilescu et al, 2007).
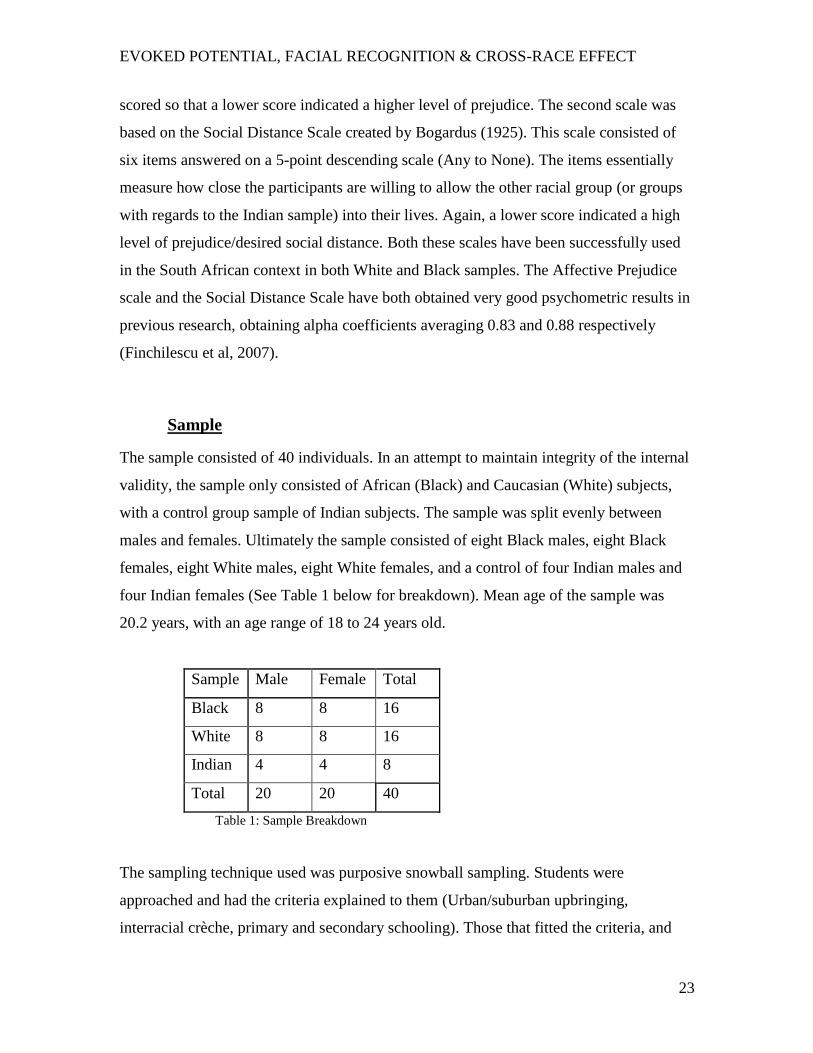
Sample
The sample consisted of 40 individuals. In an attempt to maintain integrity of the internal
validity, the sample only consisted of African (Black) and Caucasian (White) subjects,
with a control group sample of Indian subjects. The sample was split evenly between
males and females. Ultimately the sample consisted of eight Black males, eight Black
females, eight White males, eight White females, and a control of four Indian males and
four Indian females (See Table 1 below for breakdown). Mean age of the sample was
20.2 years, with an age range of 18 to 24 years old.
Sample Male Female Total
Black 8 8 16
White 8 8 16
Indian 4 4 8
Total 20 20 40
Table 1: Sample Breakdown
The sampling technique used was purposive snowball sampling. Students were
approached and had the criteria explained to them (Urban/suburban upbringing,
interracial crèche, primary and secondary schooling). Those that fitted the criteria, and
EVOKED POTENTIAL, FACIAL RECOGNITION & CROSS-RACE EFFECT
24
were happy to participate did so. Participants were asked to encourage fellow students
who they knew to fit the sampling criteria to participate.
The age range was between 18 and 24 years old, based upon the following reasoning.
Research has shown that children as young as three years old display the cross-race effect
(Sangrigoli et al, 2005). Yet an adoption study by Sangrigoli et al (2005) displayed that
Korean children who were adopted by White families as old as the age of nine displayed
an inverse cross-race effect (favouring the White race instead of their own Asian race) at
adolescence. They surmised that as long as relative amount cross-race integration
occurred before adolescence (12-14 years old) the effects of the cross-race effect could be
minimised, if not completely removed, and their sample of children adopted at nine years
old confirmed this. In South Africa in 1996 the South African schools act was passed
allowing for equal opportunity schooling for all children within South Africa (South
African Schools Act, 1996). Therefore, as of 1996, public schools were officially
integrated leading to increased interracial exposure in schools. Although this is most
specifically achieved within urban and suburban settings, the effects are slowly widening
to encompass society as a whole (Christopher, 2005). Children who were nine years old
or younger in 1996 would therefore have benefitted from this with regards to the effects
on the cross-race effect (Sangrigoli et al, 2005). These children would be 24 years old or
younger in 2011. Therefore, based on the literature, the age range of 18 to 24 years olds
was chosen. Only subjects who had received sub/urban schooling, being more integrated
than rural or township schools (Christopher, 2005; Hofmeyr, 2000), from a pre-primary
through to high school level, were used in this study.
Most of the studies using Evoked potentials with regards to the cross-race effect of facial
recognition, such as the studies of as Ito et al (2004) as well as Herrmann et al (2007)
have only used one race within their test sample. This study attempted to expand on the
knowledge of previous studies by incorporating both of the races being used in the
experiments within the sample. This also allowed the study to examine the differences, if
any, between the two races.

EVOKED POTENTIAL, FACIAL RECOGNITION & CROSS-RACE EFFECT
25
Exclusion Criteria
Individuals with a history of head injury and epilepsy were excluded. Specifically from
an ethical point of view, individuals suffering from photo-sensitive epilepsy could be
induced into an attack due to the changes of light from the flashing of the pictures
(Frucht, Quigg, Schwaner & Fountain, 2000). Individuals who scored a low mark on the
Racial Prejudice Scale (Any score lower than 42 on the combined scale) were excluded
for having a high level of racial prejudice (which would, if included, confound the
results). Only one participant from the main group was excluded for low scores on the
Racial Prejudice scale, but another participant was found as a replacement.
Research Design
This is a non-experimental design as the Independent Variable, the history of South
Africa and the subject‟s background within it, cannot be manipulated. The sample was
compared both to themselves (within-subject comparison), and to each other (cross-race
comparison). Specifically this study was a non IV-manipulated cross-sectional quasi-
experimental post-test only control group design.
Procedure
Subjects were approached in lectures to participate in the study. Those volunteers who
fitted the sample criteria were given further information. Those that agreed to participate
were asked to sign the consent form.
The technical procedure was then explained to the participants and assurances given that
that is was a completely safe and non-invasive procedure, and only recordings were being
performed. As previously stated the information being gathered is at a preconscious level,
and subjects were instructed to passively focus their attention on a central focal point on
the screen. Therefore participants just needed to sit passively and stare at the screen, and
this was explained to them. Instructions were then given and electrodes attached.
Electrode attachment took between 15 to 20 minutes per person. The exact nature of the

EVOKED POTENTIAL, FACIAL RECOGNITION & CROSS-RACE EFFECT
26
experiment was not be explained to the participants as previous research by Ito et al
(2004) has displayed that priming participants changes the obtained results to reflect a
lower cross-race effect. Participants were then instructed to relax, put their feet flat on the
floor, and focus their visual attention passively on the central fixation point. They were
also informed that once the trial had begun they may not talk, and must attempt to move
as little as possible as that would interfere with the obtained results, due to the fact that
muscle activity is also a neuroelectric response, much more prominent than the response
to facial recognition. Once they understood the instructions, and were relaxed, the trial
began.
The stimulus presented was comprised of pictures of faces (see Appendix 3 for a sample
face picture). The face stimuli were presented in four different sets. Each set consisted of
a picture of a face for 500 milliseconds, followed by a black screen for 500 milliseconds,
followed by another picture and so on, until 50 faces had been shown. Each set consisted
of 50 various faces of one race and gender. Specifically the sets were (in order): Black
Female, Black Male, White Female, and White Male. The sets were separated for two
main reasons. Firstly due to the limitations of the analysis software in separating different
stimuli in one set into different ERPs, sets containing a single type of stimulus were used.
And secondly to avoid the effect that surprise (as induced by a sudden change between
race and/or gender within one set) would have on the ERPs (Neville, Snyder, Woods &
Galambos, 1982). Each set took 50 seconds to complete, and there was a space of 10 to
30 seconds in between each set. Total recording time was approximately four minutes.
Once the recording was completed, the participants were given the Racial Prejudice
questionnaire to complete whilst the electrodes were removed and their scalps cleaned.
The total time taken per participant was on average 30 minutes.

EVOKED POTENTIAL, FACIAL RECOGNITION & CROSS-RACE EFFECT
27
Chapter 3: Results
Results
The results obtained consisted of one ERP latency-amplitude graph per electrode per
stimulus set (See Figure 1 below for an example). Electrodes that were analysed, with
regards to results from previous research (Caldara et al, 2004; Ito et al, 2004) and their
location over the Fusiform gyrus (Zillmer et al, 2008), were T3, T4, T5 and T6. Therefore
there were four electrode readings for each stimulus set per participant. Within each
reading, there were two obtained results from the two peaks at approximately 170ms and
250ms. Therefore a total of 1280 individual results were obtained for this study.
Figure 1: Evoked Response Potential
EVOKED POTENTIAL, FACIAL RECOGNITION & CROSS-RACE EFFECT
28
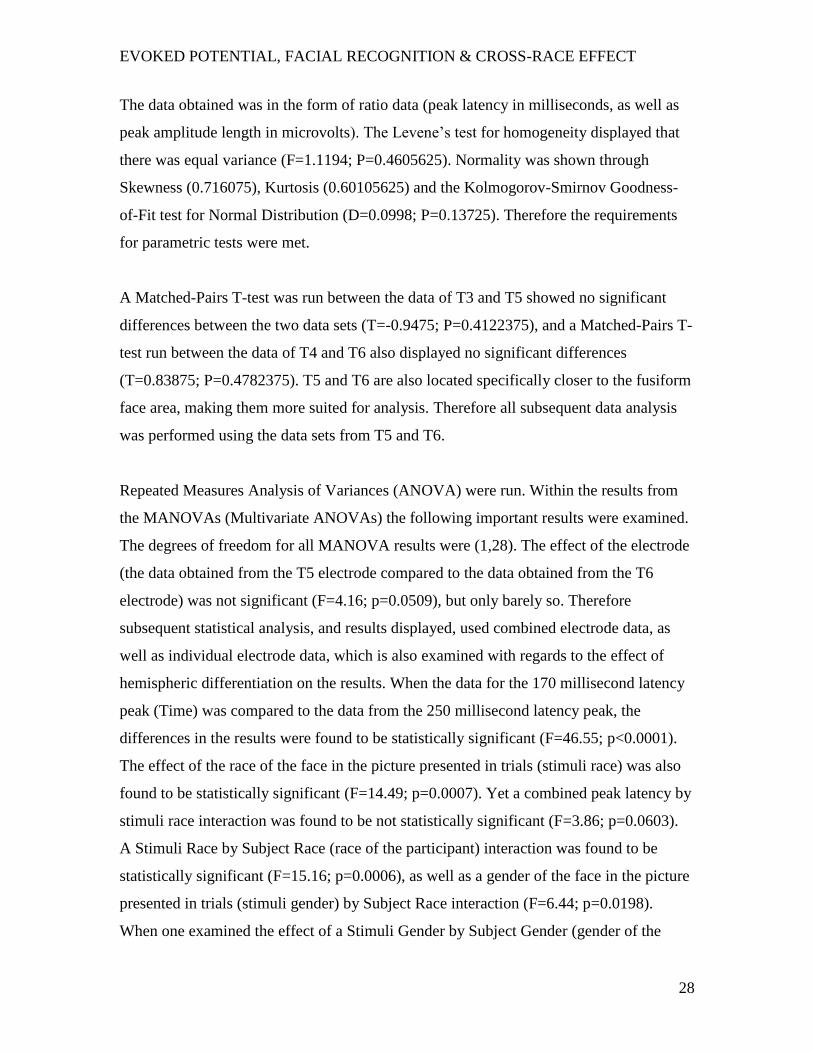
The data obtained was in the form of ratio data (peak latency in milliseconds, as well as
peak amplitude length in microvolts). The Levene‟s test for homogeneity displayed that
there was equal variance (F=1.1194; P=0.4605625). Normality was shown through
Skewness (0.716075), Kurtosis (0.60105625) and the Kolmogorov-Smirnov Goodness-
of-Fit test for Normal Distribution (D=0.0998; P=0.13725). Therefore the requirements
for parametric tests were met.
A Matched-Pairs T-test was run between the data of T3 and T5 showed no significant
differences between the two data sets (T=-0.9475; P=0.4122375), and a Matched-Pairs T-
test run between the data of T4 and T6 also displayed no significant differences
(T=0.83875; P=0.4782375). T5 and T6 are also located specifically closer to the fusiform
face area, making them more suited for analysis. Therefore all subsequent data analysis
was performed using the data sets from T5 and T6.
Repeated Measures Analysis of Variances (ANOVA) were run. Within the results from
the MANOVAs (Multivariate ANOVAs) the following important results were examined.
The degrees of freedom for all MANOVA results were (1,28). The effect of the electrode
(the data obtained from the T5 electrode compared to the data obtained from the T6
electrode) was not significant (F=4.16; p=0.0509), but only barely so. Therefore
subsequent statistical analysis, and results displayed, used combined electrode data, as
well as individual electrode data, which is also examined with regards to the effect of
hemispheric differentiation on the results. When the data for the 170 millisecond latency
peak (Time) was compared to the data from the 250 millisecond latency peak, the
differences in the results were found to be statistically significant (F=46.55; p<0.0001).
The effect of the race of the face in the picture presented in trials (stimuli race) was also
found to be statistically significant (F=14.49; p=0.0007). Yet a combined peak latency by
stimuli race interaction was found to be not statistically significant (F=3.86; p=0.0603).
A Stimuli Race by Subject Race (race of the participant) interaction was found to be
statistically significant (F=15.16; p=0.0006), as well as a gender of the face in the picture
presented in trials (stimuli gender) by Subject Race interaction (F=6.44; p=0.0198).
When one examined the effect of a Stimuli Gender by Subject Gender (gender of the

EVOKED POTENTIAL, FACIAL RECOGNITION & CROSS-RACE EFFECT
29
participant) interaction, the results were found not to be statistically significant (F=0.35;
p=0.5614).
Within Fixed Effects, when examining results for hemispheres separately, different
significant results were displayed between the T5 results, T6 results, and combined
results. Similarly when one examined those results both without (only Black and White
participants) and with the Indian control group, the results differed. These are explored
below.
Examining the results for the Test groups (Black and White participants only), the T5
results displayed statistically significant effects only in a Stimuli Race by Subject Race
interaction (F=9.85; p=0.002). When the Indian control group was included in the
analysis, the Stimuli Race by Subject Race interaction remained statistically significant
(F=7.92; p=0.0005).
The results from T6 displayed many more significant effects than the T5 results. The
Black and White participants displayed the following significant results: Stimuli Race
revealed to have a significant effect (F15.02; p=0.001), as well as a Stimuli Race by
Subject Race interaction being statistically significant (F=5.59; p=0.019). A Stimuli
Gender by Subject Race interaction was found to be statistically significant (F=10;
p=0.0018) together with a Stimuli Race by Stimuli Gender interaction (F=4.43;
p=0.0366). With the inclusion of the control group, the results from the Stimuli Race
effect (F=17.25; p<0.0001), the Stimuli Race by Subject Race interaction (F=3.04;
p=0.0496) and Stimuli Gender by Subject Race interaction (F=5.49; p=0.0047) all
remained statistically significant. There was also statistically significant results for a
Subject Race effect (F=3.6; p=0.0288), as well as a Stimuli Race by Stimuli Gender by
Subject Race interaction effect (F=3.58; p=0.0292).
When combining the sets from T5 and T6, the following results were found for the Black
and White participants: Stimuli Race effect was statistically significant (F=7.10;
p=0.008), together with a Stimuli Race by Subject Race interaction effect (F=7.43;
EVOKED POTENTIAL, FACIAL RECOGNITION & CROSS-RACE EFFECT
30
p=0.0067) and finally a Stimuli Gender by Subject Race interaction was statistically
significant (F=5.3; p=0.0218).
When the Indian control group is included in the analysis, the only remaining statistically
significant result is a Stimuli Race by Subject Race interaction (F=4.67; p=0.0098), with a
Stimuli Gender by Subject Race interaction effect then becoming not significant (F=2.82;
p=0.0583).
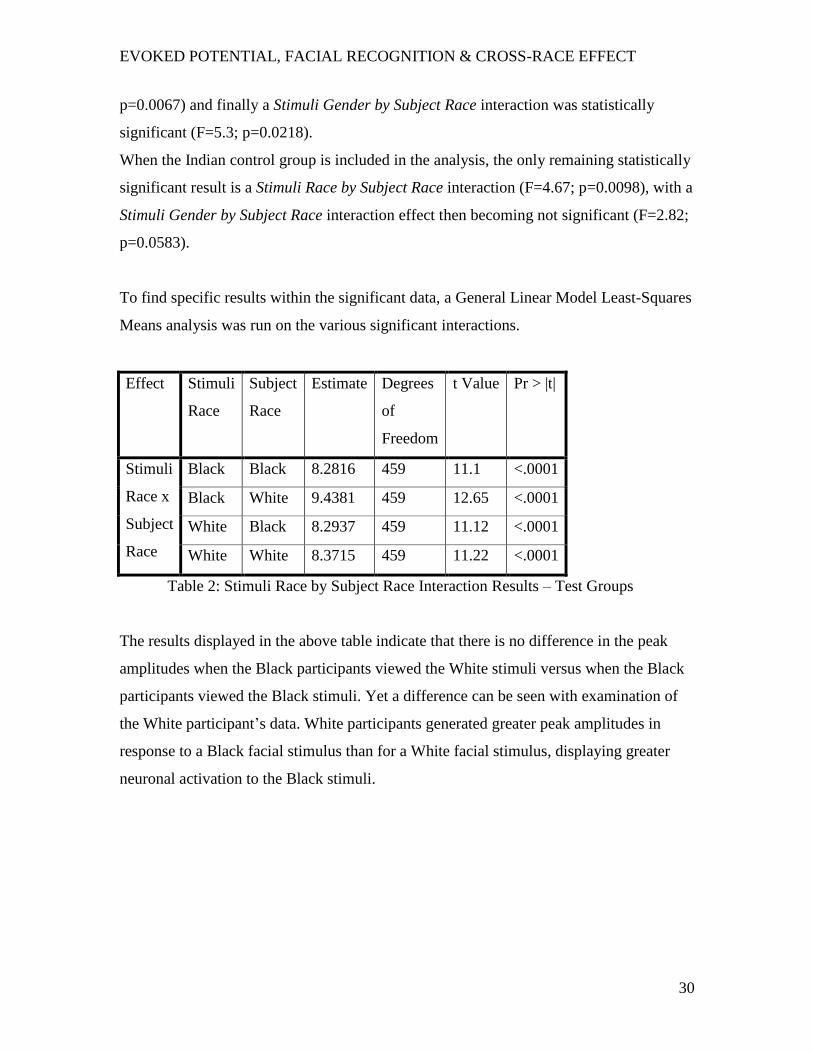
To find specific results within the significant data, a General Linear Model Least-Squares
Means analysis was run on the various significant interactions.
Effect Stimuli
Race
Subject
Race
Estimate Degrees
of
Freedom
t Value Pr > |t|
Stimuli
Race x
Subject
Race
Black Black 8.2816 459 11.1 <.0001
Black White 9.4381 459 12.65 <.0001
White Black 8.2937 459 11.12 <.0001
White White 8.3715 459 11.22 <.0001
Table 2: Stimuli Race by Subject Race Interaction Results – Test Groups
The results displayed in the above table indicate that there is no difference in the peak
amplitudes when the Black participants viewed the White stimuli versus when the Black
participants viewed the Black stimuli. Yet a difference can be seen with examination of
the White participant‟s data. White participants generated greater peak amplitudes in
response to a Black facial stimulus than for a White facial stimulus, displaying greater
neuronal activation to the Black stimuli.

EVOKED POTENTIAL, FACIAL RECOGNITION & CROSS-RACE EFFECT
31
Effect Stimuli
Gender
Subject
Race Estimate
Degrees
of
Freedom
t Value Pr > |t|
Stimuli
Gender
x
Subject
Race
Female Black 8.1991 459 10.99 <.0001
Female White 9.2718 459 12.43 <.0001
Male Black 8.3762 459 11.23 <.0001
Male White 8.5378 459 11.45 <.0001
Table 3: Stimuli Gender by Subject Race Interaction Results – Test Groups
The results for Stimuli Gender by Subject Race interaction indicate very similar results to
those of the Stimuli Race by Subject Race interaction. Black participants displayed no
gender differentiation in their peak amplitudes, where White participants generated
higher amplitude peaks in response to the Female stimuli than in response to the Male
stimuli.
Effect Stimuli
Race
Subject
Race Estimate
Degrees
of
Freedom
t Value Pr > |t|
Stimuli
Race x
Subject
Race
Black Black 8.2816 566 11.8 <.0001
Black Indian 6.4926 566 6.33 <.0001
Black White 9.4381 566 13.45 <.0001
White Black 8.2937 566 11.82 <.0001
White Indian 6.5067 566 6.35 <.0001
White White 8.3715 566 11.93 <.0001
Table 4: Stimuli Race by Subject Race Interaction Results – Whole Sample
When the control group is included within the Stimuli Race by Subject Race interaction,
the results for the Black and White participants remain the same. The results for the
EVOKED POTENTIAL, FACIAL RECOGNITION & CROSS-RACE EFFECT
32
Indian participants indicated that there was no significant difference between peak
amplitudes for the Black stimuli and the peak amplitudes for the White stimuli.
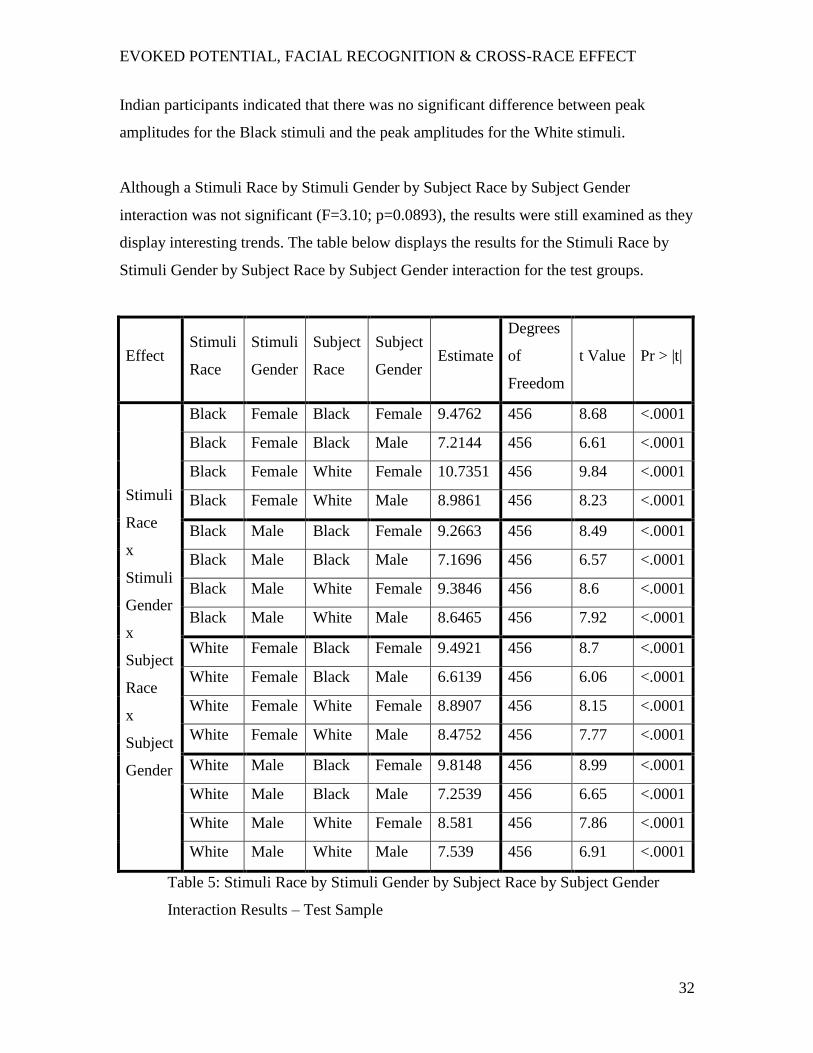
Although a Stimuli Race by Stimuli Gender by Subject Race by Subject Gender
interaction was not significant (F=3.10; p=0.0893), the results were still examined as they
display interesting trends. The table below displays the results for the Stimuli Race by
Stimuli Gender by Subject Race by Subject Gender interaction for the test groups.
Effect Stimuli
Race
Stimuli
Gender
Subject
Race
Subject
Gender Estimate
Degrees
of
Freedom
t Value Pr > |t|
Stimuli
Race
x
Stimuli
Gender
x
Subject
Race
x
Subject
Gender
Black Female Black Female 9.4762 456 8.68 <.0001
Black Female Black Male 7.2144 456 6.61 <.0001
Black Female White Female 10.7351 456 9.84 <.0001
Black Female White Male 8.9861 456 8.23 <.0001
Black Male Black Female 9.2663 456 8.49 <.0001
Black Male Black Male 7.1696 456 6.57 <.0001
Black Male White Female 9.3846 456 8.6 <.0001
Black Male White Male 8.6465 456 7.92 <.0001
White Female Black Female 9.4921 456 8.7 <.0001
White Female Black Male 6.6139 456 6.06 <.0001
White Female White Female 8.8907 456 8.15 <.0001
White Female White Male 8.4752 456 7.77 <.0001
White Male Black Female 9.8148 456 8.99 <.0001
White Male Black Male 7.2539 456 6.65 <.0001
White Male White Female 8.581 456 7.86 <.0001
White Male White Male 7.539 456 6.91 <.0001
Table 5: Stimuli Race by Stimuli Gender by Subject Race by Subject Gender
Interaction Results – Test Sample
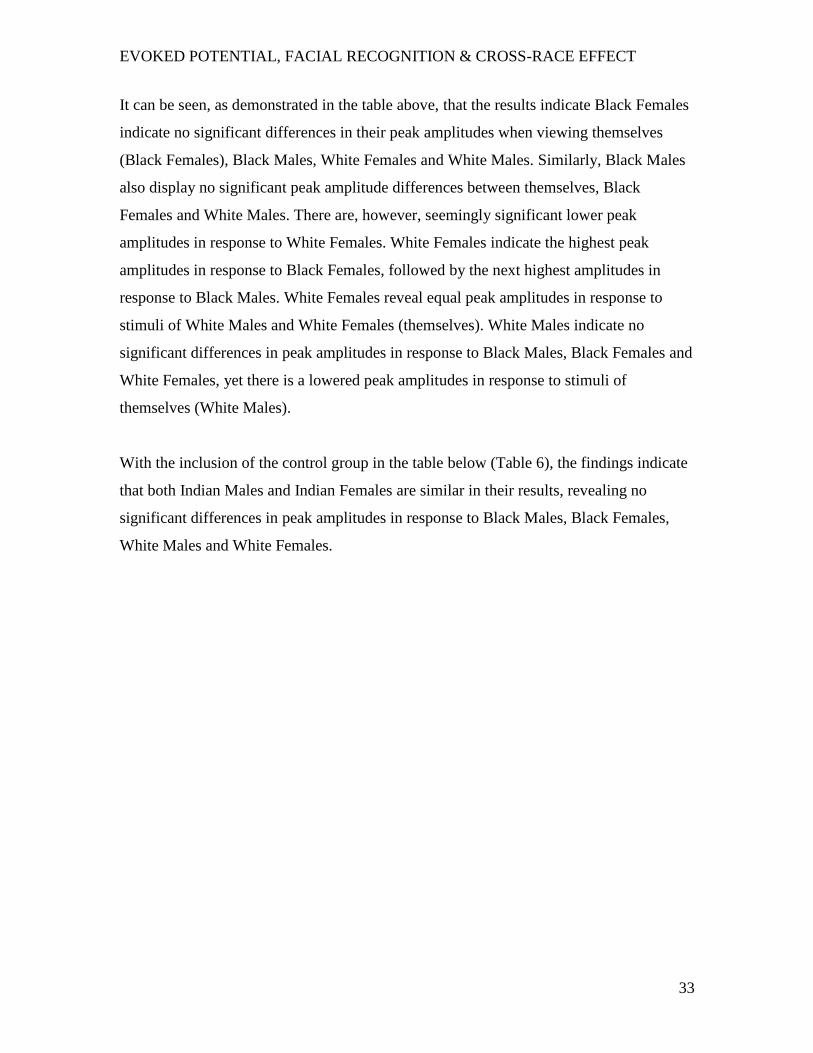
EVOKED POTENTIAL, FACIAL RECOGNITION & CROSS-RACE EFFECT
33
It can be seen, as demonstrated in the table above, that the results indicate Black Females
indicate no significant differences in their peak amplitudes when viewing themselves
(Black Females), Black Males, White Females and White Males. Similarly, Black Males
also display no significant peak amplitude differences between themselves, Black
Females and White Males. There are, however, seemingly significant lower peak
amplitudes in response to White Females. White Females indicate the highest peak
amplitudes in response to Black Females, followed by the next highest amplitudes in
response to Black Males. White Females reveal equal peak amplitudes in response to
stimuli of White Males and White Females (themselves). White Males indicate no
significant differences in peak amplitudes in response to Black Males, Black Females and
White Females, yet there is a lowered peak amplitudes in response to stimuli of
themselves (White Males).
With the inclusion of the control group in the table below (Table 6), the findings indicate
that both Indian Males and Indian Females are similar in their results, revealing no
significant differences in peak amplitudes in response to Black Males, Black Females,
White Males and White Females.

EVOKED POTENTIAL, FACIAL RECOGNITION & CROSS-RACE EFFECT
34
Effect Stimuli
Race
Stimuli
Gender
Subject
Race
Subject
Gender Estimate
Degrees
of
Freedom
t Value Pr > |t|
Stimuli
Race
x
Stimuli
Gender
x
Subject
Race
x
Subject
Gender
Black Female Black Female 9.4762 566 9.21 <.0001
Black Female Black Male 7.2144 566 7.01 <.0001
Black Female Indian Female 6.2845 566 3.74 0.0002
Black Female Indian Male 6.6868 566 5.14 <.0001
Black Female White Female 10.7351 566 10.43 <.0001
Black Female White Male 8.9861 566 8.73 <.0001
Black Male Black Female 9.2663 566 9 <.0001
Black Male Black Male 7.1696 566 6.97 <.0001
Black Male Indian Female 6.0914 566 3.62 0.0003
Black Male Indian Male 6.9075 566 5.31 <.0001
Black Male White Female 9.3846 566 9.12 <.0001
Black Male White Male 8.6465 566 8.4 <.0001
White Female Black Female 9.4921 566 9.22 <.0001
White Female Black Male 6.6139 566 6.43 <.0001
White Female Indian Female 6.3918 566 3.8 0.0002
White Female Indian Male 6.8813 566 5.29 <.0001
White Female White Female 8.8907 566 8.64 <.0001
White Female White Male 8.4752 566 8.23 <.0001
White Male Black Female 9.8148 566 9.54 <.0001
White Male Black Male 7.2539 566 7.05 <.0001
White Male Indian Female 6.039 566 3.59 0.0004
White Male Indian Male 6.7146 566 5.16 <.0001
White Male White Female 8.581 566 8.34 <.0001
White Male White Male 7.539 566 7.32 <.0001
Table 6: Stimuli Race by Stimuli Gender by Subject Race by Subject Gender
Interaction Results – Whole Sample
EVOKED POTENTIAL, FACIAL RECOGNITION & CROSS-RACE EFFECT
35
Chapter 4: Discussion
Discussion
South Africa has an infamous history of racial segregation and discrimination. The effect
of this history, versus the effect of recent socio-political changes, is of great interest to
researchers. South Africa is a dynamic society transitioning through significant change
(Christopher, 2005), and there is a need to monitor the effect of this change. For this
reason the study of inter-race relationships and effects is of vital importance within the
South African context. The consequences of this history can still be seen in various
aspects today. For this reason research into the ways in which the various races within
South Africa view each other is important within the South African context.
The Cross-Race Effect
The classic cross-race effect has been seen and demonstrated internationally (Caldara et
al, 2004; Herrmann et al, 2007; Ito et al, 2004). Previous research has shown the cross-
race effect in evoked potential research through a difference in the mean peak amplitudes
between viewed races. The difference that has been described is that the other race
evokes significantly lower mean potential amplitudes than the same race.
Previous research postulated that the reason for the increased same race amplitudes was
that greater attention was being paid to the same race faces. One study explains this as
“Greater attention…possibly reflecting deeper processing of the group with whom
participants had greater experience” (Ito et al, 2004, p. 1278). This theory is dependant on
the participants of the research having had experience mainly within their own racial
boundaries. In South Africa, however, one must are examine the opportunity for exposure
and the real benefit of integration on a neuronal level. Other than in some very rural
areas, limited racial contact is a thing of South Africa‟s past, and something that is not
realistically achievable, or desirable, in most main areas of the country. This is especially
pertinent with regards to the sample for this study. The social structure of South Africa is

EVOKED POTENTIAL, FACIAL RECOGNITION & CROSS-RACE EFFECT
36
such that the selection criteria for the sample would have resulted in the cohort being
drawn from a suburban, middle to upper socioeconomic status (Christopher, 2005). South
Africa has a history, which continues currently, where domestic workers form a large and
strong sector of the labour market, and where most households, from lower-middle class
upwards, employ a domestic worker (StatsSA, 2001). The implications of this, is that the
sample (Black, White and Indian) would have grown up having a Black domestic worker,
and possibly a Black gardener and a Black nanny. Therefore one must question the
applicability of the classical cross-race effect in South Africa where daily interracial
contact has been, and is, a reality.
This research‟s results have indicated very different results to that of previous research.
In these results the Black sample displayed absolutely no cross-race effect. Within the
Black participants there was no significant difference in peak amplitudes between the
Black stimuli versus White stimuli. Based on the above, one might have expected the
opposite results, both from a lifestyle and numbers perspective. Within the White sample
there was a significant difference between the White and Black stimuli. However the
differences displayed here are in contrast to international findings. The peak amplitudes
for the Black stimuli were significantly higher than the amplitudes for the White stimuli.
According to classical cross-race theory this infers that the White participants pay more
attention to Black faces than to White faces, possibly caused by the numbers of Black
people, and the integral place that they hold in their homes, that the White sample are
exposed to..
This could appear to directly contrast the classic cross-race theory findings, which display
increased own-race peak amplitudes in comparison to other-race peak amplitudes. Yet
when one considers that cross-race theory implies that it is the increased contact with
one‟s own race that results in the increased attention to one‟s own race. Therefore within
the South African context where interracial contact is an everyday reality, these results
can be seen to correlate with the theory of the cross-race effect.
EVOKED POTENTIAL, FACIAL RECOGNITION & CROSS-RACE EFFECT
37
Other research, however, would disagree with the above assumptions. Research has
shown that as much as there is daily interracial contact in South Africa, there still exists a
form of self-imposed segregation. As one piece of research stated “The persistence of
informal segregation in post-apartheid South Africa is now well documented”
(Finchilescu et al, 2007, p. 720). This is, however, only socially, and not generally
applicable to outside of social scenarios, yet this could still have an effect. With this
segregation, although there would be interracial contact, there could theoretically be more
same-race contact than interracial contact. This however is more likely to be true with the
Black population than with the White population, due to the Black to White population
ratio of 9:1 in South Africa (StatsSA, 2011). Accounting for this theory, one would
expect therefore to see a classic cross-race effect appearing in the Black sample. This
however was not the case, with the Black participants showing no significant differences
in peak amplitudes between the Black stimulus and the White stimulus. With regards to
the White sample, even with self-imposed informal segregation, with the Black to White
population ratio there would still be daily interracial contact. Therefore one would expect
that, as with the Black participants, there would be equal mean amplitudes between racial
stimuli. These results however display the opposite effect, suggesting that daily
interracial contact is occurring. If is informal segregation does still exist socially, it does
not appear to have an effect, possibly due to the population statistics, illustrating the large
number of Black people in comparison to White people, thereby creating exposure out of
chosen social groups.
Ito et al (2004) and Caldara et al (2004) both postulate that the increased peak amplitudes
at 250ms for own-race faces are inductive of greater attention being devoted to one‟s
own-race. Yet the results displayed in this research, specifically for the White
participants, therefore suggest that greater preconscious attention is being directed
towards other-race faces. As this directly contrasts international findings, an examination
as to why greater attention is directed towards other-race faces by White participants
would be of interest.
EVOKED POTENTIAL, FACIAL RECOGNITION & CROSS-RACE EFFECT
38
One theory that could be plausible is the correlation between race and crime. South
Africa has some high crime statistics, with 2.1million serious crimes being reported in
South Africa every year (SAPS, 2011). And of interest is the racial breakdown of the
perpetrators of those crimes. Although there are very few readily available statistics of
that breakdown, the results can be inferred by examining the racial makeup of South
Africa‟s prison population. Within the total prison population 0.49% of prisoners are
Asian, 17% are Coloured, 1.7% are White and 80% are Black (DoCS, 2011). One can
clearly see here that the vast majority of the prison population of South Africa is Black.
This is however reflective of the demographic breakdown of South Africa‟s population as
a whole. The makeup of South Africa‟s population is as follows: 79.5% of the population
are Black, 9% of the population are White, 9% are Coloured, and 2.5% of the total
population are Asian (Indian and Asian). One can see that the makeup of the prison
population is essentially representative of the population in general, with the exception of
the White population being under-represented in prisons. One can say that most of the
crime within South Africa is perpetrated by the Black population. Again one can see a
logical reason for this. The link between crime and unemployment has been widely
proven (Kapuscinski, Braithwaite & Chapman, 1998) and upon examination of the
unemployment and poverty statistics of South Africa, is it seen that most of the
unemployment is located within the Black population, consisting of 30% of the Black
population being unemployed, and only 5% of the White population being unemployed
(StatsSA, 2001), thus explaining the under-representation of Whites in prison. Although
there is a link between unemployment and crime, it is not a definite correlation.
Once this has been reasoned through, one can begin to see one possible explanation as to
the results of the White participants. If greater peak amplitudes are representative of
greater attention paid, then one can conclude that the white participants paid more
attention to the Black faces. One possible reason for this greater attention could be linked
to the crime statistics stated above. The possible perception that the Black population in
linked with crime in South Africa, the attention paid to the Black stimuli by the White
participants can possibly be seen as a form of awareness. Yet this could also be seen to
loop back to the initial theory that the increased exposure of the White population to the

EVOKED POTENTIAL, FACIAL RECOGNITION & CROSS-RACE EFFECT
39
Black population has resulted in the greater attention being paid to Black people by
White people, with the crime link just being a small aspect of that. Another theoretical
reason as to the increased awareness of White participants to Black faces could be a
socio-political one. White participants could have theoretically developed an increased
awareness with regards to Black faces to compensate for the classic cross-race effect, in
response to the social climate that South Africa finds itself in. Moving from an era of
open discrimination, where a White person could effectively ignore the Black separate
class, to an era of open acceptance and equality for all, a form a hyperawareness could
have been developed in response to, and to enable adaption to this socio-political change.
In the creation of this increased awareness, one could theorise that South African‟s have
begun to move away from a racial effect, as the increased attention creates more
awareness, and through that awareness, more understanding and acceptance.
When one examines the Indian control group, one again notices interesting results. There
was no significant difference between the peak amplitudes for the Black faces versus the
White faces. This would seem to fit in with the cross-race effect theory, as the Black and
White faces would both constitute as other-race for the Indian participants. The mean
peak amplitudes for both stimuli were significantly lower than the lowest result for either
of the other sample groups. This would indicate lower attention being paid to both racial
groups, and therefore fitting in with the cross-race theory. In collaboration with this is the
results from the Racial Prejudice Questionnaire for the Indian participants. The Indian
participants (being the control group) completed the Racial Prejudice Questionnaire for
both Black and White race groups to ensure there was no prejudice against either group.
The results from this showed that there was no discrimination against either group, yet
there were significant differences (in a matched-pairs t-test) between the results for White
race and Black race groups in the questionnaire (T7=-3.72, p=0.0205). When one
considers that Indians, although not prejudiced, were significantly less prejudiced against
the White race group than against the Black race group, one must consider then why there
were no significant differences in the peak amplitudes in the Indian sample‟s results
between the Black and White stimuli. Does their innate preconscious racial perception
transcend their conscious racial prejudice therefore displaying a classic cross-race effect?

EVOKED POTENTIAL, FACIAL RECOGNITION & CROSS-RACE EFFECT
40
Or is the reasoning, rather, that the mean neuroelectric activity is just generally lower in
this Indian sample, and if one were to repeat the experiment adding an Indian stimulus
the results would possibly reflect this, as well as a lack of the cross-race effect. Further
research exploring this is required to unlock the answers to those questions.
A Gender Effect
As the effect of race displayed in these results was not typically what one would have
anticipated, of interest would be what other variables have an effect. Gender is one such
variable that has significant results. The grouped data displays interesting race by gender
interactions. Black participants displayed no significant differences in mean peak
amplitudes between looking at female stimuli versus male stimuli. They gave slightly
more attention to males than females, but this difference was too small to be significant.
There was, however, interesting results with regards to the White participants. White
participants gave significantly more attention to female faces than to male faces. A
possible explanation as to this, which links to the cross-race effect theory, is an increased
exposure to females. As discussed above, it is a probable scenario that the participant in
this research all had domestic workers in their homes, which in South Africa would be
female, as 97% of domestic workers in South Africa are female (StatsSA, 2001). The
increased female exposure may have, as with the cross-race effect, resulted in an
increased awareness of females, and therefore an increase in the peak potentials.
These results reveal even more interesting findings when one examines them with regard
to hemispheric differences. Significant gender interactions were only found in the results
for T6, which is located in the right hemisphere. And the results were only significant
with regards to the stimuli gender, and not the participant gender. This would seem to
suggest that the right hemisphere of the brain is more sensitive to the effects of gender
than the left hemisphere. Research has illustrated that the right hemisphere is more
dominant with regards to facial recognition. This has been examined in split-brain
research where hemispheric differentiation is more readily visible: “To date, split-brain
studies have been successful only in showing that the right hemisphere tends to dominate
EVOKED POTENTIAL, FACIAL RECOGNITION & CROSS-RACE EFFECT
41
responses” (Gazzaniga & Smylie, 1983, p. 536). It stands to reason, that gender
identification is an integral part of face recognition, linking back to Bruce and Young‟s
structural code stage of facial recognition (1986). Therefore as gender identification is
part of facial recognition, which is right-hemisphere dominant, the gender interactions
found in the right hemisphere in the results of this study are thereby logically explained.
Inter- and Intra-group Differences
The set of results that were of great interest were the stimuli race by stimuli gender by
subject race by subject gender interactions. This essentially means what each race-gender
groups (Black females, Black males, White females, White males) results were with
regards to the other groups when examined with the stimuli in the same race-gender
groups. Although these results were not significant (p=0.0893), the trends displayed
within these results are of great interest, and may help to explain some of the other
results.
Black females did not display any significant differences between any of the groups. The
peak amplitudes were slightly higher for White males than for any other group, but all
within the same small range. This suggests that Black females tend to give equal attention
to all races and genders. One possible explanation for this is the relatively new station of
the Black female within South Africa‟s society and economy.
Traditionally all African cultures within Southern Africa are patriarchal in nature, and
even in modern society, where equality is emphasised, it still exists. As one researcher
remarks: “Patriarchy, present in all races and cultures in South Africa, has endured in the
postapartheid Era” (Bentley, 2004, p. 247). Due to this, females are generally not as
highly regarded as their male counterparts within the social structures of African
communities. Yet since the end of Apartheid there has been a concerted effort to right
this wrong and bring out true gender equality. Examples of such efforts can be seen in
The Constitution, the National Action Plan for the Promotion and Protection of Human
Rights, ratified international law (such as CEDAW), evolving domestic law (Bentley,

EVOKED POTENTIAL, FACIAL RECOGNITION & CROSS-RACE EFFECT
42
2004) and also in the statutes of the Black Economic Empowerment (BEE) program
(Tangri & Southall, 2008). Although this effect may not yet be seen to have reached the
more rural or poverty-stricken areas of South Africa, within the Urban and Suburban
areas this can be seen to have started to take effect. Therefore the young Black urban
females have possibly grown up in an empowering environment that places value on both
their race and gender. A possible explanation for the slightly greater peak amplitudes in
response to White males could be that over half of the Black female sample revealed, in
conversation, that they were in interracial relationships (with White males). As they were
therefore receiving greater intimate exposure to White males, that exposure could have
created the greater attention and awareness of White males. As this was not a specifically
examined factor within this research, details about relationships, and race of partners
were not asked for, and further research could bring more illumination to this factor.
This therefore helps one to begin to understand the results displayed by the African
females within this study. In the specific environment that they have grown and
developed in, they have seen themselves as equals (or in some economic-specific cases
better than) their male counterparts. This could have therefore affected the way in which
these young Black women view those around them, seeing people of all races and
genders equally, giving no significantly greater or lesser attention to any one group.
Black males displayed similar reactions to Black females in their relative equality of peak
amplitudes among the groups. They appear to give almost equal attention to all races. The
only difference that could appear to be significant is the peak amplitudes towards White
females. This amplitude appears to be lower than the amplitudes of all other groups.
The reasoning behind this could be related to the inherent patriarchy in the African
cultures, as discussed above (Bentley, 2004). The White females could be seen to be not
as important, and therefore there is a less attention paid to them. This however does not
explain why the reaction to Black females was not also lower. However, if there was a
race effect occurring here one would expect to see lower amplitudes for White males as
well as White females, which is not present. One possible explanation could be the lack
of White Female exposure in childhood. Unlike with the White participants, the domestic
EVOKED POTENTIAL, FACIAL RECOGNITION & CROSS-RACE EFFECT
43
workers in the participant‟s homes would be same-race, and therefore the Black
participants could possibly not had enjoyed the same level of other-race female exposure
that the White participants received. The other option is if one considers if there is a race
by gender effect occurring here. The fact that White females are of another (other) race,
as well as the other gender could be enough of a cause to create the lowered attention
effect.
Another possible explanation is the effect of sexual orientation. From observation and
conversation during the testing process, if became apparent that seven out of the eight
Black male participants were either openly homosexual or noticeably effeminate. As
sexual orientation was not a variable within this study, questions on participants sexual
orientation were not asked. Yet one could postulate that sexual orientation could have had
a notable effect. If, hypothetically, the majority of the Black Male sample was
homosexual in nature, that could help explain the results. In the displayed results the peak
amplitudes for White females are lower as they represent a group that is not part of their
race group, as well as being a group that is not a possible sexual or life-partner, whereas
White Males, although being another race, represent a group that are possible sexual and
life-partners, and therefore habitually a chosen area of focused attention, thus priming
neural networks ready for perception. And the results from the Black females, although
another group that are not sexual or life-partners, are part of the same race group, and as
stated above, Black males have received greater exposure to Black females in the form of
the mother and possibly the domestic worker, and the peak amplitudes are therefore
higher. This could suggest that Black males display the cross-race effect. This does
however also suggest that the effect of one‟s sexual orientation (or rather the effect of the
desirability of a group as a sexual or life-partner) can override, or transcend, the cross-
race effect. This is, of course, pure conjecture, and would require further research to
confirm these results.
The results from the White males and the White females were essentially the same in
their trends. The faces that received the highest peak amplitudes were Black females,
closely followed by Black males. The next highest amplitudes were White females.
EVOKED POTENTIAL, FACIAL RECOGNITION & CROSS-RACE EFFECT
44
Lastly were White males. This patterning directly contradicts the classic cross-race effect,
with the other race having higher peak amplitudes and therefore more attention, than the
same race. This could, as previously postulated, be a factor of racial exposure. When one
considers the Black to White racial ratio in the population, White people have very high
exposure to Black people, which, in accordance to the cross-race effect theory, has
resulted in the White participant giving more attention to Black other-race faces than to
their own-race White faces.
Interestingly, this pattern seen within the White participants directly reflects the hierarchy
that exists within the BEE programme in South Africa, as is stated in the BEE act of 2003
(RSA, 2004). This could be a display of how one aspect of society (the economy in this
case) has huge crossover effects into the rest of society, especially pertinent in that
modern South African society is seen to be a Capitalist society (Southall, 2004). This
therefore suggests that the society of a country directly effects how the people in that
country view each other. The underlying neurophysiology here could once again be
linked to the aspect of exposure, but possibly a different aspect of exposure. With regards
to the BEE hierarchy above, this preferential order is seen in many aspects of everyday
South African life, from school classrooms, to newspapers, to university selection
criteria. This is particularly relevant to this sample, as university students. Therefore
South Africans get exposed to this hierarchy in multiple formats regularly. This could
have resulted in reinforced neuronal pathways with regards to that hierarchy, which could
have created a priming effect. For example, from the exposure White males realise that
Black Women are important within South Africa, therefore their neural networks are
highly primed for high attention directed towards Black females due to the high exposure
and perceived importance.
Socio-Cultural Neuroscience
If one were to carry this thought further, then one could also suggest that the inherent
racial prejudice seen in the classical cross-race effect has been placed there by the society
in which the research was carried out. Yet in South Africa, this seems to be moving
EVOKED POTENTIAL, FACIAL RECOGNITION & CROSS-RACE EFFECT
45
towards a more positive effect, with the classic cross-race effect not being seen in the
results of this research.
This would then seem to confirm previous conjectured theory that one‟s environment
affects the way in which one‟s brain works. As previous research has stated that it is the
culture in which one finds itself that helps define the way in which one‟s brain develops
and functions (Chiao, 2011). However the results from this research would tend to
suggest that society as a whole plays as pivotal a role in this. Therefore this research
would suggest an amendment to the term „Cultural Neuroscience‟ to the term of „Socio-
Cultural Neuroscience‟. Although the effects of culture were visible in the results, the
effects of society seemed to have the stronger influence. This is especially significant
when one considers the strength of the cultural bonds that many cultures (especially the
African cultures) within South Africa display (Bentley, 2004). This would seem to
suggest that the only way in which to remove the racial prejudice that is the cross-race
effect would be to create a society-wide change, as South Africa is attempting to do.
This society-wide change is seemly beginning to have an effect, as displayed by the
results of this research. Yet it must be kept in mind that the sample of this research was
purposefully chosen to be as integrated and as non-prejudiced as possible. So in this
purpose-specific sample the effects of this change within society can begin to be seen,
with the complete removal of the classic cross-race effect. Yet the results of this research
cannot claim to be wide-ranging, or even exceptionally externally valid.
Even with this all accounted for, the results are clear in that South Africa is changing, and
does not fit the international mould. This sample was chosen as they theoretically
represent where South Africa is moving towards as a people and as a country. Therefore
if South Africa continues along this path, there is hope that the negative prejudices that
the cross-race effect has been proven to display internationally, could disappear
completely from the South African population. If this were to happen, it would
exponentially change the way in which South Africans of different races and cultures
interact, for the better. If all South Africans arrive at the point that the Black female
EVOKED POTENTIAL, FACIAL RECOGNITION & CROSS-RACE EFFECT
46
participants of this research appear to have arrived at (having no discrimination between
races or genders), then theoretically South Africans will stop viewing the world through
racial eyes, and see people as people.
Limitations and Suggestions for Future Research
EEGs using visual stimuli should be performed in a dark, sound-proofed, and electrically
insulated room in an attempt to avoid all possible interference to the results (Teplan,
2002). This research was performed in an office in the Psychology building within the
University of the Witwatersrand. Attempts were made to darken the office, but it was not
completely successful, especially since the office was west-facing and received full
afternoon sun. And neither was the room sound-proofed or insulated. Therefore ambient
noise from surrounding offices and lecture rooms was not completely removed.
Of most importance was the lack of proper insulation, which resulted in electrical-noise
artefacts appearing in most of the ERPs. This generally consisted of 50Hz noise which
resulted in a 50Hz filter being run on all ERPs, and some ERPs requiring further manual
filtering. Therefore a limitation of this research was lack of a proper EEG recording
space, which may have resulted in some of the recordings not being as perfect as they
could have been. Another limitation of this research was a relatively small sample size
(purely from the result of limited time). A larger sample size would have tightened the
research design and possibly improved the results.
All of the results from this study would benefit from having further research performed to
confirm these results. Future research including a larger Indian population, as well as
including an Indian face stimulus is important, as the results from the Indian control
group here are confounding by their lack of comparison data. The results from data of
gender differences are also very interesting and another area that warrants further
research, as it is an area, that in comparison to racial differences, has not received the
same amount of research, but is as important a subject. Linked to this is the effect of
interracial relationships and their effect on the cross-race effect. The results from this
research suggest a possible effect here, therefore further research to confirm this would

EVOKED POTENTIAL, FACIAL RECOGNITION & CROSS-RACE EFFECT
47
be beneficial. Finally an area that again has received little to no attention, is the effect of
sexual orientation on the racial and gender differences. Although not confirmed in this
research, the data is suggestive of significant results, and therefore further research to
confirm this is important.

EVOKED POTENTIAL, FACIAL RECOGNITION & CROSS-RACE EFFECT
48
Conclusions
The results of this research essentially culminate in the conclusion that the cross-race
effect, as has been classically seen internationally, is not present within young South
Africans.
There are however results that differ between racial groups, but those results are either
the complete opposite of the international results, or are completely different, therefore
displaying that young urban South Africans are evolving away from typical racial
discrimination. Young Black South Africans have completely moved away from racial
discrimination, displaying equal attention to all race groups, thereby displaying no racial
discrimination whatsoever. Young White South Africans, however, have moved
polarities from international norms and give more attention to Black South Africans
(other race) than to White South Africans (same race). This research postulates that this is
in response to the current social climate within South Africa, and is a move that should
hopefully yield positive results for South Africa in the future. Young Indian South
Africans displayed no differences between Black and White South Africans, but without
further information it remains unclear whether this is a typical example of the cross-race
effect (both races being other race), or whether they too have moved away from the
classic cross-race effect.
With regard to the effects of gender, again young Black South Africans displayed no
differentiation between South African males and females, giving attention on both
equally. Young White South Africans displayed greater attention to females than to
males. Again this research postulates that this is in response to the current social climate,
and is again, a positive step towards removing gender discrimination within South Africa.
Although group by group interactions (stimuli race by stimuli gender by subject race by
subject gender) were not significant, the trends displayed therein were of great interest.
These trends generally and essentially displayed a good representation of the current
South African social climate.
EVOKED POTENTIAL, FACIAL RECOGNITION & CROSS-RACE EFFECT
49
Therefore from these results, this research postulates that the society in which an
individual finds themselves has a great effect of the functional neurology of the
individual. And as culture has also been seen to have such an effect, this research seeks to
transform the phrase of „cultural neuroscience‟ into that of „Socio-Cultural
Neuroscience‟. This therefore displays the important effect that society has on
individuals, and therefore if a society makes positive steps, such as South Africa is doing
towards the removal or racial and gender discrimination, then that effect will transform
the neurology of the people in that society to mirror those steps. Therefore the importance
on a positive stance of society as a whole cannot be emphasised enough, because, as is
reflected in these results, the impact that society has on its people is enormously
significant.
These results reflect that South Africa has made huge progress in the removal of racial
and gender discrimination within its young urban population. Although this research
focused on this specific population, it did so with the expectation that this population
represented the, hopefully, utopian future of the country. If these results could be
replicated again in further research it would be a great success for South Africa, and
represent an enormously positive move away from our infamous history, towards a future
of South Africa as beacon of equality and fairness in the world.
EVOKED POTENTIAL, FACIAL RECOGNITION & CROSS-RACE EFFECT
50
References
Allison, T., Ginter, H., McCarthy, G., Nobre, A. C., Puce, A. & Luby, M. et al (1994).
Face Recognition in Human Extrastriate Cortex. Journal of Neurophysiology, 71
(2), 821 – 825
Allport, G. (1954/1979). The nature of prejudice. Reading, MA: Addison-Wesley
Anthony, T., Copper, C. & Mullen, B. (1992). Cross-Racial Facial Identification: A
Social Cognitive Integration. Personality and Social Psychology Bulletin, 18 (3),
296 – 301
Bar, M. (2003). Cortical Mechanism for Triggering Top-Down Facilitation in Visual
Object Recognition. Journal of Cognitive Neuroscience, 15 (4), 600 – 609
Bentley, K. (2004). Women‟s human rights & the feminisation of poverty in South
Africa. Review of African Political Economy, 31 (100), 247 – 261
Bogardus, S. (1925). Measuring social distance. Journal of Applied Sociology, 9, 299–
308.
Bruce, V. & Young, A. (1986). Understanding face recognition. British Journal of
Psychology, 77, 305 – 327
Caharel, S., Poiroux, S., Bernard, C., Thibaut, F., Lalonde, R. & Rebai, M. (2002). ERPs
Associated with Familiarity and Degree of Familiarity during Face Recognition.
International Journal of Neuroscience, 112, 1499 – 1512
Caldara, R., Rossion, B., Bovet, P. & Hauert, C-A. (2004). Event-related potentials and
time course of the „other-race‟ face classification advantage. NeuroReport, 15 (5),
905 – 910
Chiao, J.Y. (2010). At the Frontier of Cultural Neuroscience: Introduction to the Special
Issue. Social Cognitive & Affective Neuroscience, 5 (2/3), 109 – 110
Chiao, J.Y. (2011). Cultural neuroscience: Visualizing culture-gene influences on brain
function. In Decety, J. & Cacioppo, J. (Eds.) Handbook of Social Neuroscience.
UK: Oxford University Press
Chiroro, P. M., Tredoux, C. G., Radaelli, S. & Meissner, C. A. (2008). Recognizing faces
across continents: The effect of within-race variations on the own-race bias in
face recognition. Psychonomic Bulletin & Review, 15 (6), 1089 – 1092
EVOKED POTENTIAL, FACIAL RECOGNITION & CROSS-RACE EFFECT
51
Christopher, A. J. (2005). The Slow Pace of Desegregation in South African Cities, 1996-
2001. Urban Studies, 42 (12), 2305 – 2320
Delorme, A. & Makeig, S. (2004). EEGLAB: an open source toolbox for analysis of
single-trial EEG dynamics. Journal of Neuroscience Methods, 134, 9 – 21
Department of Correctional Services (2011). Inmate Gender and Racial Composition as
of the Last Day of 2011/02. Retrieved on 5 November 2011 from:
http://www.dcs.gov.za/WebStatistics/inmate-gen.aspx
Department of Home Affairs (2011). Passport & ID Photograph Specifications.
Retrieved on 13 December 2011 from:
http://www.dha.gov.za/PDF/Passport_ID_PhotoSpecifications.pdf
Di Russo, F., Martínez, A., Sereno, M. I., Pitzalis, S. & Hillyard, S. A. (2001). Cortical
Sources of the Early Components of the Visual Evoked Potential. Human Brain
Mapping, 15, 95 – 111
Finchilescu, G., Tredoux, C., Mynhardt, J., Pillay, J. & Muianga, L. (2007). Accounting
for lack of interracial mixing amongst South African university students. South
African Journal of Psychology, 37 (4), 720 – 737
Frey, H., Honey, C. & König, P. (2008). What‟s color got to do with it? The influence of
color on visual attention in different categories. Journal of Vision, 8 (14), 1 – 17
Frucht, M. M., Quigg, M., Schwaner, C. & Fountain, N. B. (2000). Distribution of
seizure precipitants among epilepsy syndromes. Epilepsia, 41 (12), 1534 – 1539
Gazzaniga, M. S., Ivry, R. B. & Mangun, G. R. (2009). Cognitive Neuroscience (3rd
Edition): The Biology of the Mind. USA: W.W. Norton & Company, Inc.
Gazzaniga, M. S. & Smylie, M. S. (1983). Facial Recognition and Brain Asymmetries:
Clues to Underlying Mechanisms. Annuals of Neurology, 13, 536 – 540
Grüter, T., Grüter, M. & Carbon, C-C. (2008). Neural and genetic foundations of face
recognition and prosopagnosia. Journal of Neuropsychology, 2 (1), 79 – 97
Hadjikhani, N. & de Gelder, B. (2002). Neural Basis of Prosopagnosia: An fMRI Study.
Human Brain Mapping, 16, 176 – 182
Haxby, J. V., Hoffman, E. A. & Gobbini, M. I. (2002). Human Neural Systems for Face
Recognition and Social Communication. Biological Psychiatry, 51, 59 – 67
Herrmann, M. J., Schreppel, T., Jäger, D., Koehler, S., Ehlis, A. –C. & Fallgatter, A. J.

EVOKED POTENTIAL, FACIAL RECOGNITION & CROSS-RACE EFFECT
52
(2007). The other-race effect for face perception: an event-related potential study.
Journal of Neural Transmission, 114 (7), 951 – 957
Hofmeyr, J (2000). The Emerging School Landscape in Post-Apartheid South Africa.
Retrieved on 14 April 2010 from:
http://www.sun.ac.za/if/Taakgroepe/iptg/hofmeyr.pdf
Hugenberg, K., Miller, J. & Claypool, H. M. (2007). Categorization and individuation in
the cross-race recognition deficit: Towards a solution to an insidious problem.
Journal of Experimental Social Psychology,43, 334 – 340
Hugenberg, K & Sacco, D. F. (2008). Social Categorisation and Stereotyping: How
Social Categorisation Biases Person Perception and Face Memory. Social and
Personality Psychology Compass, 2 (2), 1052 – 1072
Ito, T. A., Thompson, E. & Cacioppo, J. T. (2004). Tracking the Timecourse of Social
Perception: The Effects of Racial Cues on Event-Related Brain Potentials.
Personality and Social Psychology Bulletin, 30, 1267 – 1280
Jasper, H. H. (1958). The Ten Twenty Electrode System of the International Federation.
Electroencephalography and Clinical Neurology, 10 (Index), 371 – 375
Jasper, H. H. & Carmichael, L. (1935). Electrical Potentials from the Intact Human Brain.
Science, 81 (2089), 51 – 53
Kapuscinski, C. A., Braithwaite, J. & Chapman, B. (1998). Unemployment and Crime:
Towards Resolving the Paradox. Journal of Quantitative Criminology, 14 (3), 215
– 243
Kubota, J. T. & Ito, T. A. (2007). Multiple cues in social perception: The time course of
processing race and facial expression. Journal of Experimental Social Psychology,
43, 738 – 752
Lamme, V. A. F. (2003). Why visual attention and awareness are different. Trends in
Cognitive Science, 7 (1), 12 – 18
Leibowits, B., Rohleder, P., Bozalek, V., Carolissen, R. & Swartz, L. (2007). „It doesn‟t
matter who or what we are, we are still just people‟: Strategies used by university
students to negotiate difference. South African Journal of Psychology, 37 (4), 702
– 719
Losin, E.A.R., Dapretto, M. & Iacoboni, M. (2010). Culture and Neuroscience: Additive

EVOKED POTENTIAL, FACIAL RECOGNITION & CROSS-RACE EFFECT
53
or Synergistic? Social Cognitive & Affective Neuroscience, 5 (2/3), 148 – 158
Luck, S. J. (2005). An Introduction to the Event-Related Potential Technique.
Cambridge: The MIT Press
Miyoshi, M., Katayama, J. & Morotomi, T. (2004). Face-specific N170 component in
modulated by facial expression change. NeuroReport, 15 (5), 911 – 914
Morgan, S. T., Hansen, J. C. & Hillyard, S. A. (1996). Selective attention to stimulus
location modulates the steady-state visual evoked potential. Proceedings of the
National Academy of Science of the United States of America, 93, 4770 – 4774
Neville, H., Snyder, E., Woods, D. & Galambos, R. (1982). Recognition and surprise
alter the human visual evoked response. Proceedings of the National Academy of
Science of the United States of America, 79, 2121 – 2123
Pettigrew, T. F., & Tropp, L. (2006). A meta-analytic test of intergroup contact theory.
Journal of Personality and Social Psychology, 90, 751 – 783
Reisberg, D (2006). Cognition (3rd
Edition): Exploring the Science of the Mind. UK:
W.W. Norton & Company, Inc.
Sangrigoli, S., Pallier, C., Argenti, A. –M., Ventureyra, V. A. G. & de Schonen, S
(2005). Reversibility of the Other-Race Effect in Face Recognition During
Childhood. Psychological Science, 16 (6), 440 – 444
Shriver, E. R., Young, S. G., Hugenberg, K., Bernstein, M. J. & Lanter, J. R. (2008).
Class, Race, and the Face: Social Context Modulates the Cross-Race Effect in
Face Recognition. Personality and Social Psychology Bulletin, 34, 260 – 274
Sinha, P., Balas, B., Ostrovsky, Y. & Russell, R. (2010). Face Recognition by Humans:
20 Results all Computer Vision Researchers Should Know About. Retrieved on 19
March 2010 from: http://web.mit.edu/bcs/sinha/papers/20Results_2005.pdf
SouthAfrica.info (2010, May 17). South Africans get behind the flag. SouthAfrica.info.
Retrieved from: http://www.southafrica.info
South African Police Service (2011). Crime Report 2010/2011. Retrieved on 19
November 2011 from:
http://www.saps.gov.za/statistics/reports/crimestats/2011/crime_situation_sa.pdf
Swiss Confederation (2010). Switzerland’s Population 2010. Retrieved on 13 December

EVOKED POTENTIAL, FACIAL RECOGNITION & CROSS-RACE EFFECT
54
2011 from:
http://www.bfs.admin.ch/bfs/portal/en/index/news/publikationen.html?publication
ID=4527
Republic of South Africa (1996).South African Schools Act, 1996, No. 84 of 1996
Republic of South Africa (2004). Broad-Based Black Empowerment Act, 2003, No. 53 of
2003. Government Gazette (Vol. 463, No. 25899)
Spiridon, M., Fischl, B. & Kanwisher, N. (2006). Location and spatial profile of
category-specific regions in human extrastriate cortex. Human Brain Mapping,
27, 77-89
Statistics South Africa (2011). Mid-Year Population Estimates 2011. Retrieved on 13
November 2011 from: www.statssa.gov.za/publications/P0302/P03022011.pdf
Tanaka, J. W., Kiefer, M., & Bukach, C. M. (2004). A holistic account of the own-race
effect in face recognition: Evidence from a cross-cultural study. Cognition, 93 (1),
B1–B9
Tangri, R. & Southall, R. (2008). The Politics of Black Economic Empowerment in
South Africa. Journal of Southern African Studies, 34 (3), 699 – 716
Teplan, M. (2002). Fundamentals of EEG Measurement. Measurement Science Review, 2
(2), 2 – 11
United States Census Bureau (2010). 2010 Census Data. Retrieved on 13 December 2011
from: http://2010.census.gov/2010census/data/index.php
University of the Witwatersrand (2009). Pocket Statistics 2009. Retrieved on 20 March
2010 from: http://web.wits.ac.za/NR/rdonlyres/AB9D3409-219A-43C8-BE56-
D1F5B8526824/0/PocketStats10Jul2009.pdf
Walsh, V. & Butler, S. R. (1996). Different Ways of Looking at Seeing. Behavioural
Brain Research, 76, 1 – 3
Wilson, R (2001). The Politics of Truth and Reconciliation in South Africa: Legitimizing
the Post-Apartheid State. UK: Cambridge University Press
Wright, D. B., Boyd, C. E. & Tredoux, C. G. (2001). A field study of own-race bias in
South Africa and England. Psychology, Public Policy, and Law, 7, 119 – 133
Wright, D. B., Boyd, C. E. & Tredoux, C. G. (2003). Inter-racial Contact and the Own-

EVOKED POTENTIAL, FACIAL RECOGNITION & CROSS-RACE EFFECT
55
race Bias for Face Recognition in South Africa and England. Applied Cognitive
Psychology, 17, 365 – 373
Yardley, L., McDermott, L., Pisarski, S., Duchaine, B. & Nakayama, K. (2008).
Psychosocial consequences of developmental prosopagnosia: A problem of
recognition. Journal of Psychosomatic Research, 65 (5), 445 – 451
Young, A. W., De Haan, E. H. F. & Bauer, R. M. (2008). Face perception: A very
special issue. Journal of Neuropsychology, 2 (1), 1 – 14
Zanna, M. P. (1994). On the nature of prejudice. Canadian Psychology, 35, 11–23.
Zhao, W., Chellappa, R., Phillips, P. J. & Rosenfeld, A. (2003). Face Recognition: A
Literature Survey. AMC Computing Surveys, 35 (4), 399 – 458
Zillmer, E. A., Spiers, M. V. & Culbertson, W. C. (2008). Principles of
Neuropsychology 2nd
Edition. USA: Wadsworth

EVOKED POTENTIAL, FACIAL RECOGNITION & CROSS-RACE EFFECT
56
Appendices
Appendix 1:Participant Consent Form
I, ______________________ , consent to participate in this study:
I will participate in the Evoked-Response Procedure.
I understand that:
Participation is voluntary
I will have a harmless and non-invasive evoked potential test performed on me whilst
looking at stimuli of faces
I may choose to stop the testing at any time with no negative outcome for me
My results will remain confidential
No positive or negative consequences will follow from choosing to, or not to, participate
By Participating I state that:
I have no history (or am aware of family history) of epilepsy
I have no history of head injury and no current neurological disorders
Signed: __________________________
Date:___________________________
Student Number:__________________________
Demographics:
Race:
Sex:
Age:
High School Attended:
Assigned Participant Number: _________________________

EVOKED POTENTIAL, FACIAL RECOGNITION & CROSS-RACE EFFECT
57
Appendix 2: Participant Information Sheet
School of Human and Community Development
Private Bag 3, Wits 2050, Johannesburg, South Africa
Tel: 27 (0)11 717 4524/5 Fax: 27 (0)11 717 4556
Email: [email protected]
Hi! My name is Daniel Greenslade, and I am conducting research for the purpose of obtaining a
Masters degree in Research Psychology at the University of the Witwatersrand. My area of focus
is the Evoked Potential of Facial Recognition. I would like, on behalf of myself and my research
supervisor, Enid Schutte, to invite you to participate in this study.
Participation in this research will entail having an event-related potential scan (which is a
completely non-invasive and painless recording of electrical activity occurring in your brain)
performed on you whilst looking at pictures of South African faces. The test itself should take
approximately 30 minutes to complete. Participation is voluntary, and no individual will be
advantaged or disadvantaged in any way for choosing to or not to participate. As the visual
stimulus is pictures of faces flashing on a screen, there is a very small possibility that this could
set off an epileptic attack in people with the underlying disorder. If your family has a history of
epilepsy I would suggest not participating in this research.
Please be assured that confidentiality about the results between the researcher and you as a
participant is guaranteed. The information you provide will only be seen by myself and my
research supervisor; I will compile the information and produce data for the group. I will then
analyse this data and provide a summary of the results for any interested participant when they
contact me for the results. No individual feedback can be given. This grouped data may be used in
publications or conference presentations, but no identifying individual data will be used.
Please note that you will be free to stop the procedure at any time and no negative consequences
will follow. Your participation would be greatly appreciated; the information you provide will be
kept confidential. This research will contribute to the larger body of knowledge of
Neuropsychology.
Kind regards,
Daniel John Greenslade
Please feel free to contact myself or my supervisor (Enid Schutte) on:
082 920 6731 083 560 5017

EVOKED POTENTIAL, FACIAL RECOGNITION & CROSS-RACE EFFECT
58
Appendix 3: Sample Face Stimuli

EVOKED POTENTIAL, FACIAL RECOGNITION & CROSS-RACE EFFECT
59
Appendix 4: Racial Prejudice Questionnaire
Name: Participant Number:
Question 1
Please describe how you feel about the Black population group in general. Please select
the number that best represents your feeling
I feel the following way towards Black people in general
Warm 1 2 3 4 5 6 7 Cold
Negative 1 2 3 4 5 6 7 Positive
Friendly 1 2 3 4 5 6 7 Hostile
Suspicious 1 2 3 4 5 6 7 Trusting
Respect 1 2 3 4 5 6 7 Disrespect
Admiration 1 2 3 4 5 6 7 Disgust
Question 2
Please select the word which expresses or most closely expresses your feelings in relation
to the statement
My first feeling is to willingly allow:
Any Most Some Few No Black students to my University
Any Most Some Few No Black people to my street as
neighbours
Any Most Some Few No Black guests to my home
Any Most Some Few No Black people to be my personal
friends
Any Most Some Few No Black people in my work/study group
Any Most Some Few No Black people in close kinship by
marriage
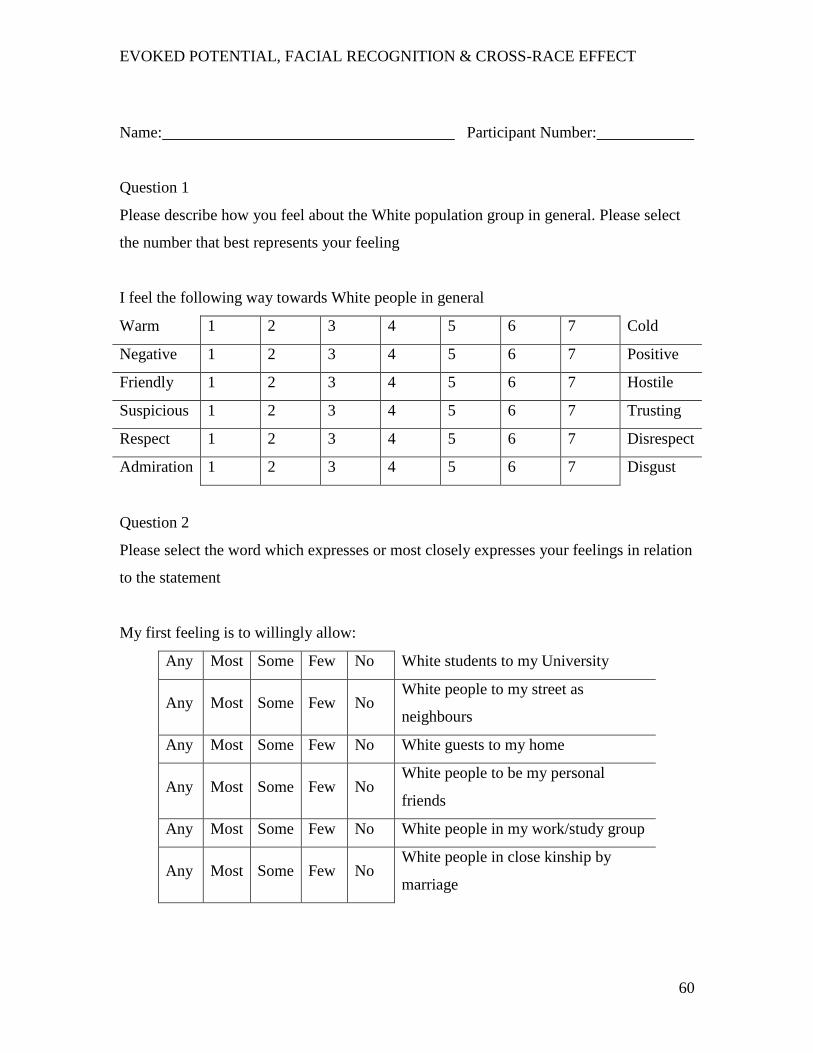
EVOKED POTENTIAL, FACIAL RECOGNITION & CROSS-RACE EFFECT
60
Name: Participant Number:
Question 1
Please describe how you feel about the White population group in general. Please select
the number that best represents your feeling
I feel the following way towards White people in general
Warm 1 2 3 4 5 6 7 Cold
Negative 1 2 3 4 5 6 7 Positive
Friendly 1 2 3 4 5 6 7 Hostile
Suspicious 1 2 3 4 5 6 7 Trusting
Respect 1 2 3 4 5 6 7 Disrespect
Admiration 1 2 3 4 5 6 7 Disgust
Question 2
Please select the word which expresses or most closely expresses your feelings in relation
to the statement
My first feeling is to willingly allow:
Any Most Some Few No White students to my University
Any Most Some Few No White people to my street as
neighbours
Any Most Some Few No White guests to my home
Any Most Some Few No White people to be my personal
friends
Any Most Some Few No White people in my work/study group
Any Most Some Few No White people in close kinship by
marriage