an evaluation of mla’s red meat nutrition program · an evaluation of mla’s red meat nutrition...
TRANSCRIPT
www.TheCIE.com.au
An evaluation of MLA’s red meat nutrition program
Prepared for Meat & Livestock Australia
7
Centre for International Economics Canberra & Sydney
September 2008

The Centre for International Economics is a private economic research agency that
provides professional, independent and timely analysis of international and domestic
events and policies.
The CIE’s professional staff arrange, undertake and publish commissioned economic
research and analysis for industry, corporations, governments, international agencies
and individuals. Its focus is on international events and policies that affect us all.
The CIE is fully self-supporting and is funded by its commissioned studies, economic
consultations provided and sales of publications.
The CIE is based in Canberra and has an office in Sydney.
© Centre for International Economics 2008
This work is copyright. Persons wishing to reproduce this material should contact
the Centre for International Economics at one of the following addresses.
Canberra
Centre for International Economics
Ian Potter House, Cnr Marcus Clarke Street & Edinburgh Avenue
Canberra ACT 2601
GPO Box 2203
Canberra ACT Australia 2601
Telephone +61 2 6245 7800
Facsimile +61 2 6245 7888
Email [email protected]
Website www.TheCIE.com.au
Sydney
Centre for International Economics
Suite 2, Level 16, 1 York Street
Sydney NSW 2000
GPO Box 397
Sydney NSW Australia 2001
Telephone +61 2 9250 0800
Facsimile +61 2 9250 0888
Email [email protected]
Website www.TheCIE.com.au
Disclaimer
While the CIE endeavours to provide reliable analysis and believes the material it
presents is accurate, it will not be liable for any party acting on such information.

AN EVALUATION OF MLA’S RED MEAT NUTRITION PROGRAM 3
www.TheCIE.com.au
Contents
Glossary 6
Highlights 7
1 Purpose of this evaluation 13 Scope of this evaluation 14
2 Falling consumption of red meat 15 Australia’s red meat production 15 Australian trends in consumption 16 Australian perceptions of red meat 16
3 The nutrition campaign 19 Objectives 19 Logic of the program 20 Inputs and activities 22 Investment by MLA 25 What did the campaign deliver? 25
4 Changes in attitudes 32 Promoting red meat among health professionals 32 Improving consumer attitudes 37
5 Identifying and evaluating impacts 62 Role of promotion 62 Evaluating the benefits of generic promotion 62 Impacts 67 Breakeven analysis using the integrated framework 70 Conclusion 75
References 76

4 AN EVALUATION OF MLA’S RED MEAT NUTRITION PROGRAM
www.TheCIE.com.au
Boxes, charts and tables
1 Results of breakeven analysis using the Integrated Framework 12
1.1 Five pillars of consumer demand 13
2.1 Australia’s red meat export performance 15
2.2 Per person consumption in Australia, United States and Canada 17
2.3 Per person red meat consumption before the nutrition program 18
2.4 GPs recommending that healthy adults eat red meat less than or equal to one to two times per week 18
3.1 Sources of nutrition information 20
3.2 Mapping the campaign’s logic 21
3.3 Timeline of the nutrition program 22
3.4 The CSIRO Total Wellbeing Diet 24
3.5 Nutrition program activity budgets: 2002–07 26
3.6 MLA nutrition program funding allocation 27
3.7 MLA nutrition research program 27
3.8 Institutions commissioned to undertake MLA nutrition research 28
3.9 MLA nutrition campaigns 30
3.10 Campaign calendar 31
4.1 GP attitudes towards red meat 34
4.2 Dieticians are receiving the message 35
4.3 Health professionals who agree that red meat should be served three to four times per week 36
4.4 Health professionals who recommend that red meat should be served three to four times per week 36
4.5 GPs recommending three to four serves of red meat for specific patient types 37
4.6 Consumer tracking data summary statistics 38
4.7 Controlling for survey mode 39
4.8 Trends and snapshots 41
4.9 Per cent of consumers correctly identifying three to four meals per week message 42
4.10 How many red meat meals do you believe per week is a healthy target for your family? 43
4.11 Health attitudes towards meat, sample averages 43
4.12 Health attitudes towards red meat 44
4.13 Beef is an essential part of a healthy diet 45
4.14 Red meat makes healthy meals 45
4.15 Beef contains a wide range of vitamins and minerals 46
4.16 Beef is good in a weight loss diet 47
4.17 Red meat is essential for vitality and wellbeing 47
4.18 A diet including red meat is more important for my health than I previously believed 48

AN EVALUATION OF MLA’S RED MEAT NUTRITION PROGRAM 5
www.TheCIE.com.au
4.19 Red meat is essential for a healthy mind 48
4.20 Limit consumption to avoid possible health problems 49
4.21 Positive disposition towards red meat 1999–2001 50
4.22 Positive feelings towards red meat, 2004–08 50
4.23 Consumer types: appreciators, acceptors, resistors and rejectors 51
4.24 Consumer types over time 52
4.25 Consumer types, descriptive statistics 53
4.26 Average servings of red meat in the last seven days 54
4.27 Consumer types and average consumption 54
4.28 Consumer types — distribution of servings 55
4.29 Shares by meat type from market research 56
4.30 Consumer recall 57
4.31 Difference in consumption between consumers who could and could not recall red meat advertising 58
4.32 Marginal impact of consumer recall 59
4.33 Impact of red meat advertising on consumer responses: increase in probability of observing consumer response 61
5.1 Two types of advertising 63
5.2 Positive returns from generic promotion 64
5.3 Potential baselines 66
5.4 Linking investment to public health outcomes 70
5.5 Key features of the integrated framework 72
5.6 Nutrition program funded by levy payers: 2001-02 to 2006-07 73
5.7 Results of breakeven analysis using the Integrated Framework 74

6 AN EVALUATION OF MLA’S RED MEAT NUTRITION PROGRAM
www.TheCIE.com.au
Glossary
AI Awareness Index
BSE bovine spongiform encephalopathy
CATI computer aided telephone interviews
baseline A hypothesis or judgement about the (likely) outcome that
would have occurred without the impact of a program or action
CSIRO Commonwealth Scientific and Industrial Research Organisation
DoHA Department of Health and Ageing
GATT General Agreement on Tariffs and Trade
GP general practitioner
kg cwe kilograms carcass weight equivalent
KPI key performance indicator
MLA Meat & Livestock Australia
NGO non-government organisation
OLS ordinary least squares
POS point of sale
PR public relations
R&D research and development
TLE The Leading Edge (marketing company)
TVC television commercial
TWD Total Wellbeing Diet

AN EVALUATION OF MLA’S RED MEAT NUTRITION PROGRAM 7
www.TheCIE.com.au
Highlights
Since 1998, Meat & Livestock Australia (MLA) has invested in and delivered a red
meat nutrition program with the objective of reducing barriers to the consumption of
red meat.
� Prior to the program’s launch, red meat consumption had been on a steady, long
term decline in Australia which was consistent with other mature red meat
markets around the world.
� The relative contribution of a range of key drivers to this decline, including
changing consumer preferences and perceptions, is not well understood.
A contributing factor to this decline was thought to be negative messages and
perceptions regarding red meat’s nutritional value. The nutrition program sought to
overcome this barrier to consumption through a marketing campaign that drives
attitudinal change, which in turn contributes to shifting household consumption
behaviour (MLA 2003b).
To achieve this objective, the campaign takes a portfolio approach to manage these
threats and potential risks and build on wide-acceptance of red meat by domestic
consumers through:
� a nutrition research program to produce strong, evidence-based messages about
the nutritional benefits of red meat consumption;
� promotion targeted at the health professional industry — namely, general
practitioners (GPs) and dietitians;
� consumer promotion providing information on red meat’s nutritional value and
promoting positive images of red meat; and
� an ongoing issues management program.
This evaluation analyses the impacts of MLA’s nutrition program. The objective is to
determine the program benefits in the form of:
� consumer demand for red meat at levels above those that may persisted without
an integrated approach by MLA and industry; and
� public health benefits due to increased consumption of red meat.
This evaluation focuses on program key performance indicators (KPIs) and other
relevant measures drawn from consumer tracking data.
� The available evidence reflects a number of data sets with variations in
methodology and scope.

8 AN EVALUATION OF MLA’S RED MEAT NUTRITION PROGRAM
www.TheCIE.com.au
� The analysis is limited to the period 2004 to 2008 — this being the only period for
which there is a consistent, continuous set of tracking data. As such, it does not
include the first two years of the initial Red Meat Feel Good (RMFG) campaign.
Key findings
The following summarises the key findings for the two groups targeted by the
program: health professionals and households.
Health professionals
MLA surveys shows that GPs and dieticians were more receptive to messages about
the health-related benefits of red meat
� The proportion of health professionals (both GPs and dietitians) who
recommend that red meat should be served three to four times per week has
increased markedly.
� GPs have maintained or increased their high levels of agreement with red meat
nutritional statements since 2002. Similarly, the proportion of GPs recommending
red meat three to four times a week for patients with high cholesterol and obesity
has increased significantly.
� Since 2001, the share of dieticians agreeing that red meat is an essential part of a
health diet increased by over 15 percentage points, to an overall level of around
85 per cent.
� Improvements were also seen with regard to a number of other statements,
including lean red meat being advised to cholesterol patients and being part of
obesity management.
� But there was insufficient data to make an assessment of the relative contribution
of MLA’s campaign compared to other sources of health-related opinion and
information available at the same time.
Households
Red meat is a mature consumer product that continues to enjoy a high level of
familiarity and acceptance by Australian households.
� Over 80 per cent of Australian households have a positive attitude to red meat.
This share of households has not declined since 1999, in a statistically
significant way, from already high levels.
– Between 2004 to 2008 over 50 per cent of consumers were able to correctly
identify the key campaign message of three to four red meat meals per week.
Around 70 per cent of consumers agree that beef is an essential part of a health
diet. A similar percentage shares the view that red meat makes healthy meals.

AN EVALUATION OF MLA’S RED MEAT NUTRITION PROGRAM 9
www.TheCIE.com.au
� From 2004 to 2008, based on the average number of serves per week, there has
been no unfavourable shift away from red meat in terms of the share of
consumers who are resistors, while those who are either ‘appreciators’ or
‘acceptors’ may be increasing.
Self-reported behaviour
Another important program indicator was the proportion of mothers limiting
consumption of red meat for their families.
� The share of mothers limiting consumption fell from 60 per cent in 2001 to just
over 20 per cent in 2004. From 2004 and 2007 this trend reverses, possibly due to
the change in data source, but does not return to initial levels seen in 2001.
� This suggests that despite positive attitudes, households constraining
consumption due to health concerns remains an important consideration for the
campaign.
Self-reported household consumption
An important program KPI is how the number of red meat serves has changed over
time. It is one of the closest measures of the effectiveness of a marketing campaign
translating through to higher sales.
� From 1998 to 2001, household serves of red meat increased. After this, though, the
number of serves was maintained over the period 2002 to 2006. Individuals
report, on average, having three serves of red meat per week. This average also
has been maintained over the past four years.
� On average, acceptors and appreciators consume the recommended three to four
serves per week. And so their average level of consumption has been, at
minimum, maintained over the past four years.
Increase in demand for red meat
The other important element of consumer demand is during the campaign prevailing
prices increased strongly largely the result of developments in key export markets.
� Between 2004 and 2008, consumers have been willing to absorb higher price to
maintain their current number of serves. Given this, consumer demand for red
meat has undoubtedly increased.
� Current performance can be compared to declining per person consumption
which was observed during the 1990’s and which characterises mature red meat
markets around the world.
However, it is very difficult to establish objectively how much of this total increase can
be attributed back to this MLA program given the current information set.
10 AN EVALUATION OF MLA’S RED MEAT NUTRITION PROGRAM
www.TheCIE.com.au
� Observed Australian consumption, needs to be compared to a baseline or set of
market outcomes where MLA and industry would not have responded to the
threat of falling consumption. Establishing the ‘without’ baseline is very difficult.
� The next step would be then to attribute the total outcome between the
contribution of the MLA nutrition program, other MLA programs and other
actions by industry to sustain consumer demand.
� But without sufficient data to directly link the observed change in attitudes and
behaviour back to the increase in demand and industry sales, it is not possible to
establish what proportion of this increase can be attributed back to the Nutrition
program.
Role of promotion and other studies
This evaluation identified that promotion plays a range of important functions in
agricultural and food processing industries. These roles can be mapped directly back
to the approach taken to the components of the nutrition campaign that are mainly
defensive in nature:
� maintaining red meat’s image to maintain consumer’s awareness and to build the
value of the ‘brand’; and
� by providing credible information to manage the ongoing threats of adverse
changes in consumer preferences or perceptions.
Also like other related industries, these activities are conducted using a collaborative
approach along the marketing chain that uses advertising based on individual
brands, images and innovative products.
By their nature, the benefits of these defensive activities are very difficult to quantify.
The literature review showed that similar studies demonstrated positive but modest
payoffs to generic promotion with benefit-cost ratios between 2:1 and 6:1. Most
studies involve quantifying the correlation between promotion expenditures and
consumption. These studies:
� took a wider perspective of promotional activities than this evaluation; but
� faced similar constraints to those identified in this study: a lack of consistent time-
series data and difficulty in establishing direct links between program indicators
(outcomes) and increased sales (the impact of the program).
Evaluating public health benefits
The program’s logic identifies a range of positive outcomes and impact beyond
changes in consumption. Improved public health represents an important spillover
benefit that would flow outside of the red meat industry.

AN EVALUATION OF MLA’S RED MEAT NUTRITION PROGRAM 11
www.TheCIE.com.au
� MLA health research considered the interaction between consumption of red meat
and the risk of a number of health effects. Some of the health effects are quite
serious, such as bowel cancer, heart disease and obesity.
� Reducing the risk or prevalence of these effects (mortality as well as significant
morbidity) can generate substantial benefits. These benefits arise from a range of
sources including avoided treatment costs, improved quality of life, minimisation
of adverse impacts on carers and family and avoided work loss days.
While mapping the link between nutritional awareness and public health benefit is
relatively straightforward, measuring the linkages and impact is not. This report sets
out a framework for quantifying the impact of this important spillover benefits.
Break-even analysis
Given the constraints in identifying the baseline or the ‘without’ outcomes and then
contribution of the impact of the Nutrition program to this overall outcome, a break-
even approach is used to evaluate the effectiveness of the program.
� That is, what increase in demand for beef and lamb above baseline and what
would be the contribution of the nutrition program to that increase would be
required for the program to pay for itself?
� The required payoff, calculated using the MLA’s integrated framework (IF), is the
increase in farm value-added or income of beef and lamb producers and is
equivalent to the point at which marketing levies that fund the program are
raised.
– To be conservative, the timeframe for the breakeven analysis is confined to the 5
years of the program. This assumption means that the benefits do not persist
after the program period ends.
– This assumption is made because of the uncertainty on the rate of decay of
program components – or how long benefits would last without continued
funding.
The results of the breakeven analysis are summarised in table 1.
� The IF indicates that over the period 2002-07, a sustained increase in domestic
demand for red meat would have be 1.5 per cent above baseline to deliver
sufficient income back to levy payers to fund program costs.
– This is equivalent to an additional $128 million in sales at retail each year.
– If the flow of benefits required to fund the program are confined to beef only,
the increase in demand needs to be 3.2 per cent above baseline.
– If program benefits are assumed to persist for another 3 more years – then the
required increase for beef and lamb falls marginally from 1.5 to 1.4 per cent
(see table 1).

12 AN EVALUATION OF MLA’S RED MEAT NUTRITION PROGRAM
www.TheCIE.com.au
� From the beginning of 2001-02 through to 2006-07, demand for red meat increased
by around 11 per cent over baseline according to MLA’s demand index - the result
of the concerted actions all MLA programs and industry initiatives.
� The breakeven analysis suggests that the nutrition campaign would have had to
contribute less than 15 per cent of this total contribution to pay for itself.
– Because of the conservative nature of the assumptions behind the analysis, this
requirement presents an upper-bound on the required increase in demand that
is attributable back to the program.
1 Results of breakeven analysis using the Integrated Framework
Increase in demand required Change in consumer
demand required Share of increase
in demanda Increase in
retail salesb
% % $m
Beef and lamb
� Over six years 1.5 13.4 128
Sensitivity analysis
Beef only
� Over six years 3.2 40.7 211
Beef and lamb
� Over nine years 1.4 12.4 119 a Increase in demand as reported by the MLA demand index. b Increase required in annual value of retail sales as reported by the MLA.
Note: The analysis discounts program costs and benefits to 2006-07 using a 5 per cent discount rate.
Source: Integrated Framework and CIE calculations.

AN EVALUATION OF MLA’S RED MEAT NUTRITION PROGRAM 13
www.TheCIE.com.au
1 Purpose of this evaluation
A key objective of MLA in partnership with industry is to sustain domestic demand
for red meat — including beef, sheep and goat meat. On this front, MLA works with
industry to ensure:
� strong demand for red meat
� strong attitudes towards red meat
� strong presence of red meat in the market.
These outcomes should ultimately translate into realised higher volumes of product
purchased or prices paid for that product than would have occurred without
collective (MLA) action.
MLA’s approach centres around the five pillars for consumer demand —
summarised in table 1.1. These pillars represent a portfolio or integrated approach to
sustaining red meat demand in the domestic market.
1.1 Five pillars of consumer demand
Pillar Outputs or outcomes
Enjoyment � Ensure quality expectations are met and exceeded
� Remind consumers of appeal and popularity of red meat
Convenience � Remind educating consumers on the ease of preparing red meat cuts
� Develop easy-to-prepare new products
� Encourage consumers at grocery point of sale and food service to choose red meat
Nutrition � Educate consumers on the essential role of red meat in the diet
� Research the impact of red meat diets on health and wellbeing
Integrity � Maintain consumer trust that red meat products are safe
� Build confidence that industry practices are responsible and sustainable
Value � Recognise that red meat needs to remain affordable, with a range of price options
Source: MLA (2008).

14 AN EVALUATION OF MLA’S RED MEAT NUTRITION PROGRAM
www.TheCIE.com.au
Scope of this evaluation
This evaluation adopts a narrow scope. It relates only to the nutrition pillar. That
said, it is important to recognise that improvements in consumer demand for red
meat will be a function of change in any or all of the pillars. Ascertaining the
contribution of the nutrition campaign would be best understood through an
analysis that considers changes in all five pillars.
To evaluate the nutrition campaign’s impact, the analysis adopts a two-step process.
First, it aims to explore and, where possible, establish direct linkages between the
nutrition program and key performance indicators of the campaign. The evaluation
then looks to translate these indicators into market outcomes in terms of higher
demand levels than would have occurred in absence of the program.

AN EVALUATION OF MLA’S RED MEAT NUTRITION PROGRAM 15
www.TheCIE.com.au
2 Falling consumption of red meat
This chapter sets the context for understanding the motivation and role of MLA’s
nutrition campaign. It covers trends in the consumption of red meat and draws
attention to some of the drivers of these trends.
Australia’s red meat production
The past ten years have shown that the domestic market is strongly linked to
international markets, especially through price. By 2006, over two-thirds of
Australian red meat production was exported. Chart 2.1 shows that, over time,
Australian production growth in red meat (mainly beef) has been matched by strong
export performance — especially demand-pull from Japan and South Korea. Key
drivers of this growth have been income growth in Asia and the trade liberalisation
that occurred as a result of the Uruguay Round of GATT.
As a result of the dominance export markets play, the supply and price of red meat
for meeting domestic demand is highly sensitive to overseas trends (for example,
BSE outbreak/scare, exchange rates, etc). Given this dynamic, MLA’s promotion
strategies target reinforcing strong Australian consumer demand so that it can
weather the challenges.
2.1 Australia’s red meat export performance
0
500
1000
1500
2000
2500
3000
1980 1982 1984 1986 1988 1990 1992 1994 1996 1998 2000 2002 2004 2006
Perform
ance
(kt cwe) . Production
Exports
Data source: GMI database.

16 AN EVALUATION OF MLA’S RED MEAT NUTRITION PROGRAM
www.TheCIE.com.au
Australian trends in consumption
In regards to consumption, Australia’s trends over the last decade follow similar
patterns to that of other comparable developed countries. As chart 2.2 illustrates, the
consumption of red meat in Australia, the United States and Canada has been
trending downwards. Consistent with this trend, red meat’s Australian market share
also fell by a disproportionate amount. In the four years prior to 2002, red meat’s
market share fell from 64 per cent to just 56 per cent.
A common theme of meat demand in these countries is the emergence of poultry
meat in consumer diets. This has been driven by significant productivity growth in
the poultry sector, resulting in decreases in price relative to red meat, together with
positive health perceptions, product development, improved quality and strong
promotion. At the same time, red meat received a significant amount of negative
attention in the late 1990s, leaving some consumers with the view that they could
improve their diets by limiting red meat consumption.
Examination of chart 2.2 also highlights that that, historically, Australia’s
consumption was out of alignment with consumers in North America — per person
consumption of red meat in Australia was considerably higher than other developed
countries. However, Australian consumption levels have been converging on those
observed in the United States and Canada.
Over a 20 year period (from 1980), per person consumption fell by nearly 25 per cent.
By 2006, Australian per person consumption was 48 kg cwe — which is still high
compared to 43 and 33 kg cwe for the United States and Canada (see chart 2.3).
Australian perceptions of red meat
While Australia did not experience any incidents of ‘mad cow disease’ or the full
extent of fad diets, households were exposed to range of negative messages about
health problems associated with excessive consumption of red meat.
In 1999, MLA consumer tracking surveys found that only 16 per cent of people
thought red meat was essential to a healthy diet. A survey by the Australian Dairy
Corporation reported that nearly two thirds of women in 2000 felt that ‘they should
limit their red meat consumption to avoid possible health problems’ (MLA 2002). To
some consumers, red meat was regarded as ‘public enemy number 2 — [where] if
cigarette smoking didn’t kill you, eating too much red meat would’ (MLA 2005).
Moreover, the proportion of consumers with negative perceptions of red meat had
risen to 56 per cent in 1999, up from 43 per cent in 1997.

AN EVALUATION OF MLA’S RED MEAT NUTRITION PROGRAM 17
www.TheCIE.com.au
2.2 Per person consumption in Australia, United States and Canada
0
10
20
30
40
50
60
70
80
90
100
1980 1982 1984 1986 1988 1990 1992 1994 1996 1998 2000 2002 2004 2006
Consu
mptio
n(kg cwe per person)
.
Australia
Red meat
Poultry meat
Pig meat
0
10
20
30
40
50
60
70
80
90
100
1980 1982 1984 1986 1988 1990 1992 1994 1996 1998 2000 2002 2004 2006
Consu
mptio
n (kg
cwe per person)
.
United States
0
10
20
30
40
50
60
70
80
90
100
1980 1982 1984 1986 1988 1990 1992 1994 1996 1998 2000 2002 2004 2006
Consu
mption (kg
cwe per person)
.
Canada
a Consumption measured by domestic disappearance.
Data source: GMI database.

18 AN EVALUATION OF MLA’S RED MEAT NUTRITION PROGRAM
www.TheCIE.com.au
2.3 Per person red meat consumption before the nutriti on program a
0
10
20
30
40
50
60
70
1980 1985 1990 1995 2000
Consu
mptio
n (kg
cwe per person)
.
Lamb
Beef
Red meat
a Consumption measured by domestic disappearance in Australia.
Data source: MLA.
Similar to consumers, GPs and other health professionals were also sceptical about
the health benefits of red meat. Immediately prior to the launch of the campaign, as
many as 40 per cent of GPs were recommending that their patients consume red
meat less than one to two times per week, substantially less than the Australian
Government guidelines recommend (chart 2.4).1
2.4 GPs recommending that healthy adults eat red meat less than or equal to one to two times per week
0
5
10
15
20
25
30
35
40
45
1995 1998 Feb 01
GPs reco
mmending red m
eat (per cent)
..
Data source: MLA (2003).
1 Australian Government guidelines clearly state that red meat should be consumed three to four times per week: ‘The Australian Guide to Healthy Eating recommends that red meat be eaten three to four times a week; less than this and high-iron replacement foods will be required. This guide adds that this is especially important for girls, women, vegetarians and athletes’. (DoHA 2003)

AN EVALUATION OF MLA’S RED MEAT NUTRITION PROGRAM 19
www.TheCIE.com.au
3 The nutrition campaign
The declining demand for red meat was a key motivator for MLA’s nutrition
campaign. In November 1999, MLA convened the Red Meat and Health Expert
Advisory Committee. The committee was charged with the task of preparing
Australia’s first evidence based red meat nutrition report. Their report, The Role of
Red Meat in Healthy Australian Diets, launched in February 2001, had four main
conclusions:
� lean red meat has an important place in a healthy diet;
� red meat is an important source of protein and other nutrients, such as iron, zinc
and vitamin B12;
� lean red meat can be included in strategies for the prevention and treatment of
obesity; and
� guidelines recommend we eat lean red meat three to four times per week.
On the back of this report, MLA launched a multi-million dollar nutrition campaign
aimed at improving the nutritional image of red meat.
Objectives
The campaign’s main objective was to ‘reduce barriers to the consumption of red
meat’ (MLA 2003b). Marketing research commissioned by MLA confirmed that red
meat has a negative health image, and this negative health image was a major
constraint on consumption. This evidence-based nutrition campaign sought to
reverse this image and to overcome ‘decades of adverse news reports and negative
communication proclaiming that a healthy diet meant reducing or eliminating red
meat’ (MLA 2007a).
The campaign consisted of four components:
� a nutrition research program to justify the role of red meat in healthy eating
patterns and in lifestyle-related diseases, and to address concerns about red
meat’s nutritional integrity and its safety with respect to key public health issues;
� a communications campaign to promote the MLA’s sponsored nutrition research
among those in the health professional industry;
� a consumer campaign that would:
– overcome misconceptions about the nutritional value of red meat

20 AN EVALUATION OF MLA’S RED MEAT NUTRITION PROGRAM
www.TheCIE.com.au
– promote the image of red meat; and
� an ongoing issues management program to manage the media cycle and form
relationships with government and non-government organisations.
At the same time as promoting the nutritional value of read meat, MLA looked to
support their message by promoting the association of red meat with ‘vitality and
wellbeing’ and ‘enjoyment’. This aspect of the campaign intended to appeal to
emotive sentiments and emphasised positive imagery of red meat.
Logic of the program
Prior to the launch of the campaign, many consumers did not associate red meat as a
healthy source of nutrition. This negative — and seemingly unsubstantiated — view
imposed a barrier to the consumption of red meat by Australian households. MLA’s
nutrition campaign sought to overcome this barrier by ‘driving attitudinal change as
well as contribute to a shift in consumption behaviour’ (MLA 2003b).
The two main sources for consumers to obtain information about nutrition are GPs
and television. GPs (and dietitians) are also viewed as the most credible sources of
dietary information (chart 3.1). The campaign sought to correct misconceptions about
red meat by launching two targeted campaigns through these two avenues.
3.1 Sources of nutrition information
Most common sources of information
0
5
10
15
20
25
30
35
40
45
GPs TV programs Friends and
relativ es
Respo
nses
(pe
r ce
nt) .
Most credible sources of information
0
5
10
15
20
25
30
35
40
45
GPs Dietitians Diet
books
Respo
nses
(pe
r ce
nt) .
Data source: MLA (2003a).
It was hoped that the removal of these barriers would ultimately provide a sustained
increase in demand. This objective was assisted with a marketing campaign that also
promoted the enjoyment and nutritional message of red meat.
The program’s logic is mapped out in chart 3.2. The campaign undertook a series of
activities to produce a set of outputs (such as televisions advertisements, research

AN EVALUATION OF MLA’S RED MEAT NUTRITION PROGRAM 21
www.TheCIE.com.au
3.2 Mapping the campaign’s logic
INPUTS / ACTIVITIES OF NUTRITION CAMPAIGN
Health professional communications
GP communications
Dietician communications
Healthcare PR program
Other outlays
Consumer campaign
Media and production
Point of sale
Publicity and PR
Marketing services
Program delivery
Nutrition research
Management of current nutrition programs
New research programs
Communications
Program delivery
Issues management and government affairs
Issues management Government and NGO affairs
OUTPUTS
Health professional communications
Advertising in major medical weeklies
Nutrition resource material
Newsletter distribution
Trade shows
Consumer campaign
Television commercials
Print advertising — women’s magazines
POS advertising
Website
Special event activities
Nutrition research
Research projects
Journal articles and conference presentation
OUTCOMES
Industry
Change in marketing of red meat products by supermarkets, butchers and others
Demand
Change in consumer preferences and attitudes
Change in consumer knowledge about nutrition
Social
Change in health professional knowledge
Increase in scientific knowledge
IMPACTS
Industry
Increased industry revenue (e.g. greater profitability)
More secure and resilient markets, e.g. increase market share for red meat
Demand
Increased demand for red meat through increased:
• consumption, &/or
• expenditure
Social
Reduced risk of key health problems
papers and advertorials). These outputs were designed to generate favourable
changes in consumer preferences and market profitability (the program’s outcomes).
Finally, as a result of the change in preference, it was hoped that consumer demand
for red meat would be reinforced and possibly increased (the program’s impact).

22 AN EVALUATION OF MLA’S RED MEAT NUTRITION PROGRAM
www.TheCIE.com.au
Inputs and activities
The activities of the four main components of the campaign are listed below. These
activities can be considered as the campaigns inputs. Table 3.3 maps out the timing of
the campaign and its components.
3.3 Timeline of the nutrition program
1998
1999
2000
2001
2002
2003
2004
2005
2006
2007
2008
Issues management and government affairs
a
Nutrition research b
Communications with health professionals
Consumer campaign c d a MLA forms Red Meat and Health Expert Advisory Committee. b Committee releases report on The Role of Red Meat in Healthy Australian Diets. c MLA launches the Red Meat Feel Good marketing campaign. d MLA launches Foundation Food campaign.
Source: MLA.
Issues management and government affairs
MLA oversaw a program of issues management and media interaction to assist with
the other components of the campaign. This component is effectively a risk
management strategy. MLA forged working relationships between itself and state
health organisations and non-government organisations. This branch of the nutrition
campaign performed a number of activities including:
� monitoring and managing issues and media enquiries as they emerged;
� monitoring government and non-government organisations’ nutrition and health
policies, while maintaining positive relationships with key professional groups;
� implementing a healthcare public relations program to inform medical journalists
about the latest science on red meat and health; and
� engaging in partnerships with the Dieticians Association of Australia and
National Heart Foundation to provide evidence-based nutrition and health
information on red meat.
Nutrition research program
MLA considered the provision of credible scientific evidence as an integral
supplement to the campaigns targeting health professionals and consumers.
Credible, sound evidence was required to justify the role of red meat in a healthy
diet, promote increasing red meat consumption and counter arguments for reducing
red meat consumption. Through the funding of research by key influencer research

AN EVALUATION OF MLA’S RED MEAT NUTRITION PROGRAM 23
www.TheCIE.com.au
organisations, MLA accumulated strong evidence to support its marketing activities
as well as create supporting advocates in the nutrition research community (MLA
2005).
The aim of this program was to provide credible and sound nutrition evidence to
help MLA understand:
� red meat’s role in a healthy diet
� red meat’s contribution to improving public health in Australia
� emerging areas of nutrition and behavioural science.
The research outcomes provide evidence-based information for communication and
dissemination to nutrition researchers, public health policy makers, health care
professionals and consumers.
External to the nutrition campaign, MLA partially funded the research behind the
CSIRO Total Wellbeing Diet (box 3.4). The CSIRO Total Wellbeing Diet (TWD) is a
nutritionally balanced, low fat diet — with a higher level of protein to improve
satiety and key metabolic health biomarkers. Most of the protein is derived from lean
meat, fish and low fat dairy foods. The diet also contains adequate fibre from
wholegrains, fruit and vegetables (CSIRO 2008). The popularity of the CSIRO TWD,
as well as the credibility of its authors, directly complemented MLA’s efforts in
promoting its nutritional message.
Health professional communications
To justify, promote and defend the role of red meat in the Australian diet, MLA went
to consumers’ main sources of information. GPs, dieticians and health organisations
are major sources of credible nutrition advice to the community, and each has a role
in influencing nutrition/health information through the media. In targeting these
organisations, MLA:
� implemented an integrated GP communication campaign that was clinically
relevant to the treatment and management of cardiovascular health, obesity, iron
deficiency and other conditions; and
� developed and implemented targeted dietician communications that link into key
clinical and public health nutrition issues.
Consumer campaigns
MLA sought to reinforce red meat’s role in an essential diet by providing an ongoing
positive voice for red meat within a competitive and volatile food and health
environment. The Red Meat. Feel Good (RMFG) consumer campaign was implemented
in two phases.

24 AN EVALUATION OF MLA’S RED MEAT NUTRITION PROGRAM
www.TheCIE.com.au
3.4 The CSIRO Total Wellbeing Diet
CSIRO published the CSIRO Total Wellbeing Diet (TWD) in 2005 on the back of
many years of research and clinical trials, TWD quickly became a bestseller with
over a million copies sold nationwide and 100 000 sold internationally.
Momentum for the diet was gained when CSIRO — a leading authority in dietary
research — was approached by the health professional industry with concerns
about the promotion of high protein diets without reliable supporting evidence.
Alternative dietary approaches — such as the Atkins and ZONE diets —had
become increasingly popular.
Studies conducted by CSIRO at their Clinical Research Unit in Adelaide
confirmed that varying the protein to carbohydrate ratio during weight loss could
produce a number of subtle benefits that could result in greater fat loss and
sparing of lean body mass.
A study of 100 overweight and obese women focused on two different diets over a
12 week period. The women were divided into two groups:
� one group was placed on a high protein, low fat diet
� the other group was given a high carbohydrate, low fat diet.
The hypothesis was that, if kilojoule intake for each diet was the same, then
CSIRO should not be able to observe any difference in weight loss. But there was
— more weight and fat was lost by the women on the higher protein diet,
particularly if they had high blood fats, called triglycerides.
In addition, to CSIRO’s surprise, more women dropped out of the high
carbohydrate diet. This was unexpected as researchers did not expect the high
protein foods to appeal to women as much as the starchy foods.
Since the TWD was published, it is estimated that 547 000 Australians have lost
weight by following its recommendations and principles (MLA 2007c).
Source: CSIRO and MLA.
� RMFG, February 2002 to June 2005 was aimed at positioning red meat as a source
of vitality and wellbeing, and to capture the joy of living. RMFG was a fully
integrated campaign led by television, and included print, online, public relations
(PR) and point-of-sale (POS) material. RMFG commenced in February 2002 with
the ‘Singing Butchers’ campaign. This was the flagship of RMFG and ran for all
three years of the campaign. RMFG also included tactical elements aimed at
building relevance throughout the year — for example, ‘get into shape’ was a
print, POS and PR campaign launched in spring 2003.

AN EVALUATION OF MLA’S RED MEAT NUTRITION PROGRAM 25
www.TheCIE.com.au
� RMFG II (Foundation Food), March 2006 was aimed at positioning red meat as
an essential part of the diet to be consumed three to four times a week and
challenging negative attitudes head on. This second phase of the nutrition
program was launched in March 2006 as a fully integrated campaign — including
television, print, online, POS and PR. The flagship television commercial was the
60 second ‘Evolution’, which communicates red meat’s role in evolution. It ran
through 2006 in tandem with ‘Library’, which specifically spoke to mothers about
red meat’s important role in brain development.
Investment by MLA
The campaign was run on a budget of approximately $6–7 million per year, with
expenditure in 2006-07 budgeted at over $9 million (table 3.5). In total, more than
three quarters of the entire nutrition campaign budget was spent on the consumer
campaign, which was mainly spent on consumer promotion (chart 3.6). MLA
nutrition research was supported by over $2 million in Australian Government
matching funds.
What did the campaign deliver?
The campaign’s outputs are the tangible products created by MLA’s activities. At the
top level, there are three major outputs:
� research on the role of red meat in healthy eating and in improving public health;
� a communications program that targeted attitudes and dietary advice of health
professionals; and
� an advertising campaign that targeted the attitudes and behaviour of consumers.
Research outputs
MLA laid the foundations for its consumer campaign with an ambitious research and
development (R&D) program. MLA’s R&D program provided the ‘evidence’ for its
‘evidence based campaign’. The aim of this program is to provide credible and sound
nutrition evidence to help MLA understand and communicate:
� red meat’s role in a healthy diet
� red meat’s contribution to improving public health in Australia
� emerging areas of nutrition and behavioural science.
R&D projects were developed in consultation with an Expert Advisory Committee.
This Committee comprised of both industry representatives and academics. It called
for tenders on an annual basis in a range of areas of strategic interest to the red meat
product. In total, some $4.8 million was spent on MLA sponsored research.

26 AN EVALUATION OF MLA’S RED MEAT NUTRITION PROGRAM
www.TheCIE.com.au
3.5 Nutrition program activity budgets: 2002–07
Activity MLA funding External funding Total Funding
$000 $000 $000
Health professionals communications
2001-02 500 0 500
2002-03 500 0 500
2003-04 600 0 600
2004-05 620 0 620
2005-06 559 0 559
2006-07 640 0 640
Nutrition researcha
2001-02 438 438 876
2002-03 361 361 721
2003-04 393 393 786
2004-05 445 445 889
2005-06 401 401 801
2006-07 445 445 890
Consumer campaign
2001-02 5 964 0 5 964
2002-03 4 840 0 4 840
2003-04 4 740 50 4 790
2004-05 5 123 0 5 123
2005-06 4 916 0 4 916
2006-07 7 400 0 7 400
Issues management and government affairs
2001-02 230 0 230
2002-03 230 0 230
2003-04 280 0 280
2004-05 280 0 280
2005-06 180 0 180
2006-07 205 0 205
Total
2001-02 7 132 438 7 570
2002-03 5 931 361 6 291
2003-04 6 013 443 6 456
2004-05 6 468 445 6 912
2005-06 6 056 401 6 456
2006-07 8 690 445 9 135 a MLA received matching funds from the Australian Government to assist with its R&D funding.
Source: MLA.
The MLA Human Nutrition Research Program follows a transparent and
independent process.
� A strategic plan is developed in consultation with key nutrition, government and
industry stakeholders to identify public health and marketing research priorities.
� Expressions of interest (EOI) for research proposals are requested each year.
� Research proposals are requested from selected EOI that best meet research
priorities.

AN EVALUATION OF MLA’S RED MEAT NUTRITION PROGRAM 27
www.TheCIE.com.au
� Research proposals are reviewed by MLA’s Human Nutrition Advisory
Committee to ensure scientific rigour.
3.6 MLA nutrition program funding allocation
0%
20%
40%
60%
80%
100%
2002-03 2003-04 2004-05 2005-06 2006-07
Share of funding .
Issues management Health professionals Nutrition research Consumer campaign
Data source: MLA.
Between 1998 and 2007, MLA funded a total of 39 projects relating to red meat and
nutrition. Ten of these projects were concerned with what the Australian
Government Department of Health and Ageing (DoHA) deemed to be public health
priorities. The most prolific areas of research included heart, stroke and vascular
disease, nutrition composition and obesity. Table 3.7 outlines the research program
to date.
3.7 MLA nutrition research program
Area of nutrition research Projects Expenditure
No. $
DoHA public health priorities
Cancer 2 180 220
Diabetes 1 199 493
Heart, stroke, vascular disease 7 823 522
Other important areas
Obesity 6 1 618 815
Nutrient composition 7 468 128
Diet type 4 148 189
Acne 1 140 245
Nutrition status 2 178 203
Toddler nutrition 2 261 563
Elderly nutrition 2 235 350
Review/collation of information 5 207 653
Note: An additional $298 163 was spent by MLA on the communication of research and other miscellaneous expenses of the committee.
Source: MLA.

28 AN EVALUATION OF MLA’S RED MEAT NUTRITION PROGRAM
www.TheCIE.com.au
Commissioned research was conducted through collaborative and independent
efforts by prominent Australian and New Zealand institutions and health
professionals. A list of institutions commissioned by MLA for red meat nutrition
research is reported in table 3.8.
3.8 Institutions commissioned to undertake MLA nutritio n research
Commissioned institution Commissioned institution
Royal Melbourne Hospital Research Foundation University of Melbourne
CSIRO University of New England
Curtin University University of Newcastle
Deakin University University of Otago (NZ)
International Diabetes Institute University of South Australia
Children’s Hospital Westmead University of Sydney
NSW Centre for Public Health Nutrition University of Western Australia
Royal Melbourne Institute of Technology University of Wollongong
Women’s and Children’s’ Hospital, Adelaide
Note: A number of health professionals, unattached to institutions, also contributed to MLA research efforts, these are not listed.
Source: MLA.
The quality of research output is often judged by the quality of the journal that
publishes this research. And, indeed, the results of much of MLA’s commissioned
research were published in refereed journals and presented at scholarly conferences.
These included a number of top tier journals such as the:
� American Journal of Clinical Nutrition
� European Journal of Clinical Nutrition
� Archives of Internal Medicine
� Journal of the American Academy of Dermatology
� International Dermatology Journal
� Australian Nutrition and Dietetics Journal
� Journal of Nutrition.
MLA has recently prepared a strategic plan for human nutrition research and
development for 2007 through 2010. This framework will continue the current
program of research, targeting strategic areas of interest to MLA.
Communications with health professionals
Health professionals are often cynical about the information they receive from
industry. Information from experts and peers is understandably more credible than
information from a commercial organisation. MLA used the outputs from the
research they sponsored to deliver their two key messages:
AN EVALUATION OF MLA’S RED MEAT NUTRITION PROGRAM 29
www.TheCIE.com.au
� for optimum vitality and performance, red meat should be eaten three to four
times per week; and
� there are medical conditions (for example, high cholesterol) for which an increase
in red meat consumption is necessary.
To best communicate with health professionals, MLA employed a variety of
mediums, tailored specifically to communicate with this market. They included:
� a set of core advertisements that ran consistently in medical journals and weeklies;
� advertorials to reinforce the evidence-based approach of the campaign;
� a series of tactical event-based advertisements;
� promotional material, such as CD-ROMs, recipe booklets and patient information
resources; and
� participation at medical and health professional conferences.
MLA also produced a quarterly newsletter, Vital, which was distributed to around
4000 dieticians and nutritionists, and a website www.meat4health.com.au, both of
which are vehicles to communicate their latest research as well as provide a resource
for professionals to give to their patients. MLA’s nutrition website also contained
basic information, patient fact sheets and links to nutrition research.
The consumer campaign
MLA launched their consumer campaign Red Meat. Feel Good in February 2002. It was
designed to ‘increase consumer confidence in the health benefits of red meat in order
to drive red meat consumer expenditure and domestic demand’ (MLA 2005). The
target audience of the campaign was largely mothers with children aged 5–17 years.
In 2005 the campaign was relaunched as Foundation Food. This updated marketing
strategy refocused MLA’s message, describing red meat as a ‘must have’ food. The
objective of this campaign remained one of challenging consumer beliefs about red
meat and elevating red meat’s status as essential to a healthy diet.
Both marketing campaigns were headlined by a series of television commercials.
Television commercials were supported with print, POS promotion and PR support.
Table 3.9 outlines MLA’s commercials, and includes the timing of their key bursts for
each marketing campaign. Commercials were aired during key tactical times
throughout the year to take advantage of key events and consumer trends (table
3.10). For example, commercials were aired to take advantage of the prime ‘dieting
season’, ‘back to school’ periods and significant media events such as the Rolling
Stones tour in February 2002.

30 AN EVALUATION OF MLA’S RED MEAT NUTRITION PROGRAM
www.TheCIE.com.au
3.9 MLA nutrition campaigns
Commercial Key bursts Notes
Red Meat. Feel Good.
Singing Butchers Feb–Mar 2002
July–Aug 2002
Mar–Apr 2003
Feb–Mar 2004
Oct–Nov 2004
� Flagship television commercial to celebrate the vitality and wellbeing from eating red meat three to four times a week.
� Integrated media campaign combining POS, print and PR tie ins.
Soccerpath April 2002
Jul–Aug 2002
Mar–Apr 2003
Feb–Mar 2005
� Campaign targeted mums with the ‘three to four serves per week’ message.
� Integrated media campaign combining POS, print and PR tie ins.
Stairway to Heaven February 2003
Jul–Aug 2003
� Tactical media campaign combining POS and PR with a television commercial coinciding with the Rolling Stones tour.
Get into shape Oct–Nov 2002
Jan–Feb 2003
Mar–Apr 2003
May–Jun 2003
� Tactical print campaign in Weight Watchers Magazine.
Foundation Food
Evolution March 2006
July 2006
February 2007
Jul–Aug 2007
� Flagship television commercial to communicate the essential nature of red meat in the diet.
� Integrated media campaign combining POS, print and PR tie ins.
Library Mar–Apr 2006
July 2006
Aug–Sep 2007
� Campaign targeted mums communicate the importance of red meat for brain development in children.
� Integrated media campaign combining POS, print and PR tie ins.
Meerkats February 2007 � Media campaign combining POS and PR with a television commercial to communicate our ‘innate desire for red meat.’
Chicken March 2008 � Highlights the nutrient benefits of red meat versus chicken.
� Integrated media campaign combining POS, print and PR tie ins.
Print campaign Jul–Sep 2006
Oct–Nov 2006
Continuous print campaign.
Source: MLA.

AN EVALUATION OF MLA’S RED MEAT NUTRITION PROGRAM 31
www.TheCIE.com.au
3.10 Campaign calendar
Jan Feb Mar Apr May Jun Jul Aug Sep Oct Nov Dec
2002 Print
TV
PR
In store
2003 Print
TV
PR
In store
2004 Print
TV
PR
In store
2005 Print
TV
PR
In store
2006 Print
TV
PR
In store
2007 Print
TV
PR
In store
2008 Print
TV
PR
In store
Source: MLA.

32 AN EVALUATION OF MLA’S RED MEAT NUTRITION PROGRAM
www.TheCIE.com.au
4 Changes in attitudes
The previous section detailed how the inputs and activities of MLA culminated in
producing the program outputs. Specific outputs were designed to generate targeted
outcomes, which in turn were to have an impact on red meat sales and consumption.
This section extends the logic mapping of the previous section and describes the
outcomes that were achieved.
The main objective of the nutrition program was to stimulate demand by overcoming
negative consumer and health professional attitudes. These negative attitudes acted
as the major barriers to increasing the demand of red meat by Australian households.
The program’s outcomes are the induced changes in preferences, tastes or incentives
that are caused by MLA’s activities. The program sought to influence the perceptions
of health professionals and consumers, which in turn would have an effect on the
incentives facing retailers and industry.
This chapter focuses on providing an assessment of the observed changes of a set of
core key performance indicators that MLA tracks to assess receptiveness and the
outcomes from the nutrition campaign.
Promoting red meat among health professionals
The health professional campaign was developed in March 2001, based on the launch
of the Expert Report, The Role of Red Meat in Healthy Australian Diets. This report was
disseminated to dieticians and GPs through a direct mail campaign and
communications with key health organisations. The key messages focused on
nutritional strengths of lean red meat and the dietary guideline recommending lean
red meat three to four times a week. It also focused on lean red meat’s role in dietary
management of patients with a range of lifestyle diseases, including obesity and high
cholesterol, and with certain conditions such as acne and iron deficiency anaemia.
This message was delivered to GPs through advertising and direct mail, and to
dieticians through the Vital newsletter, direct mail and trade exhibits.
To some extent, we are able to gauge and measure outcomes of the campaign using
survey data collected by MLA. Surveys of health professionals were commissioned
by MLA at annual or biannual intervals over the period of February 2001 to February
2008. The surveys asked general practitioners and dieticians about their awareness of
research based evidence that red meat could assist with the management of certain

AN EVALUATION OF MLA’S RED MEAT NUTRITION PROGRAM 33
www.TheCIE.com.au
health risks. We have chosen a set of measures that provide the most consistent data
set — it should be noted that these are not necessarily program KPIs.
It should also be noted that, although GPs generally agree that diet and nutrition
play a significant role in most conditions (95 per cent agreeing with that statement in
2006), most feel that dieticians are ‘better placed’ to offer advice (81 per cent agreeing
with the statement). Moreover, nearly half of GPs surveyed indicated that offering
nutrition advice in a general practice was ‘difficult’. Consequently, we might
anticipate from the outset that any response to nutrition promotions may be
tempered. But figures quoted earlier in the report suggested that GPs were the most
common and credible source of nutritional information for consumers. Given this,
GP attitudes and perceptions are important measures for MLA to consider.
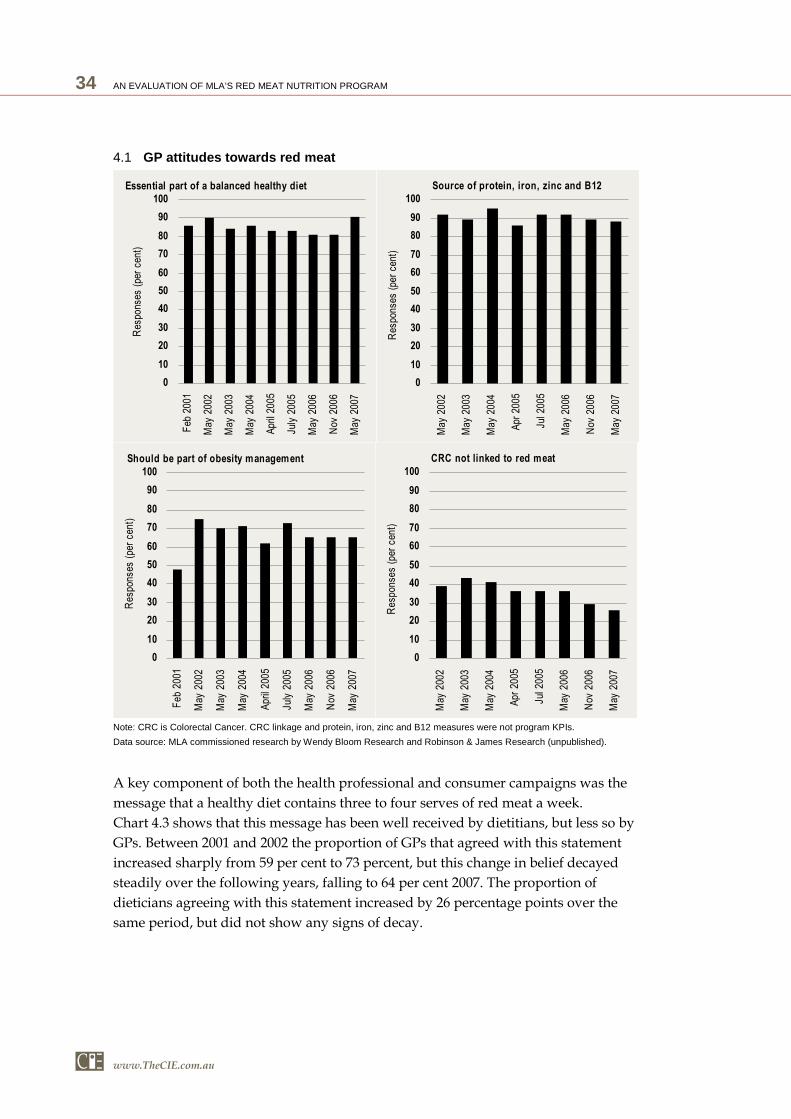
At the beginning of the sample in February 2001, 86 per cent of GPs either agreed or
strongly agreed with the statement that ‘nutrients in lean red meat make it an
essential part of a balanced healthy diet’. This proportion increased to 90 per cent
after the first year of MLA’s activities and remained relatively high over the period,
dropping only to 81 per cent in May and November 2006, but peaking in May 2007 at
91 per cent (chart 4.1). Similarly, the majority of GPs saw red meat as ‘source of
protein, iron, zinc and vitamin B12’. (Note: this measure was not a program KPI.)
However, GPs seem less convinced on potential treatment and condition
management. After an initial surge between 2001 and 2002, the proportion of GPs
agreeing with the statement that ‘lean red meat should be used to assist with obesity
management’ declined marginally over the period, but still remained high overall.
Between May 2002 and May 2007, GPs agreeing with the statement that ‘colorectal
cancer (CRC) is not linked with red meat’ declined by over ten percentage points.
That is, the attitudes of GPs deteriorated over the campaign period.
Dieticians began with a seemingly more sceptical stance from the outset, but warmed
to red meat over the period. In 2001 only 67 per cent of dieticians surveyed agreed
that the ‘nutrients in lean red meat make it essential part of a balanced healthy diet’.
This proportion, however, increased over the period and, after three years, had
reached 86 per cent.
Dieticians also became increasingly convinced of the benefits that red meat could
provide to patients with obesity problems and high cholesterol (chart 4.2). Nearly
90 per cent of dieticians surveyed in 2007 would recommend lean red meat for
patients with cholesterol problems, up from 54 per cent in 2002. The proportion of
dieticians who recognise the satiating properties in lean red meat to help manage
obesity problems rose by 14 percentage points over the period as well. These trends
contrast with those of GPs, whose opinions remained largely constant (but generally
positive) over the period. The key difference is that GP perceptions started out at
much higher levels than dieticians. Similar to their GP counterparts, however,
dietician beliefs about the links between red meat consumption and colorectal cancer
and also declined over the five years to 2007.
34 AN EVALUATION OF MLA’S RED MEAT NUTRITION PROGRAM
www.TheCIE.com.au
4.1 GP attitudes towards red meat
Essential part of a balanced healthy diet
0
10
20
30
40
50
60
70
80
90
100Feb 200
1
May 2002
May 2003
May 2004
April 20
05
July 200
5
May 2006
Nov 200
6
May 2007
Respo
nses
(per cent)
Source of protein, iron, zinc and B12
0
10
20
30
40
50
60
70
80
90
100
May
200
2
May
200
3
May
200
4
Apr 2005
Jul 2
005
May
200
6
Nov
200
6
May
200
7
Respons
es (pe
r cent) .
Should be part of obesity management
0
10
20
30
40
50
60
70
80
90
100
Feb
200
1
May
200
2
May
200
3
May
200
4
April 20
05
July 200
5
May
200
6
Nov
200
6
May
200
7
Res
pons
es (pe
r ce
nt)
CRC not linked to red meat
0
10
20
30
40
50
60
70
80
90
100
May
200
2
May
200
3
May
200
4
Apr 200
5
Jul 2
005
May
200
6
Nov
200
6
May
200
7
Res
pons
es (pe
r ce
nt) .
Note: CRC is Colorectal Cancer. CRC linkage and protein, iron, zinc and B12 measures were not program KPIs.
Data source: MLA commissioned research by Wendy Bloom Research and Robinson & James Research (unpublished).
A key component of both the health professional and consumer campaigns was the
message that a healthy diet contains three to four serves of red meat a week.
Chart 4.3 shows that this message has been well received by dietitians, but less so by
GPs. Between 2001 and 2002 the proportion of GPs that agreed with this statement
increased sharply from 59 per cent to 73 percent, but this change in belief decayed
steadily over the following years, falling to 64 per cent 2007. The proportion of
dieticians agreeing with this statement increased by 26 percentage points over the
same period, but did not show any signs of decay.

AN EVALUATION OF MLA’S RED MEAT NUTRITION PROGRAM 35
www.TheCIE.com.au
4.2 Dieticians are receiving the message
Essential part of a balanced healthy diet
0
10
20
30
40
50
60
70
80
90
100
2001
2002
2003
2004
2005
2006
2007
Respo
nses
(pe
r ce
nt)
Lean red meat for cholesterol patients
0
10
20
30
40
50
60
70
80
90
100
2002
2004
2005
2006
2007
Per cent x
Should be part of obesity management
0
10
20
30
40
50
60
70
80
90
100
2001
2002
2003
2004
2005
2006
2007
Res
pons
es (pe
r ce
nt)
CRC is not linked to red meat
0
10
20
30
40
50
60
70
80
90
100
2002
2004
2005
2006
2007
Respo
nses
(per cent) .
Note: Cholesterol and CRC measures were not program KPIs.
Data source: MLA commissioned research by Wendy Bloom Research and Robinson & James Research.
The observed change in attitudes was accompanied by a change in health
professional behaviour. The proportion of GPs recommending that their patients eat
red meat three to four times a week increased by some 16 percentage points during
the campaign. Dieticians saw nearly double this increase over the period — the
proportion recommending red meat in the target quantity rising from 55 per cent to
over 80 per cent (chart 4.4)
The nutrition campaign seemingly influenced dieticians more than GPs. Dieticians
are specialists in this space and may, therefore, be more receptive to MLA’s activities.
For both types of professionals, however, most of the significant changes that did
occur coincided with MLA’s initial activities in this space.

36 AN EVALUATION OF MLA’S RED MEAT NUTRITION PROGRAM
www.TheCIE.com.au
4.3 Health professionals who agree that red meat shoul d be served three to four times per week
0
20
40
60
80
100
2001 2002 2003 2004 2005 2007
%
GPs Dietitian
Data source: MLA commissioned research by Wendy Bloom Research and Robinson & James Research.
4.4 Health professionals who recommend that red meat s hould be served three to four times per week
0
20
40
60
80
100
2001 2002 2003 2004 2005 2006 2007
%
GPs Dietitian
Data source: MLA commissioned research by Wendy Bloom Research and Robinson & James Research.
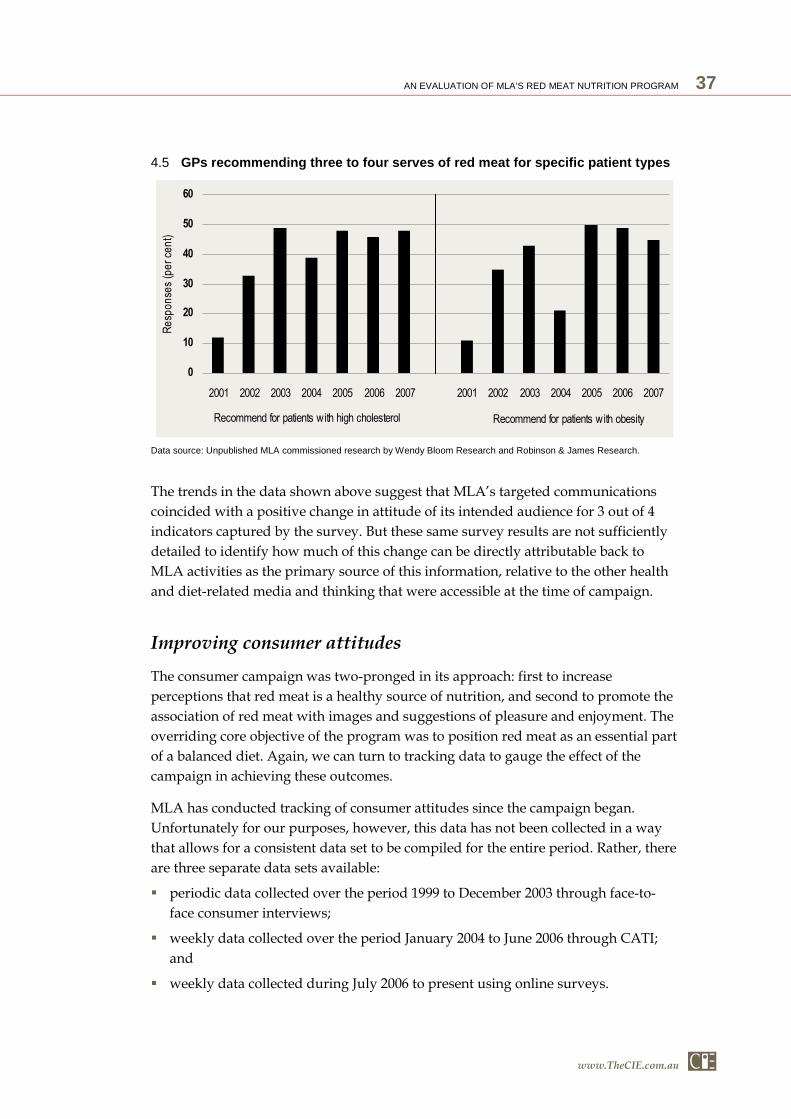
Notably, MLA’s message about the benefits of three to four serves of red meat per
week is resonating more strongly among GPs in their treatment of specific patient
types. In 2001 the proportion of GPs recommending three to four serves of red meat
for patients with high cholesterol was only 12 per cent — and 11 per cent for patients
with obesity. In 2002 these figures had risen to 33 and 35 per cent respectively, and
by the end of the period both were near 50 per cent (chart 4.5).
AN EVALUATION OF MLA’S RED MEAT NUTRITION PROGRAM 37
www.TheCIE.com.au
The trends in the data shown above suggest that MLA’s targeted communications
coincided with a positive change in attitude of its intended audience for 3 out of 4
indicators captured by the survey. But these same survey results are not sufficiently
detailed to identify how much of this change can be directly attributable back to
MLA activities as the primary source of this information, relative to the other health
and diet-related media and thinking that were accessible at the time of campaign.
Improving consumer attitudes
The consumer campaign was two-pronged in its approach: first to increase
perceptions that red meat is a healthy source of nutrition, and second to promote the
association of red meat with images and suggestions of pleasure and enjoyment. The
overriding core objective of the program was to position red meat as an essential part
of a balanced diet. Again, we can turn to tracking data to gauge the effect of the
campaign in achieving these outcomes.
MLA has conducted tracking of consumer attitudes since the campaign began.
Unfortunately for our purposes, however, this data has not been collected in a way
that allows for a consistent data set to be compiled for the entire period. Rather, there
are three separate data sets available:
� periodic data collected over the period 1999 to December 2003 through face-to-
face consumer interviews;
� weekly data collected over the period January 2004 to June 2006 through CATI;
and
� weekly data collected during July 2006 to present using online surveys.
4.5 GPs recommending three to four serves of red meat for specific patient types
0
10
20
30
40
50
60
2001 2002 2003 2004 2005 2006 2007 2001 2002 2003 2004 2005 2006 2007
Resp
onses (per ce
nt) x
Recommend for patients with high cholesterol Recommend for patients with obesity
Data source: Unpublished MLA commissioned research by Wendy Bloom Research and Robinson & James Research.

38 AN EVALUATION OF MLA’S RED MEAT NUTRITION PROGRAM
www.TheCIE.com.au
Caution should be used when attempting to compare the data across these three
different data sets. Face-to-face surveys were conducted in ‘waves’ to test the impact
of specific advertising campaigns, while both the CATI and web based surveys ran
continuously.2 In addition, although the data collected with CATI and web surveys
used similar sets of questions, they both differed from the initial survey method
(face-to-face).
We have compiled the CATI and web surveys into a continuous time series for
illustrative purposes. This produces a weekly series over 204 weeks beginning in
January 2004, and ending in February 2008. (Note that data was not always collected
over Christmas holiday period.) Table 4.6 reports the key descriptive summary
statistics of the data collected.
4.6 Consumer tracking data summary statistics
Variable Unit Face to face CATI Web
Period 1 Jan 2002 to 31 Dec 2003
12 Jan 2004 to 22 Jun 2006
3 Jul 2006 to 25 Feb 2008
Observations No. 2 496 6 750 8 710
Weeks No. 104 127 87
Ave weekly observations No. 24 55 106
Cities sampled Sydney, Melbourne, Brisbane
Sydney, Melbourne, Brisbane, Adelaide,
Perth
Sydney, Melbourne, Brisbane, Adelaide,
Perth
Females % 75 74 74
Mothers with kids % na 30 25
Mean household income $ na 69 338 72 242
Mean age of respondent Years na 44.0 42.9
na Not available.
Data source: MLA commissioned market research by TLE (CATI) and Millward Brown (Web).
There are some consistency problems in joining the samples. In most of the data
series, the change in survey methodology appears to impact on the data’s ‘level’, but
not necessarily of any trend momentum. There was also a substantial reduction in
the amount of variance the data experiences after the change in 2006. This is likely
due to the web survey being conducted on a significantly larger sample. Feedback
received from marketing analysts Millward Brown suggest that this is not unusual,
and ought to be expected. Moreover, Millward Brown argue that responses received
from web surveys are likely to be more accurate than CATI responses. We note,
however, that this is a contentious issue in the literature. Box 4.7 further explains the
technique for controlling for survey mode. There have also been discussions
surrounding the presentation of the tracking data. The main points of discussion
have been around the use of only continuous data versus discrete ‘snapshot’ data.
Box 4.8 discusses this further.
2 To analyse the data, CIE aggregated data from both these samples into weekly time series.

AN EVALUATION OF MLA’S RED MEAT NUTRITION PROGRAM 39
www.TheCIE.com.au
4.7 Controlling for survey mode
The two charts below show two different cuts of the same data from MLA’s
consumer tracking survey. They are drawn from CATI and web surveys
conducted between 2004 and 2008.
Individually, a raw data point does not possess a great deal of analytical value for
our purposes. Every point in a series is influenced by a set of external factors that
we cannot measure. Changes in these external factors can create significant
variance in the series.
When we look at the data collectively, however, the data points may reveal either
a trend in the series, or a crucial turning point that may be of interest. To isolate
this trend, we can use what is known as an Ordinary Least Squares (OLS)
estimation. An OLS estimation plots the ‘line of best fit’ through the data and tests
can be performed to see if this trend is statistically significant.
The first chart shows the OLS estimation through the entire series. The trendline,
or line of best fit, suggests that the general level of the data is increasing over time.
That is, for each week that passes, the data’s underlying level is increasing despite
the weekly fluctuations in external factors.
This conclusion, however, may be misleading. In fact, once we control for the
change in surveying methodology, the data trend is completely removed. To test
this we can perform an OLS estimation on our data and a control variable. This
control variable, or dummy variable, is equal to 1 if the survey is performed online
(post-July 2006) or 0 if interviewed by phone. If the dummy is statistically
significant, and time is not, then we can conclude that ‘time’ has no impact on the
data (assuming that the survey methodology is not correlated with something
potentially explanatory, such as a significant change in the scale and direction of
the nutrition campaign). This leads to a far different conclusion to what we
previously had reached.
0.0
0.2
0.4
0.6
Week
1
Week
31
Week
61
Week
91
Week
121
Week
151
Week
181
MLA data
Linear (MLA data)
0.0
0.2
0.4
0.6
Week
1
Week
31
Week
61
Week
91
Week
121
Week
151
Week
181
CATI Web
Continued on next page

40 AN EVALUATION OF MLA’S RED MEAT NUTRITION PROGRAM
www.TheCIE.com.au
4.7 Controlling for survey model Continued
A control study was conducted by Milward Brown when the MLA consumer
tracking was moved from CATI to online sampling. The control study was
conducted to test for differences in responses obtained via the different survey
modes.
The chart below shows how survey mode impacted on consumer types.
Respondents to the online survey were more likely to respond positively than
those responding in the CATI survey. The proportion of respondents regarding
themselves as appreciators was 9 percentage points higher when answering
online. And, correspondingly, those answering in the negative categories
(rejectors and resistors) were 9 percentage points lower.
Impact of survey mode on survey response Difference between online and CATI survey
modes
Rejectors
Resistors
Appreciators
Acceptors
-10 -8 -6 -4 -2 0 2 4 6 8 10
Per cent
It should be noted that, due to the fact that this analysis is limited to the period 2004
to 2008, it does not include the first two years of the initial RMFG campaign. This is
not an ideal situation, but is unavoidable due to the incomparability of the data sets.
Health and nutrition
The consumer campaign’s health and/or nutrition component was spearheaded with
the message that a nutritious diet consists of three to four serves of red meat per
week. Chart 4.9 shows the proportion of consumers who were able to correctly
identify this message over the four year period. We were unable to identify a
statistically significant trend — positive or negative — in the proportion of

AN EVALUATION OF MLA’S RED MEAT NUTRITION PROGRAM 41
www.TheCIE.com.au
4.8 Trends and snapshots
One limitation of the complete data set collected by MLA over the years is that has
the data set has only been collected continuously since 2004. Prior to 2004, attitude
and behaviour data was collected at discrete intervals coinciding with the airing of
television commercials and consumer campaigns. It is difficult to compare the two
series and, in fact, doing so may lead to incorrect inferences being made about the
data.
A continuous data series contains data collected at regular intervals of time series.
Such a series is likely to contain fluctuations around trend. For example, in any
one year, household consumption is likely to rise in December and fall in January.
That is, demand is seasonal. Generally speaking it is the data’s ‘trend’ that we are
most interested in.
A data set consisting of a series of ‘snapshots’ collected at targeted intervals may
not reveal the data’s underlying trend. Snapshots can, however, can provide some
indication of change between pre and post scenarios. The challenge is being able
to meaningfully interpret the data and recognising its limitations with regard to
being combined with trend data. Snapshots can be used to either magnify a data’s
trend, or reverse it completely. This has been illustrated in the example below. A
continuous data series has been overlaid with a collection of snapshots. The
continuous data shows an underlying trend that is marginally increasing. In left
hand side diagram, the snapshots show a declining trend, while the right hand
side shows a rapidly increasing trend. Both stories are misleading.
When trying to establish a trend in the data for this evaluation, MLA’s pre-2004
data cannot be viewed as simply an incomplete extension of MLA’s continuous
(post-2004) data. Snapshots may reveal a sense of pre-existing attitudes and
behaviours, but without an appropriate context it is unclear where these data
points lie in fluctuations about that trend. For this reason, the focus of our analysis
relies mostly on the continuous data available.
SnapshotContinuousLinear (Snapshot)
SnapshotContinuousLinear (Snapshot)

42 AN EVALUATION OF MLA’S RED MEAT NUTRITION PROGRAM
www.TheCIE.com.au
consumers able to identify MLA’s message once we controlled for the survey’s
methodology. Moreover, although the MLA’s marketing program targeted female
consumers as the main purchasers of household grocery items, there was no
significant difference between female consumers and the total — a correlation of 0.88.
Over 50 per cent of consumers (the CATI sample average was 53 per cent while the
web survey average was 58 per cent) were able to correctly identify this message.
And those that did not were most likely to be one meal below the target range
(chart 4.10). This is consistent with MLA beliefs that consumers constrain their red
meat consumption because of health concerns.
Consumers regarded fish and seafood the healthiest meats, chicken second, and red
meat a close third (chart 4.11). (Note that no data was available for pork.) All three
meat groups are viewed as healthy by the vast majority of consumers surveyed. In
fact, responses from the web survey suggest that over 90 per cent of consumers
regarded each meat type as either ‘somewhat healthy’ or ‘very healthy’.
4.9 Per cent of consumers correctly identifying three to four meals per week message
0
20
40
60
80
100
18/01/2004
18/04/2004
18/07/2004
18/10/2004
18/01/2005
18/04/2005
18/07/2005
18/10/2005
18/01/2006
18/04/2006
18/07/2006
18/10/2006
18/01/2007
18/04/2007
18/07/2007
18/10/2007
18/01/2008
Resp
onses (per cent) .
CATI Web
Note: Consumers surveyed by MLA were asked to identify ‘how many red meat meals [did they] believe per week is a healthy target for [their] family?’.
Data source: MLA commissioned market research by TLE (CATI) and Millward Brown (Web).

AN EVALUATION OF MLA’S RED MEAT NUTRITION PROGRAM 43
www.TheCIE.com.au
4.10 How many red meat meals do you believe per week is a healthy target for your family?
0
10
20
30
40
50
60
1 or less 2 3-4 5-7 7 or more
Resp
onse
s (per ce
nt) .
CATI
Web
Data source: MLA commissioned market research by TLE (CATI) and Millward Brown (Web).
4.11 Health attitudes towards meat, sample averages
0
10
20
30
40
50
60
70
80
90
100
Red meat White meat Fish and Seafood
Resp
onse
s (per ce
nt) .
CATI
Web
Data source: MLA commissioned market research by TLE (CATI) and Millward Brown (Web).
We did not expect to witness any significant trend over time. Simply put, there was
very little opportunity for the data to improve from an extremely high starting point.
Mapping consumer beliefs in chart 4.12 reveals that this is the case. A regression
analysis of this data revealed no trend in consumer health attitudes after accounting
for this structural break. Subdividing responses into ‘somewhat healthy’ and ‘very
healthy’ also showed no trend.

44 AN EVALUATION OF MLA’S RED MEAT NUTRITION PROGRAM
www.TheCIE.com.au
4.12 Health attitudes towards red meat
0
20
40
60
80
100
18/01/2004
18/04/2004
18/07/2004
18/10/2004
18/01/2005
18/04/2005
18/07/2005
18/10/2005
18/01/2006
18/04/2006
18/07/2006
18/10/2006
18/01/2007
18/04/2007
18/07/2007
18/10/2007
18/01/2008
Response
s (per ce
nt) .
CATI Web
Data source: MLA commissioned market research by TLE (CATI) and Millward Brown (Web).
More specific indicators were also unable to reveal long term trends in the data.
Consumers were asked in the survey whether or not they agreed with the following
nutrition related statements about beef and red meat:
� Beef is an essential part of a healthy diet (KPI).
� Red meat makes healthy meals.
� Beef contains a wide range of vitamins and minerals.
� Beef is good in a weight loss diet.
� Red meat is essential for vitality healthy and wellbeing (KPI until 2006).
� A diet including red meat is more important for my health than I previously
believed (KPI).
� Red meat is essential for a healthy mind (KPI 2006 onwards).
It should be noted that not all these statements were specific KPIs for the nutrition
program. KPIs are noted where applicable and other measures were chosen both for
relevancy to nutritional perceptions and where the richest consistent data set was
available.
The proportion of consumers responding positively to each statement is shown in
charts 4.13 to 4.20. In each of the data series there seems to be a general decline across
all four indicators from late 2004 to early 2006, before recovering at the end of the
CATI sample. Data collected via the web survey is much more consistent, with little
movement across the mid 2006–08 period. Although there is no medium or long term
trend in the data, there is a high degree of correlation in consumer responses.

AN EVALUATION OF MLA’S RED MEAT NUTRITION PROGRAM 45
www.TheCIE.com.au
4.13 Beef is an essential part of a healthy diet
0
20
40
60
80
100
8/02/2004
8/05/2004
8/08/2004
8/11/2004
8/02/2005
8/05/2005
8/08/2005
8/11/2005
8/02/2006
8/05/2006
8/08/2006
8/11/2006
8/02/2007
8/05/2007
8/08/2007
8/11/2007
8/02/2008
Response
s (per ce
nt) .
CATI
Web
Data source: MLA commissioned market research by TLE (CATI) and Millward Brown (Web).
4.14 Red meat makes healthy meals
0
20
40
60
80
100
8/02/2004
8/05/2004
8/08/2004
8/11/2004
8/02/2005
8/05/2005
8/08/2005
8/11/2005
8/02/2006
8/05/2006
8/08/2006
8/11/2006
8/02/2007
8/05/2007
8/08/2007
8/11/2007
8/02/2008
Resp
onse
s (per cent) .
CATI
Web
Data source: MLA commissioned market research by TLE (CATI) and Millward Brown (Web).

46 AN EVALUATION OF MLA’S RED MEAT NUTRITION PROGRAM
www.TheCIE.com.au
4.15 Beef contains a wide range of vitamins and mineral s
0
20
40
60
80
100
8/02/2004
8/05/2004
8/08/2004
8/11/2004
8/02/2005
8/05/2005
8/08/2005
8/11/2005
8/02/2006
8/05/2006
8/08/2006
8/11/2006
8/02/2007
8/05/2007
8/08/2007
8/11/2007
8/02/2008
Response
s (per ce
nt) .
CATI
Web
Data source: MLA commissioned market research by TLE (CATI) and Millward Brown (Web).
Beef and red meat did score reasonably across nutrition statements. In most cases
greater than 60 per cent of the population agreed with the nutritional qualities of beef
and red meat. The exceptions being ‘weight loss management’ which averaged only
a low 36 per cent over the CATI sample — although this indicator improved
drastically under the web sample to 66 per cent — and ‘Red meat is essential for
vitality and wellbeing’ which averaged around the 80 per cent mark under both
samples.
We note that unlike the data in chart 4.12, which persisted at a high level over the
period, there was room for improvement in some of these indicators. Perhaps the
bleaker conclusion to draw on the above data trends is that about 35–40 per cent of
consumers consistently disagreed with these statements over the period. Despite MLA
efforts, no improvement was gained (or lost) over the four years for which we have
data.
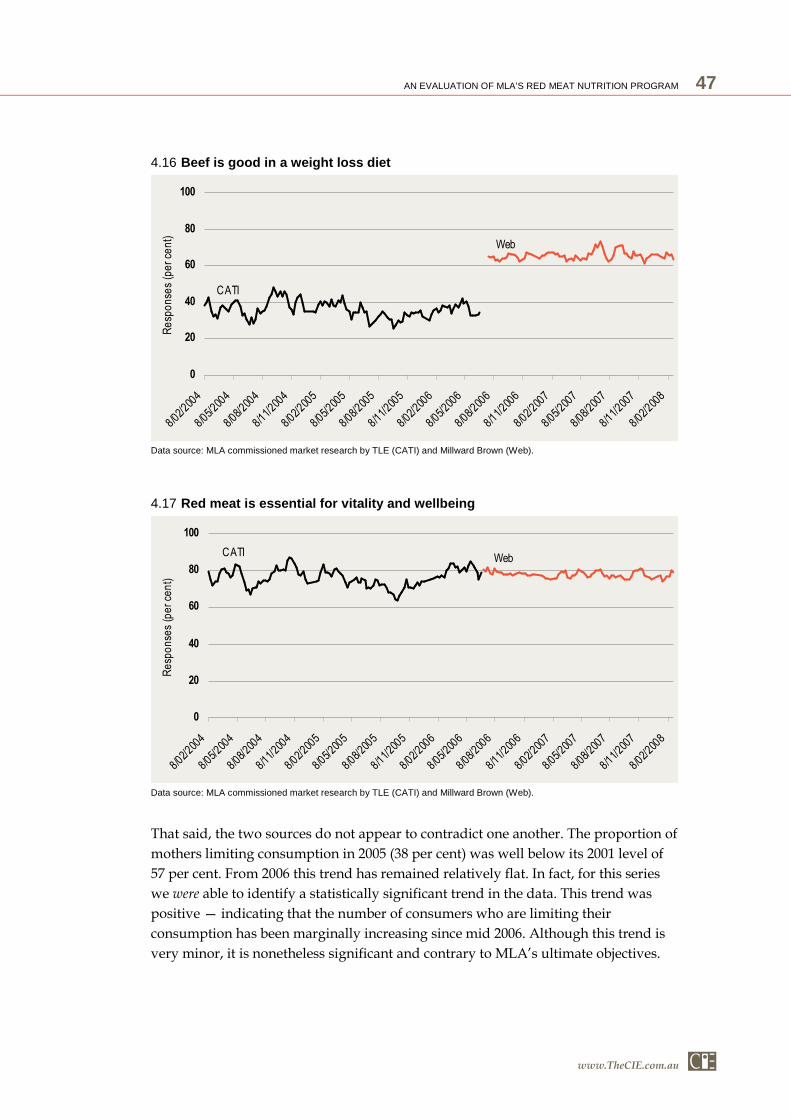
AN EVALUATION OF MLA’S RED MEAT NUTRITION PROGRAM 47
www.TheCIE.com.au
That said, the two sources do not appear to contradict one another. The proportion of
mothers limiting consumption in 2005 (38 per cent) was well below its 2001 level of
57 per cent. From 2006 this trend has remained relatively flat. In fact, for this series
we were able to identify a statistically significant trend in the data. This trend was
positive — indicating that the number of consumers who are limiting their
consumption has been marginally increasing since mid 2006. Although this trend is
very minor, it is nonetheless significant and contrary to MLA’s ultimate objectives.
4.16 Beef is good in a weight loss diet
0
20
40
60
80
100
8/02/2004
8/05/2004
8/08/2004
8/11/2004
8/02/2005
8/05/2005
8/08/2005
8/11/2005
8/02/2006
8/05/2006
8/08/2006
8/11/2006
8/02/2007
8/05/2007
8/08/2007
8/11/2007
8/02/2008
Response
s (per ce
nt) .
CATI
Web
Data source: MLA commissioned market research by TLE (CATI) and Millward Brown (Web).
4.17 Red meat is essential for vitality and wellbeing
0
20
40
60
80
100
8/02/2004
8/05/2004
8/08/2004
8/11/2004
8/02/2005
8/05/2005
8/08/2005
8/11/2005
8/02/2006
8/05/2006
8/08/2006
8/11/2006
8/02/2007
8/05/2007
8/08/2007
8/11/2007
8/02/2008
Resp
onse
s (per ce
nt) .
CATIWeb
Data source: MLA commissioned market research by TLE (CATI) and Millward Brown (Web).

48 AN EVALUATION OF MLA’S RED MEAT NUTRITION PROGRAM
www.TheCIE.com.au
4.18 A diet including red meat is more important for my health than I previously believed
0
20
40
60
80
100
8/02/2004
8/04/2004
8/06/2004
8/08/2004
8/10/2004
8/12/2004
8/02/2005
8/04/2005
8/06/2005
8/08/2005
8/10/2005
8/12/2005
8/02/2006
8/04/2006
Resp
onse
s (per ce
nt) .
CATI
Web
Data source: MLA commissioned market research by TLE (CATI) and Millward Brown (Web).
4.19 Red meat is essential for a healthy mind
0%
20%
40%
60%
80%
100%
9/10/2005
9/12/2005
9/02/2006
9/04/2006
9/06/2006
9/08/2006
9/10/2006
9/12/2006
9/02/2007
9/04/2007
9/06/2007
9/08/2007
9/10/2007
9/12/2007
9/02/2008
Resp
onse
s (per ce
nt) .
CATI
Web
Data source: MLA commissioned market research by TLE (CATI) and Millward Brown (Web).
On balance, there is little evidence that overall consumer perceptions about the
nutritional qualities of red meat improved over the 2004–2008 period with the
exception of consumers who actively limit their consumption. This is perhaps not
unexpected, as outlined in the previous section MLA’s marketing activities (intensity
and frequency) changed in late 2006. Our results here might just reflect that over this
sample of data, MLA’s activities have primarily supported high scoring attitudes.

AN EVALUATION OF MLA’S RED MEAT NUTRITION PROGRAM 49
www.TheCIE.com.au
4.20 Limit consumption to avoid possible health problem s
0
20
40
60
80
100
1/06/2001
1/12/2001
1/06/2002
1/12/2002
1/06/2003
1/12/2003
1/06/2004
1/12/2004
1/06/2005
1/12/2005
1/06/2006
1/12/2006
1/06/2007
1/12/2007
Response
s (per ce
nt) .
Dairy farmers' survey MLA consumer tracking
Data source: MLA.
Additionally, it is important to recognise that we have an incomplete sample of
consumer tracking data. Data on the first two years of the campaign is missing from
this analysis – and this may indeed have been where MLA was able to make the most
inroads with their target audience. An analysis conducted by The Leading Edge
(TLE) in 2002 did suggest just that. TLE tested for changes in consumer attitudes
towards red meat between ‘waves’ preceding and subsequent to the campaign. For
indicators such as a consumer’s disposition to red meat, and in several of the KPIs,
TLE were able to show a statistically significant increase from the ‘pre wave’ to the
‘post wave.’
Unfortunately however, this data is not collected over a time frame sufficient enough
to gauge the longer run impact of the campaign (the TLE analysis providing just four
data points over a 5 month period). It is unclear from this analysis how much of the
positive increase in consumer attitudes represents a structural shift in consumer
preferences, and how much is attributable to ‘noise’ external to the campaign.
In any case, the conclusions above still remain relevant for the period 2004-2008.
Imagery
The second key message of the campaign sought to position red meat as a source of
vitality and well being and to capture the joy of living (MLA 2007a).
We are fortunate to have as a reference point attitudinal data collected by MLA
through face to face interviews over 1999–2001. This data was collected to measure
the direct impact of a particular television campaign aired in late 1999. Chart 4.21
shows the proportion of consumers with a ‘somewhat positive’ or ‘very positive’
feeling about red meat. The survey was conducted prior to the commercials being
aired, during the airing period, and at four intervals afterwards. Although there

50 AN EVALUATION OF MLA’S RED MEAT NUTRITION PROGRAM
www.TheCIE.com.au
appears to be some decay in attitudes towards lamb in this initial period, both lamb
and beef still remain well regarded by consumers.
Consistently positive attitudes remain over the 2004–2008 period for which we have
data as well (chart 4.22). Attitudes have shown no evidence of growth (or decline)
over the 2004–2008 period (after accounting for the structural break in the data).
Similar to the data in chart 4.12, the data began at such a high level that growth in
this indicator might not be expected.
4.22 Positive feelings towards red meat, 2004–08
0
20
40
60
80
100
18/01/2004
18/04/2004
18/07/2004
18/10/2004
18/01/2005
18/04/2005
18/07/2005
18/10/2005
18/01/2006
18/04/2006
18/07/2006
18/10/2006
18/01/2007
18/04/2007
18/07/2007
18/10/2007
18/01/2008
Response
s (per ce
nt) .
CATIWeb
Data source: MLA commissioned market research by TLE (CATI) and Millward Brown (Web).
4.21 Positive disposition towards red meat 1999–2001
0
10
20
30
40
50
60
70
80
90
100
Pre
(Sep 1999)
Post
(Dec 1999)
Wave 1
(Sep 2000)
Wave 2
(Dec 2000)
Wave 3
(Feb 2001)
Wave 4
(May 2001)
Resp
onses (per ce
nt) .
Lamb
Beef
Data source: MLA commissioned market research by TLE (CATI) and Millward Brown (Web).
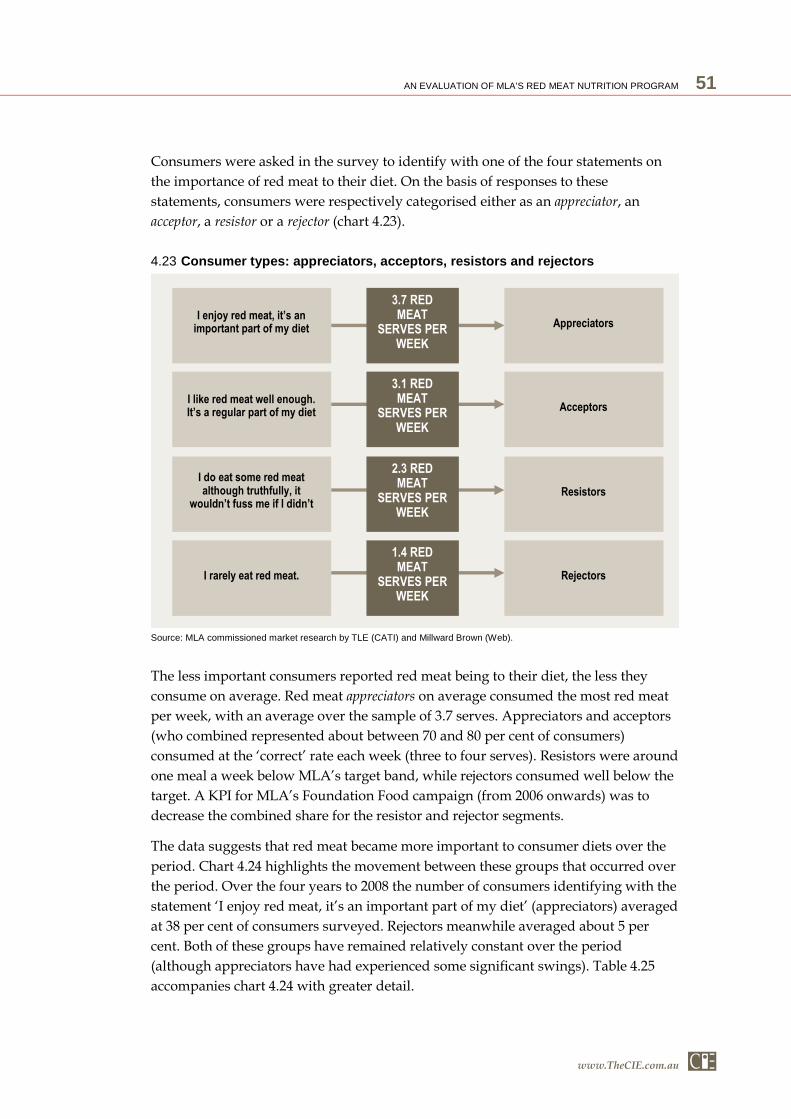
AN EVALUATION OF MLA’S RED MEAT NUTRITION PROGRAM 51
www.TheCIE.com.au
Consumers were asked in the survey to identify with one of the four statements on
the importance of red meat to their diet. On the basis of responses to these
statements, consumers were respectively categorised either as an appreciator, an
acceptor, a resistor or a rejector (chart 4.23).
4.23 Consumer types: appreciators, acceptors, resistors and rejectors
I enjoy red meat, it’s an important part of my diet
I like red meat well enough. It’s a regular part of my diet
I do eat some red meat although truthfully, it
wouldn’t fuss me if I didn’t
I rarely eat red meat.
Appreciators
Acceptors
Resistors
Rejectors
3.7 RED MEAT
SERVES PER WEEK
3.1 RED MEAT
SERVES PER WEEK
2.3 RED MEAT
SERVES PER WEEK
1.4 RED MEAT
SERVES PER WEEK
Source: MLA commissioned market research by TLE (CATI) and Millward Brown (Web).
The less important consumers reported red meat being to their diet, the less they
consume on average. Red meat appreciators on average consumed the most red meat
per week, with an average over the sample of 3.7 serves. Appreciators and acceptors
(who combined represented about between 70 and 80 per cent of consumers)
consumed at the ‘correct’ rate each week (three to four serves). Resistors were around
one meal a week below MLA’s target band, while rejectors consumed well below the
target. A KPI for MLA’s Foundation Food campaign (from 2006 onwards) was to
decrease the combined share for the resistor and rejector segments.
The data suggests that red meat became more important to consumer diets over the
period. Chart 4.24 highlights the movement between these groups that occurred over
the period. Over the four years to 2008 the number of consumers identifying with the
statement ‘I enjoy red meat, it’s an important part of my diet’ (appreciators) averaged
at 38 per cent of consumers surveyed. Rejectors meanwhile averaged about 5 per
cent. Both of these groups have remained relatively constant over the period
(although appreciators have had experienced some significant swings). Table 4.25
accompanies chart 4.24 with greater detail.

52 AN EVALUATION OF MLA’S RED MEAT NUTRITION PROGRAM
www.TheCIE.com.au
4.24 Consumer types over time
0%
10%
20%
30%
40%
50%
60%
70%
80%
90%
100%
Jan-
2002
Jul-
2002
Jan-
2003
Jul-
2003
Jan-
2004
Jul-
2004
Jan-
2005
Jul-
2005
Jan-
2006
Jul-
2006
Jan-
2007
Jul-
2007
Jan-
2008
Share of consu
mer types
x
Appreciators
Acceptors
Resistors
Rejectors
Face to face CATI Web
Notes: The data above is obtained using three different survey methodologies. As survey methodology can influence an individual’s response, the data in the chart above should not be viewed as a continuous series from January 2002 to February 2008. Rather, the chart reports three separate series (face to face, CATI and Web) for each consumer type (appreciator, acceptor, resistor and rejector). A greater discussion of this point is provided in box 4.7
The data does seem to suggest that across the four categories, the share of resistors
and rejectors was falling while the share of appreciators and acceptors was
increasing. However, when we tested the statistical significance of a time trend, no
series was able to report a statistically significant trend. This again implies each of
the series remained constant over the period — including the proportion of resistors
and acceptors.
Reported consumption
There are significant difficulties in measuring shifts in consumer preferences and
attitudes using the indicators based on relative value statements. Self-reported
consumption might serve as an alternative measure on shifting preferences, and
avoid the pitfalls associated with ‘judgement indicators’.
Consumer tracking surveys asked consumers how many red meat ‘meals [they had]
eaten in [their] household in the last 7 days’. This is self-reported data, which relies on
consumers remembering their past activities. Because data is not married to actual
purchases, self-reported data is often thought to have a wide margin error margin.
The samples have consistently returned a response of about three meals since
tracking began (chart 4.26) — with the exception of some high results between
October 2005 and July 2006. Most red meat consumed in the household is beef —
exceeding lamb servings by a factor of two. The web data reports a noticeably higher
quantity of lamb than did the CATI data in earlier part of the sample.

AN EVALUATION OF MLA’S RED MEAT NUTRITION PROGRAM 53
www.TheCIE.com.au
4.25 Consumer types, descriptive statistics
Detail Appreciators Acceptors Resistors Rejecters
2004
Average share 0.34 0.42 0.20 0.04
Minimum 0.31 0.38 0.16 0.02
Maximum 0.38 0.47 0.23 0.06
Reported serves 3.72 3.13 2.35 1.84
2005
Average share 0.33 0.42 0.19 0.06
Minimum 0.23 0.35 0.13 0.01
Maximum 0.41 0.50 0.25 0.09
Reported serves 4.14 3.24 2.33 1.14
2006
Average share 0.37 0.41 0.17 0.05
Minimum 0.25 0.35 0.12 0.03
Maximum 0.46 0.48 0.24 0.07
Reported serves 3.70 3.30 2.40 1.40
2007
Average share 0.45 0.35 0.15 0.05
Minimum 0.41 0.30 0.13 0.03
Maximum 0.49 0.38 0.21 0.07
Reported serves 3.49 3.00 2.23 1.38
2008
Average share 0.44 0.39 0.13 0.05
Minimum 0.43 0.37 0.12 0.04
Maximum 0.44 0.41 0.14 0.05
Reported serves 3.52 3.01 2.16 1.47
CATI
Average share 0.34 0.42 0.19 0.05
Minimum 0.23 0.35 0.13 0.01
Maximum 0.44 0.50 0.25 0.09
Reported serves 3.87 3.21 2.36 1.45
Web
Average share 0.44 0.36 0.15 0.05
Minimum 0.37 0.30 0.12 0.03
Maximum 0.49 0.43 0.21 0.07
Reported serves 3.58 3.09 2.26 1.41
Total sample
Average share 0.38 0.40 0.17 0.05
Minimum 0.23 0.30 0.12 0.01
Maximum 0.49 0.50 0.25 0.09
Reported serves 3.68 3.14 2.31 1.40
Data source: MLA commissioned market research by TLE (CATI) and Millward Brown (Web).

54 AN EVALUATION OF MLA’S RED MEAT NUTRITION PROGRAM
www.TheCIE.com.au
4.26 Average servings of red meat in the last seven day s
0
1
2
3
4
5
18/01/2004
18/04/2004
18/07/2004
18/10/2004
18/01/2005
18/04/2005
18/07/2005
18/10/2005
18/01/2006
18/04/2006
18/07/2006
18/10/2006
18/01/2007
18/04/2007
18/07/2007
18/10/2007
18/01/2008
Average weekly serves .
CATI Web
Beef
Lamb
Red meat
Data source: MLA commissioned market research by TLE (CATI) and Millward Brown (Web).
We previously outlined that there existed no evidence of red meat increasing
significantly in importance to consumer diets (chart 4.24). As well as there being little
movement between consumer groups, there was also little movement within consumer
groups — in terms of self-reported data (chart 4.27). Between 2004 and 2008 only
appreciators showed any evidence of a shift in consumption behaviour — and this
was generally downwards from an average of 4.1 serves per week in 2005 to 3.5
serves in 2008. There has been little change in the consumption patterns of the more
moderate groups — resistors and acceptors — whom have begun to consume
marginally less over the period. Both appreciators and acceptors remained within
MLA’s target consumption band over the entire period.
4.27 Consumer types and average consumption
0.0
0.5
1.0
1.5
2.0
2.5
3.0
3.5
4.0
4.5
5.0
Rejectors Resistors Acceptors Appreciators
Weekly red m
eat se
rves .
2004 2005 2006 2007 2008
Data source: MLA commissioned market research by TLE (CATI) and Millward Brown (Web).

AN EVALUATION OF MLA’S RED MEAT NUTRITION PROGRAM 55
www.TheCIE.com.au
Table 4.28 summarises how self-reported red meat servings are distributed by
consumer type for each of the tracking samples and the entire series. This table
shows the number of serves consumed by the typical consumer at quarterly
percentiles. That is, if consumers were ordered according to their red meat
consumption (from least to most), the table reports consumption of the consumer
standing at the one quarter mark, halfway, the three quarter mark and at the end of
the line. For example, an acceptor at the middle of the CATI sample would consume
1.9 serves of red meat per week. Another way to interpret this statistic would be to
say that 50 per cent of Acceptors in the CATI sample consumed less than or equal to
1.9 serves of red meat per week. The 50th percentile column can also be interpreted
as the median level of consumption for each sample.
4.28 Consumer types — distribution of servings
25th percentile 50th percentile 75th percentile 100th percentile
CATI
Rejectors 0.5 1 1.4 1.9
Resistors 0.7 1.4 2.1 2.8
Acceptors 0.9 1.9 2.8 3.7
Appreciators 1.1 2.2 3.2 4.3
Web
Rejectors 0.4 0.8 1.3 1.7
Resistors 0.6 1.2 1.9 2.5
Acceptors 0.8 1.5 2.7 3.0
Appreciators 0.9 1.8 2.7 3.6
Total sample
Rejectors 0.4 0.8 1.3 1.7
Resistors 0.7 1.3 2.0 1.7
Acceptors 0.8 1.7 2.5 3.4
Appreciators 1.0 1.9 2.9 3.8
Data source: MLA commissioned market research by TLE (CATI) and Millward Brown (Web).
Consumption of red meat is a function of many factors — not the least of which is its
price. Red meat prices over the period have risen substantially, and this would
provide a natural tempering on any increase in demand. As prices rise, consumers
may choose to simply either forgo consumption or substitute towards other similar
products.
Consumers in the red meat market appear willing to absorb the significant increase
in price — and have even increased their overall expenditure. We can see further
evidence of red meat’s resilience to rising prices using self-reported consumption for
all meats. The shares consumers self-reported meat consumption are reported in
chart 4.29. We can see that rising prices have not led consumers to substitute to
alternative meat products such as chicken, pork or fish. In fact, the shares of red
meat, chicken, fish and pork within a consumer’s diet have all held relatively

56 AN EVALUATION OF MLA’S RED MEAT NUTRITION PROGRAM
www.TheCIE.com.au
constant over the period. But based on the survey data, we also don’t know what has
happened to the price of red meat relative to competing meats. Importantly, we also
don’t know what has happened to actual consumption quantities and expenditure on
red meat. We only have information on number of serves.
It is a worthwhile exercise to divide the data set into two populations — those that
can and cannot recall viewing a red meat commercial — in an attempt to gauge the
impact of the consumer campaign.
The volume and intensity of MLA’s marketing activities has fluctuated since 2002. It
is difficult however, to judge the precise quantum of MLA outputs that this red meat
the campaign has produced. The effectiveness of a television commercial will be
determined by a range of factors including content, length, scheduling and length of
the campaign. This means that one television commercial may have more or less
impact than another. Likewise, it is difficult to quantify the effect of the interaction
and complementarity produced by supporting promotional materials.
We use consumer tracking data collected by the MLA as a proxy measure for the
extent of MLA marketing activity. Consumers were surveyed by MLA through
computer aided telephone interviews (CATI) and an online survey between January
2004 and February 2008. MLA’s activities began 2 years prior to this, and during this
period invested heavily into this campaign.
The proportion of consumers that had ‘seen, read or heard anything’ about ‘red meat
in general’ or ‘beef’ is plotted in chart 4.30. Note that in mid-2006 there was a change
in the survey methodology. This difference means that the data before June 2006 and
after June 2006 are not directly comparable. Nevertheless, we are still able to draw
some valuable insight from this series. We have indexed the data in chart 4.30 to the
4.29 Shares by meat type from market research
0%
20%
40%
60%
80%
100%
8/02/2004
8/05/2004
8/08/2004
8/11/2004
8/02/2005
8/05/2005
8/08/2005
8/11/2005
8/02/2006
8/05/2006
8/08/2006
8/11/2006
8/02/2007
8/05/2007
8/08/2007
8/11/2007
8/02/2008
Market sh
are .
Red meat
Chicken
Fish
Pork
Data source: MLA commissioned market research by TLE (CATI) and Millward Brown (Web).

AN EVALUATION OF MLA’S RED MEAT NUTRITION PROGRAM 57
www.TheCIE.com.au
mean scores of each sample. When the series is greater than 100, consumer recall is
above the series mean and below if otherwise.
The data in chart 4.30 largely mirrors the intensity of MLA marketing activities. We
can see that there is a period of decay from initial recall levels (not shown) until mid
2005. From mid to late 2005 MLA increased their activities with the launch of the
Foundation Food campaign — and this led to a sharp rise in consumer recall. After
MLA changed the intensity and scope of its activities in 2006, consumer recall began
to slow before maintaining itself throughout most of 2007 and into 2008.
Chart 4.31 shows the difference between the weekly serves of consumers who could
recall that a red meat commercial and those who could not. Unlike the attitudinal
data, the difference between the populations did not decline over time. On average
those who could recall an advertisement would eat some 0.3 serves more a week
than those who could not recall an advertisement.
However, it is important to note that some, if not most, of this difference could
simply be a product of recall bias among those with a stronger preference for red
meat. Moreover, while 0.3 serves is a substantial impact proportionally (about 10 per
cent), it was not uncommon for weekly consumption to increase or decrease by twice
this amount on a weekly basis. More than three quarters of the observations in the
CATI sample lay within 10 per cent of the sample average.
4.30 Consumer recall
0
50
100
150
200
250
18/01/2004
18/04/2004
18/07/2004
18/10/2004
18/01/2005
18/04/2005
18/07/2005
18/10/2005
18/01/2006
18/04/2006
18/07/2006
18/10/2006
18/01/2007
18/04/2007
18/07/2007
18/10/2007
18/01/2008
Index .
Red meat
Beef
Data source: MLA commissioned market research by TLE (CATI) and Millward Brown (Web).

58 AN EVALUATION OF MLA’S RED MEAT NUTRITION PROGRAM
www.TheCIE.com.au
4.31 Difference in consumption between consumers who co uld and could not recall red meat advertising
0.00
0.05
0.10
0.15
0.20
0.25
0.30
0.35
0.40
0.45
2004 2005 2006 2007 2008
Difference
in number of se
rves
.
Data source: MLA commissioned market research by TLE (CATI) and Millward Brown (Web).
Assessing the impact of MLA advertising
So far it has been difficult to identify any shift in consumer preferences in the
aggregated data. This may be the product of a number of factors — including
consumer exposure to MLA activities. To control for this we divided our population
into those who could recall seeing an advertisement, and those that could not.
Approximately 30 per cent of consumers could recall recently having ‘seen, heard or
read anything’ about red meat in the CATI sample and 50 per cent on line.
Caution must be used when making inferences about differences between
populations. Those for whom red meat plays a large role in their diet are more likely
to:
� respond positively to key attitudinal indicators
� recall advertisements and/or media stories about red meat.
Consequently, we can expect a high degree of correlation between advertising recall
and positive attitudes from the outset.
Chart 4.32 shows the differences between those who could recall viewing a
commercial and those that could not for some key indicators. This chart reports the
marginal difference between the two populations. For example, in 2004 the number
of consumers who correctly identified the ‘three to four serves per week’ message
was some 8 percentage points higher among those that could recall the
advertisement.

AN EVALUATION OF MLA’S RED MEAT NUTRITION PROGRAM 59
www.TheCIE.com.au
We can draw two key conclusions from this data:
� those who can recall red meat in the media consistently report a more favourable
message than those who cannot; and
� over time the observed difference between the two populations has largely
declined.
That is, MLA’s advertising has had a positive impact on consumers, but this impact
has diminished over the period. We note that MLA marketing activities had reduced
substantially from their peak during the period 2002–2004.
4.32 Marginal impact of consumer recall
Correct: 3-4 serves
0
1
2
3
4
5
6
7
8
9
10
2004 2005 2006 2007 2008
Impa
ct of co
nsum
er recall (pe
r ce
nt) .
Positive about red meat
0
1
2
3
4
5
6
7
8
9
10
2004 2005 2006 2007 2008Im
pact of co
nsum
er recall (pe
r ce
nt) .
Red meat is healthy
-2
-1
0
1
2
3
4
5
6
7
8
9
10
2004 2005 2006 2007 2008
Impa
ct of co
nsum
er recall (per cent) .
Appreciators and acceptors
0
1
2
3
4
5
6
7
8
9
10
2004 2005 2006 2007 2008
Impact of cons
umer rec
all (per cent) .
Note: The charts above report the difference between the proportions of consumers who ‘could’ and ‘could not ‘recall red meat recently featuring in media. The results are calculated by subtracting the proportion of consumers who ‘could not’ recall the advertisement and fell into the above categories (ie they a) could correctly identify the three to four serves message; b) thought positively about red meat; c) thought red meat was healthy; or d) were classified as either an Appreciator or as an Acceptor) from those consumers fell into the above categories that ‘could’ recall.
Data source: MLA commissioned market research by TLE (CATI) and Millward Brown (Web).

60 AN EVALUATION OF MLA’S RED MEAT NUTRITION PROGRAM
www.TheCIE.com.au
The ‘zero trend’ in most of the indicators above may in fact be evidence of the
campaign being highly influential, as the baseline remains unclear. In the absence of
the nutrition campaign, it could have been the case that attitudes may have declined
— and what we have witnessed is the success of the campaign in maintaining
consumer red meat’s status over the period.
In addition, a major drawback of the consumer tracking survey is that the values of
data collected are discrete — not continuous. For example, a consumer may respond
that that he or she feels ‘positive’ or ‘very positive’ to a question, but the survey’s five
categories place a natural cap on how much insight can really be ascertained. What
we would like to know is: exactly how positive is the respondent, but instead we have
little else than a set of binary indicators.
Nonetheless, binary indicators can still provide useful information about
relationships between two variables. Using a probit estimation model we can establish
the probability of an event occurring (such as a consumer having a positive feeling
about red meat) given that the consumer exhibits some characteristic (such as being
able to recall red meat advertising).
We conducted probit estimations to test for a relationship between advertising recall
and consumer responses:
� The probability that a consumer feels ‘somewhat positive’ or ‘very positive’ about
red meat, given that a consumer is or is not able to recall recently seeing an
advertisement about ‘red meat in general’;
� The probability that a consumer regards red meat either ‘somewhat healthy’ or
‘very healthy’, given that a consumer is or is not able to recall recently seeing an
advertisement about ‘red meat in general’; and
� The probability that a consumer is able to correctly identify three to four serves of
red meat per week as a healthy target, given that a consumer is or is not able to
recall recently seeing an advertisement about ‘red meat in general’.
Our probit estimations used the consumer tracking data for the period January 2004
to June 2006. This data set was the most consistent and tangible for our purposes.
Also, the 6 500 observations provided enough data points to identify a relationship
while avoiding the (structural break) problems of the change in survey technique.
The impact of the advertising campaign will be evident if probit estimations are able
to identify statistically significant relationships between viewing advertisements and
the likelihood of a positive response.
Although there were generally no observable trends in the data, the probit
estimations revealed that advertising does appear to have a positive effect on
preferences. Statistically significant relationships were found in all three estimations.
A consumer who could recall viewing a red meat advertisement has a higher
probability of feeling positive about red meat; regarding red met as healthy; and
identifying three to four serves as a target for a nutritious diet.

AN EVALUATION OF MLA’S RED MEAT NUTRITION PROGRAM 61
www.TheCIE.com.au
Chart 4.33 shows the increase in the likelihood of responding positively to these three
indicators for those consumers who can and cannot recall the advertisement. For
example the probability that consumer has ‘positive’ feelings towards red meat is
21 per cent higher if that consumer can recall seeing an advertisement. However,
again, caution should be used when interpreting these results as recall bias is likely
to be a major factor that we are unable to account for.
4.33 Impact of red meat advertising on consumer respon ses: increase in probability of observing consumer response
0
5
10
15
20
25
Red meat is healthy Positive feeling about red meat Should have 3-4 serves
Impact of advertising on
consu
mer resp
onse
s (per ce
nt)
.
Note: This chart reports the estimated coefficients on the three Probit estimations we conducted. The Probit estimations too the form: Pr(y=1)=f(consumer recall); where y can be substituted for each of the indicators above, and is equal to 1 if a consumer identified with the statement.
Data source: MLA commissioned market research by TLE (CATI) and Millward Brown (Web).
62 AN EVALUATION OF MLA’S RED MEAT NUTRITION PROGRAM
www.TheCIE.com.au
5 Identifying and evaluating impacts
This chapter focuses on assessing the impacts of the nutrition program by attempting
to draw the link between changes in consumer and industry behaviour and desired
program outcomes such as increased purchases, profitability or reduced health risks.
Role of promotion
Promotion forms a core part of most company and industry activities. Box 5.1
provides a brief description of two broad approaches to advertising. Advertising acts
as an ‘insurance policy’ helping to moderate exposure to risk. The importance of
promotional activities varies largely in response to the nature, scope and scale of the
potential risks.
The risks for food industries cover a broad spectrum from simply maintaining
product awareness (by reminding people about what they already know) to
providing timely and credible information in response to adverse changes in
perceptions by consumer in the market place. As we have noted in this report, these
threats come from a number of sources and require a portfolio approach.
Most of the evidence from the literature suggests that advertising does have a
positive pay off. However, the magnitude of this pay off is difficult to estimate.
Despite an abundant number of studies, evaluating the return on advertising
investment tends to be more qualitative than quantitative and context specific.
Evaluating the benefits of generic promotion
Generic advertising refers to promotion of generic or homogeneous products typified
by many agricultural commodities. Product differentiation and private branding is
very difficult because these commodities are:
� produced by a large number of relatively small enterprises; and
� often transported and distributed in bulk through centralised facilities (for
example, bulk handling and export of grains).
This type of advertising is associated with industry-wide initiatives funded through
levies. Industry bodies engage in generic advertising for a number of reasons. They

AN EVALUATION OF MLA’S RED MEAT NUTRITION PROGRAM 63
www.TheCIE.com.au
5.1 Two types of advertising
There are two types of advertising: informational, also known as constructive
advertising and image, which also called defensive advertising. The first delivers
additional information to buyers about product attributes, advantages and prices.
Once consumers have more information to make decisions they respond more to
price differences. Some literature suggests that is most frequently adopted by low-
cost and high-quality product industries which are already competitive and
appreciated by buyers. Image advertising is for products and services that are
already known by the consumer and focuses on building or maintaining brand
loyalty. Alternatively, when consumers become loyal to a brand or product price
becomes less important. It is often associated with industries facing an
unfavourable image in the market.
Both types of advertising should increase demanded quantities but the impact on
prices could be different. Informative advertising may lead to lower prices,
through providing more choice and greater competition but persuasive should
result in at least in the maintenance of the pricing structure. However, if the price
of the product is set by the international market, only insignificant changes in
domestic market prices would result whatever the type of promotion used.
Comparison of informational and image advertising
Informational Image
Purpose � Provides information to consumers about product attributes and advantages.
� Vehicle for dealing with threats or adverse perceptions of consumers
� Builds brand loyalty through positive images by association with wellbeing, pleasant experiences or attractive people.
Effects on customer’s response to prices.
� Increases responsiveness to differences in attributes, including price, between products.
� Reduces price responsiveness after loyalty to a brand has been established.
Effect on the price of the product
� May lower prices due to greater competition between products within an industry especially in the presence of economies of scale.
� Maintains prices higher than otherwise the case due to loyalty and consumer preferences.
Impact on entry to industry
� Facilitates entry of other firms to the industry.
� Consumers are better able to compare and choose new products based on the information available.
� Discourages entry of other firms as consumers have less incentive to try new products due to their loyalty to the advertised product.
Effect on market � More competitive; price and quality of products is well known by buyers and competitors.
� Forces firms to compete based on high-quality, low-cost products.
� Can lead to more concentrated market structures due to scale economies in advertising campaigns.
Source: The CIE based on The Economics of Advertising. Bagwell, K. 2001.

64 AN EVALUATION OF MLA’S RED MEAT NUTRITION PROGRAM
www.TheCIE.com.au
can provide economies of scale, aggregating resources across a large number of small
levy payers. It allows them to pool funds that enable more ambitious promotion
programs that individual farms would not be able to launch by themselves. Generic
advertising (if effective) benefits all members of an industry. Funding such activities
through a levy overcomes the ‘public’ good aspect of generic funding, thereby
avoiding the free rider problem.
The evidence quantifying the payback to generic advertising is limited to a small
number of examples (see box 5.2). In these studies, the short term effects can typically
be observed with reasonable confidence. However, generic marketing often serves
also as a long term investment strategy where the payoffs are significantly more
difficult to quantify.
5.2 Positive returns from generic promotion
Several studies about agricultural and manufacturing generic product advertising
have been done over the past decade. An evaluation made by Varian (2006)
estimates that additional $3-$6 is gained per each dollar invested on advertising
agricultural products in the United States.
Freebairn et al (2005), using data for a number of agricultural products in
Australia, found that generic campaigns can be profitable for producers. This
gain, however, is modest, especially in cases where the internationally traded
product differs from the domestic product, the net effect of advertising was
positive but not major.
An older study by Ball and Dewbre (1989) also conclude modest, but positive
returns, from generic advertising. They found that an additional 1 per cent
increase in promotion expenditure yielded an 0.04 per cent increase in beef
demand and a 0.03 per cent increase in pork demand. The study also noted that
increasing the demand for one product (due to advertising) resulted in a decline
in demand for the other. This finding suggests that determining an appropriate
level of investment in promotion requires careful consideration of activities by
competing products.
Ward (2004) estimates the return to producers from the US Beef Check-off
Program which undertook generic advertising funded through a levy. The study
uses an extensive amount of detailed data (capturing at the household level
servings and purchase price and industry beef sales). Ward estimates that a dollar
spent on generic promotion generated a return for producers of around $5.60.
Most case studies of successful generic advertising demonstrate a positive
relationship between marketing expenses and sales can be (that is, correlation).
Methodologically, there are doubts about the specification of the econometric models

AN EVALUATION OF MLA’S RED MEAT NUTRITION PROGRAM 65
www.TheCIE.com.au
used in these studies and their estimation procedures - as highlighted by Freebairn et
al (2005). In addition, these studies also took a wider perspective of what constituted
promotional activities than this evaluation.
The limitations of the evidence highlighted in these studies are similar to this
evaluation. Available data is often inadequate and too costly to collect. A robust
analysis requires continuous data that explicitly captures consumer behaviour
changes, as well as explain possible confounding factors (for example, changes in
relative prices, consumer income, preferences and other elements involved). The
study by Ward (2004) is ‘best practice’ because of access to detailed time-series data
on consumer attitudes, number of serves and importantly sales. Relatively large
promotion budgets and assistance in data collection from the USDA have
contributed to the construction and maintenance of the database.
The baseline
In terms of the nutrition program, while we can observe trends in key indicators over
time, the precise effect the campaign has had can be measured only against what we
would have observed in the absence of the program (the baseline). Throughout the
2004 to 2008 period red meat has maintained a relatively strong public image. Most
indicators showed no statistically significant change between 2004 and 2008.
Understanding the risks that an industry faces can play an important role in
constructing a baseline. Consider the following possible scenarios, for what could
have been observed in the absence of MLA’s campaign:
� Scenario 1: We may have observed general attitudes towards red meat near
identical to what we observed in the face of the campaign.
� Scenario 2: We may have observed a marginal decline in key indicators of
attitudes about red meat.
� Scenario 3: We may have observed a significant decline in key indicators of
attitudes about red meat.
These three scenarios are illustrated in chart 5.3. The chart depicts observations about
a hypothetical KPI and the alternative scenarios described above. This chart
illustrates that maintaining attitudes — as opposed to improving them — can indeed
be evidence of the campaign’s success, depending on the alternative case.
One of the constraints identified in chapter 4 is that the supporting dataset behind
the program KPIs does not currently have the structure or a sufficient time-series to
establish that baseline with any certainty.
Without this data, making a hypothesis about the ‘without’ case is a difficult task.
Sometimes we can extract the baseline using data collected from a control population
that is unexposed to a given ‘shock’. More specifically, MLA’s consumer tracking
data has no control population for which we can establish a credible alternative.

66 AN EVALUATION OF MLA’S RED MEAT NUTRITION PROGRAM
www.TheCIE.com.au
Instead we can look at the environment in which the campaign was run. A number of
negative ‘shocks’ were imposed onto the market for red meat, most notably:
� the outbreak of Bovine Spongiform Encephalopathy (BSE) in the UK in early 2001;
� growing concerns about obesity;
� animal welfare and environmental issues; and
� the release of a global diet, lifestyle and cancer report with a strong cautionary
message to limit red meat intake to prevent cancer.
A proportion of MLA’s expenditure on this nutrition campaign was allocated to
issues (or risk) management along these lines. In the absence of the campaign, clearly
these ‘issues’ would have been left unchecked — potentially harming red meat’s
public image.
In addition, red meat faces significant competition for market share from other meats
(such as pork and chicken) and other food sources. In the absence of MLA spending
on marketing, it is likely that these meats would continue to spend on advertising.
Depending on the effectiveness of this advertising, it is possible that this could result
in a decreased market share for red meat.
To some extent, the aggressiveness of the marketing practices of red meat’s
competitor may indeed be a function of red meat’s own expenditure. That is, the
nutrition campaign may have induced advertising competitors to undertake
campaigns of their own. This phenomenon is not uncommon, however given the
degree of competition in the market for food however, we do not expect that the
MLA’s campaign alone to have had a significant inducement effect across food
marketing. However, it is possible that the size of the red meat industry could have
induced marketing amongst its direct competitors, in particular pork and chicken.
5.3 Potential baselines
50
60
70
80
90
100
110
120
130
140
150
2000 2001 2002 2003 2004 2005 2006 2007 2008
Observed Scenario 1 Scenario 2 Scenario 3
Data source: CIE.

AN EVALUATION OF MLA’S RED MEAT NUTRITION PROGRAM 67
www.TheCIE.com.au
Not all shocks to this market have been negative. MLA recognises two significant
events which had the potential to favourably influence the market — independent of
MLA nutrition activities. These include:
� the release of Dr Atkins’ New Diet Revolution (2002) which promoted a high protein
diet; and
� the release of the CSIRO’s Total Wellbeing Diet (2005) which provided evidenced
based dietary recommendations, including three to four serves of red meat per
week.
Market testing commissioned by MLA has indicated that both of these events had
little impact on overall red meat attitudes. Market analysis on the ‘Atkins diet’
indicated that consumers focused more on reducing the carbohydrate intake than
increasing their daily protein intake.
Unfortunately, the MLA tracking data does not allow us to effectively measure and
define the baseline for its key measures. The fundamental problem is that there is no
mechanism for isolating the effects of the program on attitudinal measures in the
tracking data that is available. What would be needed is a way of effectively
establishing a ‘baseline’ ( baseline) for consumer attitudes that measures (over time)
consumer attitudes for those exposed to a program/campaign and those not
exposed.
Impacts
There are two broad areas where we would expect to see impacts resulting from
MLA’s nutrition program:
� growth in consumer demand for red meat
� public health benefits due to increased consumption of red meat.
The previous chapter found that in general, the key attitudinal and behavioural
measures tracked by MLA in relation to the nutrition program have been largely flat.
This includes the self-reported data on the number of red meat serves. As the
previous section outlined, it is still possible that the nutrition program had an impact,
but we don’t know anything about the baseline — what would have happened
without the program.
Aside from not knowing the baseline, the other major issue in terms of measuring the
impact on demand is the lack of tracking data relating to key consumption measures
— particularly consumption quantities and expenditure on red meat. As noted, the
tracking data collects self-reported data on the number of red meat serves; however
this is not sufficient to draw any conclusions on demand for red meat.
Despite these issues, it is clear that demand for red meat has increased over the
period the nutrition program has been running. During the six years (2002 to

68 AN EVALUATION OF MLA’S RED MEAT NUTRITION PROGRAM
www.TheCIE.com.au
present) over which MLA has run its campaign, demand for red meat has been
increasing. MLA’s demand index estimates that both lamb and beef demand have
increased by 21.5 per cent over this period. MLA estimates of domestic consumer
expenditure on red meat have increased from $6.4 billion in 2001-02 to $8.6 billion in
2006-07 — an increase of $2.2 billion or around 33 per cent.
At this point however, there is not sufficient evidence to confidently attribute this to
the nutrition program. A range of other factors, including product innovation and
improvements in eating quality, also occurred during this period. It is likely that the
nutrition campaign was a contributor to observed demand improvements, but it is
not possible to estimate the size of the impact. The most significant constraint in
identifying the contribution of the nutrition campaign is to recognise the fact that
maintenance of domestic red meat consumption is the result of a range of concerted
activities. These include the contribution of other MLA programs (all the subject of
separate evaluations) including:
� eating quality
� food safety
� domestic lamb promotion
� red meat innovation.
In addition, there have been a range of developments within industry that have
contributed to the improved performance of the red meat sector:
� increased product consistency from lot feeding and lamb producers
� restructuring within the beef and lamb marketing chain and product innovation
� improved performance of speciality retail (butchers).
Separating out the relative contribution would prove very difficult, but it is clear that
the nutrition program cannot claim the entire benefit.
Evaluating public health benefits
The program’s logic identifies a range of positive outcomes and impact beyond
changes in consumption. Given the campaign’s focus on nutrition, among these
desired outcomes is improved public health. This outcome represents an important
spillover benefit that would flow outside of the red meat industry. Quantification of
this benefit is very important given that the government and taxpayers are also
stakeholders in the Nutrition program.
The MLA health research considered the interaction between consumption of red
meat and the risk of a number of health effects. Some of the health effects are quite
serious, such as bowel cancer, heart disease and obesity. Reducing the risk or
prevalence of these effects (mortality as well as significant morbidity) can generate
substantial benefits. These benefits arise from a range of sources including avoided

AN EVALUATION OF MLA’S RED MEAT NUTRITION PROGRAM 69
www.TheCIE.com.au
treatment costs, improved quality of life, minimisation of adverse impacts on carers
and family and avoided work loss days. 3 Benefits from more minor conditions, such
as acne, can also be measured using avoided treatment or expenditure based
measures.
Conceptually, mapping the link between nutritional awareness and public health
benefits is relatively straightforward. However, measuring the linkages and impact is
not. Measuring public health benefits requires:
� observing changes in the prevalence of specific health effect;
� discerning the extent to which observed changes are due to red meat consumption
relative to a significant range of other confounding factors;
� extrapolating observed changes to the general population; and
� applying monetary estimates to the specific health improvements.
Chart 5.4 illustrates how public health benefits could arise from MLA’s activities. It
highlights the complexity of linking investment in red meat nutritional research to
actual changes in public health. The chart also indicates that before public health
attributes can be attributed to the nutrition campaign, changes in behaviour need to
be observed. In other words, evidence of changes in red meat consumption patterns
is essential. Moreover, the changes in consumption patterns need to be observed for
relevant target populations over relevant time horizons.
Given there isn’t evidence of increased red meat consumption directly attributable to
the nutrition program, it is difficult to draw any conclusions about public health
benefits. Although it is not possible to evaluate the direct public health benefits of the
program, it is clear that it has contributed to increased knowledge through its
approach to commissioning evidence based research. A highly publicised example of
this is the CSIRO Total Wellbeing Diet. CSIRO claim that an estimated 547 200
Australians have lost weight following its recommendations as reported by MLA
(2007c). Assuming the weight loss has been sustained, it should contribute to
improvements related to a range of health conditions, including diabetes
management and lower blood pressure (which in turn reduces the risk of heart
disease). A share of these public health benefits could be attributed to MLA’s
investment based on MLA’s contribution relative to the full suite of the TWD’s R&D.
Unfortunately there is not sufficient evidence to estimate the magnitude of these
benefits.
3 Alternatively, changes in mortality risk can be valued using willingness to pay estimates typically referred to the value of a statistical life (VSL or VOSL).

70 AN EVALUATION OF MLA’S RED MEAT NUTRITION PROGRAM
www.TheCIE.com.au
5.4 Linking investment to public health outcomes
Inputs • Research into the causal links between red meat consumption and health effects
• Cancer
• Diabetes
• Heart disease
• Obesity
• Weight control
• Acne
Outputs • Awareness raising and information dissemination
• Jounal publications
• Conference presentations
• Promotional/informational materials for:
– healthcare professionals
– general public
• Diet/nutrition publications
Outcomes • Changes in healthcare professional’s advice
• Changes in household awareness and attitudes
• Increased advice of red meat for managing health effects
• Changes in consumption patterns
• Purchase of diet/nutrition books
Impacts • Change in the prevalence of adverse health effects
Fewer cases of:
• Cancer
• Diabetes
• Heart disease
• Obesity
• Acne
Source: CIE.
Breakeven analysis using the integrated framework
A key conclusion of this evaluation was that the benefits from MLA’s nutrition
program are very difficult to quantify in dollar terms. Therefore, it is also difficult to
estimate the payoffs to levy payers from funding the program.
The key linkage that cannot be quantified is between program outputs, current KPIs
and the impact on total sales of red meat. To calculate benefits from the program,
consumption or sales of red meat should be higher than would have otherwise been

AN EVALUATION OF MLA’S RED MEAT NUTRITION PROGRAM 71
www.TheCIE.com.au
the case. This higher level of consumption relative to the base could then be
translated back into changes in producer’s incomes. This increase in income would
be then compared to the program costs to calculate the net benefits to producers.
Another perspective would be to ask the question: what would be the increase in
domestic demand required to pay for the nutrition program by levy payers? This can
be answered by this using the MLA’s integrated framework. Features and
capabilities of this framework are summarised in box 5.5. In order to undertake this
analysis we need a set of assumptions, which are outlined below.
Key assumptions of the break-even analysis
The question is asked: what increase in per person consumption is required to cover
the cost of the nutrition program? A number of assumptions are required to
undertake the breakeven analysis concerning:
� which program expenditures should be included;
� what is the increase in consumer demand required - in terms of products and over
what period; and
� how the payoffs are measured.
For this analysis, expenditures used amounts to $40.3 million in nominal terms from
2001-02 to 2006-07 — see table 5.6, which includes:
� those on health professionals communications, nutrition research, consumer
campaign and issues management and government affairs; and
� only levy-payer funded expenditure (excluding matching funds by the Australian
Government).
In terms of the increase in demand required, the analysis assumes that the payoffs
from the nutrition program result from an equal increase in the demand for both beef
and lamb consumption:
� as measured by percentage change in per person consumption from observed
market outcomes; and
� this demand shift occurs across all segments that constitute domestic
disappearance of red meat including retail, food service and use by
manufacturing.
The change in demand is treated as one-off and lasts six years, from 2001 to 2007
only. This approach makes an implicit assumption regarding the lifespan of program
benefits. However, there is a significant amount of uncertainty around the decay rate
of the nutrition program:
72 AN EVALUATION OF MLA’S RED MEAT NUTRITION PROGRAM
www.TheCIE.com.au
5.5 Key features of the integrated framework
The GMI model provides a global representation of production, consumption, trade
and prices at the bilateral level for meat (beef, sheepmeat, pigmeat and poultry) and
live animals (cattle and sheep). It measures payoffs to Australian beef and
sheepmeat producers in terms of changes in prices, production and gross value of
production at an aggregate industry level. But the GMI model is purely a meat
industry model and as such, it does not measure effects on other industries or the
economy as a whole.
The integrated framework (IF) is a model of the Australian economy. It captures
interactions between the red meat value chain and other sectors of the economy.
These interactions include purchased input use at the farm level and value adding
factors such as capital and labour. In terms of red meat sector coverage, the IF
includes farm production, feedlots, processing, wholesaling, retailing, domestic
consumption and exports. The IF measures the effect of changes on each industry
(in terms of output, prices, net income etc.) and the economy as a whole (in terms of
GDP, employment, consumption, trade balance etc.). The linked GMI/IF system
then links the outcomes in specific global markets with details at the domestic
industry level and broader economy.
This is a similar approach to the break-even analysis proposed for generic
advertising campaigns proposed by Freebairn et al (2005). They propose a reduced-
form equation for the minimum or break-even response from advertising. The
increase in domestic sales due to advertising is function of:
� share of domestic and export sales;
� domestic and export own-price elasticity of demand; and
� the levy as a share of the domestic retail price.
The GMI/IF captures the essence of this reduced-form approach and enhances it
with significant detail on:
� the composition of exports markets for each type of meat (GMI model); and
� interactions in the domestic market through consumption of each meat type and
the supply response along the meat marketing chain (IF).
The representation of the different markets for Australian red meat - the
domestic and individual markets – and how they are connected is at the core of
the structure of the linked GMI/IF models. It recognises that - due to Australia’s
exposure to export markets – that Australian red meat prices are largely
determined by prices in global markets and exchange rates. This has
implications for how changes in domestic demands – as a result of promotion or
other demand shifts – impact on volumes and prices. It also provides an ideal
vehicle to conduct a break-even analysis.

AN EVALUATION OF MLA’S RED MEAT NUTRITION PROGRAM 73
www.TheCIE.com.au
5.6 Nutrition program funded by levy payers: 2001-02 to 2006-07a
Activity Total MLA funding
$000
2001-02 7 132
2002-03 5 931
2003-04 6 013
2004-05 6 468
2005-06 6 056
2006-07 8 690 a See table 5.3, total MLA funding across Nutrition program components.
Source: MLA.
� different program components would have different rates of decay if funding
ceased; and
� these rates of decay would have to be weighted by the importance of each
component in terms of funding.
The composition of outputs from the nutrition program suggests a range of time
profiles between implementation and outputs or outcomes. The program targeted
two types of audiences: the general household consumer and health professionals.
The impact of the consumer campaign is thought to be rapid but so to the decay (that
is, the effects do not much beyond the period over which MLA undertakes active
advertising). At the same time, the impact of working with health professionals and
underlying research is expected to have not only longer lead times but also
substantially longer decay rates.
Taking a conservative approach, it is assumed that the benefits persist only over the
same period as the expenditures. In other words, the decay rate of the entire program
is less than one year – if the program were discontinued there would be no benefits
in following years. By doing this we ask the question: what is the maximum shift in
demand required to pay for the program? It therefore acts as an upper bound to the
required breakeven point.
The benefit used in the breakeven analysis is defined as the value-added or income
received at the farm or saleyard level by producers. This benefit is commensurate
with producer’s capacity to fund levies that fund the nutrition program.
A key assumption used here is that the cost of raising those levies is zero. If this was
not the case, then more levy funds would have to be raised to fund the same
program. Analysis presented in the Productivity Commission (2007) suggests the
cost of raising a dollar of levy funds is between 20 and 33 cents — which is less than
the cost of raising revenue through the tax system.
Results
The results of the breakeven analysis are summarised in table 5.7. This analysis
indicates that over the period, a sustained increase in domestic demand for red meat
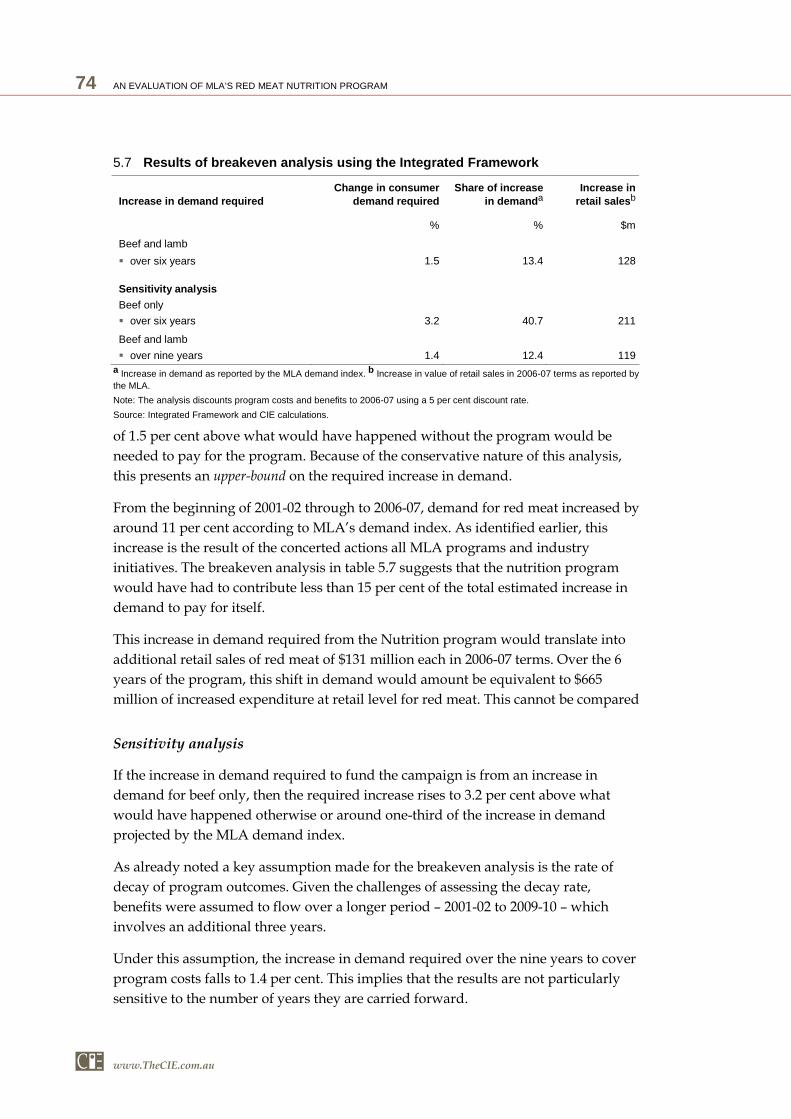
74 AN EVALUATION OF MLA’S RED MEAT NUTRITION PROGRAM
www.TheCIE.com.au
of 1.5 per cent above what would have happened without the program would be
needed to pay for the program. Because of the conservative nature of this analysis,
this presents an upper-bound on the required increase in demand.
From the beginning of 2001-02 through to 2006-07, demand for red meat increased by
around 11 per cent according to MLA’s demand index. As identified earlier, this
increase is the result of the concerted actions all MLA programs and industry
initiatives. The breakeven analysis in table 5.7 suggests that the nutrition program
would have had to contribute less than 15 per cent of the total estimated increase in
demand to pay for itself.
This increase in demand required from the Nutrition program would translate into
additional retail sales of red meat of $131 million each in 2006-07 terms. Over the 6
years of the program, this shift in demand would amount be equivalent to $665
million of increased expenditure at retail level for red meat. This cannot be compared
Sensitivity analysis
If the increase in demand required to fund the campaign is from an increase in
demand for beef only, then the required increase rises to 3.2 per cent above what
would have happened otherwise or around one-third of the increase in demand
projected by the MLA demand index.
As already noted a key assumption made for the breakeven analysis is the rate of
decay of program outcomes. Given the challenges of assessing the decay rate,
benefits were assumed to flow over a longer period – 2001-02 to 2009-10 – which
involves an additional three years.
Under this assumption, the increase in demand required over the nine years to cover
program costs falls to 1.4 per cent. This implies that the results are not particularly
sensitive to the number of years they are carried forward.
5.7 Results of breakeven analysis using the Integrated Framework
Increase in demand required Change in consumer
demand required Share of increase
in demanda Increase in
retail salesb
% % $m
Beef and lamb
� over six years 1.5 13.4 128
Sensitivity analysis
Beef only
� over six years 3.2 40.7 211
Beef and lamb
� over nine years 1.4 12.4 119 a Increase in demand as reported by the MLA demand index. b Increase in value of retail sales in 2006-07 terms as reported by the MLA.
Note: The analysis discounts program costs and benefits to 2006-07 using a 5 per cent discount rate.
Source: Integrated Framework and CIE calculations.

AN EVALUATION OF MLA’S RED MEAT NUTRITION PROGRAM 75
www.TheCIE.com.au
Conclusion
The analysis presented in this report suggests that there has been no deterioration of
key attitudinal and behavioural measures over the past four years. Without the
program, these measures could have declined as discussed earlier in this chapter.
However, it is not possible to determine this with certainty with the data and
information available. Demand for red meat has increased over the period of the
campaign. On balance, it is likely that the nutrition marketing program has
contributed to this increase; however it is not possible to say with any confidence
what this contribution has been.

76 AN EVALUATION OF MLA’S RED MEAT NUTRITION PROGRAM
www.TheCIE.com.au
References
Ball, K. and Dewbre, J., 1989, An analysis of the returns to generic advertising of beef, lamb and pork,
ABARE Discussion paper 89.4, Australian Government Publishing Service, Canberra.
CSIRO (Commonwealth Scientific and Industrial Research Organisation) 2008, Total Wellbeing
Diet, http://www.csiro.au/science/TWD.html accessed April 2008.
Freebairn, J., Goddard, E., and Griffith, G., 2005, When Can a Generic Advertising Program
Increase Farmer Returns? Australian Agribusiness Review, Volume 13 Issue 20.
MLA, 2003a, Are you getting it 3–4 times a week? How red meat ads turned general practitioners on,
AFA submission, Sydney.
—— 2003b, How removing constraints on demand can deliver serious benefits. $1 billion is something
to dance about, AFA entry 2003 for ‘Red Meat. Feel Good’, Sydney.
—— 2005, After the pinnacle we kept climbing. ‘Red Meat. Feel Good’s’ spectacular 3-year ROI, AFA
submission, Sydney.
—— 2007a, MLA annual report 2006-07, Sydney.
—— 2007b, Evolution of success: how MLA and The Campaign Palace achieved a 5 year turnaround
in red meat, AFA submission, Sydney.
—— 2007c, Nutrition research – the backbone of a healthy industry, Feedback, August, Sydney.
—— 2008, Submission to Standing Committee on Rural and Regional Affairs and Transport Inquiry
into meat marketing, Submission, May.
Productivity Commission, 2007, Public Support for Science and Innovation, Research Report,
Productivity Commission, Canberra.
Varian, H., 2006, Advertising commodities can be tricky, but it does pay off? Economic Scene.
http://www.nytimes.com/2006/06/01/business/media/01scene.html Accessed 2
September 2008.
Ward, R., 2004 Beef demand and the rate-of-return to the U.S beef checkoff: Two independent
evaluation approaches. Food and Resource Economics Department, Institute of Food and
Agricultural Sciences, University of Florida and Cattlemen’s Beef Promotion and Research
Board.