an economic assessment of “fair trade” in coffee · pdf filean economic assessment...
TRANSCRIPT

An Economic Assessment of“Fair Trade” in Coffee
David C. Zehner MBA/MIA ’02
Columbia Business School
Columbia University School of International and Public Affairs
The author would like to thank Raymond Fisman of Columbia Business School, David Pohl of TransFair USA,Stefano Ponte of the Centre for Development Research and Robert B. Zehner of the University of New SouthWales for comments on earlier drafts of this paper.
Chazen Web Journal of International Business, Fall 2002 www.gsb.columbia.edu/chazenjournal
COLUMBIABUSINESS
SCHOOL
FALL 2002 CHAZEN WEB JOURNAL OF INTERNATIONAL BUSINESS 1
1. Introduction
The fact that the Economist—not typically the most sympathetic publication—recognizes that millions of coffee growers face “destitution” and “financial ruin” (2001) indicates the severity of the problems growers face as participants in the international coffee supply chain. In importing countries, the chain is controlled by large corporations with significant market power. Four of these—Nestlé, Sara Lee, Philip Morris and Procter & Gamble—account for more than 60 percent of the world market. And in exporting countries, trading relationships are often characterized by distrust (Mendoza 2000). Traders and processors may underestimate the quality of beans they purchase in order to pay less; marketing enterprises and cooperatives invoke cost increases to justify wider gaps between the world price and the producer price; and, for their part, growers may lie about the geographical origin of their crop or add low-quality beans or dirt and stones to the bags of coffee they supply.
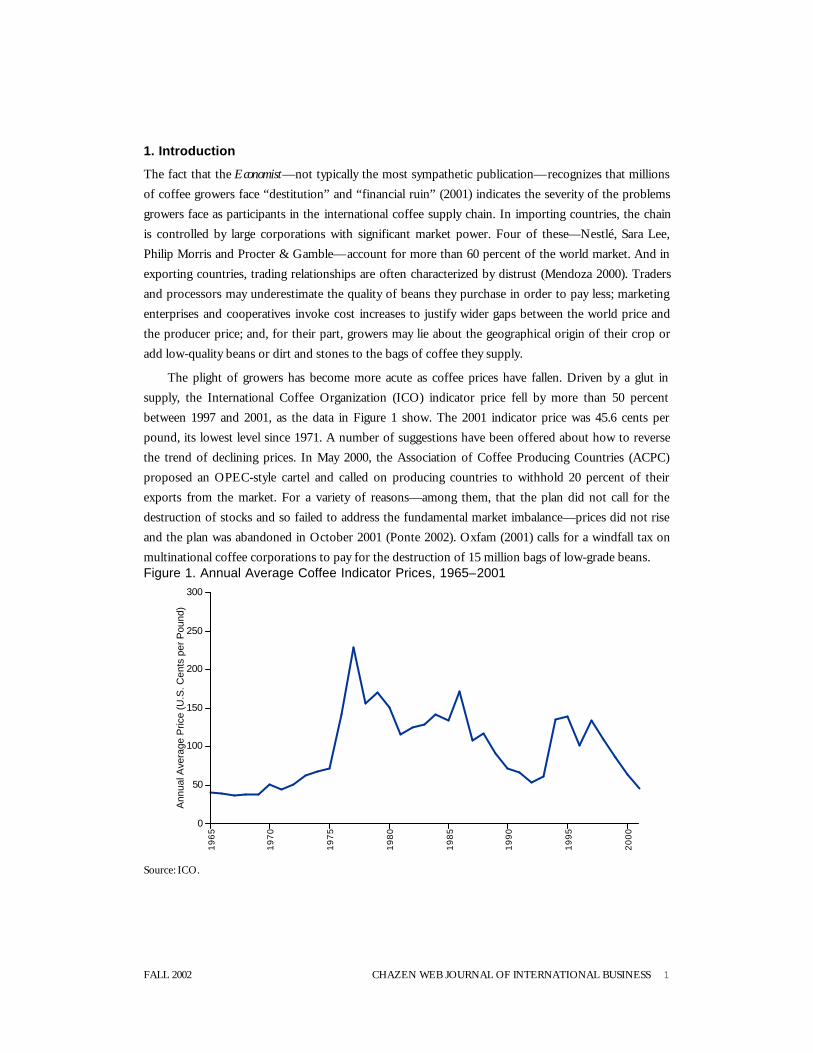
The plight of growers has become more acute as coffee prices have fallen. Driven by a glut in supply, the International Coffee Organization (ICO) indicator price fell by more than 50 percent between 1997 and 2001, as the data in Figure 1 show. The 2001 indicator price was 45.6 cents per pound, its lowest level since 1971. A number of suggestions have been offered about how to reverse the trend of declining prices. In May 2000, the Association of Coffee Producing Countries (ACPC) proposed an OPEC-style cartel and called on producing countries to withhold 20 percent of their exports from the market. For a variety of reasons—among them, that the plan did not call for the destruction of stocks and so failed to address the fundamental market imbalance—prices did not rise and the plan was abandoned in October 2001 (Ponte 2002). Oxfam (2001) calls for a windfall tax on multinational coffee corporations to pay for the destruction of 15 million bags of low-grade beans. Figure 1. Annual Average Coffee Indicator Prices, 1965–2001
19
65
19
70
19
75
19
80
19
85
19
90
19
95
20
00
0
50
100
150
200
250
300
Ann
ual A
vera
ge P
rice
(U.S
. Cen
ts p
er P
ound
)
Source: ICO.

FALL 2002 CHAZEN WEB JOURNAL OF INTERNATIONAL BUSINESS 2
There have been a few innovative ideas for improving the microeconomics of coffee production, but the Fair Trade Certified coffee movement stands out as an exception. Started in Europe 14 years ago, the aim of Fair Trade is to lift the standard of living of poor farmers by allowing growers to sell their beans directly to importers and roasters in consuming countries, bypassing the customary network of middlemen in their own countries. The purpose of this paper is to examine the economics of the Fair Trade coffee supply chain in order to determine whether or not Fair Trade is likely to achieve its long-term goal of improving the standard of living of coffee growers.
My argument is that Fair Trade is a small and inefficiently transferred subsidy. In the short term a grower may be better off with Fair Trade, but in the long term this is unlikely to be the case. Ultimately I disagree with the critical assumption that underlies the Fair Trade concept, namely that the low prices that growers receive are the cause of their poverty. Instead, I argue that low prices are a symptom of the power imbalances that exist in the supply chain. Small price subsidies are at best a temporary fix.
Section 2 of this paper is an overview of the U.S. Fair Trade coffee market. In Section 3, I will discuss three aspects of the Fair Trade model that make it unattractive for growers in the long term. Finally, in Section 4, I will discuss two options for increasing growers’ incomes.

FALL 2002 CHAZEN WEB JOURNAL OF INTERNATIONAL BUSINESS 3
2. Overview of the U.S. Fair Trade Coffee Market
TransFair USA, the only U.S.-based Fair Trade certification organization and one of 17 such initiatives worldwide, has set out four “basic guidelines” for Fair Trade coffee, shown in Figure 2. The most important of these is that Fair Trade purchasers guarantee a floor price of $1.26 FOB1 per pound of green Arabica coffee.
Figure 2. TransFair USA’s Four Basic Guidelines for Fair Trade Coffee
• Coffee importers agree to purchase from the small farmers included in the International Fair TradeCoffee Register.
• Farmers are guaranteed a minimum “fair trade price” of $1.26 per pound FOB for their coffee. If worldprice rises above this floor price, farmers will be paid a small premium ($0.05 per pound).
• Coffee importers provide a certain amount of credit to farmers against future sales, helping farmersstay out of debt to local coffee “coyotes” or middlemen.
• Importers and roasters agree to develop direct, long-term trade relationships with producer groups,thereby cutting out middlemen and bringing greater commercial stability to an extremely unstablemarket.
Source: www.transfairusa.org.
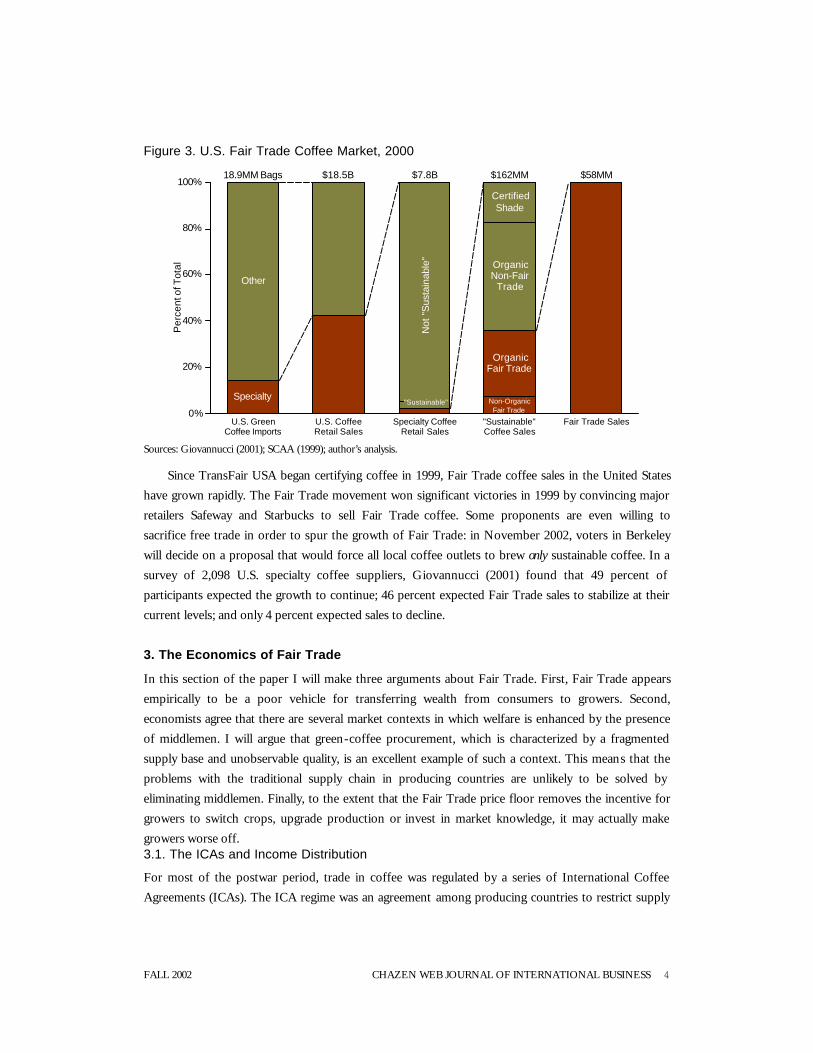
According to the U.K.-based Fair Trade Federation, recognition of the Fair Trade seal among the European general public is as high as 20 percent, and Fair Trade coffee claims a retail market share of several percent in a number of these markets. But so far Fair Trade’s importance in the U.S. market is much more limited. The data in Figure 3 were collected from several sources to provide an overview of the U.S. Fair Trade coffee market. Fair Trade is one of three kinds of “sustainable” coffee, the other two being organic and shade-grown. Collectively, sustainable coffee accounted for $162 million of retail sales in 2000, or about 2 percent of the $7.8 billion specialty coffee market. Fair Trade coffee sales were worth about $58 million in 2000.
1 Free on board. This is the price of green coffee loaded onto a ship at the port of export.
FALL 2002 CHAZEN WEB JOURNAL OF INTERNATIONAL BUSINESS 4
Figure 3. U.S. Fair Trade Coffee Market, 2000
Other
Specialty
Not
"S
usta
inab
le"
"Sustainable"
CertifiedShade
OrganicNon-Fair
Trade
OrganicFair Trade
Non-OrganicFair Trade
U.S. GreenCoffee Imports
U.S. CoffeeRetail Sales
Specialty CoffeeRetail Sales
"Sustainable"Coffee Sales
Fair Trade Sales
18.9MM Bags $18.5B $7.8B $162MM $58MM
0%
20%
40%
60%
80%
100%P
erce
nt o
f Tot
al
Sources: Giovannucci (2001); SCAA (1999); author’s analysis.
Since TransFair USA began certifying coffee in 1999, Fair Trade coffee sales in the United States have grown rapidly. The Fair Trade movement won significant victories in 1999 by convincing major retailers Safeway and Starbucks to sell Fair Trade coffee. Some proponents are even willing to sacrifice free trade in order to spur the growth of Fair Trade: in November 2002, voters in Berkeley will decide on a proposal that would force all local coffee outlets to brew only sustainable coffee. In a survey of 2,098 U.S. specialty coffee suppliers, Giovannucci (2001) found that 49 percent of participants expected the growth to continue; 46 percent expected Fair Trade sales to stabilize at their current levels; and only 4 percent expected sales to decline.
3. The Economics of Fair Trade
In this section of the paper I will make three arguments about Fair Trade. First, Fair Trade appears empirically to be a poor vehicle for transferring wealth from consumers to growers. Second, economists agree that there are several market contexts in which welfare is enhanced by the presence of middlemen. I will argue that green-coffee procurement, which is characterized by a fragmented supply base and unobservable quality, is an excellent example of such a context. This means that the problems with the traditional supply chain in producing countries are unlikely to be solved by eliminating middlemen. Finally, to the extent that the Fair Trade price floor removes the incentive for growers to switch crops, upgrade production or invest in market knowledge, it may actually make growers worse off. 3.1. The ICAs and Income Distribution
For most of the postwar period, trade in coffee was regulated by a series of International Coffee Agreements (ICAs). The ICA regime was an agreement among producing countries to restrict supply

FALL 2002 CHAZEN WEB JOURNAL OF INTERNATIONAL BUSINESS 5
coupled with an agreement among consuming countries to keep prices high. In this period the coffee industry in most producing countries was regulated, with parastatal enterprises heavily involved in stabilizing prices and monitoring quotas (UNCTAD 1995). After 1989, free-market economics dominated the political agenda in many producing countries, and consuming countries no longer felt a Cold War justification for supporting producers. The ICAs dissolved, and by the 1990s many producing countries had partially or fully liberalized their coffee industries.
Talbot (1997) demonstrates how the ICAs affected the distribution of income along the coffee commodity chain. His results are shown in Figure 4. The proportion of total income retained in consuming countries grew sharply from the late 1980s, rising from 53 percent in 1986 to 72 percent in 1995. Most of this growth was at the expense of intermediaries in the producing countries, particularly the parastatals; the proportion of income received by growers declined from 23 percent in 1986 to 10 percent in 1993 before rising to 20 percent in 1995.2
Figure 4. Distribution of Coffee Income, 1976–95
Growers
Value Added inProducing Country
Transport Costs& Weight Loss
Value Added inConsuming Country
1976 1978 1980 1982 1984 1986 1988 1990 1992 19940%
20%
40%
60%
80%
100%
Per
cent
of R
etai
l Pric
e
Source: Talbot (1997).
For present purposes, Talbot’s study is important b ecause it shows that the majority of income in the coffee commodity chain is earned in consuming countries. This should be an important design consideration for any initiative aimed at transferring income from consumers to producers: if such an initiative relies on the existing distribution system in consuming countries, then its efficiency is likely to be limited. This point can be clearly illustrated by measuring the distribution of the Fair Trade retail price premium directly.
2 Talbot attempts to take the logical next step by also quantifying economic surplus along the chain. He is able to do this only for the ICA period. One of the key findings is that during this period, growers retained a relatively high proportion of the total surplus (compared to primary commodity producers elsewhere), prompting Talbot to conclude that the ICAs “may have been the most successful commodity agreements negotiated in the post-war period” (86).

FALL 2002 CHAZEN WEB JOURNAL OF INTERNATIONAL BUSINESS 6
3.2. The Fair Trade Premium in the United Kingdom in 1996
Almost without exception, popular discussions of Fair Trade report that farmers are significantly better off because of the higher prices they receive. But the relevant question is, How much of the Fair Trade retail price premium do growers actually receive?
The only published academic work to address this issue is Mendoza (2000). Mendoza measured prices along the supply chain for instant coffee produced in Nicaragua and sold in the United Kingdom in 1996. His results, shown in Figure 5, suggest that farmers received a premium of only $0.09 per pound, or 2 percent of the $4.23 retail premium. The distribution system in the United Kingdom absorbed the largest single fraction of the retail premium ($1.54, or 36 percent).
Figure 5. Supply-Chain Economics, Typical Chain versus Fair Trade
Pro
duce
r
Pro
cess
ing,
Tra
nspo
rt,
Oth
er
Exp
ort T
ax
Roa
stin
g,S
tora
ge,
Tra
nspo
rt
Adv
ertis
ing
Who
lesa
lean
d R
etai
l
2.320.64 0.18
5.640.76
3.14
$0
$5
$10
$15
$20
Pric
e pe
r P
ound
Pro
duce
r
Pro
cess
ing,
Tra
nspo
rt,
Oth
er
Exp
ort T
ax
Roa
stin
g,S
tora
ge,
Tra
nspo
rt
Adv
ertis
ing,
Lice
nse
Fee
Who
lesa
lean
d R
etai
l
2.410.68 0.23
6.09
2.50
4.68
$0
$5
$10
$15
$20
Pric
e pe
r P
ound
Traditional Market Fair Trade
Retail = $12.59
Retail = $16.82
Note: Nicaraguan instant coffee, traded with Great Britain, 1996. According to the USDA Guidelines on Food Processing, 2.6 pounds of green coffee are required to produce one pound of instant coffee. Using this weight-loss factor, Mendoza’s analysis implies a FOB price of $1.28 per pound of Fair Trade coffee versus $1.21 for coffee sold in the traditional market.Source: Mendoza (2000).
Mendoza’s study is probably not, however, a good indicator of the economics of Fair Trade today, for two reasons. First, world coffee prices in 1996 were significantly higher. According to the ICO, the average FOB price for Nicaraguan Mild Arabica in 1996 was $1.23 per pound versus $0.74 in 2000. The FOB premium for Fair Trade coffee falls to $0.05 per pound when the market price approaches the floor price of $1.26. This means that the benefit of Fair Trade for growers is greater now than it was in 1996. Second, there was a much larger retail price premium in the United Kingdom in 1996 than there is in the United States today. This may be because consumer preferences support a
FALL 2002 CHAZEN WEB JOURNAL OF INTERNATIONAL BUSINESS 7
higher premium in that market or because Fair Trade was relatively new in 1996 and its premium has fallen since then.
3.3. The Fair Trade Premium in the United States in 2002
I have estimated the distribution of the Fair Trade retail price premium for one pound of roasted Mild Arabica coffee sold in the United States today. The analysis is based on the June 2002 market price of $0.59 per pound of Other Mild Arabica green coffee. 3 This implies a FOB price premium (paid to the cooperative) of $0.67 per pound of green coffee ($1.26 less $0.59), or $0.80 per pound of roasted coffee. 4
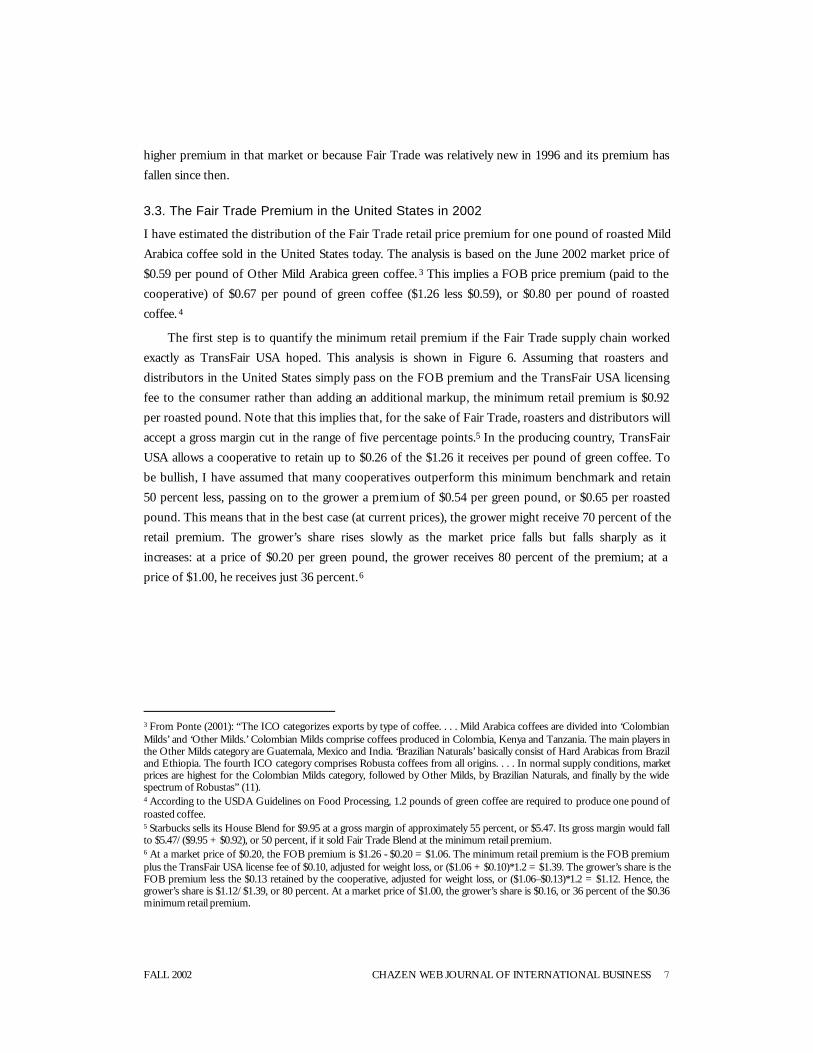
The first step is to quantify the minimum retail premium if the Fair Trade supply chain worked exactly as TransFair USA hoped. This analysis is shown in Figure 6. Assuming that roasters and distributors in the United States simply pass on the FOB premium and the TransFair USA licensing fee to the consumer rather than adding an additional markup, the minimum retail premium is $0.92 per roasted pound. Note that this implies that, for the sake of Fair Trade, roasters and distributors will accept a gross margin cut in the range of five percentage points.5 In the producing country, TransFair USA allows a cooperative to retain up to $0.26 of the $1.26 it receives per pound of green coffee. To be bullish, I have assumed that many cooperatives outperform this minimum benchmark and retain 50 percent less, passing on to the grower a premium of $0.54 per green pound, or $0.65 per roasted pound. This means that in the best case (at current prices), the grower might receive 70 percent of the retail premium. The grower’s share rises slowly as the market price falls but falls sharply as it increases: at a price of $0.20 per green pound, the grower receives 80 percent of the premium; at a price of $1.00, he receives just 36 percent.6
3 From Ponte (2001): “The ICO categorizes exports by type of coffee. . . . Mild Arabica coffees are divided into ‘Colombian Milds’ and ‘Other Milds.’ Colombian Milds comprise coffees produced in Colombia, Kenya and Tanzania. The main players in the Other Milds category are Guatemala, Mexico and India. ‘Brazilian Naturals’ basically consist of Hard Arabicas from Brazil and Ethiopia. The fourth ICO category comprises Robusta coffees from all origins. . . . In normal supply conditions, market prices are highest for the Colombian Milds category, followed by Other Milds, by Brazilian Naturals, and finally by the wide spectrum of Robustas” (11). 4 According to the USDA Guidelines on Food Processing, 1.2 pounds of green coffee are required to produce one pound of roasted coffee. 5 Starbucks sells its House Blend for $9.95 at a gross margin of approximately 55 percent, or $5.47. Its gross margin would fall to $5.47/($9.95 + $0.92), or 50 percent, if it sold Fair Trade Blend at the minimum retail premium. 6 At a market price of $0.20, the FOB premium is $1.26 - $0.20 = $1.06. The minimum retail premium is the FOB premium plus the TransFair USA license fee of $0.10, adjusted for weight loss, or ($1.06 + $0.10)*1.2 = $1.39. The grower’s share is the FOB premium less the $0.13 retained by the cooperative, adjusted for weight loss, or ($1.06–$0.13)*1.2 = $1.12. Hence, the grower’s share is $1.12/$1.39, or 80 percent. At a market price of $1.00, the grower’s share is $0.16, or 36 percent of the $0.36 minimum retail premium.
FALL 2002 CHAZEN WEB JOURNAL OF INTERNATIONAL BUSINESS 8
Figure 6. Minimum Retail Price Premium for Fair Trade Coffee, June 2002
Premium Paidby Consumer
Advertising/Licensing
Distribution Roasting,Transport
Taxes,Intermediariesin Producing
Country
Premium Receivedby Grower
92 12
0 0 15-31
65
0
30
60
90
120
150
Ret
ail P
rem
ium
for
Fai
r T
rade
Cof
fee
(U.S
. Cen
ts p
er P
ound
)
• TransFair feeis 10c pergreen lb (12cper roasted lb)
• Assumeretailer agreesto sell FT atsame unitmargin (lowergross margin)
• Assumeroasting is nomoreexpensive
• Minimum retailpremium is92c perroasted lb
FOB premium is 67cper green lb (80c perroasted lb)
• Grower getspremium of54c per greenlb (65c perroasted lb;$1.13 in total)
• TransFairallows co-opsto take up to26c per greenlb (31c perroasted lb)
• Assume co-ops out-performguidelines by50%
Sources: ICO; TransFair USA; author’s estimates.
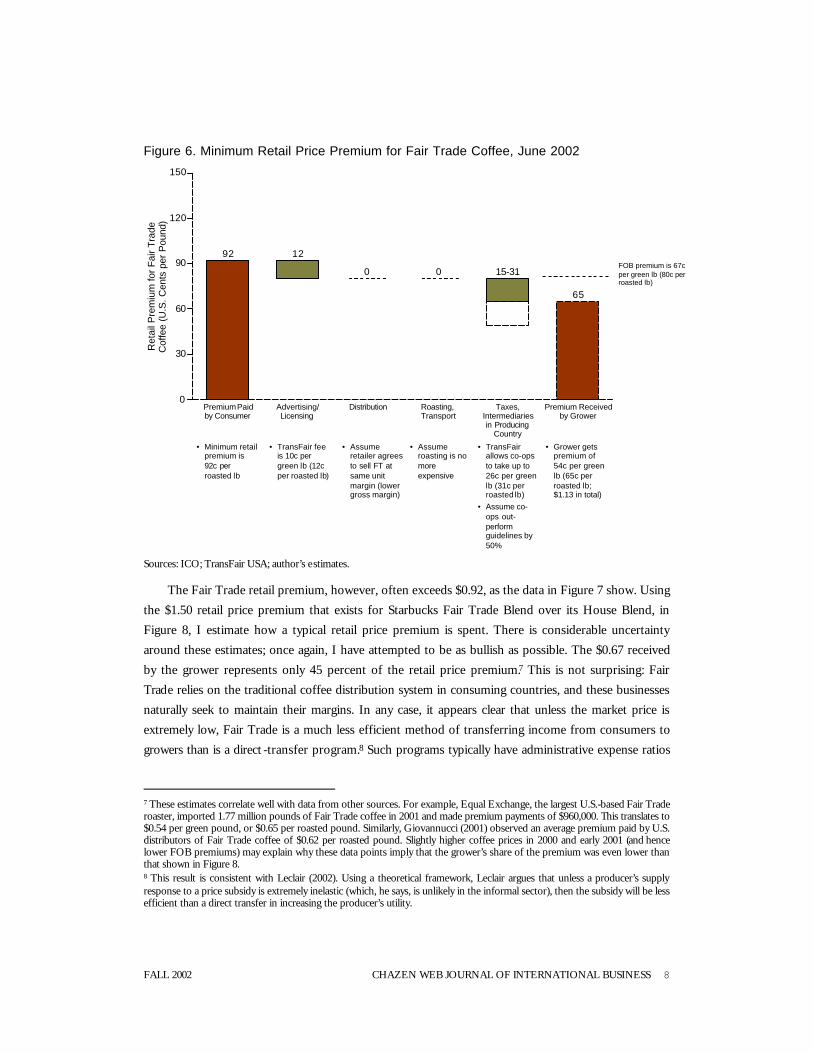
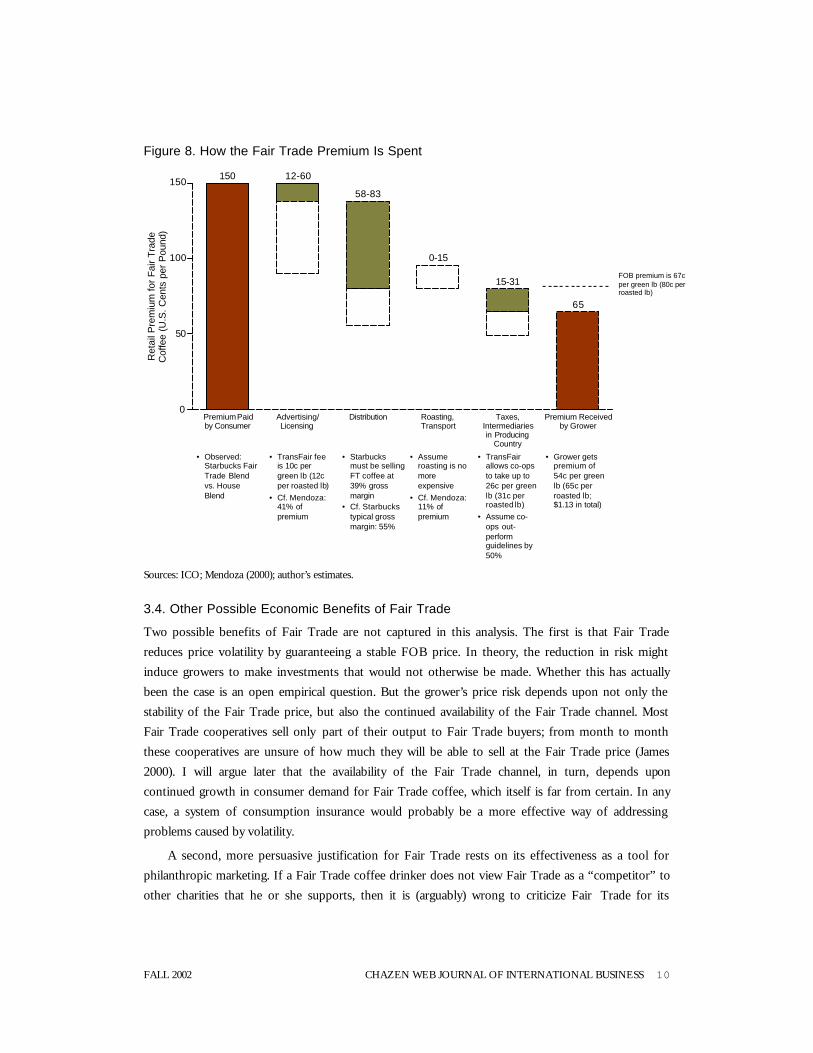
The Fair Trade retail premium, however, often exceeds $0.92, as the data in Figure 7 show. Using the $1.50 retail price premium that exists for Starbucks Fair Trade Blend over its House Blend, in Figure 8, I estimate how a typical retail price premium is spent. There is considerable uncertainty around these estimates; once again, I have attempted to be as bullish as possible. The $0.67 received by the grower represents only 45 percent of the retail price premium.7 This is not surprising: Fair Trade relies on the traditional coffee distribution system in consuming countries, and these businesses naturally seek to maintain their margins. In any case, it appears clear that unless the market price is extremely low, Fair Trade is a much less efficient method of transferring income from consumers to growers than is a direct -transfer program.8 Such programs typically have administrative expense ratios
7 These estimates correlate well with data from other sources. For example, Equal Exchange, the largest U.S.-based Fair Trade roaster, imported 1.77 million pounds of Fair Trade coffee in 2001 and made premium payments of $960,000. This translates to $0.54 per green pound, or $0.65 per roasted pound. Similarly, Giovannucci (2001) observed an average premium paid by U.S. distributors of Fair Trade coffee of $0.62 per roasted pound. Slightly higher coffee prices in 2000 and early 2001 (and hence lower FOB premiums) may explain why these data points imply that the grower’s share of the premium was even lower than that shown in Figure 8. 8 This result is consistent with Leclair (2002). Using a theoretical framework, Leclair argues that unless a producer’s supply response to a price subsidy is extremely inelastic (which, he says, is unlikely in the informal sector), then the subsidy will be less efficient than a direct transfer in increasing the producer’s utility.

FALL 2002 CHAZEN WEB JOURNAL OF INTERNATIONAL BUSINESS 9
of 20 percent or less.9 There is no question that the Fair Trade premium can make a tremendous difference to the lives of the growers who receive it. The point is that a socially conscious consumer would add more to growers’ incomes by writing a check for $1.50 than by buying a pound of Fair Trade coffee. 10
Figure 7. Retail Price Premiums for Fair Trade Coffee, August 2002
FairTradeBlend House
Blend
FairTradeBlend House
Blend
OrganicFair
TradeBlends
SignatureBlends
Peet's Starbucks Green Mountain
$10.95
$8.95
$11.45
$9.95$10.32
$9.52
$0
$3
$5
$8
$10
$13
Pric
e pe
r Roa
sted
Pou
nd
Fair Trade RetailPrice Premium: $2.00 $1.50 $0.80
Sources: www.peets.com; www.starbucks.com; www.greenmountaincoffee.com.
9 For example, 17 percent of World Vision’s revenue is spent on administration and fund-raising. 10 Supporters of Fair Trade respond that the psychological effects of earning a “fair” income from one’s work are much more favorable than the effects of receiving a donation. One wonders which option growers, if asked, would prefer—$1.50 in cash or a Fair Trade premium of $0.67. Moreover, to the degree that growers perceive the premium as simply the “correct” or “fair” price for their work, the incentive distortions created by the premium (see Section 3.6) will be accentuated.
FALL 2002 CHAZEN WEB JOURNAL OF INTERNATIONAL BUSINESS 10
Figure 8. How the Fair Trade Premium Is Spent
Premium Paidby Consumer
Advertising/Licensing
Distribution Roasting,Transport
Taxes,Intermediariesin Producing
Country
Premium Receivedby Grower
150 12-60
58-83
0-15
15-31
65
0
50
100
150
Ret
ail P
rem
ium
for
Fai
r T
rade
Cof
fee
(U.S
. Cen
ts p
er P
ound
)
• Observed:Starbucks FairTrade Blendvs. HouseBlend
• TransFair feeis 10c pergreen lb (12cper roasted lb)
• Cf. Mendoza:41% ofpremium
• Starbucksmust be sellingFT coffee at39% grossmargin
• Cf. Starbuckstypical grossmargin: 55%
FOB premium is 67cper green lb (80c perroasted lb)
• Grower getspremium of54c per greenlb (65c perroasted lb;$1.13 in total)
• TransFairallows co-opsto take up to26c per greenlb (31c perroasted lb)
• Assume co-ops out-performguidelines by50%
• Assumeroasting is nomoreexpensive
• Cf. Mendoza:11% ofpremium
Sources: ICO; Mendoza (2000); author’s estimates.
3.4. Other Possible Economic Benefits of Fair Trade
Two possible benefits of Fair Trade are not captured in this analysis. The first is that Fair Trade reduces price volatility by guaranteeing a stable FOB price. In theory, the reduction in risk might induce growers to make investments that would not otherwise be made. Whether this has actually been the case is an open empirical question. But the grower’s price risk depends upon not only the stability of the Fair Trade price, but also the continued availability of the Fair Trade channel. Most Fair Trade cooperatives sell only part of their output to Fair Trade buyers; from month to month these cooperatives are unsure of how much they will be able to sell at the Fair Trade price (James 2000). I will argue later that the availability of the Fair Trade channel, in turn, depends upon continued growth in consumer demand for Fair Trade coffee, which itself is far from certain. In any case, a system of consumption insurance would probably be a more effective way of addressing problems caused by volatility.
A second, more persuasive justification for Fair Trade rests on its effectiveness as a tool for philanthropic marketing. If a Fair Trade coffee drinker does not view Fair Trade as a “competitor” to other charities that he or she supports, then it is (arguably) wrong to criticize Fair Trade for its

FALL 2002 CHAZEN WEB JOURNAL OF INTERNATIONAL BUSINESS 11
inefficiency. The “price premium” portion of the $58 million that was spent on Fair Trade coffee in 2000—perhaps 15 percent, or $9 million—may not otherwise have been donated at all, so in this sense Fair Trade does at least some good (even if it only delivers less than half of the premium to the intended beneficiaries). The caveat is that Fair Trade is not unequivocally beneficial for growers, because it distorts their incentives; this argument will be discussed in greater detail in Section 3.6. Moreover, many of the marketing lessons from Fair Trade could be applied to more efficient programs. For example, Ponte (2002) argues that selling the “story” of how and by whom coffee is produced is particularly important. Although Fair Trade is the most successful application of this approach to date, in principle it could be applied just as effectively to other programs.
3.5. The Role of Middlemen in the Coffee Supply Chain
One of the premises of Fair Trade is that it is desirable to “disintermediate” the commodity chain, bypassing middlemen wherever possible. In this section I will make the argument that intermediation is in fact valuable in this supply chain, particularly in producing countries. Growers fare poorly because there are too few middlemen; more specifically, they fare poorly when the markets for intermediaries fail, enabling middlemen to build monopsony power.
Table 1 describes four generic market contexts in which the presence of middlemen would be expected to increase economic efficiency and shows that green-coffee procurement exhibits each of these characteristics. The table also draws on Mendoza’s (2000) empirical observations to describe the traditional coffee supply chain along each dimension and contrasts the expected effect of Fair Trade with the observed effect.
Three conclusions follow from this analysis. First, since a fragmented supply base and unobservable quality characterize the market context in which coffee procurement occurs, economic efficiency should be enhanced by the presence of middlemen. This means that, everything else being equal, the removal of middlemen from the Fair Trade supply chain is unlikely to improve welfare. Depending upon how expensive it is to search for and compare quality across suppliers, Fair Trade buyers could become “locked in” to a relatively small number of sellers (McMillan 2002). We would expect the cost of bringing equivalent-quality Fair Trade coffee to market to be higher (or, if the costs of intermediation were fixed, then we would expect the quality to suffer). My analysis in Section 3.3 suggests the former; Mendoza observes the latter. Since Fair Trade buyers are perceived to be less able to assess quality and less demanding in any case, growers sell their poorest-quality beans in the Fair Trade channel and reserve their best beans for the traditional channel.11
11 Only anecdotal evidence is available as to whether the quality of Fair Trade coffee generally meets, exceeds or falls short of coffee produced in the traditional chain. This is a contentious issue. Supporters of Fair Trade claim that large roasters unfairly disparage its quality in order to deflect pressure from interest groups. TransFair USA argues that competition among growers to sell to Fair Trade buyers ensures that quality stays high and points out that large roasters such as Starbucks would not carry Fair Trade coffee at all if the coffee did not meet at least some minimum acceptable level of quality. On the other hand, Starbucks CEO Orin Smith is quoted as being “worried about the quality of Fair Trade coffee” and suggesting that Fair Trade leaders work with industry leaders to identify cooperatives that can produce the best coffee in large volumes (Denver Post 2001).

FALL 2002 CHAZEN WEB JOURNAL OF INTERNATIONAL BUSINESS 12
Second, everything else is clearly not equal. There are serious power imbalances in the traditional supply chain that reduce its efficiency. In theory, competitive markets among intermediaries and growers should prevent cheating by either party. But mutual deceit is, in fact, rampant. A key reason for this seems to be that there are concentrated, noncompetitive markets for intermediaries at several points in the supply chain, creating monopsony power for the middlemen. The data in Figure 9 show that the top five roasters and international trading companies worldwide hold market shares of 69 percent and 46 percent, respectively, and that in the three African countries for which data are available, the top five exporters control 46 percent, 62 percent and 53 percent of the market.
Figure 9. Middleman Market Share, 1998–99
Others
TchiboP&G
Sara Lee
Nestle
PhilipMorris
AronEsteveCargill
Volcafe
Neumann
Top 5
Roasters InternationalTraders
Kenya Tanzania Uganda0%
20%
40%
60%
80%
100%
Mar
ket S
hare
(199
8-99
)
Exporters Sources: Ponte 2001; 2002.

FALL 2002 CHAZEN WEB JOURNAL OF INTERNATIONAL BUSINESS 13
Table 1. The Role of the Middleman in Fair Trade
Market context in which the presence of a
middleman increases welfare
Does coffee bean procurement exhibit
these characteristics?
Observed functioning of traditional supply chain
(Mendoza 2000)
Hoped-for effect of Fair Trade
Observed outcome of Fair Trade
(Mendoza 2000)
• Markets are diffuse, making it expensive for buyers to find sellers, or vice versa (search costs)
• Middleman invests in market knowledge and reduces search costs (Wang 1999)
• Yes—almost all of the world’s coffee is grown by small producers
• Oxfam (2001) estimates that 700,000 families are involved in producing coffee worldwide
• Middlemen increase efficiency by reducing buyers’ search costs
• Fair Trade buyers will develop long-term relationships with supplier cooperatives, eliminating search costs
• Costs of intermediation in the Fair Trade supply chain are higher (see Section 3.2)
• Fair Trade buyers cannot match the market knowledge of the network of middlemen
• Assessing product quality is difficult (adverse selection)
• Middleman invests in expertise in inspection (Biglaiser 1993; Li 1998)
• If quality is unobservable, then the presence of multiple, competing middlemen reduces cheating
• Yes—quality depends on observable characteristics (e.g., grain size, cleanliness and aroma) as well as unobservable characteristics (e.g., relative humidity of the green bean)
• Monopsony power among middlemen reduces efficiency
• Middlemen often cheat growers by claiming that beans are more humid than they actually are
• In response, growers also shirk on quality by lying about the geog-raphical origin of the crop or by adding dirt or stones to the bag
• Fair Trade buyers will develop a reputation for honesty
• This will create a “virtuous circle” whereby buyers pay higher prices and suppliers produce higher-quality coffee
• Growers sell poor-quality coffee to Fair Trade buyers (who are less able to assess its quality and are perceived to be less demanding in any case)
• Market price information is not cheaply or instantaneously available to sellers (price discovery costs)
• Multiple, competing middlemen become a channel for price info-rmation (Wang 1999)
• Yes—most sellers depend upon middlemen for market price information
• Monopsony power among middlemen reduces efficiency
• Middlemen often cheat growers by lying about prices in downstream markets
• By publicly committing to a price floor, the Fair Trade movement reduces opportunities for individual buyers to cheat
• This should reduce price-discovery costs for sellers
• New middlemen arise, claiming to represent cooperatives or groups of cooperatives
• Monopsony power and mutual distrus t persist (e.g., deductions made by cooperatives from the Fair Trade FOB price are not transparent)
• There are limited reputational spillovers for producers of poor-quality output (moral hazard)
• Middleman’s repeated interaction with sellers creates reputational spillovers (Biglaiser and Friedman 1993)
• Yes—the supply base is so fragmented that it would be difficult for downstream buyers to adequately police the quality of growers’ output
• Adverse selection problem not solved (see above), so quality is suboptimal
• Hence the ability of middlemen to create reputational spillovers is even more important
• If coffee price is low, growers will place high value on the Fair Trade premium and hence will be even more careful to protect their reputations
• The “minimum -quality threshold” (below which growers would risk losing access to Fair Trade prices) is low, so growers reserve their best-quality coffee for the traditional channels

FALL 2002 CHAZEN WEB JOURNAL OF INTERNATIONAL BUSINESS 14
Finally, Fair Trade does not correct the power imbalances in the traditional supply chain. For example, Mendoza (2000) offers the following characterization of the “new” Nicaraguan middlemen, intermediaries who represent cooperatives or groups of cooperatives in negotiations with Fair Trade buyers:
They have more access to various resources, exercise their role in a despotic, authoritarian manner (for example, they constantly change the rules of the game; they use credit to get hold of the coffee; they expel members who deal with other enterprises), they hide information, deceive the cooperatives with false promises, and legitimize themselves through their contacts with international organizations (buyers, banks, unions, the government and NGOs). All this allows directors to act without any accountability to the formal owners of the enterprise: the first-level cooperatives and producers (67).
The result is that distrust and deceit persist. The implication is that the best way to help growers may be to address whatever failure prevents a competitive market among middlemen from developing.12 I will address this opportunity in the final section of this paper.
3.6. Incentives
A third problem with Fair Trade is that a price floor can remove the grower’s incentive to upgrade production, improve product quality or switch crops. This might not be a problem if the availability of the Fair Trade premium were guaranteed in the long run, but for most growers it would be a mistake to make this assumption. The reason is that Fair Trade is likely to remain a niche brand.
Even after 14 years in Europe, there is only a limited customer base for Fair Trade coffee. According to the U.K.-based Fair Trade Foundation, as many as 68 percent of European consumers agree that they “would pay more for Fair Trade products, if they could be sure that farmers and workers in the Third World received a fair return.” But the highest market share recorded for Fair Trade coffee in a European market is 5 percent (in Switzerland). No surveys of U.S. consumer attitudes toward Fair Trade have yet been completed, but as an illustration, only 54 percent of U.S. consumers in the March 2001, Cone/Roper Corporate Citizenship Study stated that they would be willing to switch brands to support a cause, even if price and quality were equal (though this number rose to 81 percent in a survey conduct ed six weeks after September 11). In the 1996 Roper Green Gauge Survey, only 5 percent of consumers were classified as “Greenback Greens,” willing to pay a premium of 15–20 percent for ecologically friendly products, and for these people the major motivation was a perceived correlation with health or quality of life (American Demographics 1997). Hence, it seems likely that Fair Trade’s future market share in the United States will stabilize significantly below 10 percent.
The implication is that supply of Fair Trade coffee will exceed demand. Already, TransFair USA claims to have signed up 300 cooperatives representing more than 500,000 farmers in 20 countries.
12 Supporters of Fair Trade, particularly those involved with Fair Trade in handicrafts, mention an additional aspect of disintermediation that is not captured here. By connecting producers more closely with the market, it is argued, Fair Trade enables producers to tailor their output more successfully to consumer preferences (Leclair 2002). This argument has less merit for a commodity such as coffee, for which quality standards are well known and product development is minimal.

FALL 2002 CHAZEN WEB JOURNAL OF INTERNATIONAL BUSINESS 15
One possible result is that the Fair Trade premium will fall.13 Another possibility is that the premium will stabilize at some point and that the opportunity to sell in the Fair Trade channel will be rationed. This is already happening: TransFair USA reports that its growers sell an average of only 15 percent of their monthly output to Fair Trade buyers.14 Hence, there is a risk that a grower who currently sells in this channel might not receive a Fair Trade “ration” in the future. Whether the premium falls or rationing occurs, the economics for growers could become much less favorable in the future. In this situation it would be risky for growers to rely upon future Fair Trade premiums.15
Acknowledging the risk of incentive distortions, proponents of Fair Trade have two responses. First, they argue that since only a limited share of each cooperative’s production is typically sold in the Fair Trade channel, the distortions must likewise be limited. Second, they suggest that Fair Trade can be used as a temporary income-support mechanism during the transition to higher-return activities (Leclair 2002). There are two problems with these claims. First, the two arguments are inconsistent. If Fair Trade is of such limited importance to growers that incentives are barely distorted, then the impact of Fair Trade in enabling diversification must also be limited. (A different problem arises when Fair Trade is very important to the cooperative: resentment may brew between growers who for ethnic, socioeconomic or other reasons belong to the cooperative and those who do not.16) Second, it is not clear that insufficient surplus is the root cause of failure to diversify for most growers. Recent studies of technology adoption (e.g., Udry and Conley 2002) emphasize the importance of social learning mechanisms as enablers of (or barriers to) diversification. In any case, it is difficult to find concrete examples of growers who have used the Fair Trade premium only as a temporary “crutch” as they switched crops.
4. Opportunities
A close inspection of prices and incomes in producing countries reveals two possible opportunities for increasing growers’ incomes. The data in Figure 10 show export prices by country for Other Mild Arabica beans in September 1999. The first important point is that the average export price varies substantially across countries (in that month, from $1.35 per pound in Venezuela to $0.58 in Ecuador and Haiti). The magnitude of these differences suggests that there is an opportunity to increase export prices by upgrading perceived quality. Second, there is almost no correlation between export price and grower price across these countries. For example, Venezuelan growers received lower prices than Ecuadorian growers despite the fact that Venezuelan coffee fetched prices on the world market that were twice as high as those of Ecuadorian coffee. The differences are in government taxes and
13 A falling premium could explain why Mendoza (2000) observed a much higher premium in 1996 than is evident today. 14 David Pohl, personal communication, August 2002. 15 It is spurious to note (as some Fair Trade supporters do) that traditional “development” projects are also often short-term in nature. Except perhaps when there is an industrial-development justification (and in this case funding typically does not depend upon potentially fickle consumer preferences), such projects rarely use direct price supports to subsidize uneconomical production. 16 Stefano Ponte, personal communication, August 2002.

FALL 2002 CHAZEN WEB JOURNAL OF INTERNATIONAL BUSINESS 16
subsidies, processing and other domestic market costs (packaging, grading, transportation, storage, marketing and distribution) and traders’ margins. Hence, there must be an opportunity in many countries to increase growers’ incomes by improving supply-chain efficiency. In this section I will examine these two opportunities in turn, starting with the latter. Figure 10. Average Export Price and Price Paid to Growers, Other Mild Arabicas, September 1999
Pro
cess
ing,
Tra
nspo
rt, T
ax
Gro
wer
Pric
e
Ven
ezue
la
Dom
inic
anR
epub
lic
Rw
anda
Cos
ta R
ica
Mex
ico
Hon
dura
s
Gua
tem
ala
Mal
awi
Pap
uaN
ew G
uine
a
El S
alva
dor
Per
u
Indi
a
Bol
ivia
Bur
undi
Ecu
ador
Hai
ti
135
118
99 95 9586 83
79 79 78 77 76 74 71
58 58
0
50
100
150
Ave
rage
Exp
ort P
rice
of M
ild A
rabi
caC
offe
es, S
ept 1
999
(U.S
. Cen
ts p
er P
ound
)
Source: ICO.
4.1. Improve Supply-Chain Efficiency
Since the end of the ICA regime, the coffee supply chain has been characterized by a high (and increasing) degree of concentration among buyers and a fragmented supply base. Absent barriers to entry, one would expect new middlemen to enter the market for intermediaries until it eventually became competitive. But the monopsony power in the coffee supply chain appears to be particularly intractable. For example, Mendoza (2000) suggests that cooperatives, which were set up, in part, to improve the bargaining power of growers, in fact tend to push the power imbalances further up the supply chain. The new power imbalance, he reports, is between the growers and the directors of the cooperatives, and mutual distrust is just as pervasive as it was before. 17 On the other hand, the data in Figure 10 offer some cause for optimism: clearly, growers in some countries do better than others.
17 Recognizing this problem, some Fair Trade groups have set minimum standards for how cooperatives are governed. For example, TransFair USA works only with cooperatives that are democratically organized and certified by the Fair Labor Organization and mandates that at least $1 of the $1.26 FOB price that is paid to the cooperative be passed on to the growers. At this point, no studies have been completed to test whether these measures have in fact ameliorated the imbalances observed by Mendoza.

FALL 2002 CHAZEN WEB JOURNAL OF INTERNATIONAL BUSINESS 17
Hence the question is, Why do competitive markets for middlemen fail to develop, and what would it take to “unblock” these markets?
Several kinds of barriers to entry may exist in the markets for coffee intermediaries. Two of the most important kinds are illustrated by the experience of the Tanzanian coffee industry in the 1990s. Smallholder growers produce more than 90 percent of Tanzania’s coffee. Until 1994, all coffee was sold through cooperatives to the Tanzania Coffee Marketing Board (TCMB), which was the only entity legally allowed to sell coffee or coffee inputs. The TCMB held open auctions attended by private exporters. Growers received a small initial payment, followed, in theory, by two later payments after the auction price of the coffee was determined. Because growers had only one outlet for their coffee, cooperatives could extend crop-secured loans, with which growers could buy inputs (at controlled prices) from the TCMB. Hence, as Winter-Nelson and Temu (2002) note, credit, input and output transactions were linked. In fact, the market price was often insufficient to cover the initial payment to the grower plus the cooperatives’ costs, so the grower received no subsequent payments. The cooperatives typically ran at a loss and depended upon government loans, and the system eventually broke down when macroeconomic reforms in the mid-1990s led to the collapse of the Tanzanian shilling. When interest rates rose, the cooperatives became insolvent.
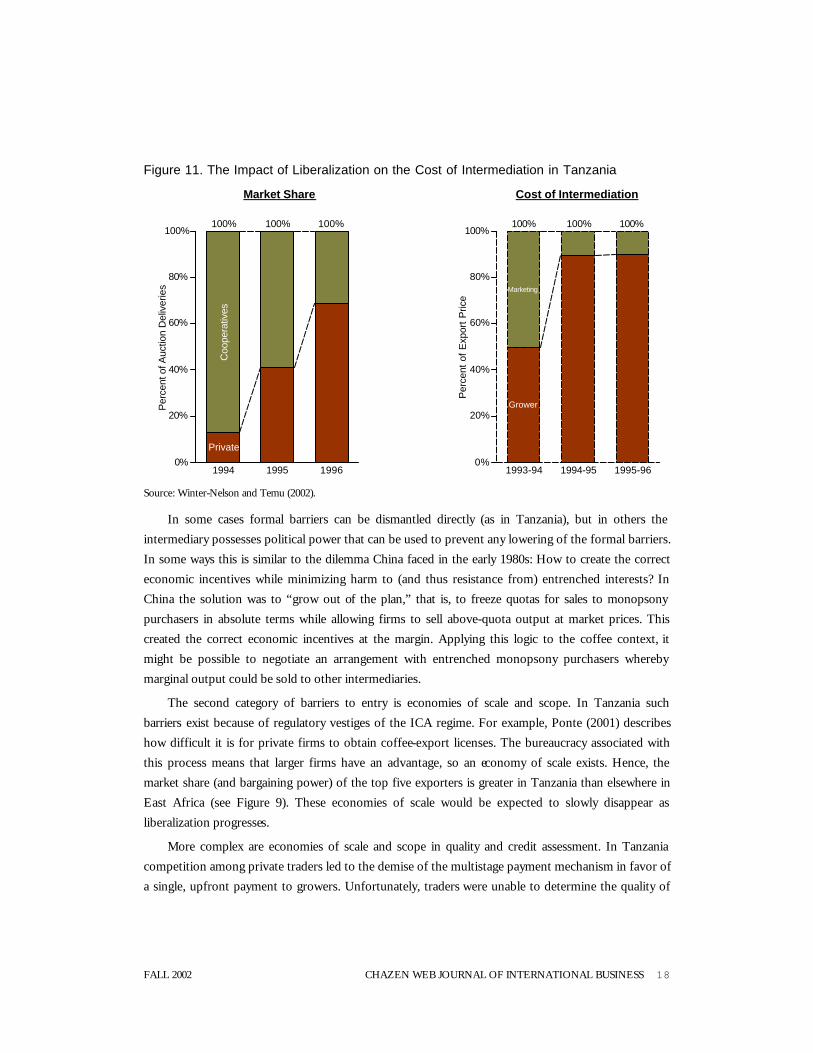
A key element of liberalization was dismantling the first kind of barrier to entry: the formal requirements that farmers sell only to cooperatives and that cooperatives sell only to the TCMB. Private traders quickly entered the market, and the costs of intermediation fell as firms introduced better processing equipment that improved quality, reduced processing time and lowered costs. Figure 11 shows how dramatic these changes were: private traders accounted for 13 percent of auction deliveries in 1994 and 69 percent in 1996, while the grower price increased from 50 percent to 90 percent of the export price over the same period.
FALL 2002 CHAZEN WEB JOURNAL OF INTERNATIONAL BUSINESS 18
Figure 11. The Impact of Liberalization on the Cost of Intermediation in Tanzania
Coo
pera
tives
Private
1994 1995 1996
100% 100% 100%
0%
20%
40%
60%
80%
100%
Per
cent
of A
uctio
n D
eliv
erie
s Marketing
Grower
1993-94 1994-95 1995-96
100% 100% 100%
0%
20%
40%
60%
80%
100%
Per
cent
of
Exp
ort
Pric
e
Market Share Cost of Intermediation
Source: Winter-Nelson and Temu (2002).
In some cases formal barriers can be dismantled directly (as in Tanzania), but in others the intermediary possesses political power that can be used to prevent any lowering of the formal barriers. In some ways this is similar to the dilemma China faced in the early 1980s: How to create the correct economic incentives while minimizing harm to (and thus resistance from) entrenched interests? In China the solution was to “grow out of the plan,” that is, to freeze quotas for sales to monopsony purchasers in absolute terms while allowing firms to sell above-quota output at market prices. This created the correct economic incentives at the margin. Applying this logic to the coffee context, it might be possible to negotiate an arrangement with entrenched monopsony purchasers whereby marginal output could be sold to other intermediaries.
The second category of barriers to entry is economies of scale and scope. In Tanzania such barriers exist because of regulatory vestiges of the ICA regime. For example, Ponte (2001) describes how difficult it is for private firms to obtain coffee-export licenses. The bureaucracy associated with this process means that larger firms have an advantage, so an economy of scale exists. Hence, the market share (and bargaining power) of the top five exporters is greater in Tanzania than elsewhere in East Africa (see Figure 9). These economies of scale would be expected to slowly disappear as liberalization progresses.
More complex are economies of scale and scope in quality and credit assessment. In Tanzania competition among private traders led to the demise of the multistage payment mechanism in favor of a single, upfront payment to growers. Unfortunately, traders were unable to determine the quality of

FALL 2002 CHAZEN WEB JOURNAL OF INTERNATIONAL BUSINESS 19
the beans when they were first delivered. In a classic example of adverse selection, traders were willing to pay only the price appropriate for average quality coffee—so growers, acting rationally, stopped supplying high-quality beans and, in a vicious cycle, the average quality declined. Ponte (2001) argues that this information problem was a major factor in the slide in export prices of Tanzanian coffee since liberalization (another contributing factor being the depreciation of the shilling, which probably led to underuse of imported agrochemical inputs). Ponte expects estate production to increase at the expense of smallholders as large traders integrate vertically in order to guarantee high-quality sources of supply.
A similar situation emerged in the credit markets. According to Winter-Nelson and Temu (2002), the costs of screening, monitoring and enforcing coffee-finance contracts have risen so significantly since liberalization that 51 percent of growers had no access to finance, whether from nonfarm income, income transfers or credit from formal institutions, shopkeepers, friends or relatives in 1995 and 1996. During the TCMB regime—when credit, input and output transactions were linked—the comparable figure would have been close to zero. Credit has also become scarcer for local traders and processors; in many countries multinational corporations (MNCs), which do not have to rely on domestic financial markets, now play a greater role in these activities (Ponte 2002). In Tanzania vertical integration by MNCs has reduced competition among buyers at several points in the chain. For example, export auctions still exist, but most coffee is simply repurchased by the company that delivered it to the auction. MNCs accounted for 56 percent of total auction purchases in 1999–2000, up from 42 percent in 1994–95 (Ponte 2001).
These economies of scale and scope are not unique to Tanzania. For example, Mosheim (2002) found that farms supplying privately owned coffee-processing facilities in Costa Rica were, on average, three times as large as those supplying facilities owned by cooperatives and that privately owned processing facilities were correspondingly more scale efficient. More generally, Biglaiser (1993) suggests that middlemen tend to be found in markets in which it would be expensive for buyers to develop critical market knowledge themselves. On the other hand, Li (1998) argues that if this knowledge is too expensive, then middlemen have an incentive to cheat, and the market for intermediaries will break down.
The existence of these economies of scale and scope implies that the intermediary markets, left to themselves, would naturally consolidate, thereby increasing the bargaining power of middlemen over growers. Winter-Nelson and Temu’s study (2002) concludes that, on average, lower processing and intermediation costs in Tanzania more than offset higher transaction costs in the credit markets, meaning that growers are better off since liberalization. Nevertheless, the existence of these economies is probably the single most important factor explaining the power imbalances in the coffee commodity chain today, and it is strong grounds for intervention by governments or NGOs.
The question is what form the intervention should take. The inefficiency of the parastatals during the ICA regime—and of Fair Trade today—and the theoretical importance of middlemen in this

FALL 2002 CHAZEN WEB JOURNAL OF INTERNATIONAL BUSINESS 20
supply chain suggest that disintermediation is not the answer. In this context, the experience of the milk industry in India, as reported by the World Bank (1999), is relevant. It is a case study of successful intervention in an industry beset by many of the same problems as the Tanzanian coffee industry.
In India in the 1950s, many vendors supplied milk to consumers, but no vendor was large enough to have a recognized brand. Consumers knew that unscrupulous vendors sometimes diluted milk with water but could not tell pure milk from diluted milk at the time of purchase. Hence, they were unwilling to pay premium prices for any milk, and even honest vendors received no benefit for supplying undiluted milk. Quality fell and consumption stagnated until the National Dairy Development Board introduced “Operation Flood” in the 1970s. The centerpiece of this program was supplying a small, inexpensive machine that measured the concentration of butterfat in milk to vendors at each stage of the supply chain. This immediately attenuated the incentive for vendors to dilute milk, so quality began to rise. Operation Flood also included subsidies for cooperatives that used veterinary services to help improve quality as well as a program aimed at introducing brand names for cooperatives. As quality improved, consumers began buying more milk: consumption per capita rose by 25 percent from 1960 to 1985 (NDDB 2002). Taken together, these measures were responsible for doubling the incomes of a million milk producers in target areas by 1979.
The priority in the coffee supply chain, then, should be to find interventions that overcome the information problems that ultimately lead to consolidation. At least two kinds of intervention might succeed. The first would be to improve the ability of middlemen to assess coffee quality, either by providing equipment (as in India) or through training. In Tanzania there was evidence that middlemen—who had never purchased coffee from cooperatives during the ICA regime—were becoming more skilled as liberalization progressed, suggesting that the problems observed by Ponte (2001) might have been partly transitional. Nevertheless, middlemen had not yet sufficiently improved their skills so as to arrest the decline in quality, which suggests that other interventions would be valuable.
A second possibility would be to reestablish the link between grower and export prices that was severed by liberalization. For example, traders could be forced to track and publish the export prices of the quality they purchased from cooperatives. Growers would presumably demand higher prices for better-quality coffee, and middlemen would co mpete on the basis of the efficiency of their operations. Ultimately a multistage payment system could emerge, similar in this respect to the TCMB system but operated by private firms. For intermediaries, the economy of scope in quality assessment would disappear, and for growers, there would once again be an incentive to improve quality. As quality rose and intermediary markets became more efficient, one would expect grower prices to rise more quickly than export prices.

FALL 2002 CHAZEN WEB JOURNAL OF INTERNATIONAL BUSINESS 21
4.2. Increase Export Price by Improving Perceived Quality
As the Tanzanian experience shows, creating the proper quality incentives is a key aspect of a successful microeconomic solution to supply-chain inefficiency. But merely creating these incentives may be insufficient to protect growers in the long term. In a review of several agricultural supply chains also characterized by low barriers to entry and mature technologies, Gibbon (2001) observes unrelenting price pressure even for high-quality producers. A more sustainable approach might be to “brand” coffee by region or even estate, marketing coffee in much the same way as wine. Product differentiation would create barriers to entry, protecting growers, improving their bargaining power vis-à-vis buyers and supporting premium prices. The increasing availability of “single-origin” coffee shows that this is already occurring to some extent, and success stories exist: for example, Ponte (2001) describes the high premiums that Tanzanian “Kilimanjaro Milds” command in the Japanese market.
This option appears particularly attractive because it attempts to address the power imbalances between producing countries and consuming countries rather than just those imbalances within the producing countries. But successful brand development probably presumes improvements in domestic supply-chain efficiency. Fairbanks and Lindsay (1997) stress that in order to earn premium prices, producers must develop closer links to the market and engage in continuous upgrading of quality. Doing so relies on capital investment and the free flow of market information, so it may be unrealistic in a supply chain characterized by low margins, power imbalances and mutual distrust. In any case, achieving this level of differentiation is a long-term undertaking; as Ponte (2002) argues, “New initiatives should be aimed at ‘cultivating’ consumers rather than more coffee” (1122).
Finally, it is important to remember that no matter how efficient the supply chain, there is clearly a price for each grower at which coffee production becomes uneconomical. Several recent studies have focused on the complexities surrounding a grower’s decision to switch crops. For example, in a study of how pineapple farmers in Ghana learn about new agricultural technologies, Udry and Conley (2002) find that decisions are typically based upon information gathered in interactions with a very narrow social network. This slows the adoption of new technologies even when the economic “answer” is relatively unambiguous. Given the chronic oversupply in the world coffee market, the most effective way to assist many growers might be to explore other potential sources of income and to attempt to dismantle barriers to switching.
5. Conclusion
In this paper I have argued that Fair Trade is unlikely to achieve its long-term objective of improving the standard of living of coffee growers in developing countries. Fundamentally, this is because it does not address what I see as a root cause of low grower prices, namely the absence of competitive markets for intermediaries in coffee-producing countries. The Fair Trade premium is an inefficient subsidy that temporarily boosts returns but cannot be relied upon to stabilize or increase incomes in

FALL 2002 CHAZEN WEB JOURNAL OF INTERNATIONAL BUSINESS 22
the future. Given these circumstances, growers, NGOs and governments should consider a range of possible opportunities to enhance profits, including switching to other crops.
In October 2001, Procter & Gamble formally rejected a pitch to offer Fair Trade coffee, stating that the company was more interested in supporting farmers by giving aid. In January 2002, the company announced a $1.5 million gift to an NGO for projects “to help coffee-growing families, ranging from improving the quality of their coffee to exploring alternatives to coffee production.” Those who denounce P&G and its peers as purveyors of “sweatshop coffee” might do better to encourage more such donations—from consumers as well as roasters—than to promote Fair Trade.

FALL 2002 CHAZEN WEB JOURNAL OF INTERNATIONAL BUSINESS 23
References
Biglaiser, G. 1993. Middlemen as experts. Rand Journal of Economics 24 (2): 212–23.
Biglaiser, G., and J. W. Friedman. 1994. Middlemen as guarantors of quality. International Journal of Industrial Organization 12: 509–31.
———. 1999. Adverse selection with competitive inspection. Journal of Economics and Strategy 8 (1): 1–32.
Fairbanks, M., and S. Lindsay. 1997. Plowing the Sea. Cambridge, Mass.: HBS Press.
Gibbon, P. 2001. Upgrading primary production: A global commodity chain approach. World Development 29 (2): 345–63.
Giovannucci, D. 2001. Sustainable coffee survey of the North American specialty cof fee industry . Washington, D.C.: Specialty Coffee Association of America and Commission for Environmental Cooperation.
International Coffee Organization (ICO). Coffee statistics 2000.
James, D. 2000. Justice and java: Coffee and a fair trade market. NACLA Report on the Americas September/October.
Leclair, M. S. 2002. Fighting the tide: Alternative trade organizations in the era of global free trade. World Development 30 (6): 949–58.
Li, Y. 1998. Middlemen and private information. Journal of Monetary Economics 42: 131–59.
McMillan, J. 2002. Reinventing the bazaar: A natural history of markets. New York: W. W. Norton.
Mendoza, R. 2000. The hierarchical legacy in coffee commodity chains. In Rural development in Central America. Edited by R. Ruben and J. Bastiaensen. New York: St. Martin’s Press.
Mosheim, R. 2002. Organizational type and efficiency in the Costa Rican coffee processing sector. Journal of Comparative Economics 30: 296–316.
National Dairy Development Board (India) (NDDB). 2002. National statistics. Available at www.nddb.org.
Oxfam Great Britain. 2001. Bitter coffee: How the poor are paying for the slump in coffee prices. Available at www.oxfam.org.
Ponte, S. 2001. Coffee markets in East Africa: Local responses to global challenges or global responses to local challenges? CDR Working Paper 01.5.
———. 2002. The ‘Latte Revolution’? Regulation, markets and consumption in the global coffee chain. World Development 30 (7): 1099–122.
Specialty Coffee Association of America (SCAA). 1999 coffee market summary. Available at www.scaa.org.

FALL 2002 CHAZEN WEB JOURNAL OF INTERNATIONAL BUSINESS 24
Talbot, J. M. 1997. Where does your coffee dollar go?: The division of income and surplus along the coffee commodity chain. Studies in Comparative International Development 32 (1): 56–91.
Udry, C., and T. Conley. 2002. Social learning through networks: The adoption of new agricultural technologies in Ghana. American Journal of Agricultural Economics forthcoming.
UN Conference on Trade and Development (UNCTAD) (1995). Recent trends on the world coffee market. Study by the UNCTAD Secretariat.
Wang, N. 1999. Transaction costs and the structure of the market: A case study. American Journal of Economics and Sociology 58 (4): 783–805.
Winter-Nelson, A., and A. Temu. 2002. Institutional adjustment and transaction costs: Product and input markets in the Tanzanian coffee system. World Development 30 (4): 561–74.
World Bank. 1998. Box 5.1: Addressing information failures in India’s milk market. World Development Report 1998/99. Washington, D.C.: Oxford University Press.