an autonomous image based approach for detecting glacial ... · an autonomous image based approach...
TRANSCRIPT

AN AUTONOMOUS IMAGE BASED APPROACH FOR DETECTING GLACIAL LAKE OUTBURST FLOODS
R. Koschitzki, E. Schwalbe, H.-G. Maas
Institute of Photogrammetry and Remote Sensing, Technische Universität Dresden, Germany -
Commission V, WG V/5
KEY WORDS: image sequence, environmental monitoring, water line detection, glacier lake outburst flood ABSTRACT: The potential danger caused by glacier margin lakes and the related risk of glacier lake outburst floods (GLOF) increases constantly due to glaciers retreating in many parts of the world. Reasons for this development are on the one hand the new formation and enlargement of glacier margin lakes due to melt water. On the other hand, retreating and thinning glacier tongues lead to a decrease of the back pressure against the dammed glacier lakes. The paper describes the design of a photogrammetric GLOF monitoring system, based on monoscopic image sequence analysis for automatic detection of water level changes. The presented approach for measuring the water line in an image sequence is based on directional edge detection in LoG-filtered image data. After that, the water level is determined by a transformation of image measurements into object space based on orientation parameters of the camera and a geo-referenced lake basin model. The model can for instance be determined by photogrammetric methods after a GLOF; it may also be determined portion-wise by analysing shore lines at various water levels. Camera orientation parameters are determined by a local GPS-supported photogrammetric network. Comparing the determined water level changes with reference data provided by a water gauge, the precision is estimated in the order of one decimetre. A major challenge is the automatic detection of the water line in image sequences under varying light and visibility conditions. The paper will also discuss promising approaches such as multispectral images as well as a statistical analysis of grey value changes over short image sequences to eliminate disturbing reflections on the rough water surface.
1. INTRODUCTION
The glacier retreat in Chile is one of the main reasons for the increase of glacier lake outburst floods. In April 2008, the ice dammed glacier lake Cachet II drained catastrophically the first time and caused an immense damage by flooding parts of the Colonia River valley. The complete lake drainage took about 24-48 hours and was connected with an enormous increase of downstream water levels, thus causing a significant environmental risk for the concerned regions (Casassa et al., 2008; Dussaillant et al., 2010). Since the first GLOF, Lago Cachet II drains approximately one to three times a year and thus provides a good basis to explore the phenomena and the development of a monitoring system for early warning. Conventional gauges or GPS buoys in glacier margin lakes are usually prone to damage by GLOF events or ice drift on the water surface. Compared to those, a camera-based early warning system promises many advantages; it can be installed away from the lake basin without any contact to the lake shore and is not affected by ice fall, landslides or the water level drop during the GLOF. The basic ideas of such a system are detecting the water line in the images and transforming it to a metric water level by an intersection with a local terrain model.
2. DATA ACQUISITION
2.1 Study area
Figure 1. Satellite image (Sept. 2013) of the drained Lago Cachet II and its drainage path to Baker River (USGS).
0 5 km
The International Archives of the Photogrammetry, Remote Sensing and Spatial Information Sciences, Volume XL-5, 2014ISPRS Technical Commission V Symposium, 23 – 25 June 2014, Riva del Garda, Italy
This contribution has been peer-reviewed.doi:10.5194/isprsarchives-XL-5-337-2014 337
Lago Cachet II is located in the Northern Patagonian Ice Field in Chile. It is dammed on its southern lakeside by the Colonia Glacier and contains a water volume of approximately 200 Mio m³ (Casassa et al., 2008). During a GLOF event, the water drains over a distance of 8 km through a tunnel forming at the bottom of the Colonia Glacier and flows down the Colonia River to the confluence with Baker River (figure 1). 2.2 Camera specifications
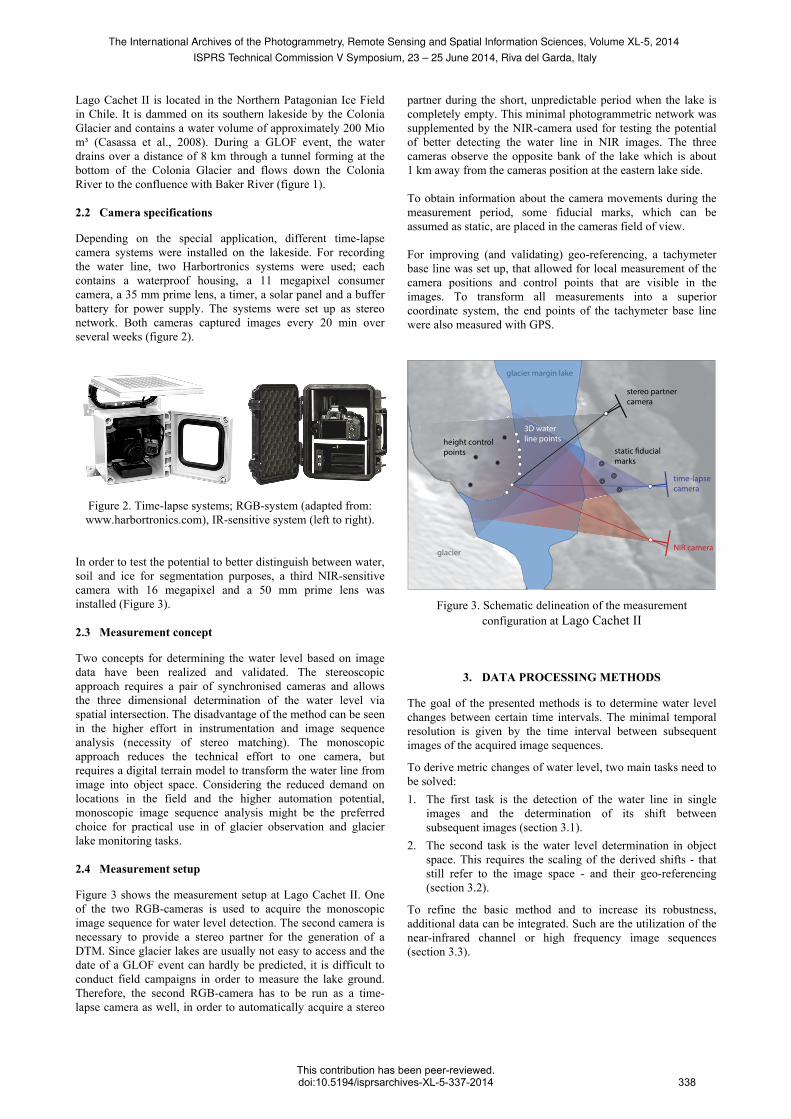
Depending on the special application, different time-lapse camera systems were installed on the lakeside. For recording the water line, two Harbortronics systems were used; each contains a waterproof housing, a 11 megapixel consumer camera, a 35 mm prime lens, a timer, a solar panel and a buffer battery for power supply. The systems were set up as stereo network. Both cameras captured images every 20 min over several weeks (figure 2).
Figure 2. Time-lapse systems; RGB-system (adapted from: www.harbortronics.com), IR-sensitive system (left to right).
In order to test the potential to better distinguish between water, soil and ice for segmentation purposes, a third NIR-sensitive camera with 16 megapixel and a 50 mm prime lens was installed (Figure 3). 2.3 Measurement concept
Two concepts for determining the water level based on image data have been realized and validated. The stereoscopic approach requires a pair of synchronised cameras and allows the three dimensional determination of the water level via spatial intersection. The disadvantage of the method can be seen in the higher effort in instrumentation and image sequence analysis (necessity of stereo matching). The monoscopic approach reduces the technical effort to one camera, but requires a digital terrain model to transform the water line from image into object space. Considering the reduced demand on locations in the field and the higher automation potential, monoscopic image sequence analysis might be the preferred choice for practical use in of glacier observation and glacier lake monitoring tasks. 2.4 Measurement setup
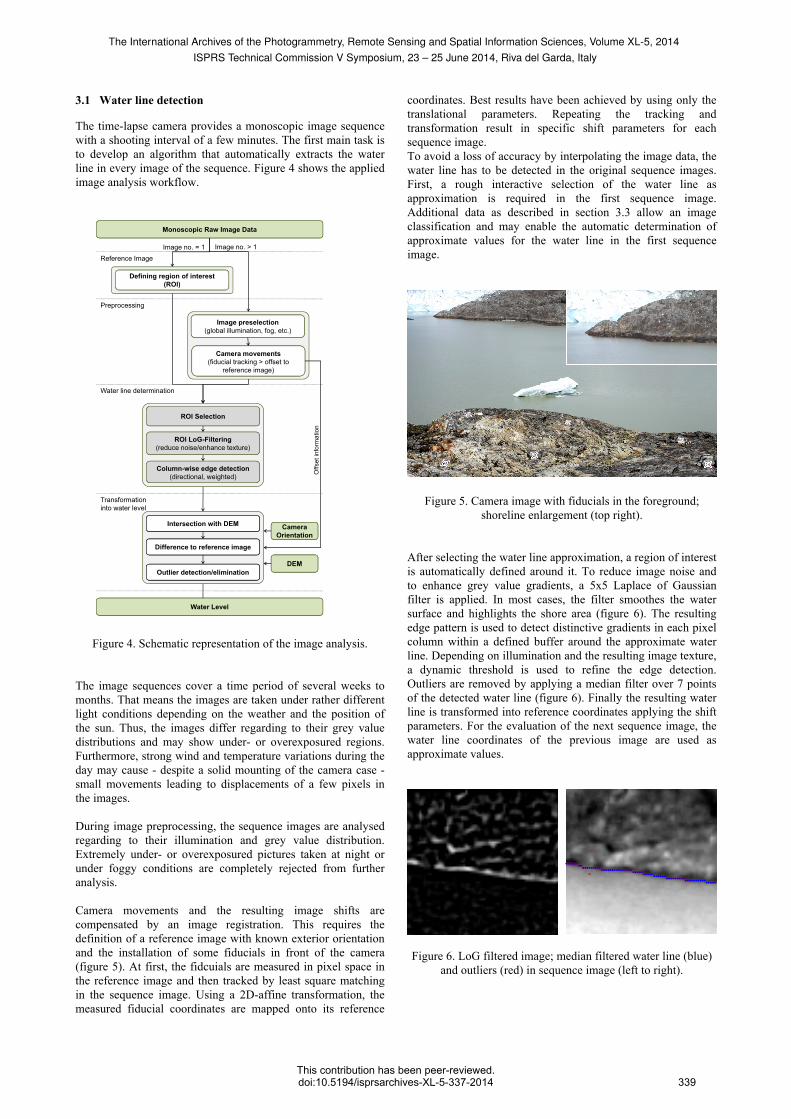
Figure 3 shows the measurement setup at Lago Cachet II. One of the two RGB-cameras is used to acquire the monoscopic image sequence for water level detection. The second camera is necessary to provide a stereo partner for the generation of a DTM. Since glacier lakes are usually not easy to access and the date of a GLOF event can hardly be predicted, it is difficult to conduct field campaigns in order to measure the lake ground. Therefore, the second RGB-camera has to be run as a time-lapse camera as well, in order to automatically acquire a stereo
partner during the short, unpredictable period when the lake is completely empty. This minimal photogrammetric network was supplemented by the NIR-camera used for testing the potential of better detecting the water line in NIR images. The three cameras observe the opposite bank of the lake which is about 1 km away from the cameras position at the eastern lake side. To obtain information about the camera movements during the measurement period, some fiducial marks, which can be assumed as static, are placed in the cameras field of view. For improving (and validating) geo-referencing, a tachymeter base line was set up, that allowed for local measurement of the camera positions and control points that are visible in the images. To transform all measurements into a superior coordinate system, the end points of the tachymeter base line were also measured with GPS.
time-lapse camera
stereo partnercamera
static fiducial marks
height control points
NIR camera
glacier margin lake
glacier
3D water line points
Figure 3. Schematic delineation of the measurement configuration at Lago Cachet II
3. DATA PROCESSING METHODS
The goal of the presented methods is to determine water level changes between certain time intervals. The minimal temporal resolution is given by the time interval between subsequent images of the acquired image sequences.
To derive metric changes of water level, two main tasks need to be solved:
1. The first task is the detection of the water line in single images and the determination of its shift between subsequent images (section 3.1).
2. The second task is the water level determination in object space. This requires the scaling of the derived shifts - that still refer to the image space - and their geo-referencing (section 3.2).
To refine the basic method and to increase its robustness, additional data can be integrated. Such are the utilization of the near-infrared channel or high frequency image sequences (section 3.3).
The International Archives of the Photogrammetry, Remote Sensing and Spatial Information Sciences, Volume XL-5, 2014ISPRS Technical Commission V Symposium, 23 – 25 June 2014, Riva del Garda, Italy
This contribution has been peer-reviewed.doi:10.5194/isprsarchives-XL-5-337-2014 338
3.1 Water line detection
The time-lapse camera provides a monoscopic image sequence with a shooting interval of a few minutes. The first main task is to develop an algorithm that automatically extracts the water line in every image of the sequence. Figure 4 shows the applied image analysis workflow.
Monoscopic Raw Image Data
Reference Image
Defining region of interest
Image no. = 1 Image no. > 1
Image preselection(global illumination, fog, etc.)
Preprocessing
Defining region of interest(ROI)
Camera movements(fiducial tracking > offset to
reference image)
Water line determination
ROI Selection
ROI LoG-Filtering(reduce noise/enhance texture)
nfor
mat
ion
Column-wise edge detection (directional, weighted)
Transformation into water level
Offs
et in
Intersection with DEM
DEM
Camera Orientation
Difference to reference image
Water Level
Outlier detection/elimination
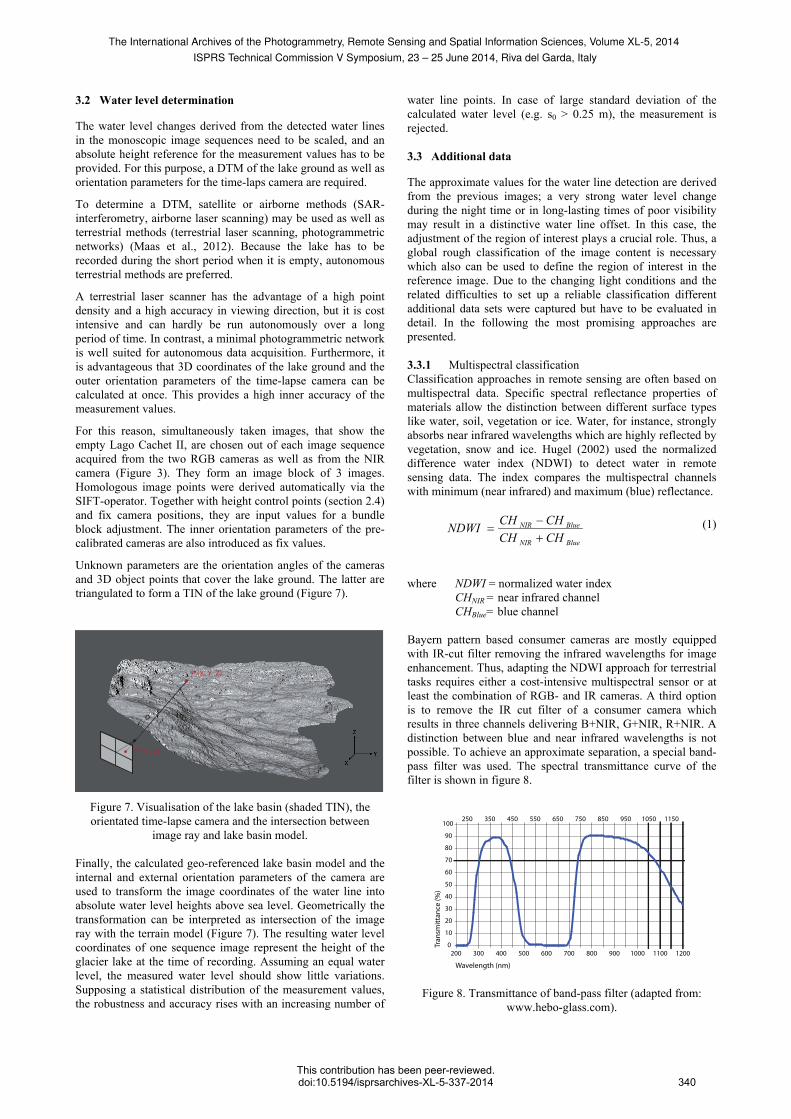
Figure 4. Schematic representation of the image analysis. The image sequences cover a time period of several weeks to months. That means the images are taken under rather different light conditions depending on the weather and the position of the sun. Thus, the images differ regarding to their grey value distributions and may show under- or overexposured regions. Furthermore, strong wind and temperature variations during the day may cause - despite a solid mounting of the camera case - small movements leading to displacements of a few pixels in the images. During image preprocessing, the sequence images are analysed regarding to their illumination and grey value distribution. Extremely under- or overexposured pictures taken at night or under foggy conditions are completely rejected from further analysis. Camera movements and the resulting image shifts are compensated by an image registration. This requires the definition of a reference image with known exterior orientation and the installation of some fiducials in front of the camera (figure 5). At first, the fidcuials are measured in pixel space in the reference image and then tracked by least square matching in the sequence image. Using a 2D-affine transformation, the measured fiducial coordinates are mapped onto its reference
coordinates. Best results have been achieved by using only the translational parameters. Repeating the tracking and transformation result in specific shift parameters for each sequence image. To avoid a loss of accuracy by interpolating the image data, the water line has to be detected in the original sequence images. First, a rough interactive selection of the water line as approximation is required in the first sequence image. Additional data as described in section 3.3 allow an image classification and may enable the automatic determination of approximate values for the water line in the first sequence image.
After selecting the water line approximation, a region of interest is automatically defined around it. To reduce image noise and to enhance grey value gradients, a 5x5 Laplace of Gaussian filter is applied. In most cases, the filter smoothes the water surface and highlights the shore area (figure 6). The resulting edge pattern is used to detect distinctive gradients in each pixel column within a defined buffer around the approximate water line. Depending on illumination and the resulting image texture, a dynamic threshold is used to refine the edge detection. Outliers are removed by applying a median filter over 7 points of the detected water line (figure 6). Finally the resulting water line is transformed into reference coordinates applying the shift parameters. For the evaluation of the next sequence image, the water line coordinates of the previous image are used as approximate values.
Figure 6. LoG filtered image; median filtered water line (blue)
and outliers (red) in sequence image (left to right).
Figure 5. Camera image with fiducials in the foreground; shoreline enlargement (top right).
The International Archives of the Photogrammetry, Remote Sensing and Spatial Information Sciences, Volume XL-5, 2014ISPRS Technical Commission V Symposium, 23 – 25 June 2014, Riva del Garda, Italy
This contribution has been peer-reviewed.doi:10.5194/isprsarchives-XL-5-337-2014 339
3.2 Water level determination
The water level changes derived from the detected water lines in the monoscopic image sequences need to be scaled, and an absolute height reference for the measurement values has to be provided. For this purpose, a DTM of the lake ground as well as orientation parameters for the time-laps camera are required.
To determine a DTM, satellite or airborne methods (SAR- interferometry, airborne laser scanning) may be used as well as terrestrial methods (terrestrial laser scanning, photogrammetric networks) (Maas et al., 2012). Because the lake has to be recorded during the short period when it is empty, autonomous terrestrial methods are preferred.
A terrestrial laser scanner has the advantage of a high point density and a high accuracy in viewing direction, but it is cost intensive and can hardly be run autonomously over a long period of time. In contrast, a minimal photogrammetric network is well suited for autonomous data acquisition. Furthermore, it is advantageous that 3D coordinates of the lake ground and the outer orientation parameters of the time-lapse camera can be calculated at once. This provides a high inner accuracy of the measurement values.
For this reason, simultaneously taken images, that show the empty Lago Cachet II, are chosen out of each image sequence acquired from the two RGB cameras as well as from the NIR camera (Figure 3). They form an image block of 3 images. Homologous image points were derived automatically via the SIFT-operator. Together with height control points (section 2.4) and fix camera positions, they are input values for a bundle block adjustment. The inner orientation parameters of the pre-calibrated cameras are also introduced as fix values.
Unknown parameters are the orientation angles of the cameras and 3D object points that cover the lake ground. The latter are triangulated to form a TIN of the lake ground (Figure 7).
P‘ (x‘, y‘)
D
P (X, Y, Z)
Figure 7. Visualisation of the lake basin (shaded TIN), the orientated time-lapse camera and the intersection between
image ray and lake basin model. Finally, the calculated geo-referenced lake basin model and the internal and external orientation parameters of the camera are used to transform the image coordinates of the water line into absolute water level heights above sea level. Geometrically the transformation can be interpreted as intersection of the image ray with the terrain model (Figure 7). The resulting water level coordinates of one sequence image represent the height of the glacier lake at the time of recording. Assuming an equal water level, the measured water level should show little variations. Supposing a statistical distribution of the measurement values, the robustness and accuracy rises with an increasing number of
water line points. In case of large standard deviation of the calculated water level (e.g. s0 > 0.25 m), the measurement is rejected. 3.3 Additional data
The approximate values for the water line detection are derived from the previous images; a very strong water level change during the night time or in long-lasting times of poor visibility may result in a distinctive water line offset. In this case, the adjustment of the region of interest plays a crucial role. Thus, a global rough classification of the image content is necessary which also can be used to define the region of interest in the reference image. Due to the changing light conditions and the related difficulties to set up a reliable classification different additional data sets were captured but have to be evaluated in detail. In the following the most promising approaches are presented. 3.3.1 Multispectral classification Classification approaches in remote sensing are often based on multispectral data. Specific spectral reflectance properties of materials allow the distinction between different surface types like water, soil, vegetation or ice. Water, for instance, strongly absorbs near infrared wavelengths which are highly reflected by vegetation, snow and ice. Hugel (2002) used the normalized difference water index (NDWI) to detect water in remote sensing data. The index compares the multispectral channels with minimum (near infrared) and maximum (blue) reflectance.
BlueNIR
BlueNIR
CHCH
CHCHNDWI
(1)
where NDWI = normalized water index CHNIR = near infrared channel
CHBlue= blue channel Bayern pattern based consumer cameras are mostly equipped with IR-cut filter removing the infrared wavelengths for image enhancement. Thus, adapting the NDWI approach for terrestrial tasks requires either a cost-intensive multispectral sensor or at least the combination of RGB- and IR cameras. A third option is to remove the IR cut filter of a consumer camera which results in three channels delivering B+NIR, G+NIR, R+NIR. A distinction between blue and near infrared wavelengths is not possible. To achieve an approximate separation, a special band-pass filter was used. The spectral transmittance curve of the filter is shown in figure 8.
Wavelength (nm)
250 350 450 550 650 750 850 950 1050 1150
Tran
smittan
ce (%
)
0
10
20
30
40
50
60
70
80
90
100
200 300 400 500 600 700 800 900 1000 1100 1200
Figure 8. Transmittance of band-pass filter (adapted from: www.hebo-glass.com).
The International Archives of the Photogrammetry, Remote Sensing and Spatial Information Sciences, Volume XL-5, 2014ISPRS Technical Commission V Symposium, 23 – 25 June 2014, Riva del Garda, Italy
This contribution has been peer-reviewed.doi:10.5194/isprsarchives-XL-5-337-2014 340
An image taken by the modified B+NIR camera and the NDWI (normalized to 8 bit) are shown in figure 9. A clear differentiation between water, soil and vegetation is visible. Further research will investigate its usefulness for an image classification that may support the water line detection.
Figure 9. Image of modified camera; grey value spread NDWI (top to bottom).
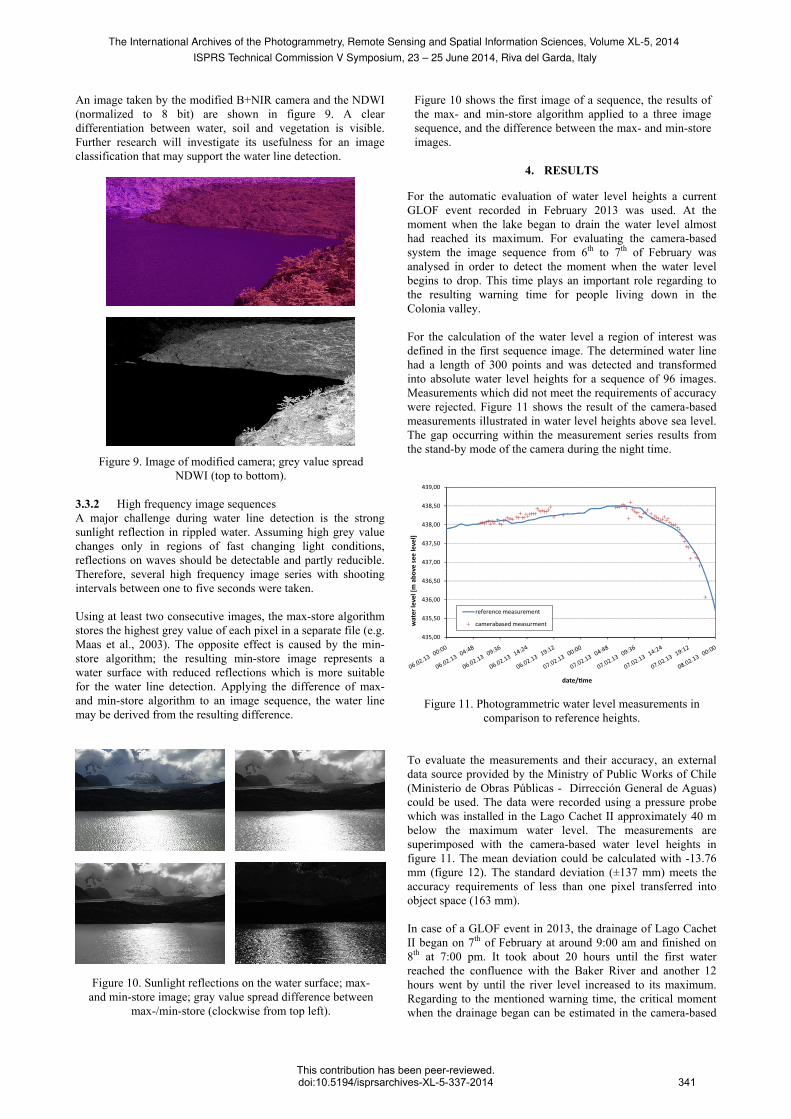
3.3.2 High frequency image sequences A major challenge during water line detection is the strong sunlight reflection in rippled water. Assuming high grey value changes only in regions of fast changing light conditions, reflections on waves should be detectable and partly reducible. Therefore, several high frequency image series with shooting intervals between one to five seconds were taken. Using at least two consecutive images, the max-store algorithm stores the highest grey value of each pixel in a separate file (e.g. Maas et al., 2003). The opposite effect is caused by the min-store algorithm; the resulting min-store image represents a water surface with reduced reflections which is more suitable for the water line detection. Applying the difference of max- and min-store algorithm to an image sequence, the water line may be derived from the resulting difference.
Figure 10. Sunlight reflections on the water surface; max- and min-store image; gray value spread difference between
max-/min-store (clockwise from top left).
Figure 10 shows the first image of a sequence, the results of the max- and min-store algorithm applied to a three image sequence, and the difference between the max- and min-store images.
4. RESULTS
For the automatic evaluation of water level heights a current GLOF event recorded in February 2013 was used. At the moment when the lake began to drain the water level almost had reached its maximum. For evaluating the camera-based system the image sequence from 6th to 7th of February was analysed in order to detect the moment when the water level begins to drop. This time plays an important role regarding to the resulting warning time for people living down in the Colonia valley. For the calculation of the water level a region of interest was defined in the first sequence image. The determined water line had a length of 300 points and was detected and transformed into absolute water level heights for a sequence of 96 images. Measurements which did not meet the requirements of accuracy were rejected. Figure 11 shows the result of the camera-based measurements illustrated in water level heights above sea level. The gap occurring within the measurement series results from the stand-by mode of the camera during the night time.
437,00
437,50
438,00
438,50
439,00
ve se
e le
vel]
435,00
435,50
436,00
436,50
wat
er le
vel [
m a
bov
date/�me
reference measurement
camerabased measurment
Figure 11. Photogrammetric water level measurements in comparison to reference heights.
To evaluate the measurements and their accuracy, an external data source provided by the Ministry of Public Works of Chile (Ministerio de Obras Públicas - Dirrección General de Aguas) could be used. The data were recorded using a pressure probe which was installed in the Lago Cachet II approximately 40 m below the maximum water level. The measurements are superimposed with the camera-based water level heights in figure 11. The mean deviation could be calculated with -13.76 mm (figure 12). The standard deviation (±137 mm) meets the accuracy requirements of less than one pixel transferred into object space (163 mm). In case of a GLOF event in 2013, the drainage of Lago Cachet II began on 7th of February at around 9:00 am and finished on 8th at 7:00 pm. It took about 20 hours until the first water reached the confluence with the Baker River and another 12 hours went by until the river level increased to its maximum. Regarding to the mentioned warning time, the critical moment when the drainage began can be estimated in the camera-based
The International Archives of the Photogrammetry, Remote Sensing and Spatial Information Sciences, Volume XL-5, 2014ISPRS Technical Commission V Symposium, 23 – 25 June 2014, Riva del Garda, Italy
This contribution has been peer-reviewed.doi:10.5194/isprsarchives-XL-5-337-2014 341

measurements with a deviation of less than five hours. Thus, the resulting warning time should be sufficient for initiating precautions.
20
25
30
er o
f mea
sure
men
ts []
0
5
10
15
-70 -60 -50 -40 -30 -20 -10 0 10 20 30 40 50 60 70
num
b
devia�on of the camera-based measurements from reference [cm]
Figure 12. Difference of camera-based measurements to reference heights; mean deviation (red line) and standard
deviation (grey range).
5. CONCLUSION AND OUTLOOK
The first camera system was installed at Lago Cachet II during a pilot study in 2009/10. With a shooting interval of one image per day the first sequences were evaluated manually reaching accuracies of a few decimetres. Since then several cameras with different recording tasks and intervals were added and further GLOF events could be recorded. A major progress has been made regarding to an automated data processing. The first approach detecting the water line automatically in a short image sequence excluding images taken under extreme light conditions was presented and the desired relative accuracy of a few decimetres could be proofed. Further investigations will focus on improving and stabilising the detection algorithm as one of the key elements regarding to accuracy of the early warning system. The evaluation of long term sequences is planned as one of the next steps. A global and comprehensive analysis of the sequence images within the pre-processing may enhance the number of processed images. By identifying critical regions reliably and excluding images partly from further analysis instead of the whole image the evaluation of currently rejected images could be possible. Furthermore, the integration of additional data like multispectral images or exposure sequences may increase the number of evaluable images and could improve the detection algorithm.
6. ACKNOWLEDGEMENTS
The GLOF project was funded by the German Research Foundation (DFG) and the Federal Ministry of Education and Research (BMBF). Special thanks go to the Institute of Planetary Geodesy (IPG) of TU Dresden for providing equipment and positioning data and to the Dirección General de Aguas (DGA) for providing reference data.
7. REFERENCES
Casassa, G., Leidich, J., Rivera, A., Wendt, J., Ordenes, F., Escobar, F., Guzmán, F., Carrasco, J., López, P., 2008. Sudden drainage of glacial Lake Cachet 2, Patagonia, EGU Alexander von Humboldt International Conference “The Andes: Challenge for Geosciences”. Santiago, Chile, Nov. 24-28 Dussaillant, A.; Benito, G.; Buytaert, W.; Carling, P.; Meier, C., Espinoza, F., 2010. Repeated glacial-lake outburst floods in Patagonia: an increasing hazard? Natural hazards, vol. 54, pp. 469-481. Harbortronics. http://www.harbourtronics.com (14 April 2014) Hebo, 2011. Color filter glass, http://www.hebo-glass.com /public/pdf/filtertypes_hebo.pdf (14 April 2014) Huggel, C., Kääb, A., Haeberli, W., Teysseire, P., Paul, F., 2002. Remote sensing based assessment of hazards from glacier lake outbursts: a case study in the Swiss Alps, Canadian Geotechnical Journal, vol. 39, pp. 316-330.
Maas, H.-G., Hentschel, B., Schreiber, F., 2003. An optical triangulation method for height measurements on water surfaces. El Hakim, S. (Ed.), Videometrics VIII , Electronic Imaging, SPIE Proceedings Series, vol. 5013, pp. 103–109 Maas, H.-G., Mulsow, C., Wendt, A., Casassa, G., 2012. Pilot Studies With A Photogrammetric Glacier Lake Outburst Flood Early Warning System. International Archives of Photogrammetry, Remote Sensing and Spatial Information Sciences, vol. 39, Part B5. Mulsow, C., Koschitzki, R., Maas, H.-G., 2013. Photogrammetric monitoring of glacier margin lakes. Proceedings of the International Workshop "The Role of Geomatics in Hydrogeological Risk". Padua, Italy. pp. 27-28. Casassa, G., Leidich, J., Rivera, A., Wendt, J., Ordenes, F., Escobar, F., López, P. 2008. Sudden drainage of glacial Lake Cachet 2, Patagonia. EGU von Humboldt conference, Nov 2008, Santiago, Chile.
The International Archives of the Photogrammetry, Remote Sensing and Spatial Information Sciences, Volume XL-5, 2014ISPRS Technical Commission V Symposium, 23 – 25 June 2014, Riva del Garda, Italy
This contribution has been peer-reviewed.doi:10.5194/isprsarchives-XL-5-337-2014 342