an assessment of the construct validity of ryv’s scales of psychological well-being...
TRANSCRIPT
Social Science Research 35 (2006) 1080–1102
www.elsevier.com/locate/ssresearch
Feature article
An assessment of the construct validity of RyV’s Scales of Psychological Well-Being: Method, mode,
and measurement eVects �
Kristen W. Springer a,b,¤, Robert M. Hauser a
a Department of Sociology and the Center for Demography of Health and Aging, University of Wisconsin-Madison, USA
b Department of Sociology, Rutgers University, USA
Available online 6 March 2006
Abstract
This study assesses the measurement properties of RyV’s Scales of Psychological Well-Being(RPWB)—a widely used instrument designed to measure six dimensions of psychological well-being.Analyses of self-administered RPWB data from three major surveys—Midlife in the United States(MIDUS), National Survey of Families and Households II, and the Wisconsin Longitudinal Study(WLS)—yielded very high overlap among the dimensions. These large correlations persisted evenafter eliminating several methodological sources of confounding, including question wording, ques-tion order, and negative item-wording. However, in MIDUS pretest and WLS telephone administrations,
� The research reported herein was supported by the National Institute on Aging (R01 AG-9775 and P01 AG-21079), by the William Vilas Estate Trust, and by the Graduate School of the University of Wisconsin-Madison.Computation was carried out using facilities of the Center for Demography and Ecology at the University of Wis-consin-Madison, which are supported by Center and Training Grants from the National Institute of Child Healthand Human Development and the National Institute on Aging. We thank Corey Keyes for reading an early draft,sharing data, and code from RyV and Keyes (1995), and most of all for his collaborative spirit. We thank CarolRyV for oVering useful information about the construction of well-being measures at an early stage of this project.We thank Dirk van Dierendonck for sharing the factor correlations from his 2004 Personality and IndividualDiVerences paper, Nora Cate SchaeVer for discussions of mode eVects, Tetyana Pudrovska for her keen editing ofTable 2b, and Joe Savard for technical assistance. We also appreciate the constructive comments of two anony-mous SSR reviewers. An earlier version of the paper was presented at the annual meetings of the Population As-sociation of America, 2003. The opinions expressed herein are those of the authors. The WLS, MIDUS, andNSFH II data used in these analyses are publicly available at the following websites: http://www.ssc.wisc.edu/wlsresearch/(WLS) and http://www.icpsr.umich.edu/access/index.html/ (MIDUS and NSFH).
* Corresponding author. Fax: +1 608 265 5389.E-mail address: [email protected] (K.W. Springer).
0049-089X/$ - see front matter © 2006 Elsevier Inc. All rights reserved.doi:10.1016/j.ssresearch.2005.07.004
K.W. Springer, R.M. Hauser / Social Science Research 35 (2006) 1080–1102 1081
correlations among the dimensions were much lower. Past research demonstrates that self-adminis-tered instruments provide more valid psychological measurements than telephone surveys, and wetherefore place more weight on the consistent results from the self-administered items. In sum, thereis strong evidence that RPWB does not have as many as six distinct dimensions, and researchersshould be cautious in interpreting its subscales.© 2006 Elsevier Inc. All rights reserved.
Keywords: Psychological well-being; Well-being; Measurement; Survey design; Polychoric correlations; Factoranalysis
1. Introduction
Health researchers have long moved past looking at mortality as the only health-relatedmeasure to examine a range of outcomes including morbidity, disability, quality of life, andpsychological well-being (PWB). Mental health research has often focused on negativehealth—for example on depression and anxiety. However, there is an increasing desire toexamine positive as well as negative aspects of mental health. Much of this research hasdrawn from the rich well of psychological literature on well-being.
Well-being has been studied extensively by social psychologists (Campbell, 1981; Ryanand Deci, 2001). While the distinct dimensions of well-being have been debated, the generalquality of well-being refers to optimal psychological functioning and experience. Twobroad psychological traditions have historically been employed to explore well-being. Thehedonic view equates well-being with happiness and is often operationalized as the balancebetween positive and negative aVect (Ryan and Deci, 2001; RyV, 1989b). The eudaimonicperspective, on the other hand, assesses how well people are living in relation to their trueselves (Waterman, 1993).
There is not a standard or widely accepted measure of either hedonic or eudaimonicwell-being, although commonly used instruments include Bradburn’s AVect Balance Scale(1969), Neugarten’s Life Satisfaction Index (1961), Rosenberg’s Self-Esteem Scale (1965),and a variety of depression instruments (Bradburn and Noll, 1969; Neugarten et al., 1961;Rosenberg, 1965). In addition, some scholars have pointed to the multidimensionality ofwell-being and believe that instruments should encompass both hedonic and eudaimonicwell-being (Compton et al., 1996; McGregor and Little, 1998; Ryan and Deci, 2001).
2. Conceptualizing a multidimensional model of well-being
Carol RyV has argued in several publications that previous perspectives on operational-izing well-being are atheoretical and decentralized (RyV, 1989a,b). To address this short-coming, she developed a new measure of psychological well-being that consolidatedprevious conceptualizations of eudaimonic well-being into a more parsimonious summary.The exact methods used to develop this measure and the speciWc theoretical foundationsunderlying each dimension have been thoroughly discussed elsewhere (RyV, 1989a,b).BrieXy, RyV’s Scales of Psychological Well-Being (RPWB) include the following six com-ponents of psychological functioning: a positive attitude toward oneself and one’s past life(self-acceptance), high quality, satisfying relationships with others (positive relations withothers), a sense of self-determination, independence, and freedom from norms (autonomy),
1082 K.W. Springer, R.M. Hauser / Social Science Research 35 (2006) 1080–1102
having life goals and a belief that one’s life is meaningful (purpose in life), the ability tomanage life and one’s surroundings (environmental mastery), and being open to new expe-riences as well as having continued personal growth (personal growth).1
RPWB was originally validated on a sample of 321 well-educated, socially connected,Wnancially comfortable, and physically healthy men and women (RyV, 1989b). In this studya 20-item scale was used for each of the six constructs, with approximately equal numbersof positively and negatively worded items. The internal consistency coeYcients were quitehigh (between 0.86 and 0.93) and the test–retest reliability coeYcients for a subsample ofthe participants over a six week period were also high (0.81–0.88).
Examining the intercorrelations of RPWB subscales provides a cursory test of the mul-tidimensionality of RPWB. In RyV’s (1989b) article, the subscale intercorrelations rangedfrom 0.32 to 0.76. The largest correlations were between self-acceptance and environmentmastery (0.76), self-acceptance and purpose in life (0.72), purpose in life and personalgrowth (0.72), and purpose in life and environmental mastery (0.66).2 As noted in thepaper, these high correlations can indicate a problem because: “as the coeYcients becomestronger, they raise the potential problem of the criteria not being empirically distinct fromone another” (RyV, 1989b, p. 1074). However, the author points to diVerential subscale agevariations as evidence that the dimensions are distinct—an issue that we are investigatingelsewhere (Pudrovska et al., 2005).
More rigorous tests of the theoretically proposed multidimensional model of RPWBrequire analytic techniques beyond scale intercorrelations. RyV and Keyes (1995)addressed this issue using Midlife in the United States (MIDUS) pretest data—a nationalprobability sample of 1108 men and women. Rather than testing the full scale, the authorsselected 3 of the original 20 items in each subscale “to maximize the conceptual breadth ofthe shortened scales (p. 720).” They report that “the shortened scales correlated from 0.70to 0.89 with 20-item parent scales. Each scale included both positively and negativelyphrased items” (p. 720). Respondents were interviewed by telephone, and RPWB itemswere administered using an unfolding technique—where respondents were Wrst asked ifthey agreed or disagreed with the statement and then were asked whether their (dis)agree-ment was strong, moderate, or slight. RyV and Keyes (1995) estimated conWrmatory factormodels by weighted least squares estimation in LISREL based on variance/covariancematrices produced by PRELIS to account for the non-normality of the data (Jöreskog andSörbom, 1988). However, the authors did not use polychoric correlation matrices; that is,they analyzed all variables as if they were continuous, not ordinal. They estimated severalmodels including a single-factor model, a six-factor model (with factors corresponding tothe proposed dimensions) and a second-order factor model with the six subdimensionalwell-being factors loading onto a general well-being factor. In addition, RyV and Keyes(1995) assessed the eVect of negative item-wording and positive item-wording on generalwell-being, though not in the six-factor or second-order six-factor model. Although none
1 When referring directly to RyV’s Scales of Psychological Well-Being we use the acronym RPWB and for thegeneral concept of psychological well-being we use the acronym PWB.
2 The other correlations were positive relations and self-acceptance (0.52), autonomy and self-acceptance (0.52),personal growth and self-acceptance (0.48), autonomy and positive relations (0.32), environmental mastery andpositive relations (0.45), purpose in life and positive relations (0.55), personal growth and positive relations (0.57),environmental mastery and autonomy (0.53), purpose in life and autonomy (0.46), personal growth and autono-my (0.39), and personal growth and environmental mastery (0.46).
K.W. Springer, R.M. Hauser / Social Science Research 35 (2006) 1080–1102 1083
of their models yielded a satisfactory Wt by conventional measures, the Bayesian Informa-tion Criterion (BIC) was consistently a large negative number, indicating satisfactorymodel Wt (Raftery, 1995). The authors concluded that a second-order factor model is thebest Wtting model (RyV and Keyes, 1995). However there are some large correlationsbetween their latent variables, indicating conceptual overlap among the subscales. Thelargest correlation, 0.85, is between environmental mastery and self-acceptance, suggestingthat these factors are largely measuring the same concept. The correlation of 0.85 meansthat 85% of the variance in these two constructs is in common (Jensen, 1971).
In defense, the authors note that these two concepts have diVerent age proWles, thusindicating that they may be distinct at diVerent stages of the life course. However, that life-course interpretation was not actually tested because the age variation occurred in a cross-sectional sample, not in repeated observations. RyV and Keyes’ (1995) estimates of correla-tions among the six latent dimensions of RPWB are reproduced in Table 1.
In addition to RyV and Keyes (1995), other scholars have also explored the measure-ment properties of RPWB in diverse samples. For example, a study by Clarke et al. (2001)used the Canadian Study of Health and Aging to examine the structure of RPWB in anolder sample (average age was 76) (Clarke et al., 2001). The authors used the same 18 itemsas RyV and Keyes (1995), but the items were administered orally in the home using a cuecard and analyzed using EQS with maximum likelihood estimation (personal communica-tion with Liz Sykes, 03/24/03). They began with a single-factor model, adding factors in aconsistent manner while assessing the model Wt at each stage. The authors found that a six-factor model Wt better than models with fewer factors, but the best Wtting model was amodiWed six-factor model that allowed four items (one each from four dimensions) to loadon their speciWed dimension and on another dimension. The factor correlations in the puresix-factor model ranged (in absolute value) from small to quite substantial (0.03 to 0.67).The authors conclude that their analyses “support the multidimensional structure of theRyV measure” (p. 86). The authors also note that results from their modiWed six-factormodel suggest areas for improvement in the 18 item model.
Not all structural analyses provide support for the multidimensionality of RPWB (Hill-son, 1997; Kafka and Kozma, 2002; Van Dierendonck, 2004). For example, Kafka andKozma (2002) examined RPWB, the Satisfaction With Life Scale (SWLS), and the Memo-rial University of Newfoundland Scale of Happiness (MUNSH) in a sample of 277 partici-pants ranging from 18 to 48 years old. Their version of RPWB contained the full set ofitems (20 per subscale) and was administered to university students in a self-report ques-tionnaire. The authors used principal-components analysis with varimax rotation. When
Table 1Correlations among latent constructs in a 3-indicator, 6-factor model for a nationally representative sample over25 years old. RyV and Keyes (1995)
Note. nD 928, aut, autonomy; env, environmental mastery; grow, personal growth; relat, positive relations; purp,purpose in life; acc, self-acceptance.
aut env grow relat purp acc
aut 1.00env 0.59 1.00grow 0.51 0.56 1.00relat 0.24 0.65 0.31 1.00purp 0.39 0.38 0.64 0.30 1.00acc 0.53 0.85 0.53 0.65 0.55 1.00
1084 K.W. Springer, R.M. Hauser / Social Science Research 35 (2006) 1080–1102
the number of factors was not speciWed, 15 factors were extracted. However, when theauthors limited the scale to six factors the factors did not correspond to the six dimensionsof RPWB. In an additional test, the authors examined a factor model with SWLS,MUNSH, and each dimension of RPWB. They extracted three factors with eigenvaluesgreater than 1. The Wrst factor had loadings above 0.60 for four RPWB scales (environ-mental mastery, self-acceptance, purpose in life, and personal growth) and accounted foralmost one-half of the variance. The second factor was primarily the MUNSH and SWLS,though environmental mastery and self-acceptance also had loadings above 0.40 on thisdimension. The Wnal factor had a loading of over 0.80 for autonomy and personal rela-tions. The authors conclude by saying “it would appear that the structure of [RPWB]3 islimited to face validity” (p. 186).
Van Dierendonck (2004) examined the factorial structure of a self-administered versionof RPWB in two Dutch samples—a group of 233 college students with a mean age of 22and a group of 420 community members with a mean age of 36. Van Dierendonck com-pared model Wt and factorial structure of 3-, 9-, and 14-item subscales of RPWB using LIS-REL 8.5 with covariance matrices and maximum likelihood estimation. The author foundthat across both samples, for all subscale sizes, the best Wtting model was a six-factor modelwith a single second-order factor. However, for the three-item scale in one of the samples, asecond-order Wve-factor model (with environmental mastery and self-acceptance together)did not Wt signiWcantly worse than the second-order six-factor model. Only the version withthree items per subscale, which had relatively low internal consistency, Wt reasonably well.Even there, modiWcation indices suggested allowing some items to load on two dimensions.According to Van Dierendonck, “the conclusions from the reliability analyses and the con-Wrmatory factor analyses are ambiguous. To reach an acceptable internal consistency,scales should be longer, whereas an (somewhat) acceptable factorial validity requires thescales to be short” (p. 636). Van Dierendonck found very high factor correlations amongself-acceptance, purpose in life, environmental mastery and personal growth, indicatingsubstantial overlap among these dimensions (personal communication with Dirk van Dier-endonck, 7/26/04).
RPWB has been administered in major studies, for example, the National Survey ofFamilies and Households II (NSFH II), the National Survey of Midlife in the UnitedStates (MIDUS), the Wisconsin Longitudinal Study (WLS), and the Canadian Study ofHealth and Aging (CSHA). In addition, the paper in which RPWB was developed (RyV,1989b) has been cited in more than 400 research papers. While many studies focus on thecomposite scale of RPWB, previous studies have modeled sub-dimensions of positive men-tal health operationalized as the separate subscales of RPWB—as if they are distinct, inde-pendent concepts (Marks, 1996, 1998). Given the substantive importance and wide-spreaduse of RPWB, as well as the fact that some studies treat RPWB subscales as distinct, it isimportant to understand the measurement properties of RPWB. There is mixed evidenceabout the dimensionality of RPWB, so it is surprising that the factorial structure of RPWBhas not been examined systematically in any of the large, widely used US surveys. Finally,the key study of the measurement of RPWB was conducted on items administered by tele-phone (RyV and Keyes, 1995), whereas most large-scale studies using this measure havebeen self-administered using paper and pencil.
3 In the text the authors actually wrote SPWB for RyV’s Scales of Psychological Well-Being.
K.W. Springer, R.M. Hauser / Social Science Research 35 (2006) 1080–1102 1085
The present paper explores the measurement properties of RPWB in self-administeredsurveys of the WLS, MIDUS, NSFH II as well as telephone data from the WLS. We startby examining the measurement properties of RPWB using the WLS mail data. The WLS isa particularly useful sample in which to explore RPWB because: (a) the sample is large,and 6282 graduates answered all of the mail questions in 1992–1993, (b) almost all of thegraduates were born in 1939, so we have a unique opportunity to look at how RPWBworks for individuals at midlife, and (c) the WLS administered RPWB items both by tele-phone and mail, thus allowing us to explore mode eVects.
To test the validity of our results and examine possible confounders, we employ a vari-ety of tests. First, using the WLS mail data, we explore whether measurement artifacts(negative wording and question ordering) could be driving our Wndings. We then turn toNSFH II and MIDUS to explore the generality of the WLS Wndings and to test whetherthe WLS results are artifacts of age truncation, educational truncation, a primarily whitesample, item selection, or something geographically distinct about Wisconsin. Finally, weassess mode eVects by analyzing the WLS telephone data.
3. Data
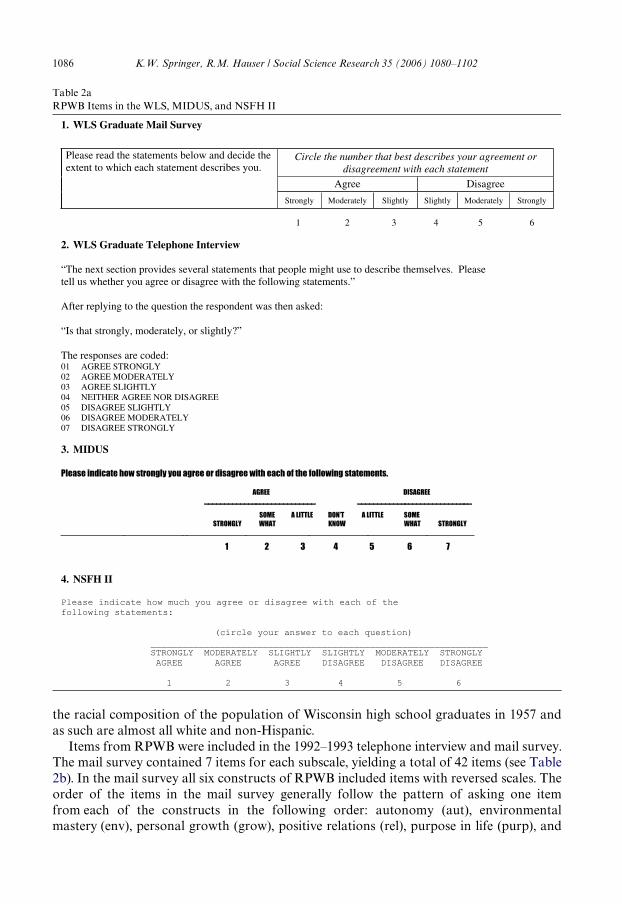
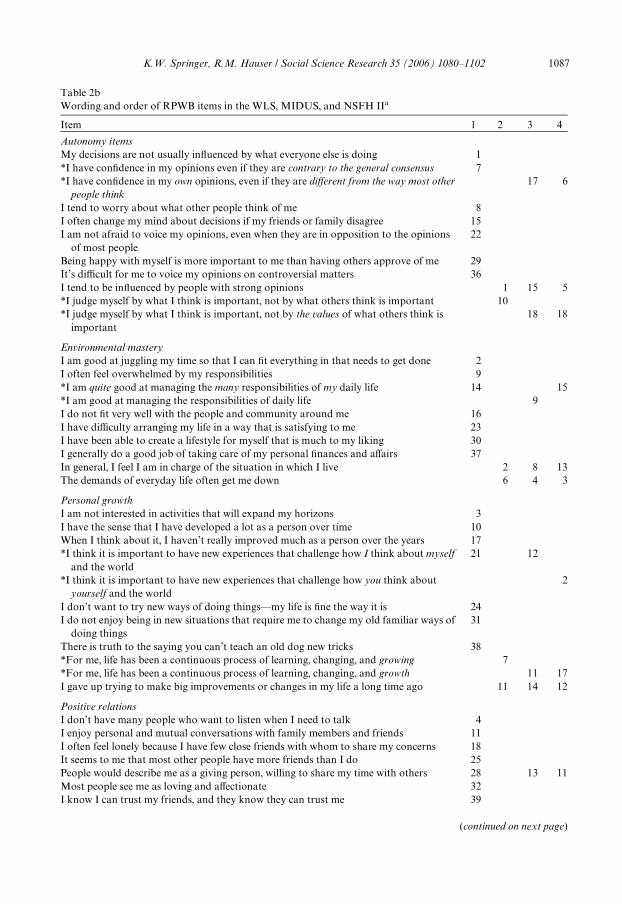
Items from RPWB were included in the WLS mail and telephone instruments,MIDUS mail, and NSFH II self-administered instruments. Before going into each studyin detail, an overview is warranted. It is important to point out the diVerences and simi-larities to fully assess the way measurement properties of RPWB may vary across sam-ples. Tables 2a and 2b show which items were asked on each survey, how they wereworded, how they were introduced, the order in which they were asked, and whatresponse categories were used. NSFH II and MIDUS contain the same 18 items—withsome slight wording diVerences, and those same items were administered by telephone inthe MIDUS pretest that was used by RyV and Keyes (1995). The WLS mail instrumentcontains 6 of the 18 NSFH II/MIDUS items in addition to 36 other items. The WLS tele-phone instrument contains the remaining 12 of the 18 NSFH II/MIDUS items. Also,note that the response categories are not identical across the surveys. The variability ofRPWB across these studies, in terms of question wording, number of items, item selec-tion, and item ordering provides an ideal situation to explore the structure of RPWB. Ifconsistent results are found across these several survey designs, we can be more conW-dent that our Wndings are due to a property of the scale, rather than something uniqueabout a speciWc sample or mode of administration.
3.1. WLS
The WLS has followed a random sample of 10,317 men and women who graduated in1957 from Wisconsin high schools (Sewell et al., 2004). Graduates were surveyed in 1957and then again in 1975. In 1977 the study design was expanded to collect information simi-lar to the 1975 survey for a highly stratiWed, random subsample of approximately 2000 sib-lings of the graduates. Between 1992 and 1994 another major wave of data collection wasundertaken. This included follow-up interviews with living graduates and with anexpanded sample of siblings. BrieXy, the WLS now has active samples of 8500 WLS gradu-ates and 5300 of their siblings. We report analyses for WLS graduates in this paper, butanalyses of the sibling data yielded essentially the same Wndings. WLS participants mirror
1086 K.W. Springer, R.M. Hauser / Social Science Research 35 (2006) 1080–1102
the racial composition of the population of Wisconsin high school graduates in 1957 andas such are almost all white and non-Hispanic.
Items from RPWB were included in the 1992–1993 telephone interview and mail survey.The mail survey contained 7 items for each subscale, yielding a total of 42 items (see Table2b). In the mail survey all six constructs of RPWB included items with reversed scales. Theorder of the items in the mail survey generally follow the pattern of asking one itemfrom each of the constructs in the following order: autonomy (aut), environmentalmastery (env), personal growth (grow), positive relations (rel), purpose in life (purp), and
Table 2aRPWB Items in the WLS, MIDUS, and NSFH II
K.W. Springer, R.M. Hauser / Social Science Research 35 (2006) 1080–1102 1087
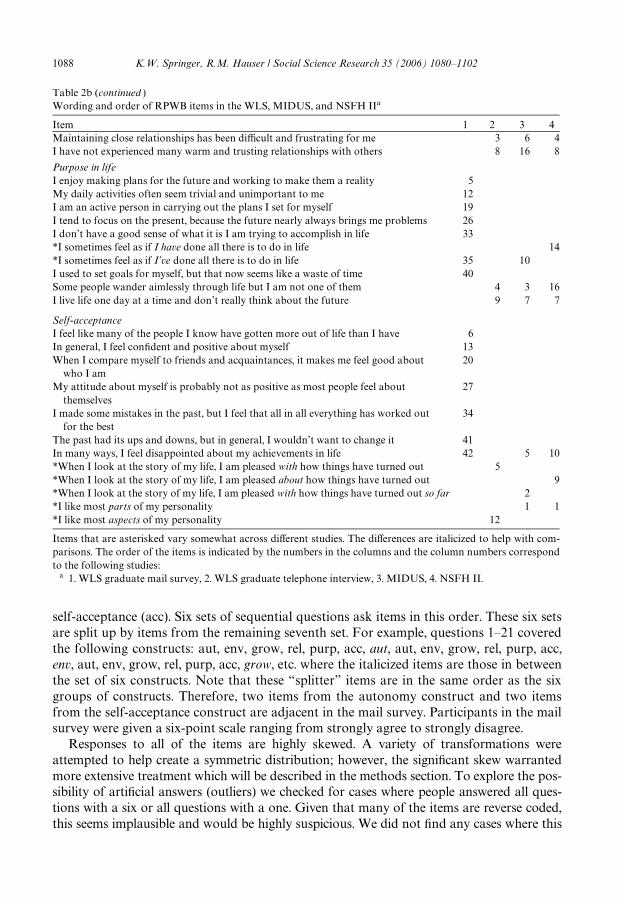
Table 2bWording and order of RPWB items in the WLS, MIDUS, and NSFH IIa
Item 1 2 3 4
Autonomy itemsMy decisions are not usually inXuenced by what everyone else is doing 1*I have conWdence in my opinions even if they are contrary to the general consensus 7*I have conWdence in my own opinions, even if they are diVerent from the way most other
people think17 6
I tend to worry about what other people think of me 8I often change my mind about decisions if my friends or family disagree 15I am not afraid to voice my opinions, even when they are in opposition to the opinions
of most people22
Being happy with myself is more important to me than having others approve of me 29It’s diYcult for me to voice my opinions on controversial matters 36I tend to be inXuenced by people with strong opinions 1 15 5*I judge myself by what I think is important, not by what others think is important 10*I judge myself by what I think is important, not by the values of what others think is
important18 18
Environmental masteryI am good at juggling my time so that I can Wt everything in that needs to get done 2I often feel overwhelmed by my responsibilities 9*I am quite good at managing the many responsibilities of my daily life 14 15*I am good at managing the responsibilities of daily life 9I do not Wt very well with the people and community around me 16I have diYculty arranging my life in a way that is satisfying to me 23I have been able to create a lifestyle for myself that is much to my liking 30I generally do a good job of taking care of my personal Wnances and aVairs 37In general, I feel I am in charge of the situation in which I live 2 8 13The demands of everyday life often get me down 6 4 3
Personal growthI am not interested in activities that will expand my horizons 3I have the sense that I have developed a lot as a person over time 10When I think about it, I haven’t really improved much as a person over the years 17*I think it is important to have new experiences that challenge how I think about myself
and the world21 12
*I think it is important to have new experiences that challenge how you think about yourself and the world
2
I don’t want to try new ways of doing things—my life is Wne the way it is 24I do not enjoy being in new situations that require me to change my old familiar ways of
doing things31
There is truth to the saying you can’t teach an old dog new tricks 38*For me, life has been a continuous process of learning, changing, and growing 7*For me, life has been a continuous process of learning, changing, and growth 11 17I gave up trying to make big improvements or changes in my life a long time ago 11 14 12
Positive relationsI don’t have many people who want to listen when I need to talk 4I enjoy personal and mutual conversations with family members and friends 11I often feel lonely because I have few close friends with whom to share my concerns 18It seems to me that most other people have more friends than I do 25People would describe me as a giving person, willing to share my time with others 28 13 11Most people see me as loving and aVectionate 32I know I can trust my friends, and they know they can trust me 39
(continued on next page)
1088 K.W. Springer, R.M. Hauser / Social Science Research 35 (2006) 1080–1102
self-acceptance (acc). Six sets of sequential questions ask items in this order. These six setsare split up by items from the remaining seventh set. For example, questions 1–21 coveredthe following constructs: aut, env, grow, rel, purp, acc, aut, aut, env, grow, rel, purp, acc,env, aut, env, grow, rel, purp, acc, grow, etc. where the italicized items are those in betweenthe set of six constructs. Note that these “splitter” items are in the same order as the sixgroups of constructs. Therefore, two items from the autonomy construct and two itemsfrom the self-acceptance construct are adjacent in the mail survey. Participants in the mailsurvey were given a six-point scale ranging from strongly agree to strongly disagree.
Responses to all of the items are highly skewed. A variety of transformations wereattempted to help create a symmetric distribution; however, the signiWcant skew warrantedmore extensive treatment which will be described in the methods section. To explore the pos-sibility of artiWcial answers (outliers) we checked for cases where people answered all ques-tions with a six or all questions with a one. Given that many of the items are reverse coded,this seems implausible and would be highly suspicious. We did not Wnd any cases where this
Table 2b (continued )Wording and order of RPWB items in the WLS, MIDUS, and NSFH IIa
Items that are asterisked vary somewhat across diVerent studies. The diVerences are italicized to help with com-parisons. The order of the items is indicated by the numbers in the columns and the column numbers correspondto the following studies:
a 1. WLS graduate mail survey, 2. WLS graduate telephone interview, 3. MIDUS, 4. NSFH II.
Item 1 2 3 4Maintaining close relationships has been diYcult and frustrating for me 3 6 4I have not experienced many warm and trusting relationships with others 8 16 8
Purpose in lifeI enjoy making plans for the future and working to make them a reality 5My daily activities often seem trivial and unimportant to me 12I am an active person in carrying out the plans I set for myself 19I tend to focus on the present, because the future nearly always brings me problems 26I don’t have a good sense of what it is I am trying to accomplish in life 33*I sometimes feel as if I have done all there is to do in life 14*I sometimes feel as if I’ve done all there is to do in life 35 10I used to set goals for myself, but that now seems like a waste of time 40Some people wander aimlessly through life but I am not one of them 4 3 16I live life one day at a time and don’t really think about the future 9 7 7
Self-acceptanceI feel like many of the people I know have gotten more out of life than I have 6In general, I feel conWdent and positive about myself 13When I compare myself to friends and acquaintances, it makes me feel good about
who I am20
My attitude about myself is probably not as positive as most people feel about themselves
27
I made some mistakes in the past, but I feel that all in all everything has worked out for the best
34
The past had its ups and downs, but in general, I wouldn’t want to change it 41In many ways, I feel disappointed about my achievements in life 42 5 10*When I look at the story of my life, I am pleased with how things have turned out 5*When I look at the story of my life, I am pleased about how things have turned out 9*When I look at the story of my life, I am pleased with how things have turned out so far 2*I like most parts of my personality 1 1*I like most aspects of my personality 12
K.W. Springer, R.M. Hauser / Social Science Research 35 (2006) 1080–1102 1089
occurred. There were 6875 respondents who responded to at least some of the RPWB items,and a total of 6282 respondents have complete data for all RPWB mail items.
The WLS telephone instrument contains 2 items from each scale for a total of 12 RPWBitems. These items are diVerent from those asked in the mail questionnaire. The two posi-tive relations items were both negatively worded, and the two self-acceptance items wereboth positively worded. The four other subscales contained one positively and one nega-tively worded item. The items were ordered randomly (see Table 2b). An unfolding tech-nique (Groves, 1989) was used during the telephone interview. As in the MIDUS pretest,participants were Wrst asked whether they agreed or disagreed with the statement and thenwere asked about the intensity of this belief (strong, moderate, or slight). There were 6038respondents with complete data on RPWB telephone items, which were administered in arandom 80% sample of the WLS interviews. As with WLS mail items we checked to see ifanyone answered all 1s or all 7s, but found that no one had done so. Neutral responseswere removed and categories were recoded to be consistent with the WLS mail survey.Interestingly, the distribution of the responses was bimodal and skewed, likely reXectingthe use of the unfolding technique.
3.2. MIDUS
MIDUS is a multistage probability sample of more than 3000 non-institutionalizedadults between the ages of 25 and 74 years old. Participants were selected based on ran-dom-digit dialing and were administered a telephone interview as well as two mail-backquestionnaires. Data were collected during 1994 and 1995. RPWB was included in oneof the mail questionnaires and contained 18 items in what appears to be a random order(see Table 2b). Response choices ranged from 1 to 7 (agree strongly, agree somewhat,agree a little, don’t know, disagree a little, disagree somewhat, and disagree strongly).As with the WLS, we looked for outliers and found that one person chose 1 for allitems. This individual was removed from the analyses. For the current project the mid-point “don’t know” category was recoded as missing data and the remaining categorieswere recoded from 1 to 6. There were 2731 cases with complete RPWB data. The major-ity of the items were unimodal and all were skewed to the left—that is most responseswere positive.
3.3. NSFH II
The NSFH began in 1987–1988 with a national sample of more than 10,000 households.In each household, a randomly selected adult was interviewed. The Wve year follow-up(NSFH II) was conducted in 1992–1994 and included data collection from 10,000 respon-dents, 5600 interviews with spouses/partners, 2400 interviews with children, and 3300 inter-views with parents. The focus of this project is on the main respondents. RPWB wasincluded in the self-administered health module completed during an in-home interview.RPWB contained the same 18 items as MIDUS arranged in a seemingly random order,though in a diVerent order than MIDUS (see Table 2b). As with the WLS, we checked foroutliers in the data and found that 12 people answered either all sixes or all ones. Thesepeople were removed from the analyses leaving 9240 NSHF II cases with complete data.The majority of the items were unimodal and all were skewed to the left—that is mostresponses were positive.
1090 K.W. Springer, R.M. Hauser / Social Science Research 35 (2006) 1080–1102
4. Methods
Our strategy for exploring the structure of RPWB was to begin with the WLS mail data,systematically assessing the model Wt and correlations of factors for a series of models start-ing with the single-factor model. Then, in order to test possible confounders and explanationsfor our Wndings, we ran a series of validity checks including tests for method artifacts, agetruncation, instrumentation issues, item selection problems, and cultural variation usingWLS, NSFH II, and MIDUS self-administered data as well as WLS graduate telephone data.
To explore the structural relationship of the items with their conceptual dimensions weestimated conWrmatory factor models using LISREL (Jöreskog and Sörbom, 1996a).4
However, LISREL may produce biased estimates if the variables are ordinal or non-nor-mal. In this case it is necessary to provide LISREL with polychoric correlation matricesand asymptotic variance/covariance matrices rather than simple covariance or correlationmatrices. To calculate polychoric correlations, PRELIS (Jöreskog and Sörbom, 1996b)treats each ordinal or non-normal variable as a crude measurement of an underlying,unobservable, continuous variable. In the case of ordinal data, these unobservable vari-ables have a multivariate normal distribution, and polychoric correlations are estimates ofthe correlations among these hypothetical, normally distributed, underlying variables. Weused PRELIS to estimate the polychoric correlations for all models. After obtaining thepolychoric correlations and the asymptotic variance/covariance matrix, we used weightedleast squares estimation in LISREL to obtain parameter estimates and model Wt statistics.In addition to examining minimum Wt �2 statistics, we used BIC to assess model Wt (Raf-tery, 1995). BIC statistics are a commonly used model Wt statistic, which account for sam-ple size and allow comparison of non-nested models. Smaller values of BIC representbetter Wtting models—with negative values preferred. SpeciWcally, when comparing mod-els, a BIC diVerence of ten or more provides very strong support for selecting the modelwith the smallest BIC value (Raftery, 1995).
5. Findings
5.1. WLS graduate mail items
To have a baseline we started out by running a single-factor model—a model with allindicators loading on one common factor. As shown in Table 3, the Wt for Model 3–1 isvery poor both by �2 and BIC standards. We next ran a six-factor model (with factors cor-responding to the proposed dimensions) allowing the latent variables to correlate (Model3–2). This model Wts very well compared to the single-factor model; �2 is 9036 with 804degrees of freedom. We next ran the second-order factor model (Model 3–3); here, the sixwell-being sub-factors load on a general PWB factor, and their disturbances are uncorre-lated. This second-order factor model (Model 3–3) does not Wt as well as the six-factormodel without a second-order factor (Model 3–2).
In panel 1 of Table 4 we present the correlations among latent variables in the six-factormodel (Model 3–2). There are very high correlations (in absolute value) among latent
4 We used LISREL versions 8.53–8.72 depending on the stage of analyses. The results do not vary across theseversions.

K.W. Springer, R.M. Hauser / Social Science Research 35 (2006) 1080–1102 1091
variables—particularly between self-acceptance and purpose in life (0.976), self-acceptanceand environmental mastery (0.971), and environmental mastery and purpose in life (0.958).Personal growth also correlated highly with self-acceptance (0.951), purpose in life (0.942),and environmental mastery (0.911).5
5.2. Testing for method eVects
We used the best Wtting model, the six-factor model (Model 3–2), as the baseline toexplore several possible method artifacts. First, we introduced a latent variable for nega-tively worded items (Model 3–4). A negatively worded item is one to which someone mustanswer “strongly disagree” to indicate positive well-being. One example from the auton-omy subscale is: “I tend to worry about what other people think of me.” To report a highdegree of autonomy one would have to report “strongly disagree”. By including a factorfor negative wording we test whether people answer items diVerently simply because theyare worded negatively. Indeed, some researchers have found that people provide inconsis-tent answers to negatively and positively worded items (Chapman and Tunmer, 1995;Marsh, 1986; Melnick and Gable, 1990; Pilotte and Gable, 1990). To carry out this test, weallowed all 22 negatively worded items to load on this factor as well as on their corre-sponding well-being dimensions. As Model 3–4 shows, including negative items vastlyimproves model Wt—resulting in a reduction of 1500 �2 and a BIC of 753 compared to 2004for the six-factor model. Clearly, this is the best Wtting model yet.
A second method artifact is correlated measurement error between adjacent items. Asexplained in the data section, the RPWB items were interspersed in a systematic manner—but probably one invisible to the participant. Nonetheless, we hypothesized that a responseto a particular question might aVect responses to the following, adjacent question. To testthis, we introduced correlated errors of measurement between all adjacent questions. Theresults of these analyses (Model 3–5) indicate a substantial improvement in Wt over the six-factor model.
5 Some of the factor correlations are negative, however we have reported the absolute value of all factor correlations.
Table 3Indices of Wt based on weighted least squares—WLS graduates (nD 6282)
�2 DF BIC
3–1. Single-factor model 10865.08 819 3702.563–2. Six-factor model with all psi correlated 9035.73 804 2004.393–3. Second-order, six-factor model 9199.43 813 2089.393–4. Six-factor model with a correlated negative factor 7539.77 776 753.313–5. Six-factor model with correlated errors for all adjacent questions 8141.15 763 1468.383–6. Model 3–4 and Model 3–5 combined 6660.05 735 232.153–7. Model 3–6 and three additional error correlations 5953.10 732 ¡448.563–8. Model 3–7 with one second-order factor 6176.04 746 ¡348.063–9. Model 3–7 with Wve correlated second-order factors: PWB1, aut, relat,
grow, and neg. PWB1 includes env, purp, and acc6226.68 743 ¡270.46
3–10. Model 3–7 with four correlated second-order factors: PWB1, aut,relat, and neg. PWB1 includes env, purp, acc, and grow
6383.16 747 ¡149.69
1092 K.W. Springer, R.M. Hauser / Social Science Research 35 (2006) 1080–1102
Model 3–6 combines the two method eVects tested in Model 3–4 and Model 3–5. AsTable 3 indicates, this model Wts better than all previous models with a �2 of 6660 and 735degrees of freedom, resulting in a BIC of 232. There were three very large modiWcationindices suggesting that the model would be substantially improved if a few changes weremade. SpeciWcally, the model suggested correlating the measurement error of three pairs ofitems. Before deciding whether or not to allow the pairs to correlate, it was essential todetermine whether there were plausible reasons for this. We believe there are for the fol-lowing reasons. First, each pair is in the same RPWB subscale, suggesting we might havesome items within RPWB dimensions that overlap greatly. Second, the manifest content ofthe paired items is similar. The two environment mastery questions are: “I am good at jug-gling my time so that I can Wt everything in that needs to get done” and “I am quite good atmanaging the many responsibilities of my daily life.” The two personal relations items are:“People would describe me as a giving person, willing to share my time with others” and“Most people see me as loving and aVectionate.” The personal growth items are: “I don’twant to try new ways of doing things—my life is Wne the way it is” and “I do not enjoybeing in new situations that require me to change my old familiar way of doing things.”
After allowing these items to correlate we lost three degrees of freedom but had a reduc-tion of 700 �2—a substantial improvement in Wt (see Model 3–7). This model yields a goodWt as indicated by a negative BIC (¡449). This model is shown in Fig. 1. It is important to
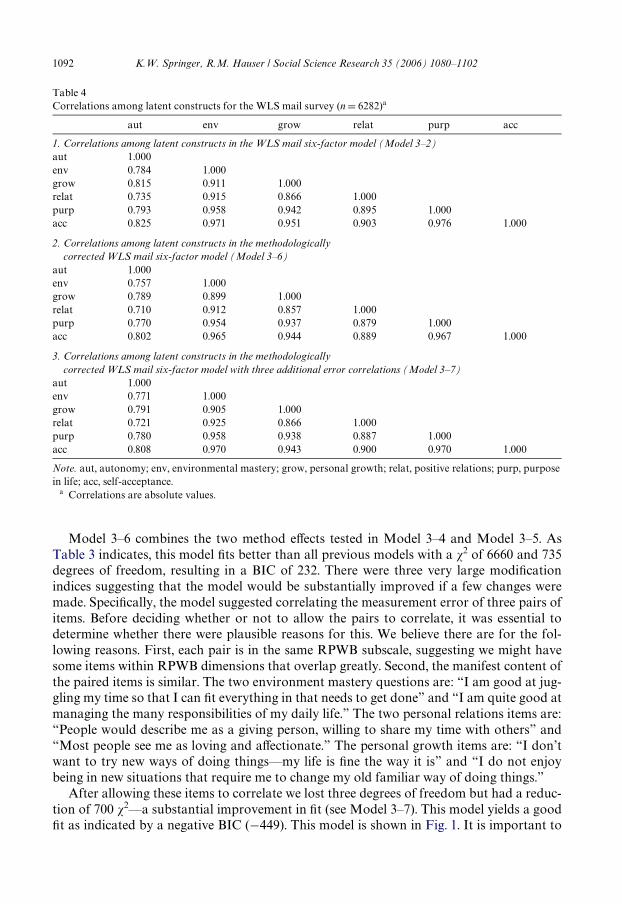
Table 4Correlations among latent constructs for the WLS mail survey (n D 6282)a
Note. aut, autonomy; env, environmental mastery; grow, personal growth; relat, positive relations; purp, purposein life; acc, self-acceptance.
a Correlations are absolute values.
aut env grow relat purp acc
1. Correlations among latent constructs in the WLS mail six-factor model (Model 3–2)aut 1.000env 0.784 1.000grow 0.815 0.911 1.000relat 0.735 0.915 0.866 1.000purp 0.793 0.958 0.942 0.895 1.000acc 0.825 0.971 0.951 0.903 0.976 1.000
2. Correlations among latent constructs in the methodologically corrected WLS mail six-factor model (Model 3–6)
aut 1.000env 0.757 1.000grow 0.789 0.899 1.000relat 0.710 0.912 0.857 1.000purp 0.770 0.954 0.937 0.879 1.000acc 0.802 0.965 0.944 0.889 0.967 1.000
3. Correlations among latent constructs in the methodologically corrected WLS mail six-factor model with three additional error correlations (Model 3–7)
aut 1.000env 0.771 1.000grow 0.791 0.905 1.000relat 0.721 0.925 0.866 1.000purp 0.780 0.958 0.938 0.887 1.000acc 0.808 0.970 0.943 0.900 0.970 1.000

K.W. Springer, R.M. Hauser / Social Science Research 35 (2006) 1080–1102 1093
look at the correlations among latent variables in the methodologically corrected models.Do the methodological corrections account for the high overlap among RPWB subscales?Panels 2 and 3 in Table 4 show the latent variable correlations for Models 3–6 and 3–7,respectively. Correlations for both models are included to enhance comparability with
Fig. 1. Preferred WLS model (Model 3–7). Note. Variable names correspond to the dimension and order of itemsas indicated in Table 2b (i.e., “GROW17” is the personal growth item listed as 17 in column 1 of Table 2b: “WhenI think about it, I haven’t really improved much as a person over the years”). Paths to the negative-item artifactfactor are dark to facilitate identifying negatively worded items.

1094 K.W. Springer, R.M. Hauser / Social Science Research 35 (2006) 1080–1102
NSFH II and MIDUS results (presented later) and to assess the impact of adding the threeadditional error correlations. As shown in both panels 2 and 3 of Table 4, we still Wnd veryhigh factor correlations. For example, in panel 3 of Table 4 the absolute value of thecorrelation between purpose in life and self-acceptance is (0.970), self-acceptance andenvironmental mastery (0.970), and purpose in life and environmental mastery (0.958). Wecan therefore rule out the possibility that three method artifacts—negative wording, adja-cency eVects, and item redundancy—are responsible for the high correlations among thefactors for these three latent subscales.
5.3. Further constraints
Using the best Wtting methodologically corrected model (Model 3–7) we also triedseveral constraints to see if a simpler model would better Wt the data. First, we added asecond-order factor to Model 3–7 and allowed all Wrst-order factors (including thenegative-item artifact factor) to load onto this second-order factor.6 This second-ordermethodologically corrected factor model (Model 3–8) does not Wt as well as the methodo-logically corrected model where all Wrst-order factors are allowed to correlate freely(Model 3–7), although Model 3–8 still Wts well by BIC standards (¡348).
Models 3–9 and 3–10 add further constraints to Model 3–7. Given the large correlationsbetween environmental mastery, purpose in life, and self-acceptance we wanted to test amodel where these three subscales were constrained to reXect only one factor. In Model 3–9 we constrained the disturbance variances of environmental mastery, purpose in life, andself-acceptance to zero, and allowed them all to load onto one second-order factor. Theother Wrst-order factors (autonomy, personal relations, personal growth, and the negative-item artifact) were each loaded onto their own corresponding second-order factor. Model3–9 therefore contains a total of Wve second-order factors which were allowed to correlatefreely—again, disturbances of the Wrst-order factors were not correlated. This modelallowed us to test whether we can consider environmental mastery, purpose in life and self-acceptance collectively as one dimension of RPWB after accounting for method eVects.Although Model 3–9 Wts well as indicated by BIC (¡270), it does not Wt as well as themethodologically corrected unconstrained model (Model 3–7). Consistent with the highlatent variable correlations found in previous models, personal growth is highly correlated(¡0.947) with the second-order factor which contains environmental mastery, purpose inlife and self-acceptance in Model 3–9. For this reason, we estimated Model 3–10, whichadds personal growth into the combined second-order factor, resulting in four freely corre-lated second-order factors. Model 3–10 Wts least well among the constrained models with aBIC of ¡147.
5.4. Additional validity checks: MIDUS and NSFH II
There are several other possible sources of the high latent variable intercorrelations thatwe estimated in the WLS mail survey. Item selection is one possibility. SpeciWcally, it is pos-sible that the items included in the WLS mail survey had more conceptual overlap than
6 We also examined a model with the six subdimensions loading onto one second-order factor and the negative-item factor loading onto its own second-order factor, with the two second-order disturbances allowed to corre-late. As expected, the model Wt is identical to the second-order factor model (Model 3–8).
K.W. Springer, R.M. Hauser / Social Science Research 35 (2006) 1080–1102 1095
other items—for example, those used by RyV and Keyes (1995). As explained above,NSFH II and MIDUS contain the same 18 items, and these are also the items used by RyVand Keyes (1995). The WLS mail instrument, on the other hand, contains only six of theseitems—one per dimension. Analyzing MIDUS and NSFH II allows us to test whether thespeciWc choice of items in the WLS accounts for the high latent variable correlations. Ana-lyzing MIDUS and NSFH II also allows us to explore the possibility that age truncation,education truncation, limited racial diversity, or something else that is distinctive about theWisconsin data is driving our results. That is, both of these national surveys cover adults ofall ages, all levels of completed schooling, and all race-ethnic groups.
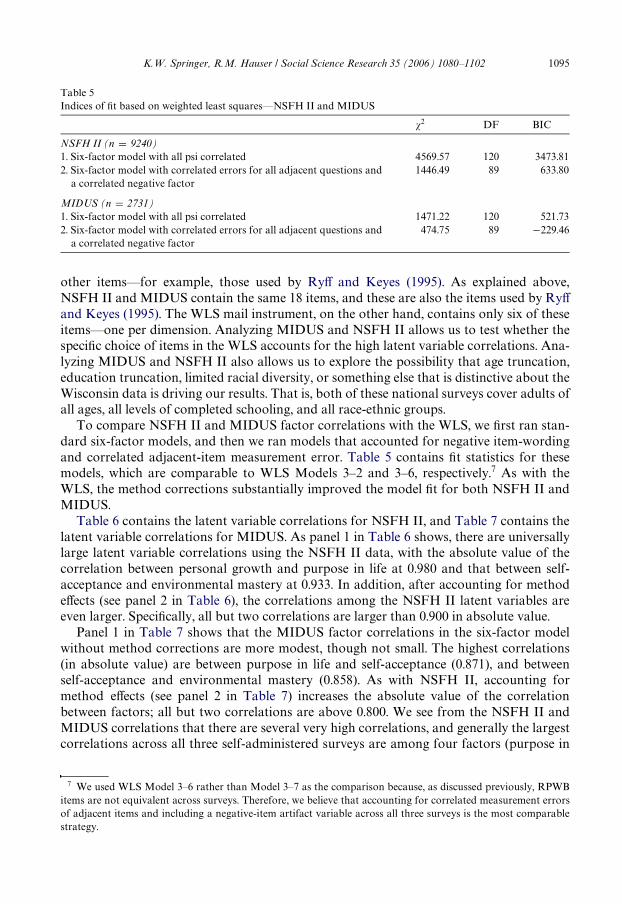
To compare NSFH II and MIDUS factor correlations with the WLS, we Wrst ran stan-dard six-factor models, and then we ran models that accounted for negative item-wordingand correlated adjacent-item measurement error. Table 5 contains Wt statistics for thesemodels, which are comparable to WLS Models 3–2 and 3–6, respectively.7 As with theWLS, the method corrections substantially improved the model Wt for both NSFH II andMIDUS.
Table 6 contains the latent variable correlations for NSFH II, and Table 7 contains thelatent variable correlations for MIDUS. As panel 1 in Table 6 shows, there are universallylarge latent variable correlations using the NSFH II data, with the absolute value of thecorrelation between personal growth and purpose in life at 0.980 and that between self-acceptance and environmental mastery at 0.933. In addition, after accounting for methodeVects (see panel 2 in Table 6), the correlations among the NSFH II latent variables areeven larger. SpeciWcally, all but two correlations are larger than 0.900 in absolute value.
Panel 1 in Table 7 shows that the MIDUS factor correlations in the six-factor modelwithout method corrections are more modest, though not small. The highest correlations(in absolute value) are between purpose in life and self-acceptance (0.871), and betweenself-acceptance and environmental mastery (0.858). As with NSFH II, accounting formethod eVects (see panel 2 in Table 7) increases the absolute value of the correlationbetween factors; all but two correlations are above 0.800. We see from the NSFH II andMIDUS correlations that there are several very high correlations, and generally the largestcorrelations across all three self-administered surveys are among four factors (purpose in
7 We used WLS Model 3–6 rather than Model 3–7 as the comparison because, as discussed previously, RPWBitems are not equivalent across surveys. Therefore, we believe that accounting for correlated measurement errorsof adjacent items and including a negative-item artifact variable across all three surveys is the most comparablestrategy.
Table 5Indices of Wt based on weighted least squares—NSFH II and MIDUS
�2 DF BIC
NSFH II (n D 9240)1. Six-factor model with all psi correlated 4569.57 120 3473.812. Six-factor model with correlated errors for all adjacent questions and
a correlated negative factor1446.49 89 633.80
MIDUS (n D 2731)1. Six-factor model with all psi correlated 1471.22 120 521.732. Six-factor model with correlated errors for all adjacent questions and
a correlated negative factor474.75 89 ¡229.46
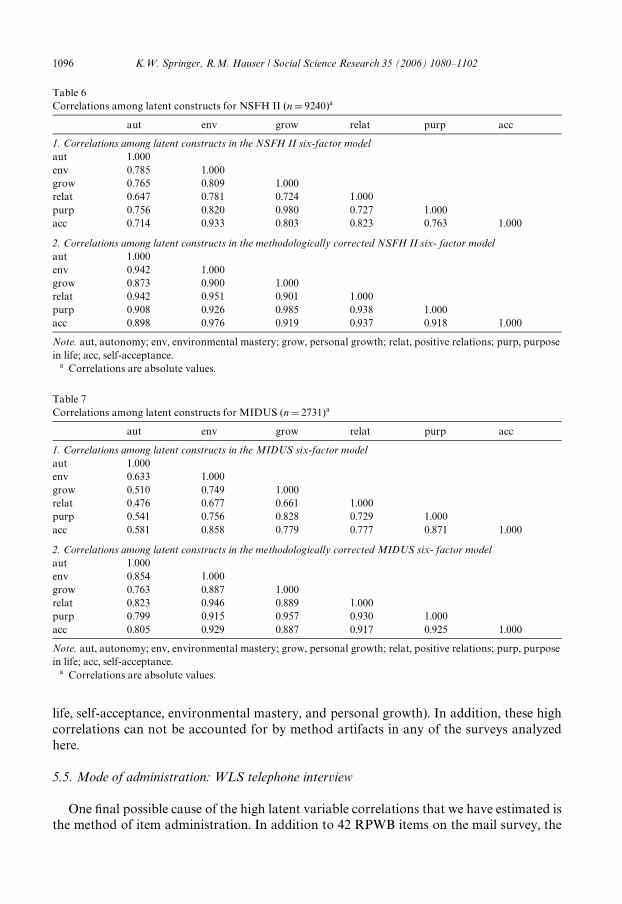
1096 K.W. Springer, R.M. Hauser / Social Science Research 35 (2006) 1080–1102
life, self-acceptance, environmental mastery, and personal growth). In addition, these highcorrelations can not be accounted for by method artifacts in any of the surveys analyzedhere.
5.5. Mode of administration: WLS telephone interview
One Wnal possible cause of the high latent variable correlations that we have estimated isthe method of item administration. In addition to 42 RPWB items on the mail survey, the
Table 6Correlations among latent constructs for NSFH II (n D 9240)a
Note. aut, autonomy; env, environmental mastery; grow, personal growth; relat, positive relations; purp, purposein life; acc, self-acceptance.
a Correlations are absolute values.
aut env grow relat purp acc
1. Correlations among latent constructs in the NSFH II six-factor modelaut 1.000env 0.785 1.000grow 0.765 0.809 1.000relat 0.647 0.781 0.724 1.000purp 0.756 0.820 0.980 0.727 1.000acc 0.714 0.933 0.803 0.823 0.763 1.000
2. Correlations among latent constructs in the methodologically corrected NSFH II six- factor modelaut 1.000env 0.942 1.000grow 0.873 0.900 1.000relat 0.942 0.951 0.901 1.000purp 0.908 0.926 0.985 0.938 1.000acc 0.898 0.976 0.919 0.937 0.918 1.000
Table 7Correlations among latent constructs for MIDUS (n D 2731)a
Note. aut, autonomy; env, environmental mastery; grow, personal growth; relat, positive relations; purp, purposein life; acc, self-acceptance.
a Correlations are absolute values.
aut env grow relat purp acc
1. Correlations among latent constructs in the MIDUS six-factor modelaut 1.000env 0.633 1.000grow 0.510 0.749 1.000relat 0.476 0.677 0.661 1.000purp 0.541 0.756 0.828 0.729 1.000acc 0.581 0.858 0.779 0.777 0.871 1.000
2. Correlations among latent constructs in the methodologically corrected MIDUS six- factor modelaut 1.000env 0.854 1.000grow 0.763 0.887 1.000relat 0.823 0.946 0.889 1.000purp 0.799 0.915 0.957 0.930 1.000acc 0.805 0.929 0.887 0.917 0.925 1.000
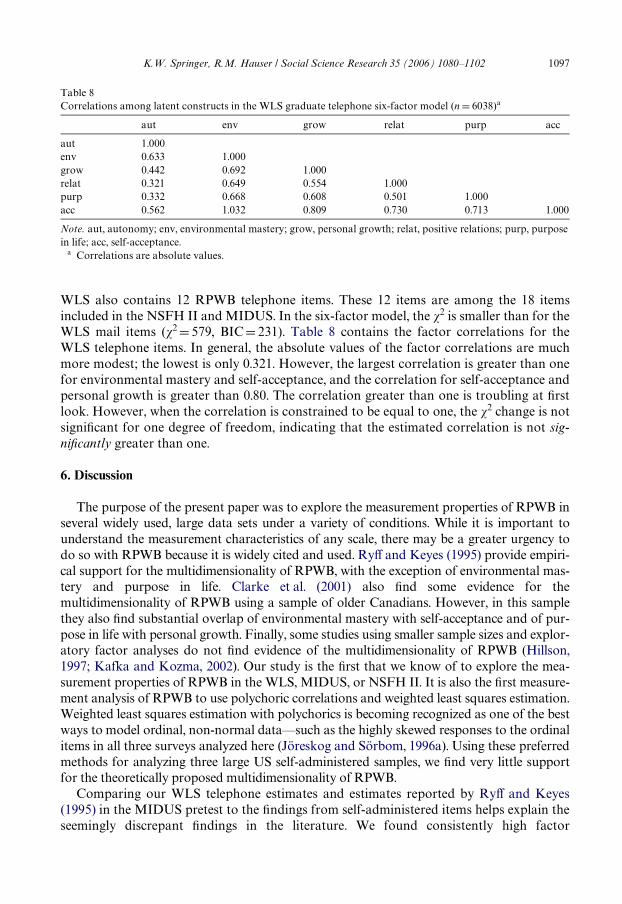
K.W. Springer, R.M. Hauser / Social Science Research 35 (2006) 1080–1102 1097
WLS also contains 12 RPWB telephone items. These 12 items are among the 18 itemsincluded in the NSFH II and MIDUS. In the six-factor model, the �2 is smaller than for theWLS mail items (�2D 579, BICD 231). Table 8 contains the factor correlations for theWLS telephone items. In general, the absolute values of the factor correlations are muchmore modest; the lowest is only 0.321. However, the largest correlation is greater than onefor environmental mastery and self-acceptance, and the correlation for self-acceptance andpersonal growth is greater than 0.80. The correlation greater than one is troubling at Wrstlook. However, when the correlation is constrained to be equal to one, the �2 change is notsigniWcant for one degree of freedom, indicating that the estimated correlation is not sig-niWcantly greater than one.
6. Discussion
The purpose of the present paper was to explore the measurement properties of RPWB inseveral widely used, large data sets under a variety of conditions. While it is important tounderstand the measurement characteristics of any scale, there may be a greater urgency todo so with RPWB because it is widely cited and used. RyV and Keyes (1995) provide empiri-cal support for the multidimensionality of RPWB, with the exception of environmental mas-tery and purpose in life. Clarke et al. (2001) also Wnd some evidence for themultidimensionality of RPWB using a sample of older Canadians. However, in this samplethey also Wnd substantial overlap of environmental mastery with self-acceptance and of pur-pose in life with personal growth. Finally, some studies using smaller sample sizes and explor-atory factor analyses do not Wnd evidence of the multidimensionality of RPWB (Hillson,1997; Kafka and Kozma, 2002). Our study is the Wrst that we know of to explore the mea-surement properties of RPWB in the WLS, MIDUS, or NSFH II. It is also the Wrst measure-ment analysis of RPWB to use polychoric correlations and weighted least squares estimation.Weighted least squares estimation with polychorics is becoming recognized as one of the bestways to model ordinal, non-normal data—such as the highly skewed responses to the ordinalitems in all three surveys analyzed here (Jöreskog and Sörbom, 1996a). Using these preferredmethods for analyzing three large US self-administered samples, we Wnd very little supportfor the theoretically proposed multidimensionality of RPWB.
Comparing our WLS telephone estimates and estimates reported by RyV and Keyes(1995) in the MIDUS pretest to the Wndings from self-administered items helps explain theseemingly discrepant Wndings in the literature. We found consistently high factor
Table 8Correlations among latent constructs in the WLS graduate telephone six-factor model (n D 6038)a
Note. aut, autonomy; env, environmental mastery; grow, personal growth; relat, positive relations; purp, purposein life; acc, self-acceptance.
a Correlations are absolute values.
aut env grow relat purp acc
aut 1.000env 0.633 1.000grow 0.442 0.692 1.000relat 0.321 0.649 0.554 1.000purp 0.332 0.668 0.608 0.501 1.000acc 0.562 1.032 0.809 0.730 0.713 1.000
1098 K.W. Springer, R.M. Hauser / Social Science Research 35 (2006) 1080–1102
correllations across all self-administered instruments, even when we accounted for meth-odological factors such as negative wording, item placement, and item redundancy. Inaddition, examination of NSFH II and MIDUS provides strong evidence that the high fac-tor correlations found in the WLS are not a result of educational truncation, age trunca-tion, item selection, or some other distinctive characteristic of the Wisconsin population.
It is worth noting that the NSFH II and MIDUS correlations in the non-methodologi-cally corrected six-factor models, though very high, are not as high as those estimatedusing the WLS. However, the reverse is the case in the methodologically corrected models.SpeciWcally, the factor correlations in MIDUS and NSFH II were generally higher than inthe WLS after accounting for correlated measurement error of adjacent items and negativeitem-wording. Given that the 18 items in MIDUS and NSFH II are the most commonlyused, it is essential to underscore that there is almost complete overlap between the sub-scales after taking into account methodological confounders.
In addition, the highest latent variable correlations across all samples were consis-tently those among purpose in life, self-acceptance, environmental mastery and personalgrowth. These four dimensions are those identiWed previously in the literature as havingconceptual overlap. Kafka and Kozma (2002) found these four dimensions largelyclustered in one factor, Hillson (1997) found that one factor contained primarily self-acceptance, environmental mastery, and purpose in life subscales, and Van Dierendonck(2004) found high correlations among these subscales (personal communication withVan Dierendonck, 7/26/04).
Because the factor correlations for the self-administered items we analyzed do not sup-port a multidimensional model of RPWB, we were originally surprised that our model Wtstatistics for the WLS seemed to suggest otherwise. SpeciWcally, given the extremely highfactor correlations, we expected that models constraining self-acceptance, purpose in life,and environmental mastery to reXect only a single factor would Wt better than the uncon-strained models. However, on closer reXection this is not too surprising and does not neces-sarily indicate that the six dimensions are distinct. First, it is important to remember thatour sample size is very large, with over 6000 cases. With a sample this large, almost anydeviation will produce a statistically signiWcant diVerence in �2, whether or not the diVer-ence is substantially meaningful. One of the reasons we presented BIC statistics in additionto �2 was because BIC helps control for sample size. However, Weakliem (1999) suggeststhat BIC might not suYciently adjust for exceptionally large sample sizes such as those weanalyzed.
Second, the way that the RPWB subscales were originally created may make it impossi-ble to Wnd that the scales/constructs are identical statistically, even if the substantive diVer-ences between them are truly negligible. The reason for this is that “items that correlatedmore highly with a scale other than their own or that showed low correlations with theirtotal scale were [not included in RPWB]” (RyV, 1989b, p. 1072) Therefore, it is possiblethat statistically distinct subscales were created, that by design cannot be identical even ifthe substantive dimensions of RPWB they are designed to measure are equivalent. In otherwords, it is possible that the design of the RPWB model capitalized on incidental, but per-sistent diVerences among items.
Although we found consistent evidence of high factor correlations using the WLS maildata, NSFH II, and MIDUS, we also found evidence of a mode diVerence. SpeciWcally, thetelephone items in the WLS perform much more like the telephone-administered itemsanalyzed by RyV and Keyes (1995) rather than like the self-administered items from the
K.W. Springer, R.M. Hauser / Social Science Research 35 (2006) 1080–1102 1099
WLS, NSFH II, and MIDUS. In addition, the Clarke et al. (2001) study of the Canadianelderly was conducted in person, producing Wndings more similar to those obtained by tele-phone. What accounts for the consistent diVerences between self-administered, paper andpencil assessments and those conducted in person or by telephone?
Extensive research has been conducted on mode eVects and in general, researchers Wndthat people are less prone to social desirability bias on self-administered surveys than intelephone or in-person interviews (Dillman, 1991; Krysan et al., 1994; Moum, 1998;Pruchno and Hayden, 2000; Schwartz et al., 1991). In addition, studies have found thatitems like those in RPWB, which ascertain psychological characteristics, are especiallyprone to social desirability bias (Moum, 1998; Pruchno and Hayden, 2000). Three sub-scales of RPWB (purpose in life, self-acceptance, and personal growth) have been exploredusing self-administered, telephone, and in person instruments (Pruchno and Hayden,2000). For all three scales, there were signiWcantly more negative reports on the self-admin-istered instrument compared to the telephone or in person. The authors conclude: “thesetrends tempt the conjecture that persons participating in the self-administered survey expe-rienced greater privacy and had more time to consider their responses than personsresponding to interviewer-assisted modes; therefore, their responses were more accurate.VeriWcation of these speculations awaits further study” (p. 21).
VeriWcation, of course, requires a gold standard such as medical reports or some othernon-self-report data. While RPWB has not yet been tested in this way, it is informative tolook at other survey-based measures of psychological health. Fournier and Kovess (1993)compared mail and telephone mental health instruments and found, as others have, thatthe mail instrument demonstrated higher rates of mental illness. As a validation check,Fournier and Kovess (1993) sub-sampled a group of respondents for an in-depth interviewin order to obtain enough information to make a DSM-III diagnosis. The sample size wassmall, and therefore it was diYcult to Wnd signiWcant eVects for speciWc psychiatric disor-ders, but they did Wnd that the kappa of the mail method for “any of these diagnoses” wassigniWcantly higher than for the telephone method.
The mode eVects that we have reviewed pertain to univariate distributions. Could modeeVects also account for the diVerences in factor structure between self-administration andtelephone or in-person administration? It may be that mode simply shifts marginal distri-butions, but not the associations among variables. Alternatively, shifts in marginal distri-butions and other mode eVects may alter the structure of joint distributions (De Leeuwet al., 1996). De Leeuw et al. (1996) provide relevant evidence by examining a causal modelof loneliness and a conWrmatory factor model of subjective well-being. The factor model ofsubjective well-being is of greatest interest to the current project because of the model andcontent—though RPWB was not used. The authors Wnd strong support for the secondhypothesis—that univariate mode diVerences are magniWed in multivariate analyses. TheyWnd that the substantive interpretation of the results depends on the mode of administra-tion.
One more issue warrants comment—speciWcally, we must assess the methodologicaldiVerences between our study and previous work (for example RyV and Keyes, 1995).Though we believe it is more accurate to treat the data as ordinal and employ weightedleast squares estimation with polychoric correlations, it is important to determine howmuch these methodological diVerences aVect our results and conclusions. As explained inthe literature review, RyV and Keyes (1995) used PRELIS to obtain variance/covariancematrices and an asymptotic covariance matrix deWning the variables as continuous; they
1100 K.W. Springer, R.M. Hauser / Social Science Research 35 (2006) 1080–1102
did not estimate polychoric correlations. Employing their model speciWcations, we rerantheir models and were able to reproduce their results.8 When we analyzed the RyV andKeyes (1995) data using polychorics and weighted least squares estimation, we obtainedsimilar results but, as expected, many of the factor correlations were larger, as was the �2.Likewise when we reran the six-factor models on the WLS mail and phone data using thesame speciWcations as RyV and Keyes (1995), we found somewhat smaller factor correla-tions and substantially reduced �2 statistics compared to the Wndings presented in thispaper. For example, in the six-factor model using the mail data from the WLS, the factorcorrelations were slightly reduced but many were still over 0.900; the largest was 0.954between purpose in life and self-acceptance.9 The factor correlations for the phone itemswere also smaller than when using polychorics with weighted least squares estimation. Inshort, our conclusions about mode eVects and the non-dimensionality of RPWB hold evenwhen we do not employ polychoric correlations with weighted least squares estimation.The other important diVerence between the two methods is that the �2 statistic using poly-chorics and weighted least squares estimation is much larger than when polychoric correla-tions are not used—for example, the �2 for the six-factor WLS mail model is 9036,compared to 6580 if the same model is estimated as in RyV and Keyes (1995).
Extensive research indicates that items such as, and speciWcally including RPWB, aremore accurately measured using mail instruments rather than telephone items. Researchalso suggests that structural models of well-being using diVerent modes can produce sub-stantially diVerent Wndings. Thus, the consistent results from self-administered scales in theWLS, NSFH II, and MIDUS are more credible than Wndings from the WLS or MIDUS-pretest telephone surveys. This also helps explain the seemingly discrepant Wndings in theliterature. Studies Wnding lower factor correlations (Clarke et al., 2001; RyV and Keyes,1995) used telephone or in-person interviews whereas studies Wnding less support for themultidimensionality of RPWB used self-administered instruments (Kafka and Kozma,2002; Van Dierendonck, 2004).
Given the consistently high latent variable correlations estimated from self-adminis-tered items in the WLS, MIDUS, and NSFH II, combined with extensive research indicat-ing the greater validity of psychological measures on self-administered surveys, we thinkthat RPWB does not measure as many as six distinct dimensions of psychological well-being. In this paper, we have not pursued external validation techniques such as looking atage, gender or socioeconomic diVerences in the subscales for several reasons. First, as wediscussed, it is possible that procedures used to choose the subsets of items in MIDUS andNSFH II may make it very diYcult to establish that these dimensions are not statisticallydistinct. Second, the Wndings of our study are not entirely novel, but add to a growing bodyof research indicating that RPWB is not six-dimensional. Third, because WLS, NSFH II,and MIDUS samples have all been followed up, we are conducting external validity checksin these longitudinal data as they become available (Pudrovska et al., 2005). We believethat these are the Wrst large-scale analyses of RPWB using longitudinal data.
In preliminary analyses of data ascertained from WLS graduates in 2003–2005, wecross-validated the very high cross-sectional factor correlations reported here, and also
8 We thank Corey Keyes for providing us with their data and code. We reproduced their factor correlations ex-actly, except we obtained a correlation of 0.38 for purpose in life and autonomy whereas they reported a correla-tion of 0.39.
9 The full correlation table is available in Appendix A.
K.W. Springer, R.M. Hauser / Social Science Research 35 (2006) 1080–1102 1101
found very high correlations across each RPWB dimension between 1993 and 2005—approximately 0.85. There are small mean diVerences in the subscales of well-being as theWLS cohort has aged—and generally similar and small changes between NSFH II andNSFH III. These small diVerences are consistent with the Wndings reported here. We didnot Wnd complete overlap among subscales, so there is room for modest independent vari-ation in them. In addition, we are still exploring the possibility that the mean diVerencesmay result from method eVects. In any case, none of our external validity checks suggestthat there are strong age-related trajectories or large diVerences between subscales inchange over time. In sum, these external validity checks conWrm our main Wnding, thatRyV’s subscales do not represent six empirically distinct dimensions of psychological well-being.
We applaud the attempt to develop multidimensional models of health—both psycho-logical and physical. As students of physical health have begun to move from life expec-tancy to quality adjusted life expectancy and other multidimensional concepts, so tooshould students of mental health. RPWB is one such attempt, and we can only applaud thisline of research. However, our study adds to a growing body of evidence that RPWB doesnot measure six distinct dimensions of psychological well-being. While RPWB certainlycaptures some aspects of positive mental health, we strongly caution against analyses thattreat the scale components as if they measure six distinct dimensions of psychological well-being.
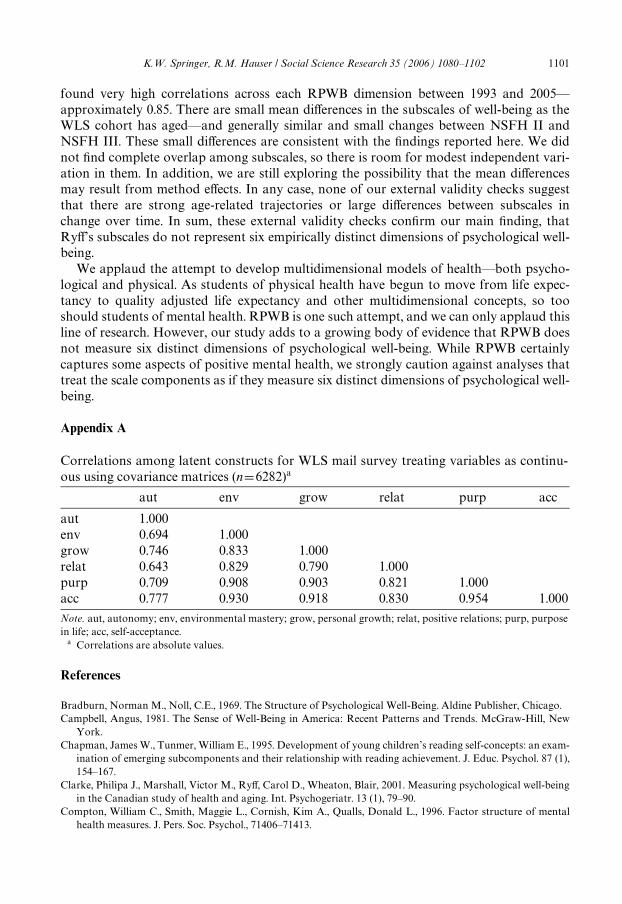
Appendix A
Correlations among latent constructs for WLS mail survey treating variables as continu-ous using covariance matrices (nD6282)a
Note. aut, autonomy; env, environmental mastery; grow, personal growth; relat, positive relations; purp, purposein life; acc, self-acceptance.
a Correlations are absolute values.
References
Bradburn, Norman M., Noll, C.E., 1969. The Structure of Psychological Well-Being. Aldine Publisher, Chicago.Campbell, Angus, 1981. The Sense of Well-Being in America: Recent Patterns and Trends. McGraw-Hill, New
York.Chapman, James W., Tunmer, William E., 1995. Development of young children’s reading self-concepts: an exam-
ination of emerging subcomponents and their relationship with reading achievement. J. Educ. Psychol. 87 (1),154–167.
Clarke, Philipa J., Marshall, Victor M., RyV, Carol D., Wheaton, Blair, 2001. Measuring psychological well-beingin the Canadian study of health and aging. Int. Psychogeriatr. 13 (1), 79–90.
Compton, William C., Smith, Maggie L., Cornish, Kim A., Qualls, Donald L., 1996. Factor structure of mentalhealth measures. J. Pers. Soc. Psychol., 71406–71413.
aut env grow relat purp acc
aut 1.000env 0.694 1.000grow 0.746 0.833 1.000relat 0.643 0.829 0.790 1.000purp 0.709 0.908 0.903 0.821 1.000acc 0.777 0.930 0.918 0.830 0.954 1.000
1102 K.W. Springer, R.M. Hauser / Social Science Research 35 (2006) 1080–1102
DeLeeuw, Edith D., Mellenbergh, Gideon J., Hox, Joop J., 1996. The inXuence of data collection method on structuralmodels: a comparison of a mail, a telephone, and a face-to-face survey. Sociol. Methods Res. 24 (4), 442–472.
Dillman, Don A., 1991. The design and administration of mail surveys. Annu. Rev. Sociol., 17225–17249.Fournier, Louise, Kovess, Vivianne, 1993. A comparison of mail and telephone interview strategies of mental
health surveys. Can. J. Psychiatry 38 (8), 525–553.Groves, Robert M., 1989. Survey Errors and Survey Costs. Wiley, New York.Hillson, Joan M., 1997. An Investigation of Positive Individualism and Positive Relations With Others: Dimen-
sions of Positive Personality. University of Western Ontario, Ontario.Jensen, Arthur R., 1971. Note on why genetic correlations are not squared. Psychol. Bull. 75 (3), 223–224.Jöreskog, K.G., Dag Sörbom, 1988. LISREL 7 a Guide to the Program and Applications. Chicago, Ill: SPSS.Jöreskog, K.G., Dag Sörbom, 1996a. LISREL 8 User’s Reference Guide. 2nd ed ed. Chicago, IL: ScientiWc Soft-
ware International.Jöreskog, K.G., Dag Sörbom, 1996b. PRELIS 2 User’s Reference Guide: a Program for Multivariate Data
Screening and Data Summarization: a Preprocessor for LISREL. 3rd ed ed. Chicago, IL: ScientiWc SoftwareInternational.
Kafka, Garrett J., Kozma, Albert, 2002. The construct validity of RyV’s Scales of Psychological Well-Being(SPWB) and their relationship to measures of subjective well-being. Soc. Indicators Res. 57, 171–190.
Krysan, Maria H., Schuman, Howard, Scott, Leslie J., Beatty, Paul, 1994. Response rates and response content inmail versus face-to-face surveys. Pub. Opin. Q. 58 (3), 381.
Marks, Nadine F., 1996. Flying solo at midlife: Marital status, and psychological well-being. J. Marriage Fam. 58(4), 917–932.
Marks, Nadine F., 1998. Does it hurt to care? Caregiving, work–family conXict, and midlife well-being. J. Mar-riage Fam. 60 (4), 951–966.
Marsh, Herbert, 1986. Negative item bias in ratings scales for preadolescent children: a cognitive-developmentphenomenon. Dev. Psychol. 22 (1), 37–49.
McGregor, Ian, Little, Brian R., 1998. Personal projects, happiness, and meaning: on doing well and being your-self. J. Pers. Soc. Psychol., 74494–74512.
Melnick, S.A., Gable, R.K., 1990. The use of negative item stems: a cautionary note. Educ. Res. Q. 14 (3), 31–36.Moum, Torbjorn, 1998. Mode of administration and interviewer eVects in self-reported symptoms of anxiety and
depression. Soc. Indicators Res., 45279–45318.Neugarten, B.L., Havinghurst, R., Tobin, S., 1961. The measurement of life satisfaction. J. Gerontol., 16134–16143.Pilotte, William J., Gable, Robert K., 1990. The impact of positive and negative item stems on the validity of com-
puter anxiety scale. Educ. Psychol. Meas. 50 (3), 603–610.Pruchno, Rachel A., Hayden, Jason M., 2000. Inteview Modality: eVects on Costs and Data Quality in a Sample
of Older Women. J. Health Aging 12 (1), 3–24.Pudrovska, Tetanya, Robert M. Hauser, and Kristen W. Springer. 2005. Dimensions of Change in Psychological
Well-Being across the Life Course. Presented at the 2005 meetings of the American Sociological Association,Philadelphia, Pennsylvania.
Raftery, Adrian E., 1995. Bayesian Model Selection in Social Research. In: Marsden, Peter V. (Ed.), SociologicalMethodology 1995. Basil Blackwell, Cambridge, pp. 111–163.
Rosenberg, Morris, 1965. Society and the Adolescent Self-Image. Princeton University Press, Princeton, NJ.Ryan, Ryan M., Deci, Edward L., 2001. On Happiness and Human Potential: a Review of Research on Hedonic
and Eudaimonic Well-Being. Annu. Rev. Psychol., 52141–52166.RyV, C.D., 1989a. Beyond Ponce De Leon and life satisfaction: new directions in the quest of successful aging. Int.
J. Dev. 12, 35–55.RyV, C.D., 1989b. Happiness is everything, or is it? explorations on the meaning of psychological well-being. J.
Pers. Soc. Psychol. 57 (6), 1069–1081.RyV, C.D., Keyes, C.L., 1995. The structure of psychological well-being revisited. J. Pers. Soc. Psychol. 69 (4), 719–727.Schwartz, Norbert, Fritz, Strack, Hippler, Hans-J., Bishop, George, 1991. The impact of administration model on
response eVects in survey measurement. Appl. Cognit. Psychol., 5193–5212.Sewell, William H., Hauser, Robert M., Springer, Kristen W., Hauser, Taissa S., 2004. As we age: the Wisconsin Longi-
tudinal Study, 1957–2001. In: Leicht, Kevin (Ed.), Research in Social StratiWcation and Mobility, Vol. 20., pp. 3–111.Van Dierendonck, Dirk, 2004. The construct validity of RyV’s scales of psychological well-being and its extension
with spiritual well-being. Pers. Individ. DiVer. 36 (3), 629–643.Waterman, Alan S., 1993. Two conceptions of happiness: contrasts of personal expressiveness (Eudaimonia) and
Hedonic enjoyment. J. Pers. Soc. Psychol., 64678–64691.