dynamic motivation to lead: construct validity of
TRANSCRIPT

Claremont CollegesScholarship @ Claremont
CMC Senior Theses CMC Student Scholarship
2019
Dynamic Motivation to Lead: Construct Validityof Motivation to LeadLeya AronoffClaremont McKenna College
This Open Access Senior Thesis is brought to you by Scholarship@Claremont. It has been accepted for inclusion in this collection by an authorizedadministrator. For more information, please contact [email protected].
Recommended CitationAronoff, Leya, "Dynamic Motivation to Lead: Construct Validity of Motivation to Lead" (2019). CMC Senior Theses. 2254.https://scholarship.claremont.edu/cmc_theses/2254
Claremont McKenna College
Dynamic Motivation to Lead:
Construct Validity of Motivation to Lead
submitted to
Professor Ronald Riggio
and
Professor David Day
By
Leya Aronoff
for
Senior Thesis
Spring 2019
April 29


TABLE OF CONTENTS
Title Page ………………………………………………………………………………………………………….…………. 1
Abstract …………..……………………………………………………………………………………………....…………. 2
Introduction ……………………………………………………………………..…………………………………………. 3
Motivation at its Development …………………………………………………………….………….. 4
Motivation to Lead (MTL) ………………………………………………………………………..………. 5
Present Study: Malleability of Motivation to Lead ……………………………………………. 7
Malleable Motivation to Lead Model ……………………………………………………………… 12
Method ………………………………………………………………………………………………………..……………. 12
Participants …………………………………………………….……………………………………………... 12
Design ……………………………………………………………………………………………………………. 13
Procedure ………………………………………………………………………………………………………. 14
Results ……………...………………………………………………………………………………………………………. 17
Primary Analyses …………………………………………………….……………………………………... 17
Secondary Analyses …………………………………………………………………………..…..………. 20
Discussion ………………………………………………………………………………………………………………….. 24
Limitations ……………………………………………………………………………………………………… 28
Future Directions ……………………………………………………………………………………………. 29
References …………………………………………………………………………………………………………………. 31
Appendices ………………………………………………………………………………………………………………… 62

Running head: DYNAMIC MOTIVATION TO LEAD 1
DYNAMIC MOTIVATION TO LEAD:
Construct Validity of Motivation to Lead
Leya J. Aronoff
Claremont McKenna College
Author Note
Leya J. Aronoff, Department of Psychology, Claremont McKenna College.
This empirical thesis research project was conducted over one year to contribute
to the understanding of leadership psychology and to fulfill the Psychology
Department’s Honors Thesis requirement. The author would like to sincerely thank Dr.
Riggio and Dr. Day for their support and encouragement as thesis readers, mentors and
advisors in exploring academic leadership development. Special thanks to Dr. Tan, JP
Dulay, and the team of undergraduate research assistants at the Kravis Leadership
Institute, who created the ongoing leadership assessment and collected Time 1 data.
The author would like to express gratitude to Dr. Levin, Christopher Schmank, and
Zhengguang (Marko) Liu for providing statistical and methodological guidance.
Correspondence concerning this thesis may be addressed to Leya J. Aronoff,
Department of Psychology, Claremont McKenna College, CA 91711.
Contact: [email protected]

DYNAMIC MOTIVATION TO LEAD 2
Abstract
Although motivation to lead (MTL) was characterized as stable, recent research
suggested otherwise. This study explored the malleability of MTL and its predictors.
Individuals with high affective-identity MTL are motivated to lead because they enjoy
leading. Individuals with high social normative MTL are motivated by an obligation to
lead. Individuals with high noncalculative MTL are drawn to leadership because they
avoid weighing the costs and benefits of leading. Applicants to a California college were
sent a questionnaire on MTL and leadership self-efficacy (LSE) (Time 1 assessment, N =
2704). Four years later (Time 2), participants who responded at Time 1 were sent a
survey on motivation to lead, leadership self-efficacy, college leadership experience, and
leader identity (LID) (N = 96). Results showed that participants’ affective-identity and
noncalculative MTL have decreased over time. Leadership self-efficacy at Time 2 and
leader identity at Time 2 were related to the changes in all 3 categories of MTL. Only
specific college leadership experiences related to changes in affective-identity MTL.
Lastly, leader identity at Time 2 mediated the relationship between affective-identity
MTL at Time 1 and Time 2. Most high school students applied to college aspiring to be
leaders, but only students who cultivate their leader identity should continue to be
motivated to lead. Implications are discussed in the context of the construct validity of
MTL, specifically for student leadership development in higher education.
Keywords: Motivation to Lead, Leadership Self-Efficacy, Leader Identity,
Educational Leadership, Higher Education

DYNAMIC MOTIVATION TO LEAD 3
Dynamic Motivation to Lead: Construct Validity of Motivation to Lead
Leadership is a complex phenomenon that is adaptable throughout various
situations (Evans, 1970; House, 1971; House & Mitchell, 1974), groups of followers
(Dansereau, Graen, & Haga, 1975; Hersey & Blanchard, 1969), and individual
development (DeRue, Nahrgang, Hollenbeck, & Workman, 2012; Welch, Grossaint, Reid,
& Walker, 2014). One important characteristic for leaders has been motivation (Chan &
Drasgow, 2001). Motivation is the drive or determination an individual must have to
achieve a goal. Chan and Drasgow (2001) developed a construct called motivation to
lead (MTL), which describes an individual’s motivation to become and succeed as a
leader. Since its inception, past studies have categorized MTL as a stable characteristic
(Chan & Drasgow, 2001; Reichard et al., 2011; Rosch, Collier, & Thompson, 2015; Van
Iddekinge, Ferris, & Heffner, 2009). However, recent studies have shown that specific
types of MTL are malleable over time (Bergner, Kanape, & Rybnicek, 2018; Waldman,
Galvin & Walumbwa, 2013; Yeager & Callahan, 2016). Thus, the present study seeks to
answer the questions: is motivation to lead malleable? And what are the predictors and
outcomes of MTL’s potential malleability?
Why is MTL’s malleability an important topic for research? Leadership qualities
are essential in today’s society, from leading an organization to developing student
leadership in higher education. However, many leaders have developed their skills and
qualities over time. The best leaders take time to learn from each challenge to become
better leaders in the future. However, this developmental process can be arduous, as
leaders may find it difficult to face their shortcomings and improve upon their

DYNAMIC MOTIVATION TO LEAD 4
weaknesses (Day & Sin, 2011; Miscenko, Guenter & Day, 2017). Only individuals who are
motivated to lead successfully would situate themselves in roles where they can
improve their leadership skills. Without motivation, people would not take on
leadership challenges, which would result in organizations without proper management
or educational institutions with a lack of student involvement. This study looked at
whether the motivation to become a leader can be developed. If motivation to lead can
change, then organizational leaders and higher education administrators can learn to
motivate employees and students to seek out opportunities to develop their leadership
skills.
Motivation and its Development
Motivation has been studied, defined, and applied differently in all areas of
psychology (Murayama, 2018). The present study used the industrial-organizational
definition of motivation because motivation to lead belongs in industrial-organizational
psychology.
Even within industrial-organizational psychology, researchers applied different
definitions of motivation. Some have said that motivation is a force that stimulates
ongoing actions towards a specific goal (Bartol & Martin, 1998; Steers & Porter, 1991).
Others believed that motivation is a force that stimulates voluntary actions, allowing
individuals to make their own choices toward achieving their goals (Kreitner & Kinicki,
2004). All these definitions describe motivation as stimulating, channeling, and
sustaining a specific behavior over a long period of time (Steers et al., 2004).
DYNAMIC MOTIVATION TO LEAD 5
Motivation and Leadership. Most studies connected motivation to leadership by
assessing with how leaders motivate their employees. Sekhar, Patwardhan, and Singh
(2013) described many ways that an organization’s leaders can motivate their
employees, including designing monetary incentive systems (Beretti, Figuières &
Grolleau, 2013; Park, 2010), developing training programs (Baldwin, Magjuka & Loher,
1991), providing promotional opportunities (García et al., 2012; Koch & Nafziger, 2012),
and recognizing their employees’ good work (Satyawadi & Ghosh, 2012). However, no
applications revealed how employees were motivated to take on leadership roles
themselves. There was limited research on what makes someone willing to lead until
Chan and Drasgow (2001) proposed their Motivation to Lead Theory (Amit, Lisak,
Popper & Gal, 2007).
Motivation to Lead
MTL was defined as a stable characteristic reflecting an individual’s drive to
become and succeed as a leader (Chan & Drasgow, 2001). There are three types of
motivations that explain an individual’s drive to lead.
Affective-Identity Motivation to Lead. Affective-identity MTL states that
individuals are driven to become leaders because they enjoyed leading. This motivation
is intrinsic. Intrinsic motivation is derived from enjoying the job (Amabile, Hill,
Hennessey & Tighe, 1994). Affective-identity MTL is an intrinsic motivation because
enjoyment comes from within and does not depend on context or environment.
Affective-identity MTL had roots in McClelland (1961, 1975)’s Motivation Theory,
specifically, the need for achievement. Individuals who are high in need for achievement

DYNAMIC MOTIVATION TO LEAD 6
enjoy the challenge of a task. Affective-identity MTL is similar to the need for
achievement when applied to leadership. Individuals with high affective-identity MTL
enjoy the challenge of leading.
Social-Normative Motivation to Lead. Social normative MTL is motivation
derived from a sense of obligation or duty. Social normative MTL is an extrinsic
motivator. Extrinsic motivation is driven by a force that is outside of the work itself,
including pay or positive recognition (Amabile et al., 1994). Social normative MTL
exemplifies extrinsic motivation because obligation or duty may vary depending on the
situation or the leader’s followers.
Social normative MTL had roots in the need for affiliation in McClelland (1961,
1975)’s Motivation Theory. Need for affiliation described people as wanting to be liked
by others. These people enjoy collaborating with others and seek close relationships on
the job. The need for affiliation relates to social normative MTL because they both
involve others’ influence. For some, social normative MTL has come from an obligation
to avoid ruining relationships or to make people think highly of them.
Noncalculative Motivation to Lead. Noncalculative MTL describes an individual's
motivation for leading as the ability to avoid weighing the costs and benefits of leading.
Noncalculative MTL stemmed from cognitive theories of motivation. Cognitive
theories assume that people are rational and assess their personal costs and benefits
before behaving. According to cognitive theories, peoples’ goals are to maximize their
benefits and minimize their costs. A cognitive theory called Equity Theory closely relates
to noncalculative MTL. Equity Theory, spearheaded by Adams (1963, 1966), proposed

DYNAMIC MOTIVATION TO LEAD 7
that employees wanted to be treated fairly. As such, workers would compare their
inputs (e.g., education, energy, knowledge, and skills) and outcomes (e.g., pay,
recognition, and interesting tasks) to their coworkers’ inputs and outputs to determine
if they were treated fairly. If they were not treated fairly, they adjusted accordingly.
Equity Theory related inversely to noncalculative MTL because Chan and
Drasgow (2001) suggested that people who do not engage in cost-benefit analyses were
more likely to lead. If people weighed the costs of leading, such as time, responsibilities,
or reputation, to the benefits, such as awards or special privileges, then the costs would
exceed the benefits. Costs are especially high when leaders do not receive appreciation
for their leadership (Wilson, 2001). Thus, individuals who do not weigh the costs and
benefits of leading are more likely to lead.
Present Study: Malleability of Motivation to Lead
Early motivation theorists have identified motivation as a trait (Amabile, 1993).
However, recent studies looked at motivation as a state that can change over time due
to acquired life experience, times of sustained action (such as learning a language), or
changes in social contexts (Dornyei & Ushioda, 2014). Others assumed that motivation
was a process that can change over time (Hardcastle et al., 2015; Turner & Patrick, 2008;
Wigfield, Gladstone & Turci, 2016). Additionally, organizational leaders employed
several mechanisms to increase their employees’ motivation (Sekhar et al., 2013).
Although MTL has been defined as a stable characteristic (Chan & Drasgow,
2001), previous research has shown that some aspects of MTL may be malleable. For
instance, Bergner et al. (2018) showed that affective-identity MTL was developed as

DYNAMIC MOTIVATION TO LEAD 8
individuals grew an interest in and succeeded in leadership roles. It would make sense
that affective-identity MTL would change over time because individuals would not know
if they enjoy leading when they are born. Individuals would learn whether or not they
enjoy leading after being a leader. For this study, we assumed that affective-identity
MTL should increase throughout a students’ college career as they develop themselves
as student leaders.
H1: Affective-identity motivation to lead increases over time
Social normative MTL has also been shown to change. For example, social
normative MTL increased in a leadership course that focused on each students’
obligation to lead (Waldman et al., 2013). Social normative MTL may be malleable over
time if an individual’s sense of leadership obligation changed. For this study, we
assumed that social normative MTL should increase throughout a students’ college
career as they feel more obligated to lead.
H2: Social normative motivation to lead increases over time
There has been a lack of literature on noncalculative MTL’s malleability. In Chan
& Drasgow (2001)’s model, the level of noncalculative MTL was only predicted by the
stable characteristics of personality traits and cultural values. Thus, in this model,
noncalculative MTL should not change over time.

DYNAMIC MOTIVATION TO LEAD 9
H3: Noncalculative motivation to lead does not change over time
According to Chan and Drasgow (2001), affective-identity MTL and social
normative MTL were predicted by two malleable constructs: leadership self-efficacy and
past leadership experience.
Leadership Self-Efficacy. As developed in social-cognitive theory, self-efficacy
was defined as the belief in one’s abilities, skills, and knowledge to take agency in a
certain aspect of their life (Bandura, 1994). Self-efficacy was applied to leadership in a
construct called leadership self-efficacy (LSE), which Hannah, Avolio, Luthans, and
Harms (2008) defined as the belief in one’s abilities, skills, and knowledge to succeed as
a leader. Chan and Drasgow (2001) found that LSE predicted both affective-identity MTL
and social normative MTL, but not noncalculative MTL. In addition, previous studies
showed that LSE is malleable (Gist, & Mitchell, 1992) in several contexts, including
structured leadership development programs for college students (Pyle, 2014), training
counseling for students’ group LSE (Midgett, Hausheer, & Doumas, 2016), mentoring
(Chopin, Danish, Seers, & Hook, 2012), and transformational leadership development in
adults (Fitzgerald & Schutte, 2010). This predictor supports the hypotheses that
affective-identity MTL and social normative MTL are malleable.
In terms of direction, LSE would have a direct relationship with affective-identity
MTL and social normative MTL, as shown by previous research (Chan & Drasgow, 2001;
Cho, Harrist, Steele, & Murn, 2015; Joo, Yu, & Atwater, 2018). For affective-identity

DYNAMIC MOTIVATION TO LEAD 10
MTL, if an individual believed that they were a great leader, they should be more
motivated to take leadership roles and grow to enjoy it. For social normative MTL,
individuals are more likely to give in to external pressures to assume leadership
positions because they feel confident in their leadership abilities. In conclusion, both
affective-identity MTL and social normative MTL should positively correlate to LSE.
H4: Changes in affective-identity motivation to lead are correlated to leadership
self-efficacy such that affective-identity motivation to lead increases the most for
individuals with high leadership self-efficacy
H5: Changes in social normative motivation to lead are correlated to leadership
self-efficacy such that social normative motivation to lead increases the most for
individuals with high leadership self-efficacy
Past Leadership Experience. Chan and Drasgow (2001) noted that past
leadership experience predicted affective-identity MTL and social normative MTL, but
not noncalculative MTL. As an individual gained leadership experience, they could have
grown to enjoy leadership or reinforced their sense of duty to leadership. As individuals
gain leadership experiences, affective-identity MTL and social normative MTL should
increase.

DYNAMIC MOTIVATION TO LEAD 11
H6: Changes in affective-identity motivation to lead are correlated with past
leadership experience such that affective-identity motivation to lead increases the most
for individuals with more past leadership experience
H7: Changes in social normative motivation to lead are correlated with past
leadership experience such that social normative motivation to lead increases the most
for individuals with more past leadership experience
Leader Identity. Many definitions of identity have been developed (Miscenko &
Day, 2016). For the present study, identity was associated with a specific role (Stryker &
Burke, 2000). Thus, leader identity (LID) was defined as the belief that one would call
themselves a leader based on their leadership role(s). Miscenko et al. (2017) showed
that LID was malleable over time. Komives, Owen, Longerbeam, Mainella, and Osteen
(2005) addressed the malleability of LID in higher education by formulating the
Leadership Identity Development Model, which explained that on the path to leadership
identity development, students must expand their motivations and develop LSE to self-
identify as leaders. Priest and Middleton (2016) noted that the relationship between LID
and MTL is reciprocal: as an individual developed a leader identity, they were more
motivated to be a leader and inspired themselves to pursue leadership roles, which
reinforced their LID. For the purposes of this study, I hypothesized that affective-identity
MTL at Time 2 would predict individuals’ LID at Time 2. Furthermore, more recent
affective-identity MTL should predict an individual’s level of LID over and above an
individual’s affective-identity MTL in the past, especially if affective-identity MTL

DYNAMIC MOTIVATION TO LEAD 12
changes between the two time points. Affective-identity MTL from earlier in life should
predict LID later in life. The cyclical relationship between MTL and LID could lead to infer
that affective-identity MTL can predict individuals’ future LID.
H8: affective-identity motivation to lead at Time 2 predicts leader identity at
Time 2 over and above affective-identity motivation to lead at Time 1
Malleable Motivation to Lead Model
The models in Figures 1, 2, and 3 depict how each constructs’ relationships were
hypothesized between two time points, Time 1 and Time 2. All three categories of MTL
at the first time point should predict MTL at the second time point. Past leadership
experience and LSE should explain some, but not all, of the relationship between MTL at
Time 1 and Time 2. If individuals grew their confidence and experiences in leadership,
they were more likely to reinforce and increase their motivation to become a leader.
Thus, all solid lines in Figures 1, 2, and 3 should be significantly positive, and all dashed
lines should not be significant.
Method
Participants
Participants were recruited upon submission of their application to a southern
California college at Time 1. Most participants at Time 1 were 4th year high school
students. Out of 6,412 invited participants, 2,704 completed the surveys at Time 1 for a
response rate of 42%. The gender breakdown was 58.9% female, 40.9% male, and 0.2%

DYNAMIC MOTIVATION TO LEAD 13
did not identify as either male or female. Demographics revealed that 54.3% of
participants identified as White, 42.0% of participants identified as Asian, 12.0% of
participants identified as Hispanic or Latino, 5.5% of participants identified as Black or
African American, and 2.9% of participants identified as other. Some participants
identified as more than one ethnicity.
For Time 2, all participants who completed the study at Time 1 were invited to
participate in the Time 2 survey using the email they provided at Time 1. Participants
who chose to attend this southern California college were sent the Time 2 survey via
their school email, as participants may no longer use their previous email address. At
Time 2, 146 participants completed the survey, resulting in a 5.4% retention rate. A total
of 50 participants were dropped because they either did not entirely complete the Time
2 survey or did not participate in the Time 1 survey. The final number of participants
was N = 96, consisting of participants who filled out both Time 1 and Time 2 surveys
completely, which is above the necessary power of 70 participants.
The final sample of students consisted of 60.4% females and 39.6% males. The
racial background shows that 55.3% identified as White, 39.6% identified as Asian,
13.7% of participants identified as Hispanic or Latino, and 5.2% identifying as other
races. In the final sample, only 11.5% of participants attended the southern California
college that they applied to at Time 1.
Design
The present study tested a predictor model over two time periods, Time 1 and
Time 2. Time 1 was collected in January 2015, when participants were applying to

DYNAMIC MOTIVATION TO LEAD 14
colleges. They were administered several surveys to measure various leadership
competencies. Time 2 was collected 4 years later in January 2019, when participants
were expected to complete their 4th year of college or university.
The predictor variables measured at Time 1 were motivation to lead at
leadership self-efficacy. Predictor variables collected at Time 2 included leadership self-
efficacy and college leadership experience. MTL at Time 2 was the outcome of all Time 1
variables and all Time 2 predictor variables. Additionally, affective-identity MTL at Time
2 was a predictor for leader identity at Time 2.
Procedure
Data were obtained from an ongoing leadership assessment at this California
college. At Time 1, participants were sent a battery of leadership scales via email. Each
scale was presented on Qualtrics in the following order: demographic information,
Leadership Self-Efficacy Scale (Murphy, 1992), and Motivation to Lead Scale (Chan &
Drasgow, 2001). Other collected measures included the Leadership Resume,
Developmental Self-Efficacy, Goal Orientation Scale, Leadership Knowledge Test, Social
Skills Inventory, and Multidimensional Cultural Intelligence Scale, which were not
analyzed. Items within each scale were randomized. Upon completion of the survey,
each student’s email was coded into a participant ID number for reference during Time
2.
At Time 2, participants filled out the following scales in order: Leadership Self-
Efficacy Scale (Murphy, 1992), Motivation to Lead Scale (Chan & Drasgow, 2001),
Leadership Resume, and Leader Self-Identity Scale (Hiller, 2005). Additional surveys at

DYNAMIC MOTIVATION TO LEAD 15
Time 2 included Social Skills Inventory, Developmental Self-Efficacy, Sense of Belonging,
Goal Orientation Scale, Leadership Information, Leadership Knowledge Test, Leadership
Development Activities, Implicit Leadership Theories, Leader Self-Awareness, Civic
Engagement, Satisfaction with Life Scale, Grit, Basic Empathy Scale, and Social
Desirability Scale - 17, which were not analyzed. Items within each scale were
randomized. Upon completion, the datasets were merged based on the participants’
email and ID number.
Measures. At Time 1, participants answered questions on their leadership self-
efficacy and motivation to lead.
Leadership Self-Efficacy. LSE describes how a leader’s belief in their abilities to
lead affects their leadership performance (Murphy, 1992). Murphy (1992) developed an
8-item scale to measure LSE. This survey had undergone several reliability tests with
results ranging from .75 to .86. An example item was, “I am confident of my ability to
influence a work group that I lead.” The full scale is available in Appendix A. Responses
ranged from 1 (Disagree Strongly) to 5 (Agree Strongly). A scale score was calculated by
averaging the responses to each item.
Motivation to Lead. Motivation to Lead Scale was created by Chan and Drasgow
(2001). The three components of MTL were measured on a 27-item Likert scale, nine
items per component. Cronbach’s alphas from the original study ranged from .65 to .91
for all three components. An example item for affective-identity MTL was, “Most of the
time, I prefer being a leader rather than a follower when working in a group.” An
example item for social normative MTL was, “I agree to lead whenever I am asked or

DYNAMIC MOTIVATION TO LEAD 16
nominated by the other members.” An example item for noncalculative MTL was, “I
would agree to lead others even if there are no special rewards or benefits with that
role.” Eleven items were reverse coded. The full scale is in Appendix B. Responses were
measured on a scale of 1 (Disagree Strongly) to 5 (Agree Strongly). Composite scores
were calculated for each of the three components by averaging each of the 9 items
within each component after reverse coding.
At Time 2, participants answered questions on their leadership self-efficacy,
motivation to lead, college leadership experiences, and leader identity.
Leadership Self-Efficacy. This scale was the same Leadership Self-Efficacy Scale
used at Time 1, which is provided in Appendix A.
Motivation to Lead. This scale was the same Motivation to Lead Scale used at
Time 1, which is provided in Appendix B.
Leadership Resume. The Leadership Resume measured the participants’
engagement with leadership activities both outside of and within their workplaces,
which was modified to be applicable for college students. This scale measured college
leadership experiences. This scale had two sections, the first being the most relevant.
The first section contained 20 items where participants indicated the number of
leadership positions they held within a certain setting throughout their college years
(e.g., “Church/Religious Service: Leader”). This section was scored based on the sum of
leadership positions held. The second part had five items that asked participants how
many hours they spent on specified activities. A sample item from the second part was,
“Please indicate how many hours (on average) per week you participated in the

DYNAMIC MOTIVATION TO LEAD 17
following activities: High School Activities?” I did not analyze this section because there
was not a way to determine whether the number of hours per activity was spent being a
leader versus other roles (e.g., volunteer, founder, or member). The full scale is
available In Appendix C.
Leader Self-Identity. The Leader Self-Identity Scale is a 4-item scale developed by
Hiller (2005) that assessed to what degree the participant labeled themselves as a
leader, which measured leader identity. Day & Sin (2011) showed that this scale is
reliable with Cronbach’s alphas ranging from .80 - .86. An example item was, “I am a
leader.” Responses were collected on a Likert scale ranging from 1 (Not At All
Descriptive) to 5 (Extremely Descriptive). The scale score was calculated by averaging the
responses of each item. The full scale is in Appendix D.
Results
Primary Analyses
First, scale scores for leadership self-efficacy, motivation to lead, leader identity,
and leadership experiences were created for both time points. For leadership
experiences, many of the participants’ responses demonstrated missing data, either
meaning that participants did not reach that section of the survey or they had no
leadership experiences. Additionally, there was one outlier that responded with 23 total
leadership positions, which was more than two standard deviations away from the
mean, thus it was removed, resulting in an n = 51 for this measure. A reliability test was
conducted for each scale. Descriptive statistics and Cronbach’s alphas for these
variables can be found in Table 1. Next, the differences in MTL between Time 1 and

DYNAMIC MOTIVATION TO LEAD 18
Time 2 were calculated to create three new variables for affective-identity MTL
differences, social normative MTL differences, and noncalculative MTL differences, for
each participant. The difference variables’ descriptive statistics can also be found in
Table 1.
Correlations. Six correlations were calculated to determine the relationship
between the change in MTL over time and two predictor variables from Time 2: leader
self-efficacy and college leadership experiences. Changes in MTL were calculated by
creating a new variable with the differences between MTL at Time 1 and MTL at Time 2.
Results showed that LSE at Time 2 was positively correlated with affective-identity MTL
differences, r = .50, p < .001, social normative MTL differences, r = .49, p < .001, and
noncalculative MTL differences, r = .37, p < .001. Individuals with higher levels of
leadership self-efficacy experienced the largest increases in MTL. Figures 4, 5, and 6
display these correlations.
These correlations’ results were confirmed with regressions. First, the regression
of affective-identity MTL at Time 1 and Time 2 predicting LSE at Time 2 was tested.
Affective-identity MTL at Time 1 served as a control for affective identity MTL at Time 2.
Results indicated that the two predictors explained 40.3% of the variance (R2 = .40, F(2,
93) = 31.39, p < .001). Results were significant for affective-identity MTL at Time 2 (β =
.57, p < .001) and not for affective identity MTL at Time 1 (β = -.07, p = .45). Next, the
regression of social normative MTL at Time 1 and Time 2 predicting LSE at Time 2 was
tested, where social normative MTL at Time 1 controlling for social normative MTL at
Time 2. Results indicated the two predictors explained 33.4% of the variance (R2 = .33,

DYNAMIC MOTIVATION TO LEAD 19
F(2, 93) = 23.36, p < .001). There were significant results for social normative MTL at
Time 2 (β = .83, p < .001) and not for social normative MTL at Time 1 (β = -.23, p = .07).
Lastly, the regression of noncalculative MTL at Time 1 and Time 2 predicting LSE at Time
2 was tested, where noncalculative MTL at Time 1 was a control variable. Results
indicated that the two predictors explained 21.4% of the variance (R2 = .21, F(2, 93) =
12.68, p < .001). Results were significant for noncalculative MTL at Time 2 (β = .45, p <
.001) and not for noncalculative MTL at Time 1 (β = -.07, p = .50). These regressions
confirm the results of the previous correlation analyses.
Next, there was no significance for correlations between leadership experiences
at Time 2 and affective-identity MTL differences, r = .16, p = .25, social normative MTL
differences, r = .07, p = .63, and noncalculative MTL differences, r = .11, p = .42, showing
that the number of college leadership experiences was not related to changes in any
type of MTL. These results were confirmed with regressions. Firstly, the regression of
affective-identity MTL at Time 1 (β = -.03, p = .98) and Time 2 (β = .93, p = .17) showed
no significance in predicting leadership experiences. Secondly, the regression of social
normative MTL at Time 1 (β = .43, p = .70) and Time 2 (β = 1.22, p = .27) also showed no
significance in predicting leadership experiences. Lastly, the regression of noncalculative
MTL at Time 1 (β = -1.43, p = .17) and Time 2 (β = .17, p = .82) showed no significance in
predicting leadership experiences.
Additional correlations were conducted to test the assumptions necessary to
compute the structural equation model for the MTL malleability model depicted in
Figures 1, 2, and 3. Tables 2, 3, and 4 include correlation coefficients for each MTL

DYNAMIC MOTIVATION TO LEAD 20
category and leadership self-efficacy, leader identity, and college leadership
experiences. According to these correlations, a structural equation model would be
inappropriate to compute because several correlations were not significant, such as
social normative MTL at Time 1 and social normative MTL at Time 2, r = .13, p = .20,
noncalculative MTL at Time 1 and noncalculative MTL at Time 2, r = .15, p = .15, and
affective-identity MTL at Time 1 and LSE at Time 2, r = .10, p = .47.
Secondary Exploratory Analyses
The following analyses were completed post hoc to propose an exploratory
model that best fit the data.
Paired-samples t-test. First, a paired-samples t-test was conducted to test if
there was a difference in each MTL component between Time 1 and Time 2. Results
showed that the trend of all three types of MTL decreased over time. Affective-identity
MTL decreased the most demonstrating that affective-identity MTL at Time 1 (M = 3.78,
SD = .61) was significantly higher than affective-identity MTL at Time 2 (M = 3.47, SD =
.77), t(95) = -3.41, p < .001. The second most significant difference was between
noncalculative MTL at Time 1 (M = 3.95, SD = .59) and noncalculative MTL at Time 2 (M
= 3.78, SD = .70), t(95) = -2.00, p = .05. Social normative MTL decreased nonsignificantly
such that social normative MTL at Time 1 (M = 3.70, SD = .45) was not significantly
higher than social normative MTL at Time 2 (M = 3.60, SD = .47), t(95) = -1.64, p = .10.
Overall, between the fourth year of high school and fourth year of college, MTL
generally decreased. These findings are displayed in Table 5.

DYNAMIC MOTIVATION TO LEAD 21
Correlations. Next, the correlation between each MTL difference and leader
identity at Time 2 was conducted, testing whether the level of leader identity could be
related to how MTL changes over time. Results showed that LID at Time 2 was positively
correlated to affective-identity MTL differences, r = .55, p < .001, social normative MTL
differences, r = .49, p < .001, and noncalculative MTL differences, r = .23, p = .03.
Individuals with higher LID at the end of college have the greatest increase in MTL.
These significant correlations are graphed in Figures 7, 8, and 9.
These results were confirmed using regression analyses. First, the regression of
affective-identity MTL at Time 1 and Time 2 predicting LID at Time 2 was tested with
affective-identity MTL at Time 1 as a control. Results indicated the two predictors
explained 68.3% of the variance (R2 = .68, F(2, 93) = 100.155, p < .001). It was found that
affective-identity at Time 2 significantly predicted LID at Time 2 (β = 1.06, p < .001) while
affective-identity MTL at Time 1 (β = .12, p = .23) was not significant. Second, the
regression of social normative MTL at Time 1 and Time 2 predicting LID at Time 2 was
tested with social normative MTL at Time 1 as a control. Results indicated the two
predictors explained 25.6% of the variance (R2 = .26, F(2, 93) = 16.00, p < .001). It was
found that social normative MTL at Time 2 (β = 1.10, p < .001) was a significant predictor
while social normative MTL at Time 1 (β = -.09, p = .65) was not significant. The last
regression was for noncalculative MTL at Time 1 and Time 2 predicting LID at Time 2,
with noncalculative MTL at Time 1 as a control. Results indicated the two predictors
explained 7.3% of the variance (R2 = .07, F(2, 93) = 3.65, p = .03). It was found that

DYNAMIC MOTIVATION TO LEAD 22
noncalculative MTL at Time 2 (β = .395, p < .001) was a significant predictor while
noncalculative MTL at Time 1 (β = -.09, p = .59) was not significant.
Next, correlations were calculated between each MTL difference and the seven
subcategories of leadership experiences separately, which are presented in Table 6. The
only significant correlation was affective-identity MTL differences and on-campus clubs
and organizations leadership experiences. Individuals who were in more leadership
positions within on-campus clubs and organizations had more positive changes in their
affective-identity MTL over their college years. This significant correlation is graphed in
Figure 10. All other correlations were not significant. These results were confirmed with
regressions. The only significant regression was in affective-identity MTL at Time 1 and
Time 2 predicting leadership positions for on-campus clubs and organizations with
affective-identity MTL at Time 1 as a control variable. Results indicated the two
predictors explained 12.3% of the variance (R2 = .12, F(2, 93) = 3.43, p = .04). Affective-
identity MTL at Time 2 (β = .42, p = .02) was a significant predictor of on-campus clubs
and organizations leadership experience while affective-identity MTL at Time 1 (β = -.42,
p = .12) was not significant. Other regressions testing for MTL’s relationship to each
subsection of leadership experiences were not significant. Tables 7, 8, and 9 includes
these results.
Structural Equation Model. Next, two models were tested using path analysis
with observed variables. The maximum likelihood method was used to estimate
parameters. All analyses were performed on the correlation matrix. Model 1 was a
simple mediation effect where LID at Time 2 mediated the relationship between

DYNAMIC MOTIVATION TO LEAD 23
affective-identity MTL at Time 1 and affective-identity MTL at Time 2. Model 2 built on
Model 1 by adding LSE at Time 1 and LSE at Time 2 as predictors of affective-identity
MTL at Time 1 and affective-identity MTL at Time 2 respectively. Model 1 can be found
in Figure 11 and Model 2 can be found in Figure 12. Figures 11 and 12 show the
structural equation model outputs for each model, including path coefficients. Table 9
presents goodness-of-fit indices obtained from the path analysis for both models. Table
9 shows that out of the two models, Model 1 displayed an acceptable fit to the data
because it displayed a model chi-square statistic that was nonsignificant, χ2(2, N = 96) =
.04, p = .89. Model 2 was rejected as a good fit because it had a significant chi-squared
statistic, χ2(2, N = 96) = 52.03, p < .001. It has been recommended that a model be
viewed as displaying an acceptable fit if the SRMR is less than or equal to .08, the
RMSEA is less than or equal to .06, and the CFI and TLI are greater than or equal to .95
(e.g., Hu & Bentler, 1999; Mueller & Hancock, 2008). Again, Table 10 shows that only
Model 1 satisfied these criteria, suggesting that LID at Time 2 fully mediated the
relationship between affective-identity MTL at Time 1 and affective-identity MTL at
Time 2 without LSE. However, the indices could be problematic, as they are too close to
perfect. Thus additional statistics were necessary to further investigate the mediation
effect.
Mediation Analysis. Three linear regressions tested the full mediation effect of
leader identity at Time 2 between affective-identity MTL Time 1 and affective-identity
MTL at Time 2 (Baron & Kenny, 1986; Judd & Kenny, 1981; James & Brett, 1984). First,
the regression of whether affective-identity MTL at Time 1 predicted affective-identity

DYNAMIC MOTIVATION TO LEAD 24
MTL at Time 2 was tested. The results of the regression indicated the predictor
explained 4.5% of the variance (R2 = .05, F(1, 94) = 4.39, p = .04). It was found that
affective-identity MTL at Time 1 significantly predicted affective-identity MTL at Time 2
(β = .26, p = .04). Next, the regression of affective-identity MTL at Time 1 predicting LID
at Time 2 was tested. Results showed that the predictor explained 5.9% of the variance
(R2 = .06, F(1, 94) = 5.93, p = .02). It was found that affective-identity MTL at Time 1
significantly predicted LID Time 2 (β = .40, p = .02). Lastly, the regression of affective-
identity MTL at Time 1 and LID at Time 2 predicting affective-identity MTL at Time 2 was
tested. The results of the regression indicated that the predictors explained 67.8% of the
variance (R2 = .68, F(2, 93) = 97.9, p < .001). It was found that while LID at Time 2
significantly predicted affective-identity MTL at Time 2 (β = .62, p < .001), affective-
identity MTL at Time 1 no longer significantly predicted affective-identity MTL at Time 2
(β = .01, p = .85), suggesting that LID at Time 2 fully mediated affective-identity MTL at
Time 1 and affective-identity MTL at Time 2.
Discussion
This study looked at whether motivation to lead changes over four years of
college and motivation to lead’s changes’ predictors. The results showed that both
affective-identity MTL and noncalculative MTL significantly decreased over time, while
social normative MTL did not. Thus, this study supported the hypothesis that affective-
identity MTL changes over time. However, social normative MTL’s stability and
noncalculative MTL’s malleability was surprising because it did not support the
hypotheses. For social normative MTL, the trend of the data seemed to follow the other

DYNAMIC MOTIVATION TO LEAD 25
two MTL categories. However, the reliability test for both social normative MTL at Time
1 and Time 2 were subpar, which may contribute to the nonsignificance of social
normative MTL’s change. The change in noncalculative MTL was surprising because
previous literature did not supported it. It could be possible that college taught its
students to be more analytically-minded, thus students would be more likely to weigh
the costs and benefits of their leadership opportunities. Additionally, as college students
were presented with more opportunities for leadership, their time could have been
strained, resulting in them weighing the costs and benefits more closely over their four
college years.
Additionally, the decrease in MTL explained that high school MTL was
significantly higher than college MTL. It could be the case that most high school students
applying to colleges were motivated to become leaders because they were active in
their high school either for their own fulfillment or to look good for college admission
officers. However, when they arrived at college, they no longer felt motivated to lead
because they compared themselves to other students or realized other passions outside
of leadership.
Next, all subcategories of MTL were correlated with leadership self-efficacy such
that higher levels of LSE were correlated with larger increases in MTL. Participants who
believed in their leadership abilities and skills showed the greatest increase in all MTL
categories, which was consistent with past research by Chan and Drasgow (2001) with
the exception of noncalculative MTL. This finding aligns with the hypotheses, with the
included significance for noncalculative MTL. Students with a high belief in their

DYNAMIC MOTIVATION TO LEAD 26
leadership abilities could have learned to avoid weighing the cost and benefits of
leading throughout their college experience, thus increasing noncalculative MTL.
The only significant relationship with past leadership experience was found
between affective-identity MTL and on-campus clubs and organizations leadership
experiences such that students who had greater numbers of on-campus clubs and
organizations leadership positions had the greatest increases in affective-identity MTL
over their college years. It could be the case that students volunteered to be involved in
clubs and organizations, as there was usually no compensation for their work in on-
campus clubs and organizations. Thus, the students that got involved in on-campus
clubs and organizations enjoyed leading those communities, indicating affective-identity
MTL. As a result, students who had more leadership roles in clubs and organizations on-
campus were more likely to increase their affective-identity MTL over time.
The predicted models displayed in Figures 1, 2, and 3 could not be tested
because several necessary correlations were not significant. This analysis was surprising
because there was no significant relationship between social normative MTL and
noncalculative MTL over the two time points, even though each was measured on the
same scale. Over their four years of college, the samples’ MTL changed enough for it to
no longer be related to their high school MTL.
Leader identity was analyzed in post hoc analyses. Firstly, individuals who had
high levels of LID increased their MTL the most. For participants who identified
themselves as leaders showed the greatest increase in their motivation to become
DYNAMIC MOTIVATION TO LEAD 27
leaders for all types of motivation. So, people who call themselves leaders are more
driven to lead.
The last finding was LID’s mediation effect between affective-identity MTL at
Time 1 and Time 2. Seniors in high school want to become leaders when they go to
college. However, only students who embrace their LID continue to be motivated to
lead through their enjoyment of leading throughout college.
Overall, the results from the present study indicate that motivation to lead is
indeed malleable to a certain extent. This finding puts into question MTL’s construct
validity, as it has been regarded as a stable characteristic (Chan & Drasgow, 2001;
Reichard et al., 2011; Rosch et al., 2015; Van Iddekinge et al., 2009). Additional research
should be done to further understand MTL’s malleability. This study presented a look
into potential factors that contribute to MTL’s malleability, especially leader identity’s
mediation effect.
Implications were most apparent for higher education administrators seeing that
most students’ motivation to become leaders drop over their four years of college. This
finding is important because if students are not motivated to become leaders, they do
not take on leadership roles and limit their opportunities to develop their leadership
skills. Today, many firms and organizations hire for leadership skills in potential entry-
level hires. For higher education institutions who seek to develop their students’
leadership skills, administrators should learn how to foster their students’ motivation to
lead. To have the greatest development in motivation to lead, higher education
administrators should focus on the relationship between affective-identity motivation to

DYNAMIC MOTIVATION TO LEAD 28
lead and leader identity. If higher education administrators can foster their students’
leader identity, their students should keep being intrinsically motivated to lead.
Limitations
This study has a few limitations. The first was the small sample size as a result of
attrition. Although the first round of data collection received a large number of
participants, many participants did not fill out the second survey. Although it is difficult
to retain participants for studies that occur over multiple time points, the retention rate
in this study seemed particularly low, which could result in potential problems with
sufficient power or a selection bias.
Additionally, social normative MTL’s Cronbach’s alphas at both Time 1 and Time
2 were poor, revealing potential unreliability with the social normative MTL scale. This
could have resulted in social normative MTL’s nonsignificant change over time
compared to affective-identity MTL and noncalculative MTL.
Another limitation was how leadership experiences were measured. More than
half the participants for the Leadership Resume survey recorded missing data. Some
individuals may have skipped the question. Some participants may not have any
leadership experiences, yet did not record a zero for number of leadership positions.
Missing data could have been recorded because of how the question was presented on
Qualtrics. However, when all the missing data were converted to zero, the data were
skewed, as over half the participants would have a minimum of zero leadership
positions. As a result, we had only 51 useable observations for leadership experiences,
none of which were zero leadership positions. Additionally, the scale for leadership

DYNAMIC MOTIVATION TO LEAD 29
experiences was flawed. Instead of a Likert scale, leadership experiences were
calculated as a sum of all college leadership positions, making it statistically difficult to
compare leadership experience to motivation to lead, leadership self-efficacy, and
leader identity.
Next, this study included only two time points, thus did not have a true
longitudinal design. The results could only reveal linear changes in MTL. The changes in
MTL could be more complex than just positive, negative, or null. Although the ongoing
leadership assessment collected data at different time points, there were not enough
participants who completed measures at more than two time points to have sufficient
power.
The last limitation was methodological. The first survey was sent out to
applicants just after they applied to college, but before they heard their admissions
decision. As a result, participants may have wanted to appear like good leaders to be
admitted into their top schools, regardless of actual leadership potential. Thus, the first
survey’s scores may have been inflated. Future studies should be aware of this caveat.
Future Directions
This study only generalized to college students. Future research could test this
model in other settings, such as high potential leaders in corporate settings or high
school students in leadership development programs. These populations may reveal
different ways that MTL could develop based on varying time horizons, job
responsibilities, and stages in adolescent or adult development.

DYNAMIC MOTIVATION TO LEAD 30
Another population to test could be individuals attending colleges outside of the
United States. Different populations could reveal a difference in their motivation to lead
due to varying attitudes or cultural norms surrounding leadership in higher education.
The current study also does not incorporate a true longitudinal design, as it
included only two time points. Expanding to three time points may reveal nonlinear
changes in MTL. Possible third time points include two years after graduation or
sometime in between senior year of high school and senior year of college.
This study also focused on only three mediators. Other mediators could have
been tested. For example, if students broaden their leadership knowledge throughout
college, they could recognize some of their characteristics as leadership qualities that
they did not realize before college. Another example could be developmental self-
efficacy. Students may be more motivated to take on leadership roles if they believe in
their ability to develop their skills, particularly leadership skills. Goal orientation also
could have been a mediator, such that students with a learning goal orientation would
experience different changes in their motivation than students with a performance goal
orientation.
Lastly, this study utilized only quantitative data. Along with quantitative data,
qualitative data could have provided a deeper analysis into why the observed changes in
MTL existed. Selecting a handful of participants randomly from the sample to conduct
an interview could have also shown more directions for mediators and moderators to
test in future research.

DYNAMIC MOTIVATION TO LEAD 31
References
Adams, J. S. (1963). Towards an understanding of inequity. The Journal of Abnormal and
Social Psychology, 67(5), 422–436. doi:10.1037/h0040968
Adams, J. S. (1966). Inequity in social exchange. Advances in Experimental Social
Psychology, 2, 267–299. doi:10.1016/S0065-2601(08)60108-2
Amabile, T. M. (1993). Motivational synergy: Toward new conceptualizations of intrinsic
and extrinsic motivation in the workplace. Human Resource Management
Review, 3(3), 185–201. doi:10.1016/1053-4822(93)90012-S
Amabile, T. M., Hill, K. G., Hennessey, B. A., & Tighe, E. M. (1994). The work preference
inventory: Assessing intrinsic and extrinsic motivational orientations. Journal of
Personality and Social Psychology, 66(5), 950–967. doi:10.1037/0022-
3514.66.5.950
Amit, K., Lisak, A., Popper, M., & Gal, R. (2007). Motivation to lead: Research on the
motives for undertaking leadership roles in the Israel Defense Forces (IDF).
Military Psychology, 19(3), 137–160.
http://dx.doi.org/10.1080/08995600701386317
Baldwin, T. T., Magjuka, R. J., & Loher, B. (1991). The perils of participation: Effects of
the choice of training on trainee motivation and learning. Personnel Psychology,
44(1), 51–65. https://doi.org/10.1111/j.1744-6570.1991.tb00690.x
Bandura, A. (1994). Self-efficacy. In V. S. Ramachaudran (Ed.), Encyclopedia of human
behavior (Vol. 4, pp. 71–81). New York: Academic Press. (Reprinted in H.

DYNAMIC MOTIVATION TO LEAD 32
Friedman [Ed.], Encyclopedia of mental health. San Diego: Academic Press,
1998).
Baron, R. M., & Kenny, D. A. (1986). The moderator-mediator variable distinction in
social psychological research: Conceptual, strategic and statistical
considerations. Journal of Personality and Social Psychology, 51(6), 1173–1182.
http://dx.doi.org/10.1037/0022-3514.51.6.1173
Bartol, K. M., & Martin, D. C. (1998). Management. Mcgraw-Hill College.
Beretti, A., Figuières, C., & Grolleau, G. (2013). Using money to motivate both ‘saints’
and ‘sinners’: A field experiment on motivational crowding-out. Kyklos, 66(1),
63–77. doi:10.1111/kykl.2013.66.issue-1
Bergner, S., Kanape, A., & Rybnicek, R. (2018). Taking an interest in taking the lead: The
influence of vocational interests, leadership experience and success on the
motivation to lead. Applied Psychology, 68(1), 202–219. doi:10.1111/apps.12150
Chan, K. Y., & Drasgow, F. (2001). Toward a theory of individual differences and
leadership: Understanding the motivation to lead. Journal of Applied Psychology,
86(3), 481–498. doi:10.1037/0021-9010.86.3.481
Cho, Y. & Harrist, S. & Steele, M., & Murn, L. T. (2015). College student motivation to
lead in relation to basic psychological need satisfaction and leadership self-
efficacy. Journal of College Student Development, 56(1), 32–44. Retrieved from:
https://eric.ed.gov/?id=EJ1061354

DYNAMIC MOTIVATION TO LEAD 33
Chopin, S. M., Danish, S. J., Seers, A., & Hook, J. N. (2012). Effects of mentoring on the
development of leadership self‐efficacy and political skill. Journal of Leadership
Studies, 6(3), 17–32. doi:10.1002/jls.21253
Dansereau, F., Graen G., & Haga, W. F. (1975). A vertical dyad linkage approach to
leadership within formal organizations: A longitudinal investigation of the role
making process. Organizational Behavior and Human Performance, 13(1), 46–78.
doi:10.1016/0030-5073(75)90005-7
Day, D. V., & Sin, H. P. (2011). Longitudinal tests of an integrative model of leader
development: Charting and understanding developmental trajectories. The
Leadership Quarterly, 22(3), 545–560. https://doi-
org.ccl.idm.oclc.org/10.1016/j.leaqua.2011.04.011
DeRue, D. S., Nahrgang, J. D., Hollenbeck, J. R., & Workman, K. (2012). A quasi-
experimental study of after-event reviews and leadership development. Journal
of Applied Psychology, 97(5), 997–1015. https://doi-
org.ccl.idm.oclc.org/10.1037/a0028244
Dornyei, Z., & Ushioda, E. (2014). Teaching and researching motivation. London,
England: Routledge.
Evans, M. G. (1970). The effects of supervisory behavior on the path-goal relationship.
Organizational Behavior and Human Performance, 5(3), 277–298.
doi:10.1016/0030-5073(70)90021-8

DYNAMIC MOTIVATION TO LEAD 34
Fitzgerald, S., & Schutte, N. S. (2010). Increasing transformational leadership through
enhancing self-efficacy. Journal of Management Development, 29(5), 495–505.
https://doi-org.ccl.idm.oclc.org/10.1108/02621711011039240
García, I. A. L., Moscoso, S., & Ramos, V. P. J. (2012). Reactions to the fairness of
promotion methods: Procedural justice and job satisfaction. International
Journal of Selection and Assessment, 20(4), 394–403. doi:10.1111/ijsa.12002
Gist, M. E., & Mitchell, T. R. (1992). Self-efficacy: A theoretical analysis of its
determinants and malleability. The Academy of Management Review, 17(2),
183–211. doi:10.2307/258770
Hannah, S. T., Avolio, B., Luthans, F., & Harms, P. D. (2008). Leadership efficacy: Review
and future directions. The Leadership Quarterly (2008), 19(6), 669–692.
doi:10.1016/j.leaqua.2008.09.007
Hardcastle, S. J., Hancox, J., Hattar, A., Maxwell-Smith, C., Thøgersen-Ntoumani, C., &
Hagger, M. S. (2015). Motivating the unmotivated: How can health behavior be
changed in those unwilling to change?. Frontiers in psychology, 6(835).
doi:10.3389/fpsyg.2015.00835
Hersey, P., & Blanchard, K. H. (1969). Management of organizational behavior: Utilizing
human resources. Englewood Cliffs, NJ: Prentice-Hall.
Hiller, N. J. (2005). An examination of leadership beliefs and leadership self-identity:
Constructs, correlates, and outcomes (Unpublished doctoral dissertation). The
Pennsylvania State University, State College, PA.

DYNAMIC MOTIVATION TO LEAD 35
House, R.J. (1971). A path-goal theory of leader effectiveness. Administrative Science
Quarterly, 16(3), 321–328. doi:10.2307/2391905
House, R. J., & Mitchell, R. R. (1974). Path-goal theory of leadership. Journal of
Contemporary Business, 3, 81–97.
Hu, L. T., & Bentler, P. M. (1999). Cutoff criteria for fit indexes in covariance structure
analysis: Conventional criteria versus new alternatives. Structural Equation
Modeling, 6(1), 1–55. http://dx.doi.org/10.1080/10705519909540118
James, L. R., & Brett, J. M. (1984). Mediators, moderators and tests for mediation.
Journal of Applied Psychology, 69(2), 307–321. doi:10.1037/0021-9010.69.2.307
Joo, M. K., Yu, G. C., & Atwater, L. (2018). Formal leadership mentoring and motivation
to lead in South Korea. Journal of Vocational Behavior, 107, 310–326.
https://doi-org.ccl.idm.oclc.org/10.1016/j.jvb.2018.05.010
Judd, C. M., & Kenny, D. A. (1981). Process analysis: Estimating mediation in treatment
evaluations. Evaluation Review, 5(5), 602–619.
Koch, A. K., & Nafziger, J. (2012). Job assignments under moral hazard: The Peter
principle revisited. Journal of Economics and Management Strategy, 21(4), 1029–
1059. https://doi.org/10.1111/j.1530-9134.2012.00347.x
Komives, S. R., Owen, J. E., Longerbeam, S. D., Mainella, F. C., & Osteen, L. (2005).
Developing a leadership identity: A grounded theory. Journal of College Student
Development, 46(6), 593–611. doi:10.1353/csd.2005.0061
Kreitner, R., & Kinicki, A. (2004). Organizational behavior (6th Ed). Boston, M.A.:
McGraw Hill/Irwin

DYNAMIC MOTIVATION TO LEAD 36
McClelland, D. C. (1961). The achieving society. Oxford, England: Van Nostrand.
McClelland, D. C. (1975). Power: The inner experience. Oxford, England: Irvington.
Midgett, A., Hausheer, R., & Doumas, D. M. (2016). Training counseling students to
develop group leadership self-efficacy and multicultural competence through
service learning. Journal for Specialists in Group Work, 41(3), 262–282.
doi:10.1080/01933922.2016.1186765
Miscenko, D., & Day, D. V. (2016). Identity and identification at work. Organizational
Psychology Review, 6(3), 215–247. doi:10.1177/2041386615584009
Miscenko, D., Guenter, H., & Day, D. V. (2017). Am I a leader? Examining leader identity
development over time. The Leadership Quarterly, 28(5), 605–620. https://doi-
org.ccl.idm.oclc.org/10.1016/j.leaqua.2017.01.004
Mueller, R. & Hancock, G. (2008). Best practices in structural equation modeling. In
Osborne, J. Best practices in quantitative methods (pp. 488–508). Thousand
Oaks, CA: SAGE Publications, Inc. doi:10.4135/9781412995627
Murayama, K. (2018, June). The science of motivation. Psychological Science Agenda.
Retrieved from https://www.apa.org
Murphy, S. E. (1992). The contribution of leadership experience and self-efficacy to group
performance under evaluation apprehension. (Unpublished doctoral
dissertation). University of Washington, Seattle.
Park, S. M. (2010). The effects of personnel reform systems on Georgia state employees’
attitudes: An empirical analysis from a principal-agent theoretical perspective.
Public Management Review, 12(3), 403–437. doi:10.1080/14719030903286631

DYNAMIC MOTIVATION TO LEAD 37
Priest, K. L., & Middleton, E. (2016). Exploring leader identity and development. New
Directions for Student Leadership, 2016(149), 37–47. doi:10.1002/yd.20160
Pyle, L. K. (2014). Changes in leadership self-efficacy, leader identity, capacity for socially
responsible leadership, and curiosity due to a structured leader development
program. Dissertation Abstracts International: Section A. Humanities and Social
Sciences. ProQuest Information & Learning. Retrieved from
http://search.ebscohost.com.ccl.idm.oclc.org/login.aspx?direct=true&db=psyh&
AN=2014-99111-093&site=ehost-live&scope=site
Reichard, R. J., Riggio, R. E., Guerin, D. W., Oliver, P. H., Gottfried, A. W., & Gottfried, A.
E. (2011). A longitudinal analysis of relationships between adolescent personality
and intelligence with adult leader emergence and transformational leadership.
The Leadership Quarterly, 22(3), 471–481.
http://dx.doi.org/10.1016/j.leaqua.2011.04.005
Rosch, D. M., Collier, D., & Thompson, S. E. (2015). An exploration of students'
motivation to lead: An analysis by race, gender, and student leadership
behaviors. Journal of College Student Development, 56(3) 286–291.
doi:10.1353/csd.2015.0031
Satyawadi, R., & Ghosh, P. (2012). Motivation and work values in Indian public and
private sector enterprises: A comparative study. International Journal of Human
Resources Development and Management, 12(3), 237–253.
doi:10.1504/IJHRDM.2012.048628

DYNAMIC MOTIVATION TO LEAD 38
Sekhar, C., Patwardhan, M., & Singh, R. K. (2013). A literature review on motivation.
Global Business Perspectives, 1(4), 471–487. https://doi.org/10.1007/s40196-
013-0028-1
Steers, R. M., Mowday, R. T., & Shapiro, D. L. (2004) The future of work motivation
theory. Academy of management review, 29(3), 379-387. doi:10.2307/20159049
Steers, R. M., & Porter, L. W. (Eds.) (1991). Motivation and Work Behavior (5th ed.). New
York: McGraw-Hill.
Stryker, S., & Burke, P. J. (2000). The past, present, and future of an identity theory.
Social Psychology Quarterly, 63(4), 284–297. doi:10.2307/2695840
Turner, J. C., & Patrick, H. (2008) How does motivation develop and why does it change?
Reframing motivation research, Educational Psychologist, 43(3), 119–131.
doi:10.1080/00461520802178441
Van Iddekinge, C. H., Ferris, G. R., & Heffner, T. S. (2009). Test of a multistage model of
distal and proximal antecedents of leader performance. Personnel Psychology,
62(3), 463-495. http://dx.doi.org/10.1111/j.1744-6570.2009.01145.x
Waldman, D. A., Galvin, B. M., & Walumbwa, F. O. (2013). The development of
motivation to lead and leader role identity. Journal of Leadership &
Organizational Studies, 20(2), 156–168. https://doi-
org.ccl.idm.oclc.org/10.1177/1548051812457416
Welch, D., Grossaint, K., Reid, K., & Walker, C. (2014). Strengths-based leadership
development: Insights from expert coaches. Consulting Psychology Journal:

DYNAMIC MOTIVATION TO LEAD 39
Practice and Research, 66(1), 20–37. https://doi-
org.ccl.idm.oclc.org/10.1037/cpb0000002
Wigfield, A., Gladstone, J., & Turci, L. (2016). Beyond cognition: Reading motivation and
reading comprehension. Child development perspectives, 10(3), 190–195.
doi:10.1111/cdep.12184
Wilson, R. (2001). Beggar, psychologist, mediator, maid: The thankless job of a
chairman. Chronicle of Higher Education, 47(25), 10–12. Retrieved from
www.chronicle.com
Yeager, K. L., & Callahan, J. L. (2016). Learning to lead: Foundations of emerging leader
identity development. Advances in Developing Human Resources, 18(3), 286–
300. https://doi.org/10.1177/1523422316645510
DYNAMIC MOTIVATION TO LEAD 40
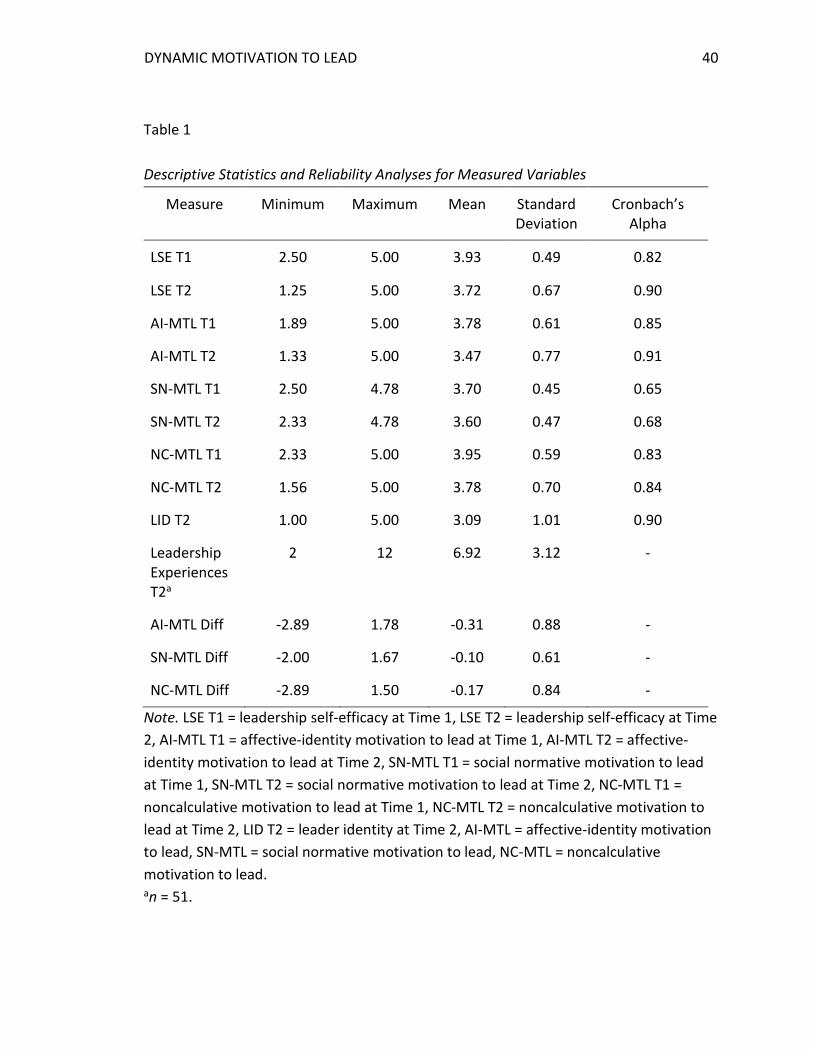
Table 1
Descriptive Statistics and Reliability Analyses for Measured Variables
Measure Minimum Maximum Mean Standard Deviation
Cronbach’s Alpha
LSE T1 2.50 5.00 3.93 0.49 0.82
LSE T2 1.25 5.00 3.72 0.67 0.90
AI-MTL T1 1.89 5.00 3.78 0.61 0.85
AI-MTL T2 1.33 5.00 3.47 0.77 0.91
SN-MTL T1 2.50 4.78 3.70 0.45 0.65
SN-MTL T2 2.33 4.78 3.60 0.47 0.68
NC-MTL T1 2.33 5.00 3.95 0.59 0.83
NC-MTL T2 1.56 5.00 3.78 0.70 0.84
LID T2 1.00 5.00 3.09 1.01 0.90
Leadership Experiences T2a
2 12 6.92 3.12 -
AI-MTL Diff -2.89 1.78 -0.31 0.88 -
SN-MTL Diff -2.00 1.67 -0.10 0.61 -
NC-MTL Diff -2.89 1.50 -0.17 0.84 -
Note. LSE T1 = leadership self-efficacy at Time 1, LSE T2 = leadership self-efficacy at Time
2, AI-MTL T1 = affective-identity motivation to lead at Time 1, AI-MTL T2 = affective-
identity motivation to lead at Time 2, SN-MTL T1 = social normative motivation to lead
at Time 1, SN-MTL T2 = social normative motivation to lead at Time 2, NC-MTL T1 =
noncalculative motivation to lead at Time 1, NC-MTL T2 = noncalculative motivation to
lead at Time 2, LID T2 = leader identity at Time 2, AI-MTL = affective-identity motivation
to lead, SN-MTL = social normative motivation to lead, NC-MTL = noncalculative
motivation to lead. an = 51.

DYNAMIC MOTIVATION TO LEAD 41
Table 2
Correlations for Affective-Identity Motivation to Lead and Measured Mediators
Measure 1 2 3 4 5 6
AI-MTL T1 -
AI-MTL T2 0.21* -
LSE T1 0.51** 0.10 -
LSE T2 0.08 0.63** 0.09 -
LID T2 0.24* 0.82** 0.13 0.64** -
Leadership Experiences T2
0.06 0.20 0.04 0.12 0.21 -
Note. AI-MTL T1 = affective-identity motivation to lead at Time 1, AI-MTL T2 = affective-
identity motivation to lead at Time 2, LSE T1 = leadership self-efficacy at Time 1, LSE T2 =
leadership self-efficacy at Time 2, LID T2 = leader identity at Time 2, ** p < .01, * p < .05.

DYNAMIC MOTIVATION TO LEAD 42
Table 3
Correlations for Social Normative Motivation to Lead and Measured Mediators
Measure 1 2 3 4 5 6
SN-MTL T1 -
SN-MTL T2 0.13 -
LSE T1 0.33** 0.32** -
LSE T2 -0.08 0.56** 0.09 -
LID T2 0.03 0.50** 0.13 0.64** -
Leadership Experiences T2
0.07 0.16 0.04 0.12 0.21 -
Note. SN-MTL T1 = social normative motivation to lead at Time 1, SN-MTL T2 = social
normative motivation to lead at Time 2, LSE T1 = leadership self-efficacy at Time 1, LSE
T2 = leadership self-efficacy at Time 2, LID T2 = leader identity at Time 2, ** p < .01.

DYNAMIC MOTIVATION TO LEAD 43
Table 4
Correlations for Noncalculative Motivation to Lead and Measured Mediators
Measure 1 2 3 4 5 6
NC-MTL T1 -
NC-MTL T2 0.15 -
LSE T1 0.35** 0.00 -
LSE T2 0.01 0.46** 0.09 -
LID T2 -0.01 0.26** 0.13 0.64** -
Leadership Experiences T2
-0.19 -0.01 0.04 0.12 0.21 -
Note. NC-MTL T1 = noncalculative motivation to lead at Time 1, NC-MTL T2 =
noncalculative motivation to lead at Time 2, LSE T1 = leadership self-efficacy at Time 1,
LSE T2 = leadership self-efficacy at Time 2, LID T2 = leader identity at Time 2, ** p < .01.

DYNAMIC MOTIVATION TO LEAD 44
Table 5
Contrast of Time 1 With Time 2 For Each Component of Motivation to Lead
Variable
Time 1 Time 2 95% CI
M SD M SD t(95) p LL UL
AI-MTL 3.78 .61 3.47 .77 -3.41 .00 .13 .48 SN-MTL 3.70 .45 3.60 .47 -1.64 .10 -.02 .22 NC-MTL 3.95 .59 3.78 .70 -2.00 .05 .00 .34
Note. AI-MTL = affective-identity motivation to lead, SN-MTL = social normative
motivation to lead, NC-MTL = noncalculative motivation to lead, CI = confidence
interval, LL = lower limit, UL = upper limit.

DYNAMIC MOTIVATION TO LEAD 45
Table 6
Correlations for Motivation to Lead Differences and Leadership Experiences
Subcategories
Leadership Experience
Subcategories
Affective-Identity MTL Differences
Noncalculative MTL Differences
Social Normative MTL Differences
Church/Religious Service
-.02 -0.00 -0.14
Community Service -.09 .11 -.16
Employment .06 .11 .05
Internship .07 -.15 .03
Sports Team .00 -.01 -.16
Club/Organization (On-campus)
.33* -.28 -.01
Club/Organization (On-campus)
-.13 .01 -.15
Note. MTL = motivation to lead, * p < .05.

DYNAMIC MOTIVATION TO LEAD 46
Table 7
Regressions of Affective-Identity Motivation to Lead Predicting Each Subcategory of
Leadership Experiences
Subcategory of Leadership Experience
Predictors Church/Religious Service
Community Service
Employment Internship Sports Team
Club/Org (On-
Campus)
Club/Org (Off-
Campus)
AI-MTL T1 .10 .20 -.04 -.05 .12 -.42 .07
AI-MTL T2 .11 .13 .17 .09 .11 .42* -.10
R2 .03 .04 .01 .01 .03 .12 .03
F-test .76 .90 .31 .29 .80 3.43 .64
Note. AI-MTL T1 = affective-identity motivation to lead at Time 1, AI-MTL T2 = affective-
identity motivation to lead at Time 2, * p < .05.

DYNAMIC MOTIVATION TO LEAD 47
Table 8
Regressions of Social Normative Motivation to Lead Predicting Each Subcategory of
Leadership Experiences
Subcategory of Leadership Experience
Predictors Church/Religious Service
Community Service
Employment Internship Sports Team
Club/Org (On-
Campus)
Club/Org (Off-
Campus)
SN-MTL T1 .06 .09 -.11 -.03 .24 .15 .03
SN-MTL T2 .18 .33 .32 .16 .18 .31 -.26
R2 .02 .03 .02 .01 .05 .03 .06
F-test .46 .83 .46 .33 1.23 .72 1.56
Note. SN-MTL T1 = social normative motivation to lead at Time 1, SN-MTL T2 = social
normative motivation to lead at Time 2.

DYNAMIC MOTIVATION TO LEAD 48
Table 9
Regressions of Noncalculative Motivation to Lead Predicting Each Subcategory of
Leadership Experiences
Subcategory of Leadership Experience
Predictors Church/Religious Service
Community Service
Employment Internship Sports Team
Club/Org (On-
Campus)
Club/Org (Off-
Campus)
NC-MTL T1 -.35 -.53* -.48 -.19 -.29 .67* -.27*
NC-MTL T2 .08 .25 .20 -.16 .02 -.08 -.14
R2 .06 .10 .05 .06 .04 .11 .15
F-test 1.68 2.65 1.24 1.67 1.14 3.13 4.19*
Note. NC-MTL T1 = noncalculative motivation to lead at Time 1, NC-MTL T2 =
noncalculative motivation to lead at Time 2, * p < .05.

DYNAMIC MOTIVATION TO LEAD 49
Table 10
Structural Equation Model Indices for Model 1 and Model 2
Model χ2
Model χ2 df p χ2/df SRMR RMSEA CFI TLI
Model 1 0.036 2 0.849 0.18 0.004 0.000 1.000 1.026
Model 2 52.031 4 0.000 13.00 0.206 0.313 0.755 0.560
Note. N = 96, SRMR = standardized root-mean square residual; RMSEA = root-mean-
square error of approximation, CFI = comparative fit index, TLI = tucker-lewis index.
Model 1 is the simple mediation model in Figure 11. Model 2 is the complex model
displayed in Figure 12.

DYNAMIC MOTIVATION TO LEAD 50
Figure 1. Hypothesized significant pathways. Solid lines are predicted to be significant.
AI-MTL T1 = affective-identity motivation to lead at Time 1. AI-MTL T2 = affective-
identity motivation to lead at Time 2. LSE T2 = leadership self-efficacy at Time 2. LID T2 =
leader identity at Time 2. * Effect controls for affective-identity motivation to lead at
Time 1.
Partial Mediators (LSE
T2, Leadership
Experience
AI-MTL T1 LID T2* AI-MTL T2

DYNAMIC MOTIVATION TO LEAD 51
Figure 2. Hypothesized significant pathways. Solid lines are predicted to be significant.
SN-MTL T1 = social normative motivation to lead at Time 1. LSE T2 = leadership self-
efficacy at Time 2. SN-MTL T2 = social normative motivation to lead at Time 2.
Partial Mediators (LSE
T2, Leadership
Experience
SN-MTL T1 SN-MTL T2

DYNAMIC MOTIVATION TO LEAD 52
Figure 3. Hypothesized significant pathways. Solid lines are predicted to be significant.
Dashed lines are predicted to be nonsignificant. NC-MTL T1 = noncalculative motivation
to lead at Time 1. LSE T2 = leadership self-efficacy at Time 2. NC-MTL T2 = noncalculative
motivation to lead at Time 2.
Partial Mediators (LSE
T2, Leadership
Experience
NC-MTL T1 NC-MTL T2

DYNAMIC MOTIVATION TO LEAD 53
Figure 4. Correlation between leadership self-efficacy at Time 2 and affective-identity
motivation to lead differences. T2 LSE = leadership self-efficacy at Time 2. AI-MTL =
affective-identity motivation to lead.

DYNAMIC MOTIVATION TO LEAD 54
Figure 5. Correlation between leadership self-efficacy at Time 2 and social normative
motivation to lead differences. T2 LSE = leadership self-efficacy at Time 2. SN-MTL =
social normative motivation to lead.

DYNAMIC MOTIVATION TO LEAD 55
Figure 6. Correlation between leadership self-efficacy at Time 2 and noncalculative
motivation to lead differences. T2 LSE = leadership self-efficacy at Time 2. NC-MTL =
noncalculative motivation to lead.

DYNAMIC MOTIVATION TO LEAD 56
Figure 7. Correlation between leader identity at Time 2 and affective-identity motivation
to lead differences. T2 LID = leader identity at Time 2. AI-MTL = affective-identity
motivation to lead.

DYNAMIC MOTIVATION TO LEAD 57
Figure 8. Correlation between leader identity at Time 2 and social normative motivation
to lead differences. T2 LID = leader identity at Time 2. SN-MTL = social normative
motivation to lead.

DYNAMIC MOTIVATION TO LEAD 58
Figure 9. Correlation between leader identity at Time 2 and noncalculative motivation to
lead differences. T2 LID = leader identity at Time 2. NC-MTL = noncalculative motivation
to lead.

DYNAMIC MOTIVATION TO LEAD 59
Figure 10. Correlation between on-campus clubs and organizations leadership positions
and affective-identity motivation to lead differences. AI-MTL = affective-identity
motivation to lead.

DYNAMIC MOTIVATION TO LEAD 60
Figure 11. Simple mediation model with leader identity at Time 2 mediating the
relationship between affective-identity motivation to lead at Time 1 and affective-
identity motivation to lead at Time 2. AI-MTL T1 = affective-identity motivation to lead
at Time 1. LID T2 = leader identity at Time 2. AI-MTL T2 = affective-identity motivation to
lead at Time 2.

DYNAMIC MOTIVATION TO LEAD 61
Figure 12. Complex model with leader identity at Time 2 mediating the relationship
between affective-identity motivation to lead at Time 1 and affective-identity
motivation to lead at Time 2 with leadership self-efficacy as predictors of affective-
identity motivation to lead at each time point. LSE T1 = leadership self-efficacy at Time
1. AI-MTL T1 = affective-identity motivation to lead at Time 1. LID T2 = leader identity at
Time 2. LSE T2 = leadership self-efficacy at Time 2. AI-MTL T2 = affective-identity
motivation to lead at Time 2.

DYNAMIC MOTIVATION TO LEAD 62
Appendix A
Leadership Self-Efficacy Scale
Directions – The following page contains 8 statements that indicate an attitude or
behavior related to leadership that may or may not be characteristic or descriptive of
you. Read each statement carefully and indicate the degree to which you agree with
each statement.
1 2 3 4 5 Disagree Strongly
Disagree Neither Agree nor Disagree
Agree Agree Strongly
1. I feel that I know a lot more than most leaders about what it takes to be a good leader.
2. I know what it takes to make a work group accomplish its task. 3. In general, I am very good at leading a group of my peers. 4. I am confident of my ability to influence a work group that I lead. 5. I know what it takes to keep a work group running smoothly. 6. I know how to encourage good work group performance. 7. I feel comfortable allowing most group members to contribute to the task when I
am leading a work group. 8. Overall, I believe that I can lead a work group successfully.

DYNAMIC MOTIVATION TO LEAD 63
Appendix B
Motivation to Lead Scale
Directions - The following page contains statements that indicate an attitude or
behavior related to leadership that may or may not be characteristic or descriptive of
you. Read each statement carefully and indicate the degree to which you disagree or
agree with each statement. Keep in mind that there are no right or wrong answers.
1 2 3 4 5 Disagree Strongly
Disagree Neither Agree nor Disagree
Agree Agree Strongly
1. Most of the time, I prefer being a leader rather than a follower when working in a group.
2. I am the type of person who is not interested to lead others. 3. I am only interested to lead a group if there are clear advantages for me. 4. I will never agree to lead if I cannot see any benefits from accepting that role. 5. I am definitely not a leader by nature. 6. I feel that I have a duty to lead others if I am asked. 7. I agree to lead whenever I am asked or nominated by the other members. 8. I am the type of person who likes to be in charge of others. 9. I have more of my own problems to worry about than to be concerned about the
rest of the group. 10. I would never agree to lead just because others voted for me. 11. Leading others is really more of a dirty job rather than an honorable one. 12. I believe I can contribute more to a group if I am a follower rather than a leader. 13. I was taught to believe in the value of leading others. 14. It is appropriate for people to accept leadership roles or positions when they are
asked. 15. I usually want to be the leader in the groups that I work in. 16. I am the type who would actively support a leader but prefers not to be appointed
as leader. 17. I have a tendency to take charge in most groups or teams that I work in. 18. I would only agree to be a group leader if I know I can benefit from that role. 19. I would agree to lead others even if there are no special rewards or benefits with
that role. 20. I would want to know “what’s in it for me” if I am going to agree to lead a group. 21. I am seldom reluctant to be the leader of a group. 22. I have been taught that I should always volunteer to lead others if I can. 23. It is not right to decline leadership roles. 24. It is an honor and privilege to be asked to lead. 25. I never expect to get more privileges if I agree to lead a group.

DYNAMIC MOTIVATION TO LEAD 64
26. If I agree to lead a group, I would never expect any advantages or special benefits. 27. People should volunteer to lead rather than wait for others to ask or vote for them.

DYNAMIC MOTIVATION TO LEAD 65
Appendix C
Leadership Resume
Please indicate the number of positions that you have held in each of the following areas…: College Activities: Founder College Activities: Leader College Activities: Member College Activities: Volunteer Church/Religious Service: Founder Church/Religious Service: Leader Church/Religious Service: Member Church/Religious Service: Volunteer Community Service: Founder Community Service: Leader Community Service: Member Community Service: Volunteer Employment: Founder Employment: Leader Employment: Member Employment: Volunteer Internship: Founder Internship: Leader Internship: Member Internship: Volunteer Please indicate how many hours (on avg) per week you participated in the following activities: College Activities: Average hours per week Church/Religious Service: Average hours per week Community Service: Average hours per week Employment: Average hours per week Internship: Average hours per week

DYNAMIC MOTIVATION TO LEAD 66
Appendix D
Leader Self-Identity Scale
Directions – Please rate the extent to which the following statements describe you,
from “Not at all descriptive” to “Extremely descriptive.”
1 2 3 4 5 Not At All
Descriptive Extremely
Descriptive
_____ 1. I am a leader
_____ 2. I see myself as a leader
_____
3. If I had to describe myself to others I would include the
word leader
_____ 4. I prefer being seen by others as a leader