an assessment of the accuracy and potential of lidar in
TRANSCRIPT
Renewable Energy Systems and the Environment MSc Thesis Ian Horsfield
1
Department of Mechanical and Aerospace Engineering
An Assessment of the Accuracy and Potential of
LIDAR in the Wind Industry
Author: Ian Horsfield
Supervisor: Dr. Andrew Grant
A thesis submitted in partial fulfilment for the requirement of the degree
Master of Science in Renewable Energy Systems and the Environment
2014

Renewable Energy Systems and the Environment MSc Thesis Ian Horsfield
2

Renewable Energy Systems and the Environment MSc Thesis Ian Horsfield
3
Acknowledgements
I would like to extend my thanks to my family and friends for their support and advice
throughout the course of this thesis.
I would like to acknowledge my employers support which allowed me to complete
this thesis in a part time capacity. Without the ability to do this it would never have
been possible.
Finally and most importantly I would like to thank my supervisor, Dr. Andrew Grant,
for his continued support throughout my MSc journey and in particular with this
thesis.

Renewable Energy Systems and the Environment MSc Thesis Ian Horsfield
4
Abstract
Accuracy in wind resource assessment is becoming increasingly important with the
growing need for the wind industry to reduce the cost of energy. Remote wind
measurement devices such as LIDAR are well known and are used to help wind
resource predictions. However, the use of LIDAR as a single source of measurement
is not fully accepted.
This thesis explores the use of LIDAR and the accuracy of the device’s measurement
relative to the industry accepted meteorological (Met) Mast. A LIDAR is to be
installed at an onshore location and the accuracy of its measurement campaign is to be
compared to that of a Met Mast. The process for installing the LIDAR is documented
and the analysis discussed. A Power Performance Test (PPT) is conducted using a
Met Mast to assess other areas where LIDAR can add value. The value of the PPT is
proven and the benefit which can be realised through the use of a LIDAR is
determined. The current and future of resource assessment is discussed, and the
potential for LIDAR devices to provide innovative solutions within the industry is
evaluated.
This thesis shows that a Met Mast is an accurate form of wind measurement and that
PPTs have value as it is not unusual for a wind turbine to be significantly
underperforming. LIDAR measurement accuracy will continue to improve and are
likely to have significant impact on the wind industry in the coming years.

Renewable Energy Systems and the Environment MSc Thesis Ian Horsfield
5
Table of Contents
1. Introduction ............................................................................................................ 8
2. Objectives ............................................................................................................. 10
2.1. Primary Objective ......................................................................................... 10
2.2. Secondary Objective ..................................................................................... 11
3. Literary Survey ..................................................................................................... 12
3.1. Wind Turbines ............................................................................................... 13
3.2. Resource Assessment .................................................................................... 16
3.3. Wind Monitoring Technologies .................................................................... 17
4. Theoretical ............................................................................................................ 24
4.1. Uncertainty in Wind Measurement ............................................................... 24
4.2. The Emergence of LIDAR ............................................................................ 26
4.3. Power Performance Testing .......................................................................... 28
5. Experimental ......................................................................................................... 32
5.1. Met Mast Details ........................................................................................... 33
5.2. LIDAR details ............................................................................................... 35
5.3. Measurement Campaign ................................................................................ 37
5.4. Power Performance Test ............................................................................... 38
6. Discussion of Results............................................................................................ 52
7.1. Measurement Campaign ................................................................................ 52
7.2. Power Performance Test ............................................................................... 54
8. Future Work .......................................................................................................... 59
9. Conclusions .......................................................................................................... 62
10. References ......................................................................................................... 64

Renewable Energy Systems and the Environment MSc Thesis Ian Horsfield
6
Table of Figures
Figure 1: How wind is created [7] ............................................................................... 12
Figure 2: Wind Turbine Example ................................................................................ 13
Figure 3: Wind Turbine Power Curve Example [8]..................................................... 14
Figure 4: Mechanical Cup Anemometer Example [10] ............................................... 18
Figure 5: Propeller Anemometer Example [11]........................................................... 19
Figure 6: Ultrasonic Anemometer [12] ........................................................................ 19
Figure 7: Meteorological Mast Example ..................................................................... 21
Figure 8: LIDAR and SODAR Example [13].............................................................. 23
Figure 9: Measurement Height/Distance According to IEC Standards ....................... 30
Figure 10: Reference Met Mast for Measurement Campaign ..................................... 33
Figure 11: Onsite LIDAR and Met Mast Configuration Schematic ............................ 34
Figure 12: Onsite Location of Equipment ................................................................... 34
Figure 13: Onsite Power Supply for LIDAR ............................................................... 36
Figure 14: Onsite LIDAR Arrangement ...................................................................... 36
Figure 15: Onsite Security Fence Protection for LIDAR ............................................ 37
Figure 16: Wind Farm Layout ..................................................................................... 39
Figure 17: Met Mast Direction Data plotted against Yaw Angle of the Wind Turbine
Data .............................................................................................................................. 40
Figure 18: Direction Data for the Met Mast plotted against Vortex Hindcast Data .... 41
Figure 19: Wind Speed and Direction Data for Wind Turbine plotted against Met
Mast Data ..................................................................................................................... 42
Figure 20: Wind Turbine power output versus Rotor RPM ........................................ 44
Figure 21: Plan View of LIDAR on Offshore Wind Turbine Transition Piece ........... 46

Renewable Energy Systems and the Environment MSc Thesis Ian Horsfield
7
Figure 22: Location of LIDAR on Offshore Wind Turbine Transition Piece ............. 47
Figure 23: LIDAR Stability Confirmation ................................................................... 49
Figure 24: LIDAR Direction Confirmation ................................................................. 49
Figure 25: LIDAR Wind Speed and Direction Profiles ............................................... 50
Figure 26: LIDAR Setting 1 ........................................................................................ 51
Figure 27: LIDAR Setting 2 ........................................................................................ 51
Figure 28: Wind Speed Data for Met Mast Plotted against LIDAR ............................ 52
Figure 29: Wind Direction Data for Met Mast Plotted against LIDAR ...................... 53
Figure 30: Power Performance Test Results ................................................................ 55
Figure 31: Offshore Installation Trouble Shooting ...................................................... 57
Figure 32: LIDAR Setting 3 ........................................................................................ 57
Figure 33: LIDAR Setting 4 ........................................................................................ 58
Table 1: Comparison of Met Mast to LIDAR Alternatives ......................................... 31
Table 2: Windcube v2 Specifications [17]................................................................... 35
Table 3: Measured Data versus Warranted Power Curve Data ................................... 45
Table 4: LIDAR Values ............................................................................................... 48

Renewable Energy Systems and the Environment MSc Thesis Ian Horsfield
8
1. Introduction
The majority of the energy we use in the UK is generated from burning fossil fuels
such as natural gas and coal. It is widely accepted that the increased CO2 levels in our
atmosphere are a direct result of burning these fossil fuels and this is causing global
warming and the increased frequency of extreme weather events.
The reduced availability of these finite fossil fuels means more remote and costly
exploration is necessary and as a result the cost of these resources is increasing. Here
in the UK there is a desire for a more secure energy supply as currently these
resources are largely imported and open to price fluctuations. Government targets are
driving a move away from fossil fuels in the search for a reduction in green house gas
emissions and a more secure supply of energy. As a result, more sustainable methods
of energy generation are being utilised.
One of the more developed sustainable energy sources is wind. Over the past decade,
wind energy has become the fastest growing energy source in the world [1].
Energy generation from wind is at the forefront of the UK’s national energy policy
and in recent times, onshore wind was the only renewable energy source that could
compete with more conventional generating methods such as gas or nuclear.
In terms of technology onshore wind is approaching maturity [2]. As one of the more
mature renewable sources of energy, onshore wind currently plays a leading role in
the generation of renewable electricity in the UK with over 4800 MW installed
capacity in 2012 [3].

Renewable Energy Systems and the Environment MSc Thesis Ian Horsfield
9
New incentives published at the end of 2013 reflect the maturity of the onshore wind
industry. Onshore wind farms are now receiving lower subsidies so the reality is that
more marginal wind farms will not be brought forward [4]. The reason for this is that
it is claimed that onshore wind developers no longer need as much state support
because of the considerable investment in this industry in recent times [5].
In contrast, offshore wind saw an increase in the recently published incentives to
encourage long-term investment. The capital costs associated with the construction of
an offshore wind farm are significantly more than an equivalent onshore wind farm
and the industry itself is far less mature. However, there is greater potential with the
resource offshore. The UK government claim there will be a deployment of up to 16
GW of offshore wind by 2020 and 39 GW by 2030 [6]. However, it is vital that costs
are driven down to make the offshore wind projects associated with these claims cost
more effective.
Resource assessment which is aimed at predicting the future energy production is
crucial to the successful development of wind farms. To accurately predict future
energy production, wind measurement tools such as Met Masts are used. As the wind
industry has grown, the demand for more accurate measurement techniques has
increased leading to new technologies being developed such as Laser Detection and
Ranging (LIDAR) devices which use a laser to measure wind speed. LIDAR systems
offer a cost effective alternative to Met Masts, in particular for offshore wind, as they
do not require the capital intensive foundations or structures on which to place the
measuring equipment.
Renewable Energy Systems and the Environment MSc Thesis Ian Horsfield
10
With the growing need for wind energy to become more cost effective, it is vital that
technologies like LIDAR are explored. The purpose of this thesis is to assess the
accuracy of a LIDAR device compared to the industry accepted Met Mast and to
determine if LIDAR can help drive down the cost of offshore wind.
2. Objectives
This section outlines the overall objectives which this thesis intendeds to achieve. The
scope of the thesis goes far beyond the initial work required to assess the accuracy of
a LIDAR and as a result primary and secondary objectives have been identified. The
reason for this is that they involved two separate work streams but overall have been
combined for this thesis. The scope for each objective is discussed in this section.
2.1. Primary Objective
The Primary Objective is to assess the accuracy of a LIDAR when compared to a Met
Mast for the purpose of wind measurement. This assessment involved the installation
and commissioning of a LIDAR at an onshore wind farm in the locality of a Met
Mast. A measurement campaign was then conducted using both measurement systems
and the results were compared.
Following a successful assessment, it was intended that a similar comparison could be
conducted offshore to provide evidence that the same accuracy could be achieved in
offshore conditions.

Renewable Energy Systems and the Environment MSc Thesis Ian Horsfield
11
2.2. Secondary Objective
The Secondary Objective of this thesis was to investigate areas where LIDAR could
be used to reduce the overall cost of a wind farm. The area which this thesis
concentrated on was the PPT which current European standards state can only be
performed by a Met Mast.
Firstly an informal PPT on a wind turbine was conducted according to the guidelines
set out in the European standards. The results of the test were then analysed to
determine the benefit of the test at a wind farm. If the PPT provided benefit it was
intended that a formal test would be conducted, and in parallel a test using a LIDAR
to show that the use of a Met Mast should no longer be a requirement.
This additional work was time constrained so if it was not possible to complete it, an
analysis based on the Secondary Objective would be conducted. This would give
insight into areas where improvements could be seen and provide the basis for further
study in this topic area.
An investigation into the current state of the wind industry was conducted including
the status of remote monitoring systems such as LIDAR and their expected market
growth in this fast moving industry.

Renewable Energy Systems and the Environment MSc Thesis Ian Horsfield
12
3. Literary Survey
To properly assess how new wind measurement tools such as LIDAR could impact on
the wind industry, resource assessment and its importance with regard to developing
wind farms needs to be understood. This section introduces wind energy and the
impact which accurate resource assessment can have.
Wind is the result of the sun heating the Earth’s surface. When the Earth’s surface is
heated up, the pressure drops in the air above it and it rises into the atmosphere. The
opposite happens when the Earth’s surface is cooled; areas of low pressure are
created. Air will move toward an area of low pressure and away from an area of high
pressure. This response of air to pressure differences is wind. This is displayed in the
Figure 1.
Figure 1: How wind is created [7]
Renewable Energy Systems and the Environment MSc Thesis Ian Horsfield
13
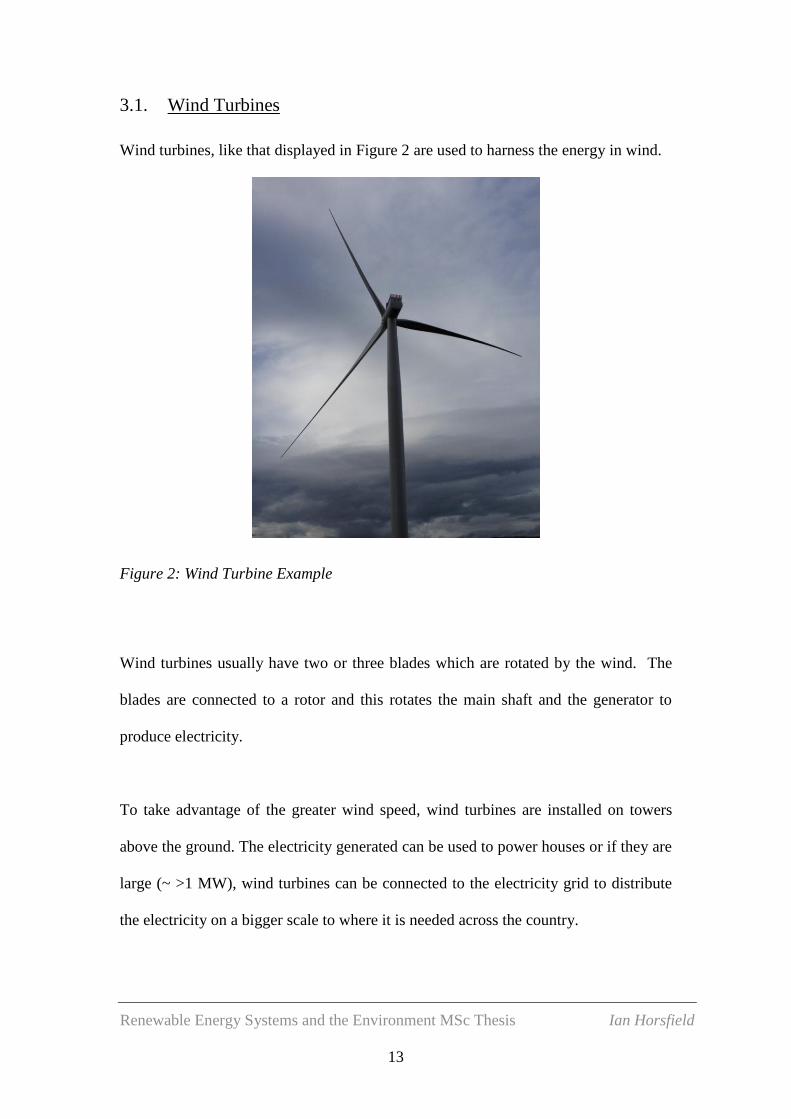
3.1. Wind Turbines
Wind turbines, like that displayed in Figure 2 are used to harness the energy in wind.
Figure 2: Wind Turbine Example
Wind turbines usually have two or three blades which are rotated by the wind. The
blades are connected to a rotor and this rotates the main shaft and the generator to
produce electricity.
To take advantage of the greater wind speed, wind turbines are installed on towers
above the ground. The electricity generated can be used to power houses or if they are
large (~ >1 MW), wind turbines can be connected to the electricity grid to distribute
the electricity on a bigger scale to where it is needed across the country.

Renewable Energy Systems and the Environment MSc Thesis Ian Horsfield
14
A wind turbine must operate efficiently and reliably in a wide range of wind
conditions. A number of components including the yaw motors, pitch system and
nacelle anemometer allow the wind turbine to adjust and adapt to the different
conditions it experiences.
A key characteristic of a wind turbine is its power curve. The power curve for a wind
turbine describes the expected amount of power output that can be generated as a
function of wind speed. The power curve is a line on a graph which describes the
amount of energy the wind turbine will produce at different wind speeds at a
hypothetical ideal site. Wind turbine suppliers will use power curves as a guarantee of
their wind turbines’ performance and warrant the associated power curve as part of a
contract for a wind farm. An example of a power curve is given in Figure 3.
Figure 3: Wind Turbine Power Curve Example [8]

Renewable Energy Systems and the Environment MSc Thesis Ian Horsfield
15
In Figure 3 it can be seen that the wind turbine produces zero kilowatts until it reaches
3.5 meters per second (m/s). The wind turbine then starts to produce energy, and this
energy increases rapidly as wind speed increases up to its rated output speed when it
flattens out. The wind turbine then produces power at its rated output until it reaches
an unsafe wind speed for the wind turbine design and cuts-out, which in Figure 3 can
be seen to be at 25 m/s.
Wind turbines will adjust the angle of the blades using the pitch system, and the
direction the wind turbine faces using the yaw system. The wind turbine does this to
maintain the maximum possible output for the instantaneous wind speed at a given
site. However, regardless of how much or how quickly wind turbines adjust they
rarely produce exactly the expected power at every wind speed. Inaccuracies can be
due to blade degradation and control errors, so it is expected that wind turbines will
deviate from their modelled power curve. And as already stated, the wind turbine’s
power output depends hugely on the wind conditions and this highlights the
importance of accurate wind resource assessment.
At a given site, one wind turbine may not be able to meet the energy production
reflected in its power curve, but other wind turbines will comfortably exceed this.
Factors affecting a wind turbine’s performance can include wind shear, wake effects,
turbulence, suitability of the wind turbine for the site, layout of the wind turbines,
down-time due to maintenance and alarms or errors in the control system resulting in
a shut-down of the wind turbine.

Renewable Energy Systems and the Environment MSc Thesis Ian Horsfield
16
Due to the large number of influences on a wind turbine’s performance, an
operational power curve for a wind turbine can be significantly different to the
manufacturer’s warranted one. As a result, on-site monitoring of the power curve can
show when a wind turbine is over or under performing.
3.2. Resource Assessment
Wind is constantly changing and this variability of wind stems from how it is created.
The Earth’s surface receives varying amounts of solar radiation depending on the
location. Therefore there are always varying distributions of surface temperature and
pressure being produced and as a result, wind is constantly being created and
constantly changing.
The variability of wind makes it difficult to predict. Resource assessment is a
collection of methods and technologies which are used to estimate the future energy
production of a wind farm, but also ultimately how much money the project will earn
for its investors.
The importance of an accurate assessment of the wind resource at a site cannot be
emphasised too strongly [9]. Accurate estimates of a wind farm’s production can be
very difficult because wind is so changeable but the wind resource can be the deciding
factor as to whether a wind farm gets built or not.

Renewable Energy Systems and the Environment MSc Thesis Ian Horsfield
17
A wind farm’s production will depend heavily on the wind conditions at a given site.
As the wind resource is constantly changing a detailed understanding of the wind
resource at the site is required to produce an accurate Energy Production Estimate
(EPE). EPEs are often used by project developers to secure funding from investors for
their projects. The wind turbine used at a particular site has a significant impact on the
resulting EPE. Measurement techniques are used to establish the wind regime at a site
and then different wind turbine types are analysed and compared using specific EPEs
for each.
It is desirable to obtain wind measurements that give a true representation of the
resource and as a result high levels of accuracy and precision are needed. Much more
is required than just calculating the wind speed in a particular place at a particular
time and there are rigorous processes in place for resource assessment.
The ability to handle changeable conditions will vary from one measuring device to
another. Some devices will excel in specific areas and this makes them more suitable
for specific types of measurements.
3.3. Wind Monitoring Technologies
A number of technologies are used for wind monitoring with varying degrees of
accuracy. The most common is the mechanical cup anemometer which has been
around since the 19th
century and the design of three or four spinning cups has barely
changed since. An example of this device can be seen in Figure 4.

Renewable Energy Systems and the Environment MSc Thesis Ian Horsfield
18
Figure 4: Mechanical Cup Anemometer Example [10]
The mechanical cup anemometer works by the wind pushing the cup around as it
flows past the instrument. The movement of the cups produces a voltage. Depending
on the speed of rotation this voltage will vary and as a result the wind speed can be
calculated. The speed of the cups is what generates the measurement signal.
This device has a number of advantages including its simplicity and that no external
power source is required. As well as this, if the dimensions are changed it can be used
to measure specific wind characteristics such as turbulence or mean wind speed. It is
able to do this because the time and distance constant vary with a change in the size of
the cup.
Unfortunately this device does come with disadvantages. Fouling due to dust or ice is
common with the moving parts and measurements can only be made in-situ meaning
that any obstructions in close proximity can affect the measurements.

Renewable Energy Systems and the Environment MSc Thesis Ian Horsfield
19
The propeller anemometer is similar to the cup anemometer but constantly adjusts
itself to face the wind using a wind vane. An example of this instrument can be seen
in Figure 5.
Figure 5: Propeller Anemometer Example [11]
The advantage realised by this technology is that there is no need for a separate wind
vane but it suffers similar disadvantages due to the moving parts.
Modern Technologies
More advanced technologies came later such as the ultrasonic anemometer developed
in the 1970’s. This device uses ultrasonic pulses to calculate the wind speed and
direction. An example can be seen in Figure 6.
Figure 6: Ultrasonic Anemometer [12]

Renewable Energy Systems and the Environment MSc Thesis Ian Horsfield
20
Depending on the wind direction the wind causes the pulses to accelerate or
decelerate and the relative speed of sound is used to determine the wind’s
characteristics.
This device can vary the speed of the pulses meaning that a large amount of signals
can be detected in a short time period. As a result, as well as not having the fouling
issues experienced with both the conventional measurement devices (due to no
moving parts), this device can accurately measure turbulence with a high resolution
within a short time frame.
Meteorological Mast
The technologies explored so far have the capability of measuring instantaneous wind
speeds at a given height. From the instantaneous data collected an average wind speed
for a given site can be calculated. However, because wind varies with height the
accuracy of this assessment is limited to the specific height at which the
measurements were taken.
For the resource assessment which is conducted on wind farms, it is important to
obtain data at various heights. This is not possible though without multiple devices
collecting data at specific heights. This is achieved by a Met Mast, an example of
which can be seen in Figure 7.

Renewable Energy Systems and the Environment MSc Thesis Ian Horsfield
21
Figure 7: Meteorological Mast Example
Met masts are widely used onshore and offshore across the wind industry. They vary
in design but are often semi-permanent with the ability to be moved and re-used at
another site. The height of measurement is obviously limited by the height of the Met
Mast tower. In recent times, wind turbine hub heights are increasing and as a result
the need for taller Met Masts is increasing.
Met masts are often used as a basis for determining whether a wind farm is worth
building or not. The Met Masts are deployed on a specific site to collect wind data for
up to two years and based on the data collected it is decided which wind turbines are
suitable, and also whether or not the wind farm is worth building at all.

Renewable Energy Systems and the Environment MSc Thesis Ian Horsfield
22
As can be seen in Figure 7, Met Masts can impose a significant visual impact on the
surrounding environment and because of this they require planning permission before
installation. The visual impact of the Met Mast can also have the effect of creating
negative connotations toward the development of the wind farm itself in that area.
Remote Monitoring Technology
Remote wind monitoring devices have been developed as an alternative to the Met
Mast, which with its increasing height requirement is becoming more costly and less
environmentally desirable. Two examples of these are the SODAR and the LIDAR
systems which are discussed in this section.
A Sonic Detection and Ranging (SODAR) system is a device for remote wind
monitoring that uses sound waves as a medium for measurement. Conventional wind
measurement such as the cup anemometer already discussed measures wind from a
point source, but the SODAR system measures wind averaged over an area so it can
provide an accurate estimate of the wind resource available for a specific wind
turbine.
Laser Detection and Ranging
A Laser Detection and Ranging (LIDAR) device is also used for remote (non-
invasive, long range) monitoring but uses an infrared beam as a medium for
measurement of wind speed.

Renewable Energy Systems and the Environment MSc Thesis Ian Horsfield
23
LIDAR has been traditionally deployed looking upwards in order to gather a number
of measurements at various heights above ground level and has been hugely useful in
the wind industry. To measure the velocity of wind, a LIDAR obtains information
from a signal which is sent from a transmitter, reflected by a target (the wind) and
detected by a receiver back at the source. An example of a LIDAR and SODAR can
be seen in Figure 8.
Figure 8: LIDAR and SODAR Example [13]
There are two types of LIDAR measurement, pulsed and continuous wave. Pulsed
wave consists of a series of laser pulses and continuous wave transmits a sinusoidal
signal of a known wavelength and calculates the phase difference between the
transmitted and received signal. Continuous wave systems are far less common than
pulsed wave systems.

Renewable Energy Systems and the Environment MSc Thesis Ian Horsfield
24
The conical scan which emits from the LIDAR allows it to facilitate multiple readings
at different angles allowing wind characteristics to be established such as the
horizontal and vertical components of the wind vector as well as direction. The three-
dimensional coordinates of the wind are calculated from the difference in time
between when the beam was emitted and returned, the angle at which the beam was
emitted and the absolute location of the sensor above the surface of the Earth.
The reliability of any chosen device must be considered. This is the capability of the
device to continually produce results to the same degree of accuracy over a long
period of time. This can be affected by issues such as weather and the elements,
calibration errors or simply device wear and tear. LIDAR for example has a high
sampling rate and results are provided at a very high resolution, however errors can
occur under bad weather conditions such as rain and snow.
4. Theoretical
This section explains why this thesis was conducted, discusses the reasoning behind it
and explores solutions to some of the issues faced by the wind industry.
4.1. Uncertainty in Wind Measurement
Wind speed is a critical measurement characteristic in terms of the economics of a
wind farm. Like all weather conditions, wind is relatively difficult to predict and
therefore introduces a high level of uncertainty into any predictions that are associated
with it.

Renewable Energy Systems and the Environment MSc Thesis Ian Horsfield
25
Uncertainty in the measurement can lead to an under or over prediction of annual
energy production and this poses a significant financial risk to any project. The wind
industry has adopted a number of procedures including selection, calibration,
deployment and use of anemometry to minimise uncertainty [9].
For a wind project the common approach is to capture wind data from a Met Mast
which is strategically placed somewhere on the wind farm. The wind speed and
conditions at the different wind turbine locations are then approximated taking into
account the site specific terrain and potential wake effects from other wind turbines.
The uncertainty associated with these approximations is known as “space-domain”
uncertainty and is the result of the predictions not accurately representing the location
of the wind turbines but instead being a reflection of the Met Mast location. This same
space-domain uncertainty can be experienced when predictions of wind speeds above
the height the instrumentation measuring the wind are made. Additional uncertainty is
brought by the reality that the wind measurements do not accurately represent a full
life cycle of a wind project and are largely based on one or two years of wind data.
This type of uncertainty is known as “time-based” uncertainty.
Numerous developments in statistical and mathematical techniques to improve long
term projections have been developed but time-domain uncertainty is still difficult to
reduce. In comparison, significant reductions have been seen in space-domain
uncertainty due to the development of new technologies which more accurately assess
the flow of wind across a site [14]. Any reduction in uncertainty is significant as it

Renewable Energy Systems and the Environment MSc Thesis Ian Horsfield
26
impacts the annual energy production estimate and this can heavily impact a project’s
justification.
For many years the Met Mast has been the method used for wind measurement at a
wind farm but the limitations of the Met Mast allowed for the emergence of remote
sensing solutions such as the LIDAR and SODAR which are laser and acoustic based
measuring instruments. These remote sensing solutions are simple and easy to deploy
in different desired locations. By placing these portable measurement instruments at
the wind turbine locations it is possible to reduce the space domain uncertainty that
would be associated with the Met Mast measurement if it were not present.
4.2. The Emergence of LIDAR
For a number of years now remote sensing solutions such as LIDAR have competed
with Met Masts for wind monitoring as they provide a number of benefits. Some of
the main advantages are discussed in this section.
LIDARs have been used in industry now for a number of years because they offer a
high degree of accuracy. They have developed to now using two degrees of freedom,
both azimuth and elevation, instead of only one. Doing this allows the LIDAR to
measure anywhere within the range of the LIDAR instead of being limited to wind
which is immediately above it (like a Met Mast).

Renewable Energy Systems and the Environment MSc Thesis Ian Horsfield
27
Unlike a Met Mast, LIDARs do not need large towers and foundations to allow them
to measure wind at specific heights. This advantage is twofold. LIDARs are portable
so can be moved around easily on site to measure at different locations. In addition,
the planning permission which a Met Mast requires for its large tower is not needed
for LIDAR. A number of LIDAR instruments can be deployed onsite without the need
for planning permission.
LIDAR offer advantages in measurement too. LIDAR measure up to and above the
specified hub height of a wind turbine, and instead of modelling complex terrain in
the vicinity of the LIDAR it now directly measures the differences in the wind stream.
For the last ten years studies have been conducted to compare the measurement of
LIDAR and cup anemometry. For example in 2004, when LIDARs were first tested
for wind measurement a campaign using a ZephIR (LIDAR) was conducted. It was
argued that the measurement produced by the LIDAR was accurate but the errors
which arose led to uncertainty over what was actually moving at the velocity
calculated [15]. Cloud and mist can contribute to the Doppler signal which the
LIDAR measures so can lead to overestimation of wind speed. As a result, cloud
correction algorithms are now included in the technology’s measurement. Since then,
many more measurement campaigns have been conducted and it is clear that accuracy
is improving through the introduction of new technologies such as the windcube for
example. This technology is explained in greater detail in section 5.

Renewable Energy Systems and the Environment MSc Thesis Ian Horsfield
28
Since their inception, LIDARs have proven accurate and have been successful in
overcoming a number of pitfalls with the commonly used Met Mast. That is not to say
however that they are without fault. This thesis sets out to explore these advantages
and to assess whether LIDAR could be considered as an alternative wind
measurement instrument to a Met Mast.
In order to complete the primary objective of the thesis and confirm the accuracy of
LIDAR, it was proposed that a test campaign be conducted whereby LIDAR data was
compared to that of a Met Mast. Further details behind the measurement campaign
conducted are included in the Experimental and Discussion of Results section.
4.3. Power Performance Testing
The power performance of a wind turbine describes the correlation between the free-
inflow wind speed and net electrical power output of the wind turbine. It is a
significant input into predicting the annual energy yield of a wind farm which is the
deciding factor on whether a wind farm will be built or not. With the drive for
reduced costs in the offshore wind sector, one area of importance where LIDAR can
offer a potential saving is with the PPT which is conducted on a wind turbine.
There are significant financial implications if a wind turbine is not producing as much
power as was predicted in the financial model and this usually relates to an unrealistic
power curve. A PPT is used to verify a wind turbine’s performance and without the
test a claim on the contractual agreement is unlikely to be successful. As well as for
Renewable Energy Systems and the Environment MSc Thesis Ian Horsfield
29
claims against unrealistic power curves, the PPT is also used by the wind turbine
supplier for the certification process.
When compared to onshore wind, offshore wind farms are associated with a higher
financial investment. It is also a newer technology so there is a higher technical risk
and the wind conditions offshore are not as well known. As a result PPT is more
rather than less important. However due to the expense associated with the IEC
compliant tests, which need Met Masts requiring piling and foundation structures,
they are conducted less rather than more often.
The secondary objective of this thesis investigates if there is the potential to reduce
wind farm costs by using LIDAR instead of the current more expensive alternatives.
Currently European IEC standards state that Met Masts must be used for the PPT of a
wind turbine. These have recently been updated to include the use of LIDAR;
however this is only in conjunction with a Met Mast and cannot be conducted solely
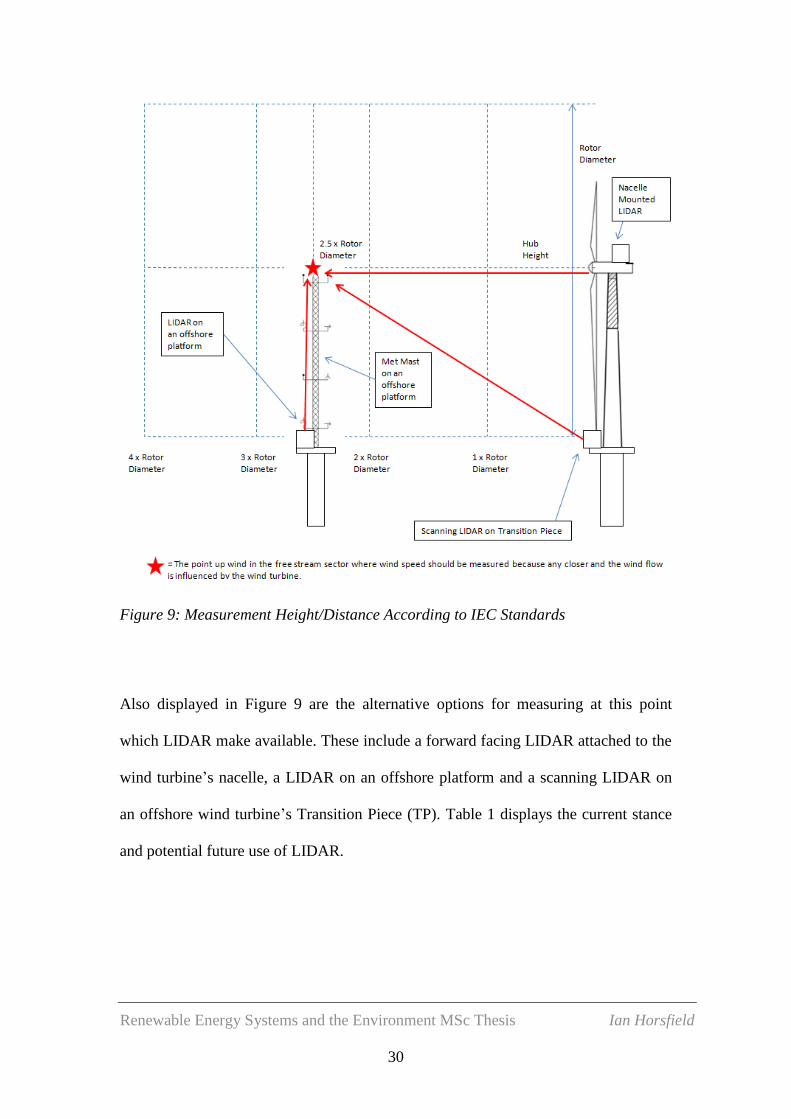
by LIDAR. To perform an IEC compliant PPT, there is a requirement to measure
wind speed upwind of the wind turbine at height a minimum of 2.5 times the rotor
diameter away [16]. This is displayed in Figure 9.
Renewable Energy Systems and the Environment MSc Thesis Ian Horsfield
30
Figure 9: Measurement Height/Distance According to IEC Standards
Also displayed in Figure 9 are the alternative options for measuring at this point
which LIDAR make available. These include a forward facing LIDAR attached to the
wind turbine’s nacelle, a LIDAR on an offshore platform and a scanning LIDAR on
an offshore wind turbine’s Transition Piece (TP). Table 1 displays the current stance
and potential future use of LIDAR.
Renewable Energy Systems and the Environment MSc Thesis Ian Horsfield
31
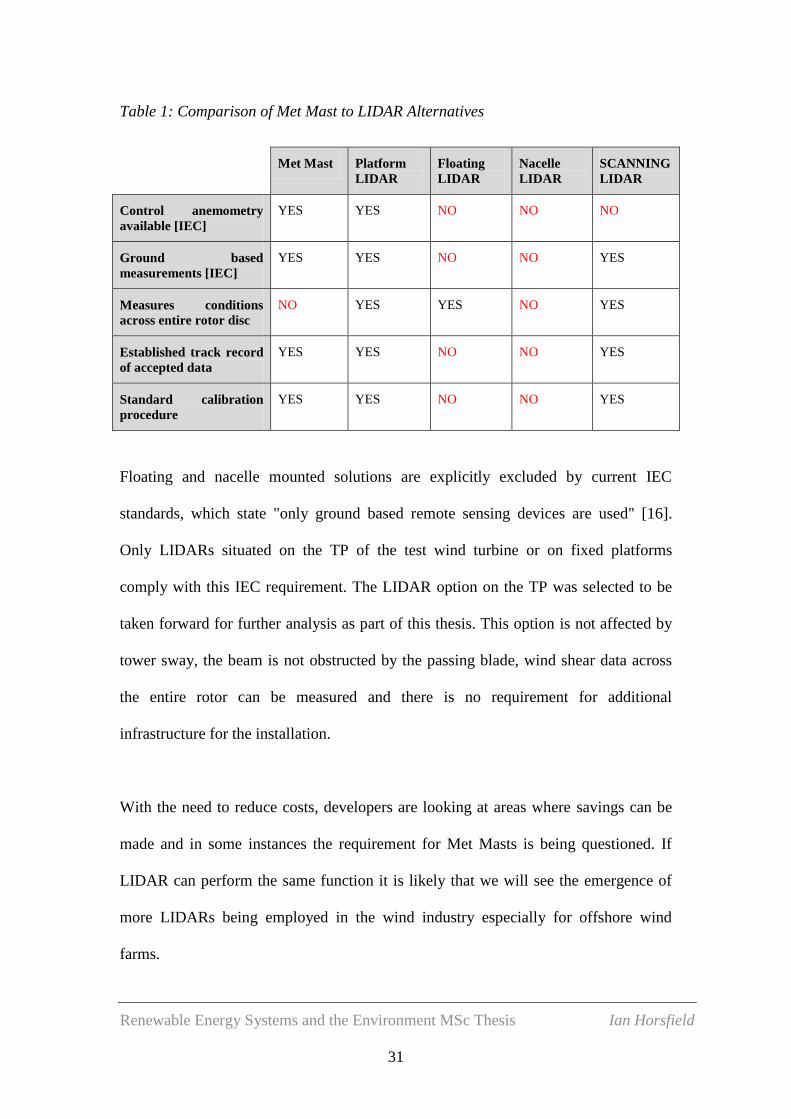
Table 1: Comparison of Met Mast to LIDAR Alternatives
Met Mast Platform
LIDAR
Floating
LIDAR
Nacelle
LIDAR
SCANNING
LIDAR
Control anemometry
available [IEC]
YES YES NO NO NO
Ground based
measurements [IEC]
YES YES NO NO YES
Measures conditions
across entire rotor disc
NO YES YES NO YES
Established track record
of accepted data
YES YES NO NO YES
Standard calibration
procedure
YES YES NO NO YES
Floating and nacelle mounted solutions are explicitly excluded by current IEC
standards, which state "only ground based remote sensing devices are used" [16].
Only LIDARs situated on the TP of the test wind turbine or on fixed platforms
comply with this IEC requirement. The LIDAR option on the TP was selected to be
taken forward for further analysis as part of this thesis. This option is not affected by
tower sway, the beam is not obstructed by the passing blade, wind shear data across
the entire rotor can be measured and there is no requirement for additional
infrastructure for the installation.
With the need to reduce costs, developers are looking at areas where savings can be
made and in some instances the requirement for Met Masts is being questioned. If
LIDAR can perform the same function it is likely that we will see the emergence of
more LIDARs being employed in the wind industry especially for offshore wind
farms.

Renewable Energy Systems and the Environment MSc Thesis Ian Horsfield
32
This thesis explores firstly the need for a PPT, but also the potential to use LIDARs
for this purpose in the drive to reduce costs for the wind industry. A PPT has been
conducted at an offshore wind farm using a Met Mast and the results are discussed in
Section 7.2. If time scales allow the same test will be conducted using a LIDAR on a
TP and a comparison of the results will be made.
5. Experimental
This section describes the process behind achieving the project’s main objectives
which have been established in the previous section.
In order to complete the primary objective of this thesis and confirm the accuracy of
LIDAR, it was proposed that a test campaign be conducted whereby LIDAR data was
compared to that of a Met Mast. It was expected that by completing this measurement
campaign with both the LIDAR and Met Mast measuring at the same time that the
results would show that the LIDAR is as accurate as the Met Mast. The study would
then be able to justify stand-alone remote sensor wind monitoring.
The study was undertaken at a Test site located 30 miles west of Glasgow in Scotland.
The site has excellent exposure to the prevailing south westerly wind and has a low
surface roughness.

Renewable Energy Systems and the Environment MSc Thesis Ian Horsfield
33
5.1. Met Mast Details
A reference Met Mast is installed at the site for the purpose of verifying the wind
climate experienced by the wind turbines which are also installed at the site. An
example of a Met Mast can be seen in Figure 10.
Figure 10: Reference Met Mast for Measurement Campaign
The instrumentation installed on the Met Mast is detailed in Figure 11 along with that
of the LIDAR and substation.

Renewable Energy Systems and the Environment MSc Thesis Ian Horsfield
34
Figure 11: Onsite LIDAR and Met Mast Configuration Schematic
As can be seen in Figure 12, the LIDAR and Met Mast are separated by
approximately 5 meters and the substation and the Met Mast by approximately 12
meters.
Figure 12: Onsite Location of Equipment

Renewable Energy Systems and the Environment MSc Thesis Ian Horsfield
35
5.2. LIDAR details
The LIDAR installed was a windcube LIDAR manufactured by Leosphere and
supplied by Natural Power (UK). The reason this was chosen is because it is
considered highly accurate, it is compact (55 x 55 x 55cm), it is light at only 40 kg,
only consumes 45 W and has no moving parts so is more reliable.
Further details on the LIDAR’s specifications are detailed in Table 2.
Table 2: Windcube v2 Specifications [17]
Leosphere Windcube v2
Range 40 to 200m
Data sampling rate 1s
No. of programmable heights 12
Wind speed accuracy 0.1 m/s
Wind speed range 0 to +60 m/s
Directional accuracy 2°
Dimensions L-W-H 543 x 552x 540 mm
Weight 45 kg
Power consumption 45 W nominal
Temperature range -30°C to +45°C/-22°F to 108°F
Operating humidity 0 to 100% RH
Housing classification IP67 (for inner racks)
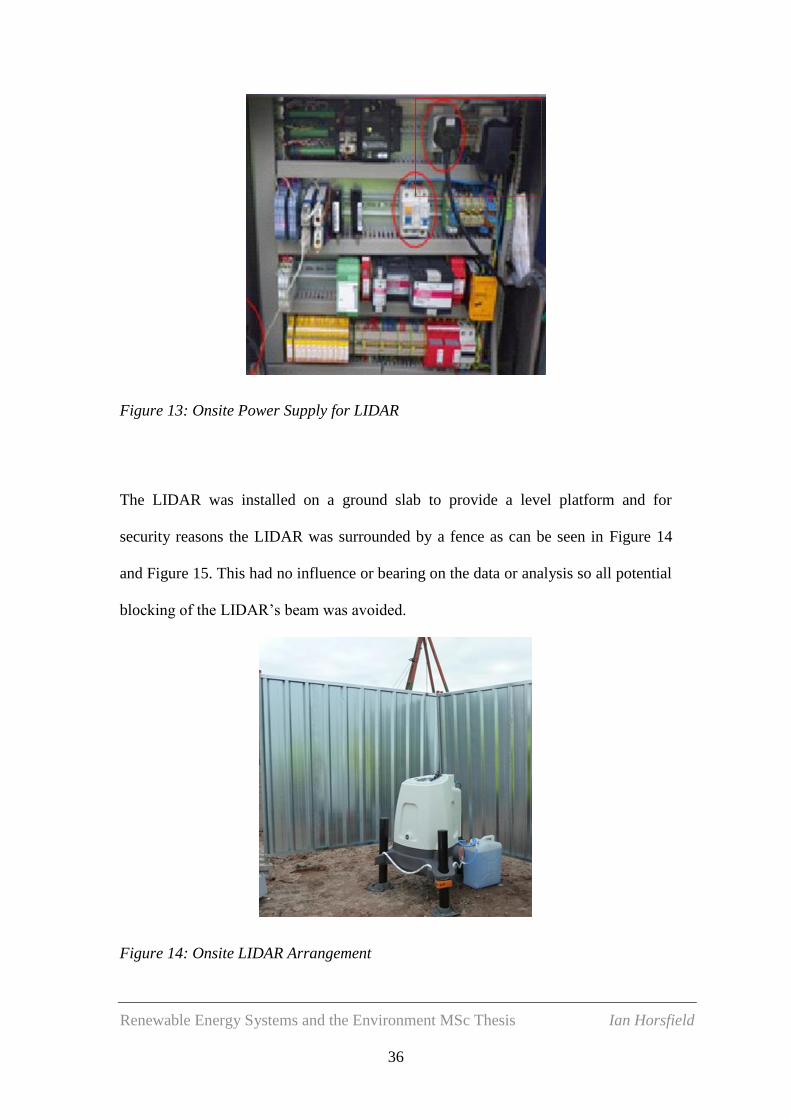
The LIDAR is powered from the distribution terminals inside the Met Mast cabinet as
can be seen in Figure 13.
Renewable Energy Systems and the Environment MSc Thesis Ian Horsfield
36
Figure 13: Onsite Power Supply for LIDAR
The LIDAR was installed on a ground slab to provide a level platform and for
security reasons the LIDAR was surrounded by a fence as can be seen in Figure 14
and Figure 15. This had no influence or bearing on the data or analysis so all potential
blocking of the LIDAR’s beam was avoided.
Figure 14: Onsite LIDAR Arrangement

Renewable Energy Systems and the Environment MSc Thesis Ian Horsfield
37
Figure 15: Onsite Security Fence Protection for LIDAR
5.3. Measurement Campaign
A Campbell Scientific CR1000 logger was used to log data for the Met Mast. The
LIDAR data was captured in a similar way. The LIDAR was able to patch into the
fibre run in the patch panel inside the Met Mast enclosure. The signals from the Met
Mast and from the LIDAR were then transferred via analogue output modules and the
logged data was then accessed using the Supervisory Control And Data Acquisition
(SCADA) system. The data could then be downloaded in an excel file and used for
this study.
The measurement height for both the LIDAR and Met Mast was set at 110 meters and
they were programmed to record for every 10 minute period; the mean, maximum,
minimum and standard deviation of wind speed from each anemometer, and the mean

Renewable Energy Systems and the Environment MSc Thesis Ian Horsfield
38
and standard deviation of wind direction from each wind vane. All anemometers were
individually MEASNET (Measuring Network of Wind Energy Institutes) Calibrated.
The results from the measurement campaign are discussed in section 6.
5.4. Power Performance Test
An offshore PPT was conducted to assess the value it added to a wind project.
Following this the installation of LIDAR was completed with the intention that the
same PPT would be completed so the results could be compared.
A PPT was performed on a wind turbine at a wind farm off the coast of the south west
of England. The method used is described in the IEC standard 61400-12 Power
Performance Testing [16]. The power curve is determined by collecting simultaneous
measurements of wind speed and power output.
The power output of the wind turbine was measured using the equipment on the wind
turbine and obtained through the SCADA system. A Met Mast installed adjacent to
the wind turbine being tested was used to perform the test and measure the wind
speeds. The wind turbine and Met Mast layout for the PPT is displayed in Figure 16.

Renewable Energy Systems and the Environment MSc Thesis Ian Horsfield
39
Figure 16: Wind Farm Layout
The PPT was conducted in August 2012 and concluded in November of the same
year. The power output from the wind turbine was collected and associated with 1 m/s
bins of wind velocity. Corrections were made to increase the accuracy of the results
and these are discussed in the following sections.
Renewable Energy Systems and the Environment MSc Thesis Ian Horsfield
40
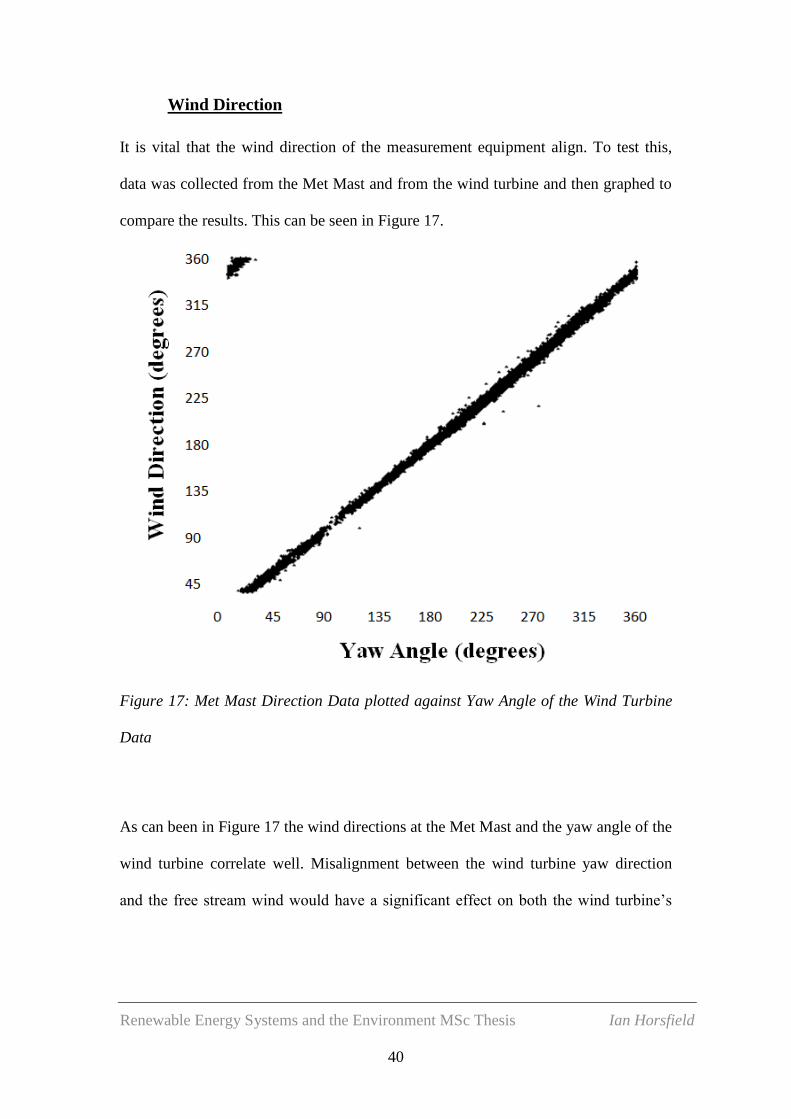
Wind Direction
It is vital that the wind direction of the measurement equipment align. To test this,
data was collected from the Met Mast and from the wind turbine and then graphed to
compare the results. This can be seen in Figure 17.
Figure 17: Met Mast Direction Data plotted against Yaw Angle of the Wind Turbine
Data
As can been in Figure 17 the wind directions at the Met Mast and the yaw angle of the
wind turbine correlate well. Misalignment between the wind turbine yaw direction
and the free stream wind would have a significant effect on both the wind turbine’s

Renewable Energy Systems and the Environment MSc Thesis Ian Horsfield
41
performance and the operating lifetime of wind turbine, due to the potential increase
in loading from the wind.
An offset of approximately 20 degrees can be observed in Figure 17 but this is not
unusual. 0° will generally refer to the direction in which the wind turbine was facing
during its most recent reset.
To assess the accuracy of the data, vortex hindcast data was used as a comparison.
This is modelled data which uses satellite measurements as a basis [18]. When Mat
Masts are not yet available at wind farms it is not uncommon to use vortex hindcast
data to produce preliminary models of the wind resource available at a site. As can be
seen in Figure 18 the correlation is not as good as in Figure 17. The Met Mast data is
therefore more accurate and as a result was used for the PPT instead of the vortex
hindcast data.
Figure 18: Direction Data for the Met Mast plotted against Vortex Hindcast Data
Renewable Energy Systems and the Environment MSc Thesis Ian Horsfield
42
PPTs are performed on wind turbines adjacent to Met Masts and usually this location
is on the periphery of a wind farm. The reason for this is because in this location the
Met Mast and wind turbines being tested are least affected by wake effects from other
wind turbines.
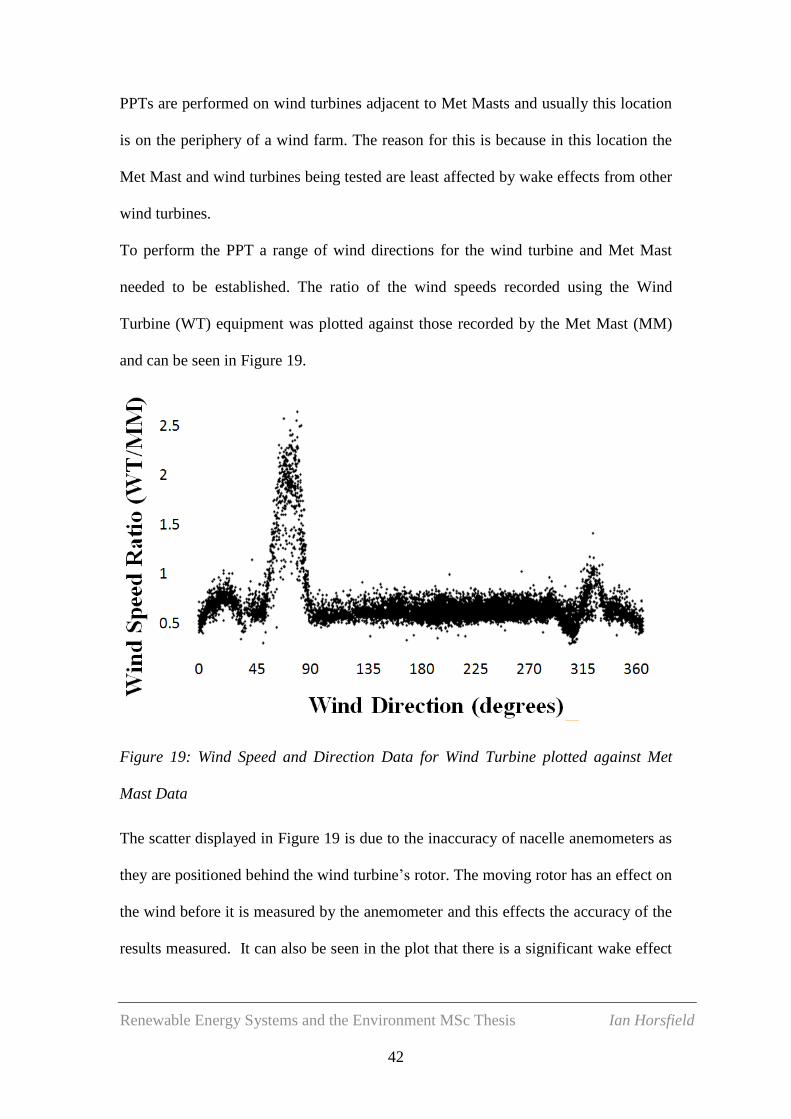
To perform the PPT a range of wind directions for the wind turbine and Met Mast
needed to be established. The ratio of the wind speeds recorded using the Wind
Turbine (WT) equipment was plotted against those recorded by the Met Mast (MM)
and can be seen in Figure 19.
Figure 19: Wind Speed and Direction Data for Wind Turbine plotted against Met
Mast Data
The scatter displayed in Figure 19 is due to the inaccuracy of nacelle anemometers as
they are positioned behind the wind turbine’s rotor. The moving rotor has an effect on
the wind before it is measured by the anemometer and this effects the accuracy of the
results measured. It can also be seen in the plot that there is a significant wake effect
Renewable Energy Systems and the Environment MSc Thesis Ian Horsfield
43
on the Met Mast from the adjacent wind turbines B, C, D and E between 270° and
90°. This can also be seen in Figure 16. As discussed, it is important to use a wind
direction for a PPT which is not significantly affected by wake effects and because of
this the range from 130° to 270° was chosen for the test.
Correction for air density
Air density has a significant impact on a wind turbine’s output and because of this it is
important to take account of it in a PPT. The ten-minute wind speeds recorded by the
Met Mast during the PPT were adjusted to align with the air density in the power
curve. The values for the pressure and temperature which were measured at the Met
Mast were confirmed consistent with the vortex hindcast data and used for the
evaluation.
Wind Turbine Operation
To improve the results, periods where the wind turbine was not generating were
filtered from the analysis. The wind turbine was assumed to be unavailable if it was
producing less than 1% of its rated capacity (<36.36kW) in wind speeds above its
specific cut-in (3 m/s) wind speed. To confirm that the wind turbine was in fact
unavailable during these times, the power output for the wind turbine was plotted
against the rotor Rotations Per Minute (RPM) and this can be seen in Figure 20.

Renewable Energy Systems and the Environment MSc Thesis Ian Horsfield
44
Figure 20: Wind Turbine power output versus Rotor RPM
It can be seen in Figure 20 that this wind turbine is a variable speed machine. This
means the wind turbine can produce power across a range of wind speeds and is not
fixed to one wind speed. The wind turbine starts producing at its cut-in wind speed of
3 m/s up until cut-out at 25 m/s. The black line illustrates this where it can be seen
starting just before 6 m/s and then regulating its RPM using its pitch system it ramps
up to its rated wind speed of approximately 14 m/s where it flattens out. Outside of
this distinct black line there are only a small number of outlying ten-minute periods.
This gave confidence that no further processing of the data was needed.

Renewable Energy Systems and the Environment MSc Thesis Ian Horsfield
45
Power Curve Binning
The measured data for the ten minute periods were averaged to 1 m/s bins and were
then used for comparison with the warranted power curve. This is shown in the Table
3.
Table 3: Measured Data versus Warranted Power Curve Data
Wind Speed (m/s) Warranted Power (kW) Mean Measured Power (kW)
0 0 -32
1 0 -31
2 0 -33
3 0 -10
4 130 73
5 274 202
6 505 418
7 825 706
8 1240 1146
9 1776 1666
10 2403 2336
11 3045 3056
12 3501 3505
13 3622 3582
14 3636 3594
15 3636 3602
16 3636 3594
17 3636 3560
18 3636 3603
19 3636 3601
20 3636 3603
21 3636 3600
22 3636 3579
23 3636 3600
24 3636 3513
25 3636 2795
Table 3 clearly shows the wind turbine is under performing when you compare the
warranted values with the measured values. It can also be seen in Table 3 that when
the wind turbine is not producing power in wind speeds below cut-in, it experiences
parasitic loads in the region of 30 kW. This is quite normal as power usually needs to

Renewable Energy Systems and the Environment MSc Thesis Ian Horsfield
46
be supplied to maintain the wind turbine when it cannot use the wind to maintain
itself. However, given the underperformance in the rising part of the power curve
these loads may be having more of an effect that normally expected.
Offshore LIDAR installation
The installation of a LIDAR instrument was completed with the intention that the
same PPT would be completed and the results could be compared to those captured by
the Met Mast which has already been discussed. Unfortunately due to time restraints it
was not possible to complete the measurement campaign with the LIDAR system but
the installation was completed and details are included in this section.
The following section describes the installation of a windcube LIDAR on an offshore
wind turbine’s TP. Figure 21 shows the location of the windcube on the wind
turbine’s TP.
Figure 21: Plan View of LIDAR on Offshore Wind Turbine Transition Piece

Renewable Energy Systems and the Environment MSc Thesis Ian Horsfield
47
The TP was chosen because the wind cube requires a stationary location to make
accurate measurement. As can be seen in Figure 21 the LIDAR has been located
adjacent to the neighbouring Met Mast. Locating the LIDAR adjacent to the Met Mast
will enable a comparison to the data measured by Met Mast and provide evidence that
the LIDAR is a valid measurement device for a warranted PPT. Figure 22 shows the
location of the Met Mast in the background and the location of the LIDAR in the
foreground.
Figure 22: Location of LIDAR on Offshore Wind Turbine Transition Piece
To accurately achieve the correct orientation of the windcube LIDAR which was used
the values in Table 4 were input into the LIDAR controls. In Table 4 the LIDAR type
and measurement heights are highlighted.

Renewable Energy Systems and the Environment MSc Thesis Ian Horsfield
48
Table 4: LIDAR Values
Device Location
Height above LAT (m) Orientation with respect to True North (º)
Wind Direction Correction Factor (º)
Comment
42 m +15° +48°
So you have to subtract 33°
from the wind direction in order to get the correct value
The stability and direction of the LIDAR were first confirmed manually. The stability
was confirmed using the level which is attached to the LIDAR device. This can be
seen in Figure 23 and clearly displays alignment.
Device Identification
Type Serial Year
Software
Version
IP Address Time Base
Prisma
Angle
(deg)
Comment
Device
Identificati
on
Windcube
WLS7
V1.2
WLS7-58 2009 3.1.62
129.175.13
1.4
UTC +0 27.89
Measurement Parameters
Meas.
Height 1
(m)
Meas.
Height 2
(m)
Meas.
Height 3
(m)
Meas.
Height 4
(m)
Meas.
Height 5
(m)
Meas.
Height 6
(m)
Meas.
Height 7
(m)
Meas.
Height 8
(m)
Meas.
Height 9
(m)
Meas.
Height
10 (m)
Relative
to
LIDAR
40 47 53 57 60 68 76 81 108 138
Relative
to LAT
82 89 95 99 102 110 118 123 150 180

Renewable Energy Systems and the Environment MSc Thesis Ian Horsfield
49
Figure 23: LIDAR Stability Confirmation
The direction was also manually confirmed using a compass to compare to the arrow
pointing North on the LIDAR device. This can be seen in Figure 24.
Figure 24: LIDAR Direction Confirmation
Renewable Energy Systems and the Environment MSc Thesis Ian Horsfield
50
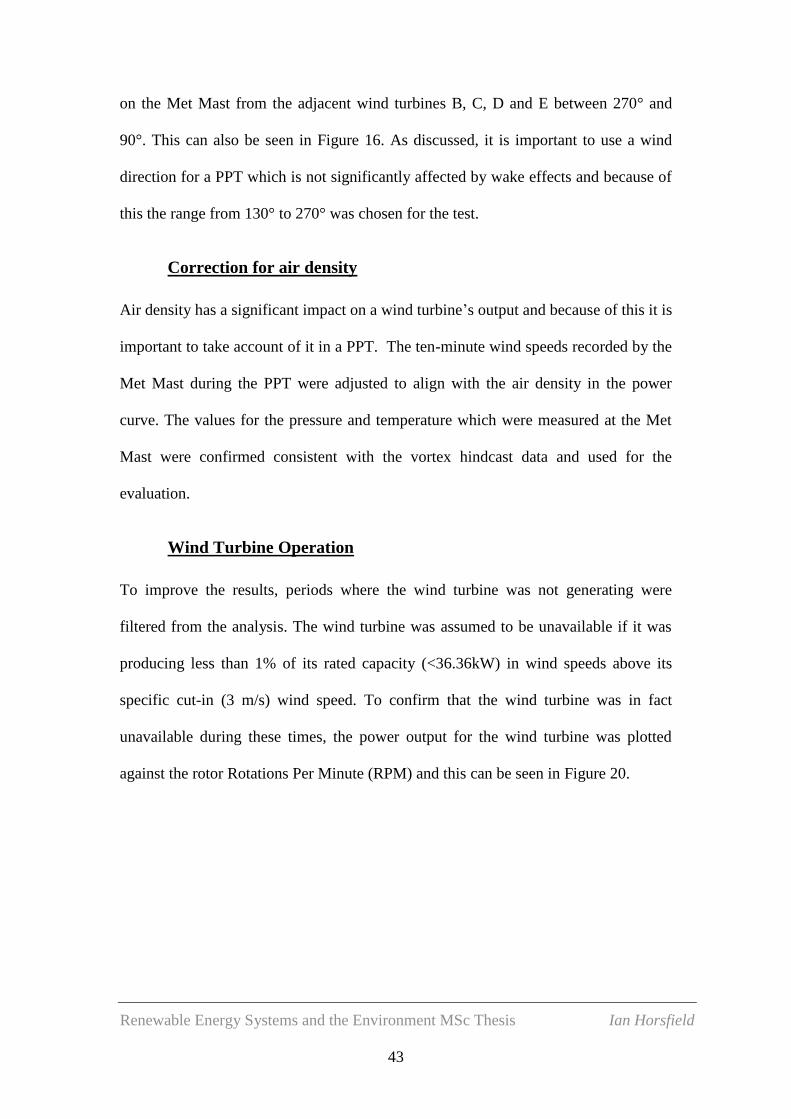
Logging into the LIDAR system further confirmed that the device was installed
correctly. It can be seen that the wind speed and direction profiles are clearly aligned
in Figure 25 and this shows the device was also calibrated correctly.
Figure 25: LIDAR Wind Speed and Direction Profiles
Logging in the control system for the LIDAR would also confirm the status of the
system and if it was correct. The observed settings are displayed in Figure 26 and
Figure 27.
Renewable Energy Systems and the Environment MSc Thesis Ian Horsfield
51
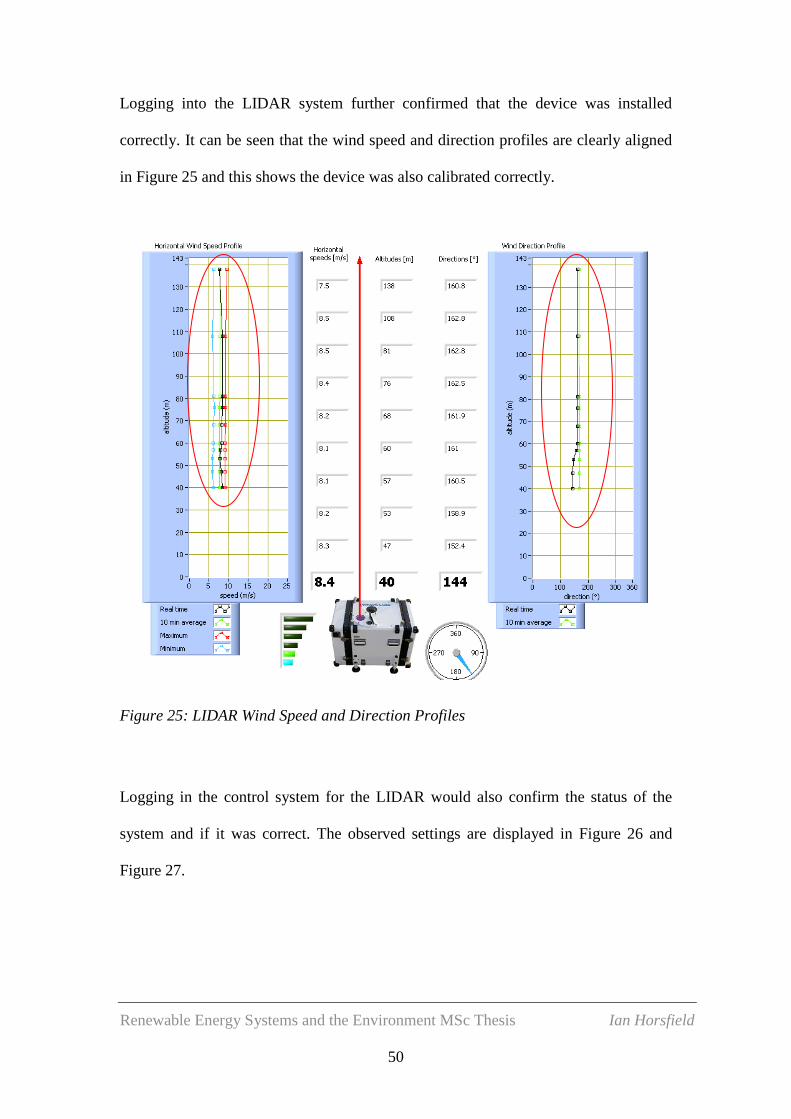
Figure 26: LIDAR Setting 1
It can be seen in Figure 26 that the PTH value status was not ok. This is associated
control path (PTH) and means the system could not establish normal operation and
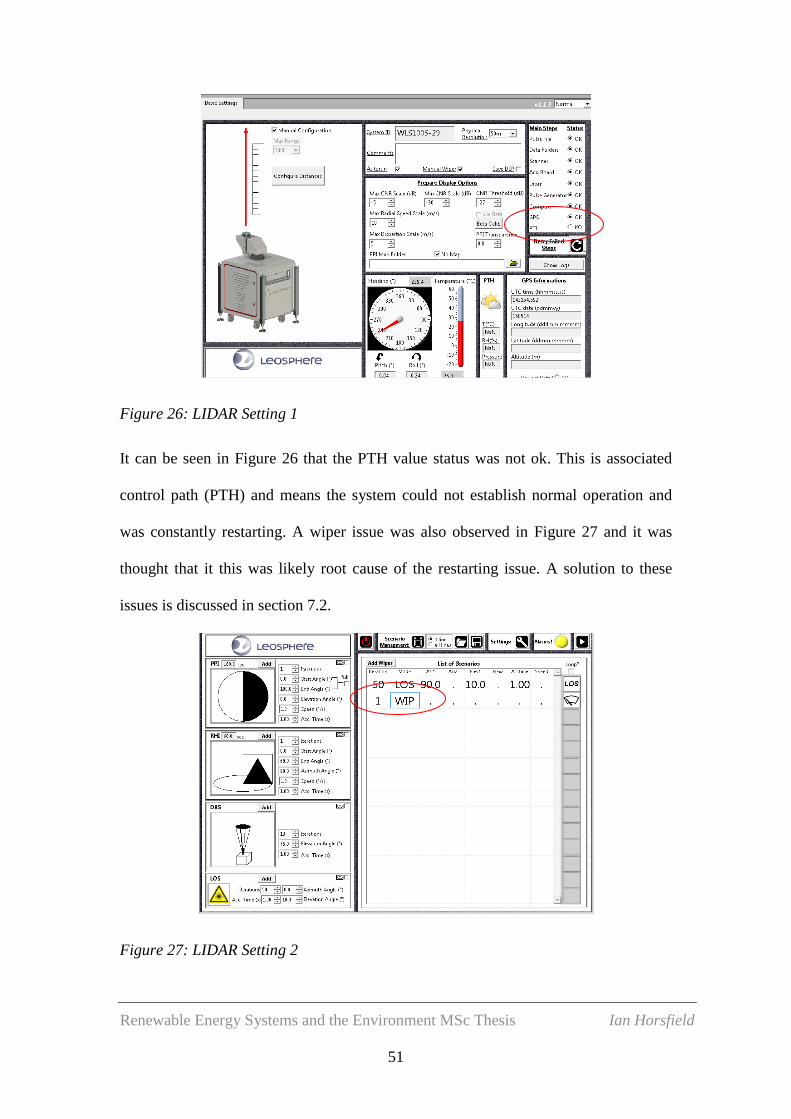
was constantly restarting. A wiper issue was also observed in Figure 27 and it was
thought that it this was likely root cause of the restarting issue. A solution to these
issues is discussed in section 7.2.
Figure 27: LIDAR Setting 2

Renewable Energy Systems and the Environment MSc Thesis Ian Horsfield
52
6. Discussion of Results
This section looks at the results and uses them to establish a conclusion from the work
which was conducted.
7.1. Measurement Campaign
The overall conclusion which can be taken from the measurement campaign
conducted is that the LIDAR and Met Mast correlate well and that either form a
technology could be used for wind measurement.
Wind data was recorded by both the LIDAR and Met Mast for wind speed and
direction. The data produced by both were quality checked, and suspect data flagged
and not included in the following analyses. In Figure 28 the wind speed measurement
is compared.
Figure 28: Wind Speed Data for Met Mast Plotted against LIDAR

Renewable Energy Systems and the Environment MSc Thesis Ian Horsfield
53
As can be seen in Figure 28, wind speeds from approximately 0 m/s up to
approximately 25 m/s were measured and are shown on the graph. Figure 28 displays
the favourable correlation between the measurements by the two technologies. Using
the standard regression method of a best fit line produced a 93% correlation shown by
the line in Figure 28. This is an acceptable level of correlation given the limited
amount of wind data collected. A greater correlation in the late 90’s would be
expected with further filtering of the data and a longer measurement campaign which
are discussed in section 6 and 8.
The wind direction from the Met Mast and LIDAR are included in Figure 29.
Figure 29: Wind Direction Data for Met Mast Plotted against LIDAR

Renewable Energy Systems and the Environment MSc Thesis Ian Horsfield
54
The results here show more variance but overall there is a general agreement between
the two measurement devices. The obvious line can be taken to confirm the known
south westerly prevailing wind direction.
There are clear deviations in Figure 29 too and these could be for a number of reasons
including weather, terrain, sensor erros and measurement techniques. Heavy rain and
fog can also have a significant effect on LIDAR measurements. Although the LIDAR
was located adjacent to the Met Mast, terrain effects may be the cause of some of the
scatter. Anemometer sensor degradation could be the case of some of the deviations
or the method of measurement which is volume in the case of LIDAR versus point
measurement in the case of the Met Mast.
In general a good agreement has been found between both sets of data when
comparing 10 minute averaged measurement. The measurement campaign has
confirmed that LIDAR is an accurate form of measurement and both methods could
be used to provide accurate real time data input for wind power forecasting models or
for a PPT.
7.2. Power Performance Test
The overall conclusion of the PPT is that it provides an accurate assessment of a wind
turbine’s performance and it is a valuable test which all developers should look to
perform at their wind farm sites.

Renewable Energy Systems and the Environment MSc Thesis Ian Horsfield
55
The PPT performed shows that there was a shortfall of 3% in energy capture during
the period used for the calculation. The PPT shows that the wind turbine is not
performing to the agreed level outlined by the warranted power curve. Figure 30
displays the results from the PPT.
Figure 30: Power Performance Test Results
It can be seen that the general pattern follows the warranted power curve but does not
follow it exactly. This shows the difficulty in the accurate prediction of energy
production.
It can be seen that the main deficit in performance, approximately 90%, is in the
rising part of the power curve up to 10 m/s. The remainder is due to the wind turbine’s
power output reaching a maximum of 3600 kW and not the warranted maximum of
3636 kW.

Renewable Energy Systems and the Environment MSc Thesis Ian Horsfield
56
There is will always be some error associated with a PPT even when extensive
measurement campaigns are assessed the final error can exceed 10% [19]. This can be
seen in Figure 30 where the error bars represent the standard deviation of the data in
each bin. For this reason it is recommended that a formal independent PPT is
conducted as per the wind farm supply contract. The results of which can then be used
to negotiate with the wind turbine supplier for lost revenue as the wind turbine is not
performing to that which was described in the warranted power curve. In parallel a
PPT should be conducted using LIDAR technology. Both Scanning LIDAR and
forward facing nacelle installed LIDAR could also perform the test and the results
could be compared.
Offshore PPT
Unfortunately due to delays associated with contracts, weather and the duration of
time required to perform a PPT (the time to capture enough wind measurements in all
directions) did not elapse. However, it was possible to install the LIDAR in the
offshore location as described in Section 5. Following the installation of the LIDAR
there were some issues with the windcube and some trouble shooting was required.
This section describes some of the issues faced and how they were solved.
It transpired that the wiper function to clear dirt, rain etc was faulty and was causing
the device to restart the instruments every time it was initiated. Pop ups appeared on
the LIDAR control system. Examples of these are displayed in Figure 31.

Renewable Energy Systems and the Environment MSc Thesis Ian Horsfield
57
Figure 31: Offshore Installation Trouble Shooting
Remote connection was established with the LIDAR system and this meant it was
possible to control the system from the onshore substation. From there the system
settings were reviewed. The wiper iteration was removed. This prevented the auto-run
process which was constantly restarting the instruments after each wipe. A screen shot
of the working system is included in Figure 32.
Figure 32: LIDAR Setting 3
Renewable Energy Systems and the Environment MSc Thesis Ian Horsfield
58
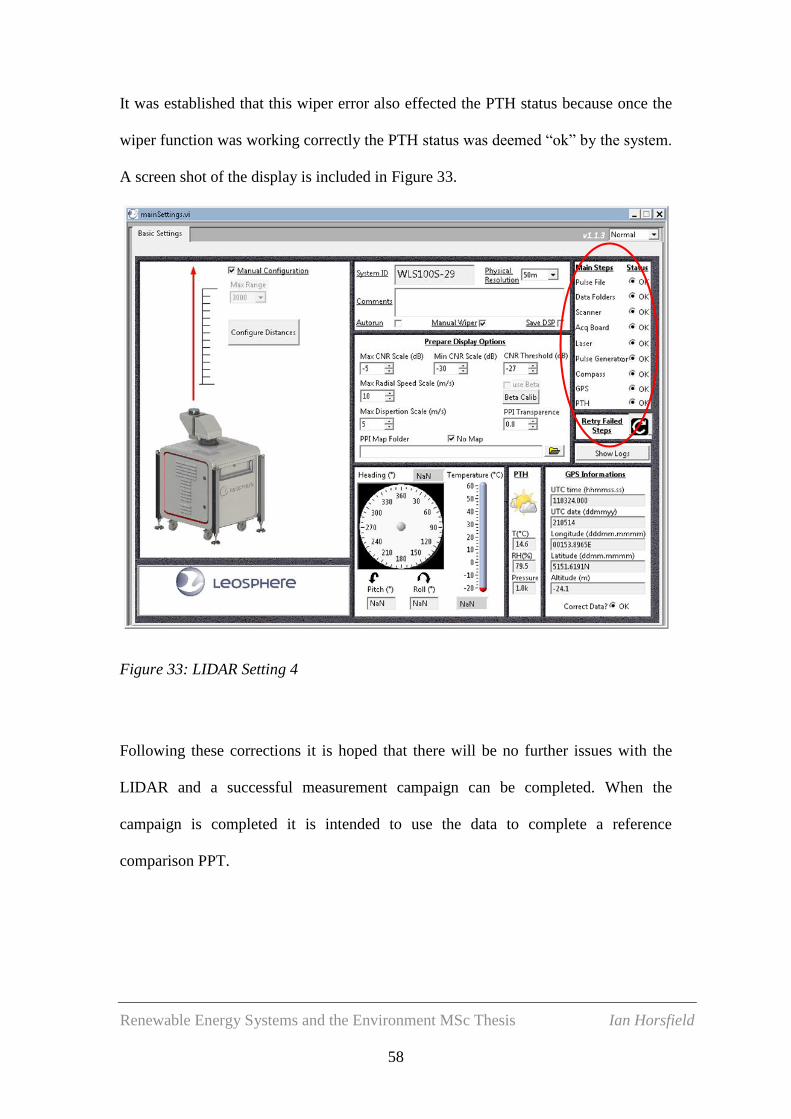
It was established that this wiper error also effected the PTH status because once the
wiper function was working correctly the PTH status was deemed “ok” by the system.
A screen shot of the display is included in Figure 33.
Figure 33: LIDAR Setting 4
Following these corrections it is hoped that there will be no further issues with the
LIDAR and a successful measurement campaign can be completed. When the
campaign is completed it is intended to use the data to complete a reference
comparison PPT.

Renewable Energy Systems and the Environment MSc Thesis Ian Horsfield
59
8. Future Work
This thesis has assessed the accuracy of LIDAR and confirmed the value of the PPT.
In this section, work which would further validate this thesis and other potential cost
savings which could be realised through the use of LIDAR are explored.
Further Validation
None of the following issues impacted the PPT results but it is expected that greater
accuracy could be achieved if improvements in these areas are made.
Calibration of the instruments used for the test could have been calibrated by
an independent third party.
Recorded data for a longer period would produce more accurate results. This
analysis considers 4 months of recorded data only.
This analysis was informal and cannot be used to negotiate with the wind
turbine supplier even if it does show an underperformance. To successfully
negotiate with the wind turbine supplier over underperformance a formal test
performed by an independent third party should be performed to confirm the
magnitude of underperformance.
A similar PPT can be performed using adjacent wind turbines however the
uncertainty will increase as the distance from the Met Mast will increase.
A forward facing LIDAR measurement campaign should be conducted. This
will improve the accuracy as the measurement will be done in front of the
rotor instead of by the anemometer on the nacelle which is affected by the
movement of the wind turbines rotor.

Renewable Energy Systems and the Environment MSc Thesis Ian Horsfield
60
The parasitic loads on the wind turbine should be measured to investigate
whether these loads are having a greater influence than might normally be
expected on the power curve.
It is proposed that in 2015 a forward facing LIDAR will be installed on wind turbine
A and an independent PPT will be conducted. This will confirm the
underperformance which this study found. If the shortfall of 3% is confirmed this will
be used to negotiate lost revenue claims with the wind turbine supplier and a
rectification to the route cause of why the wind turbines are underperforming. As
resource assessment becomes more accurate these claims are becoming more and
more common across the wind industry.
Similarly, these improvements could be made to the onshore measurement campaign
which was conducted. This would also bring greater accuracy to that analysis too.
Future Use of LIDAR
Current wind turbines typically use nacelle mounted anemometers to measure wind
speed. These instruments are well known to be subject to wake and turbulence due to
the measurement of wind being taken behind the wind turbine blades.
Nacelle mounted forward facing LIDAR can measure wind conditions upwind. This
measurement is unaffected by turbulence and wake effects due to the passage of the

Renewable Energy Systems and the Environment MSc Thesis Ian Horsfield
61
wind turbine’s own rotor blades. This provides a significantly more accurate way to
measure wind conditions compared to nacelle mounted anemometry and wind vanes.
Wind turbine yaw control also depends on nacelle mounted measurement equipment
which is vulnerable to inaccuracies. Improvements in this area could increase
efficiency and also benefit the wind turbine’s components through reduced loading. If
a wind turbine’s direction is slightly wrong then it will experience only a reduced
component of the full wind speed. Eradication of the errors in this area can provide a
significant revenue benefit to the wind farm developer.
While operational power curves can be measured using existing nacelle anemometry
this is subject to the aforementioned errors meaning the accuracy associated with the
performance of the wind turbine fleet is largely unknown. If forward facing nacelle
mounted LIDAR provide more accurate wind speed measurement then the wind
turbine operator will have an improved knowledge of whether operating wind turbines
are performing in accordance with their performance warranty power curve.
The relative cost of a forward facing LIDAR in this case would obviously be in
excess of the turbine anemometry and would be in the region of £100,000. This
upfront capital costs though would be cancelled out by the benefits described above
and it is expected that they would result in a pay back over the lifetime of a wind farm
project. Operational and Maintenance costs would also be reduced through LIDAR
alternatives. Met Masts require instrumentation replacement usually every two years.
This can be costly as it requires special working at height specialists. This is not the

Renewable Energy Systems and the Environment MSc Thesis Ian Horsfield
62
case for LIDAR because of its location on the ground although it will require a certain
amount of inspection and maintenance on an annual basis but it is expected to be less
than that associated with a Met Mast. In summary, it would be expected that the costs
associated with the forward facing LIDAR would be less than those for the Met Mast.
9. Conclusions
The wind industry both on and offshore is growing and with it so does the size of
wind turbines. We are now moving into an era where wind turbines in the region of
10 MW with rotor diameters of 200 meters will not be uncommon. Wind resource
assessment is also keeping pace with the industry and the growing requirement for
taller masts has led to the development of more flexible methods of measuring wind
such as the emergence of remote sensing technologies.
LIDARs have been rigorously tested and as a result their accuracy has increased with
improvements in areas such as signal processing and the cloud correction algorithms.
Computation Fluid Dynamics (CFD) modelling is also becoming more common [20].
This too can reduce uncertainty associated with wind measurement and if used in
association with LIDAR measurement can be employed to better understand areas
which are difficult to measure such as complex and rough terrains.
The precision of LIDAR anemometry appears to have matured to a level where its use
for stand-alone resource assessment is now an acceptable consideration for a wind
farm. This thesis aimed to confirm LIDAR’s accuracy and through the measurement

Renewable Energy Systems and the Environment MSc Thesis Ian Horsfield
63
campaign conducted for this thesis an acceptable correlation between a LIDAR and
Met Mast was achieved.
The PPT conducted has shown that wind farms can be significantly underperforming.
LIDAR provide the developer with a cost effective method of performing this test and
an effective way of measuring the wind farm’s performance. Unfortunately due to
time restraints, performing this test using LIDAR was outside the scope of this thesis.
It is intended that the PPT can be reproduced using the scanning LIDAR installed in
2015.
It is clear that savings need to be made to reduce the cost of wind energy. It has been
shown that LIDAR has huge potential here and with the technology improvements
which have been seen in the last number of years it is clear LIDAR will continue to
develop and it is likely to have a significant impact on both the accuracy of wind
monitoring and the cost associated with it in the future.

Renewable Energy Systems and the Environment MSc Thesis Ian Horsfield
64
10. References
[1] David Gow, Wind power becomes Europe’s fastest growing enegy source, Feruary
2009:
http://windenergyigert.umass.edu/research
[2] The European Wind Energy Association, Ocean’s of opportunity: harnessing
Europe’s largest domestic energy resource, September 2009:
http://www.ewea.org/fileadmin/ewea_documents/documents/publications/reports/Offs
hore_Report_2009.pdf
[3] Samuela Bassi, Alex Bowen and Sam Fankhauser, The Case for and against
onshore wind in the UK, Policy brief June 2012:
http://www.lse.ac.uk/GranthamInstitute/publications/Policy/docs/PB-onshore-wind-
energy-UK.pdf
[4] Damian Carrington, Renewables industry welcomes reduced subsidies for onshore
windfarms, December 2013:
http://www.theguardian.com/environment/2013/dec/04/reduced-subsidies-onshore-
windfarms-good-news
[5] Georgia Graham, Onshore wind farm subsidies will be cut, December 2013:
http://www.telegraph.co.uk/earth/energy/renewableenergy/10493349/Onshore-wind-
farm-subsidies-will-be-cut.html
[6] Department of Energy & Climate Change, UK Renewable Energy Roadmap
Update 2013, November 2013:
https://www.gov.uk/government/uploads/system/uploads/attachment_data/file/255182
/UK_Renewable_Energy_Roadmap_-_5_November_-
_FINAL_DOCUMENT_FOR_PUBLICATIO___.pdf
[7] Figure 1: How Wind is Created:
http://www.physicalgeography.net/fundamentals/7n.html
[8] Figure 3: Wind Turbine Power Curve Example:
http://www.wind-power-program.com/popups/powercurve.htm
[9] B Maribo Pedersen, Troels Friis Pedersen, Helmut Klug, Nico van der Borg, Neil
Kelley, Jan Åke Dahlberg,, Recommended Practices for Wind Turbine Testing and
Evaluation, (Chapter 11. Wind Speed Measurement and Use of Cup Anemometry),
Edition 1999, Second Print 2003:
https://www.ieawind.org/Task_11/recommended_pract/Recommended%20Practice%
2011%20Anemometry_secondPrint.pdf
[10] Figure 4: Mechanical Cup Anemometer Example:
http://www.geographylwc.org.uk/GCSE/igcse/weather/weather.html

Renewable Energy Systems and the Environment MSc Thesis Ian Horsfield
65
[11] Figure 5: Propeller Anemometer Example:
http://sensor.nevada.edu/NCCP/Education/Clark%20Activities/Articles/Wind%20Spe
ed.aspx
[12] Figure 6: Ultrasonic Anemometer:
http://www.apptech.com/vx-style-ultrasonic-anemometer.html
[13] Figure 8: LIDAR and SODAR Example:
Roger Carter, the Renovation and Re-commissioning of an AQ500 SODAR System for
Use in the Assessment of Urban Wind Energy Applications, 2010.
[14] Peter Clive, Unlocking the value of LiDAR, 2012:
http://www.sgurrenergy.com/wp-content/uploads/2012/08/Industry-paper-Unlocking-
the-value-of-LiDAR1.pdf
[15] Steven Lang and Eamon McKeogh, LIDAR and SODAR Measurements of Wind
Speed and Direction in Upland Terrain for Wind Energy Purposes, August 2011
[16] International Standard, IEC 61400-12-1 Wind Turbines Part 12-1: Power
Performance Measurements of Electricity Producing Wind Turbines, 2nd
Edition,
International Electro-technical Commission, 2013.
[17] Table 2: Windcube v2 Specification:
http://www.leosphere.com/wp-content/uploads/2014/02/WINDCUBE-
V2_LEOSPHERE_BD.pdf
[18] Vortex Hindcast reference location;
http://www.vortexfdc.com/
[19] Sten Frandsen and C.J Christensen, Accuracy of Estimation of Energy
Production from Wind Power plants, 1992.
[20] Jonathon Sumner, Christophe Sibuet Watters and Christian Masson, CFD in
Wind Energy: The Virtual, Multiscale Wind Tunnel, May 2010