an approach to measure community smells in software ... · corso di laurea magistrale in ingegneria...
TRANSCRIPT

Politecnico di MilanoScuola di Ingegneria Industriale e dell’Informazione
Corso di Laurea Magistrale in Ingegneria InformaticaDipartimento di Elettronica, Informazione e Bioingegneria
An approach to measure Community Smellsin software development communities
Relatore: Prof.ssa Elisabetta Di NittoCorrelatore: Dr. Damian Andrew Tamburri
Tesi di laurea di:Simone Magnoni Matr. 816316
Anno Accademico 2015–2016


To my Family,my Friends
and A.


Acknowledgments
Above all, I would like to express my deepest gratitude to professor ElisabettaDi Nitto and Damian Andrew Tamburri, who supported me in the elaboration ofthis master thesis with their precious guidance and advice.
I would like to thank all Open Source Software developers for their remarkablework, whoever participated to the survey and every single person who contacted mewith a positive or negative comment about the questionnaire.
In conclusion, I would like to thank everybody who supported me, in any possibleway, during these last years.
Simone


Abstract
Software development and software engineering are now more than ever a com-munity effort because their success often depends on people and their socio-technicalcharacteristics. Therefore, it becomes fundamental balancing delicate forces, such asglobal distance or organisational barriers, with ad-hoc global software engineeringpractices. In this complex community scenario, it is likely that the arise of unfore-seen socio-technical circumstances requires extra attention from community leadersin order to reduce any additional socio-technical cost, known as Social Debt.
To offer support in these situations and study the causality around Social Debtwithin Open Source projects, we conducted an empirical research in order to de-fine, operationalise and evaluate a Socio-technical Quality Framework for softwaredevelopment communities. Community Smells are synonyms of negative organisa-tional and social patterns that represent a potential risk related to the presence ofSocial Debt. The proposed framework provides the identification and quantificationof Community Smells and it is also constituted by a set of fundamental factors ca-pable of tracking and quantifying organisational and socio-technical key qualities,constituting a tool that can be used for continuous Social Debt management andimprovement, much like code analysis and verification are used to improve softwareproducts.
We evaluated our framework on 60 Open Source development communities andmade several key findings concerning organisational and socio-technical quality fac-tors correlated to the occurrence of Community Smells, thus capable of influencingthe wellbeing of software projects. Moreover, we determined several socio-technicalquality thresholds and identified some developer perceptions capable of acting asqualitative indicators of the presence of Community Smells.

Sommario
L’ingegneria e lo sviluppo del software sono ora più che mai uno sforzo comuni-tario, dal momento che il loro successo dipende dalle persone e dalle loro caratter-istiche socio-tecniche. E’ dunque diventato fondamentale equilibrare forze delicate,come la distanza globale e le barriere organizzative, con pratiche ad-hoc di ingegneriadel software. In questo complesso scenario è possibile che l’insorgere di circostanzesocio-tecniche impreviste richieda una maggiore attenzione da parte dei leader diuna comunità al fine di ridurre ogni costo socio-tecnico aggiuntivo, noto come SocialDebt.
Per offrire un supporto in queste situazioni e studiare le caratteristiche del So-cial Debt in progetti Open Source, è stata condotta una ricerca empirica al finedi definire, operazionalizzare e valutare un Socio-technical Quality Framework percomunità di sviluppo software. I Community Smells sono modelli sociali e orga-nizzativi negativi che rappresentano un potenziale rischio relativo alla presenza diSocial Debt. Il framework proposto fornisce l’identificazione e la quantificazione diCommunity Smells ed è inoltre costituito da un insieme di fattori capaci di trac-ciare e quantificare importanti qualità socio-tecniche e organizzative, costituendouno strumento che può essere utilizzato per migliorare e gestire in modo continuoil Social Debt, così come l’analisi e la verifica del codice sono usate per migliorare iprodotti software.
Il framework è stato valutato in 60 comunità di sviluppo Open Source e sonostati individuati molti fattori socio-tecnici ed organizzativi correlati alla presenzadi Community Smells, quindi in grado di influenzare il benessere dei progetti soft-ware. Inoltre, sono state determinate diverse soglie di qualità ed identificate alcunepercezioni degli sviluppatori in grado di fungere da indicatori qualitativi della pre-senza di Community Smells.

Contents
1 Introduction 1
2 State of the art 52.1 Conway’s law and beyond . . . . . . . . . . . . . . . . . . . . . . . . 62.2 Global Software Development . . . . . . . . . . . . . . . . . . . . . . 102.3 Free/Libre and Open Source Software . . . . . . . . . . . . . . . . . 122.4 Developer Social Networks . . . . . . . . . . . . . . . . . . . . . . . . 172.5 Technical and Social Debt . . . . . . . . . . . . . . . . . . . . . . . . 222.6 Motivational research . . . . . . . . . . . . . . . . . . . . . . . . . . 29
3 Problem analysis 353.1 Definitions . . . . . . . . . . . . . . . . . . . . . . . . . . . . . . . . . 353.2 Research questions . . . . . . . . . . . . . . . . . . . . . . . . . . . . 373.3 Contributions . . . . . . . . . . . . . . . . . . . . . . . . . . . . . . . 373.4 Dataset selection . . . . . . . . . . . . . . . . . . . . . . . . . . . . . 39
4 Identification patterns of Community Smells 434.1 Organisational Silo Effect and Missing Links . . . . . . . . . . . . . 454.2 Black-cloud Effect . . . . . . . . . . . . . . . . . . . . . . . . . . . . 504.3 Prima-donnas Effect . . . . . . . . . . . . . . . . . . . . . . . . . . . 524.4 Radio Silence . . . . . . . . . . . . . . . . . . . . . . . . . . . . . . . 54
5 Socio-technical Quality Framework 575.1 Developer Social Network metrics . . . . . . . . . . . . . . . . . . . . 585.2 Socio-technical metrics . . . . . . . . . . . . . . . . . . . . . . . . . . 615.3 Core community members metrics . . . . . . . . . . . . . . . . . . . 635.4 Turnover . . . . . . . . . . . . . . . . . . . . . . . . . . . . . . . . . . 665.5 Social Network Analysis metrics . . . . . . . . . . . . . . . . . . . . 67
6 Survey 716.1 The questionnaire . . . . . . . . . . . . . . . . . . . . . . . . . . . . 726.2 Background of respondents . . . . . . . . . . . . . . . . . . . . . . . 73
i

Contents
6.3 Confirmatory role . . . . . . . . . . . . . . . . . . . . . . . . . . . . . 786.4 Validity of Community Smells . . . . . . . . . . . . . . . . . . . . . . 816.5 Quality factors identification . . . . . . . . . . . . . . . . . . . . . . 83
7 Operationalising our Quality Framework: Codeface4Smells 857.1 Codeface . . . . . . . . . . . . . . . . . . . . . . . . . . . . . . . . . . 857.2 Architecture of Codeface4Smells . . . . . . . . . . . . . . . . . . . . 887.3 Operationalisation of Community Smells . . . . . . . . . . . . . . . . 967.4 Socio-technical Quality Framework implementation . . . . . . . . . . 101
8 Evaluation 1098.1 Occurrences of Community Smells . . . . . . . . . . . . . . . . . . . 1108.2 Quality factors correlated to Community Smells . . . . . . . . . . . . 1128.3 Qualitative indicators of Community Smells . . . . . . . . . . . . . . 1198.4 Summary of Research Questions . . . . . . . . . . . . . . . . . . . . 1228.5 Threats to validity . . . . . . . . . . . . . . . . . . . . . . . . . . . . 123
9 Conclusions and future work 125
List of Figures 128
List of Tables 129
List of Algorithms 131
Bibliography 139
A Survey 141A.1 The questionnaire . . . . . . . . . . . . . . . . . . . . . . . . . . . . 141A.2 Characteristics of initially considered projects . . . . . . . . . . . . . 144A.3 Likert scale results . . . . . . . . . . . . . . . . . . . . . . . . . . . . 144
B Codeface4Smells 149B.1 Set-up and analysis execution . . . . . . . . . . . . . . . . . . . . . . 149B.2 Project configuration . . . . . . . . . . . . . . . . . . . . . . . . . . . 150B.3 Analyse high-volume communities . . . . . . . . . . . . . . . . . . . 151B.4 Utility tools . . . . . . . . . . . . . . . . . . . . . . . . . . . . . . . . 152
C Reports of reference projects 155C.1 Firefox . . . . . . . . . . . . . . . . . . . . . . . . . . . . . . . . . . . 156C.2 LibreOffice . . . . . . . . . . . . . . . . . . . . . . . . . . . . . . . . 159C.3 FFmpeg . . . . . . . . . . . . . . . . . . . . . . . . . . . . . . . . . . 162
ii

Chapter 1
Introduction
In the last decade, software became predominantly engineered by large andglobally-distributed communities and consequently, now more than ever, it is ofvital importance knowing more on the quality of these communities to ensure thesuccess of a software project [1]. Socio-technical decisions, like changing the organi-sational structure of a software development community or its internal developmentprocesses (e.g., adopting agile methods), modify how people work and interact witheach other and, as a side effect, they influence the well-being and success of thesoftware project [2].
Previous researches revealed that software development communities can developills that collectively contribute to a form of additional project cost that was definedSocial Debt [3], which is similar but parallel to Technical Debt [4], because it rep-resents additional project costs not necessarily related to the source code itself butrather to its “social” nature and thus it is correlated to sub-optimal organisationalstructure and socio-technical characteristics of a software community.
This master thesis elaborates, validates and discusses a Socio-technical QualityFramework for software development communities, constituted by quality factors,which reflect projects’ organisational and socio-technical characteristics (e.g., socio-technical congruence [5]), and Community Smells, which identify sub-optimal or-ganisational and socio-technical characteristics that lead to issues in communities’organisational and social structures [6]. To the best of our knowledge, our Socio-technical Quality Framework is the first of its kind and may well inspire furtherresearch in the intriguing social software engineering field of managing Social Debt,through the identification and quantification of Community Smells.
In order to incorporate within our Socio-technical Quality Framework the mostrelevant software development community quality factors, we designed it consideringthe organisational and socio-technical literature, metrics elicited from Social Debtresearches [7] and by means of a survey to FLOSS developers featuring almost 60respondents, executed with the goal of isolating critical success and failure factors
1

1. Introduction
within software development communities in three large and widely known OpenSource communities: Firefox, LibreOffice and FFmpeg. The resulting frameworkis constituted by a total of 40 quality factors, classified in five different categoriesof metrics: Developer Social Network, socio-technical, core community members,Turnover and Social Network Analysis. Furthermore, we defined identification pat-terns of several Community Smells and operationalised them within the tool wedeveloped.
We proceeded by formulating several hypotheses on potential correlations be-tween specific quality factors belonging to the Socio-technical Quality Frameworkand the occurrence of Community Smells defined within the model and then we eval-uated our hypotheses against our corpus of data, consisting of community qualityfactors and occurrences of Community Smells for 60 analysed Open Source Softwaredevelopment communities.
As a result of our evaluation, we found several valuable insights to assess thequality of software development communities. For example, considering the litera-ture [8] we conjectured that a higher number of developers sponsored by commercialcompanies would lead to higher community attractiveness and health, which in turnwould lead to a lower number of Community Smells. Conversely we found thatCommunity Smells increase quadratically with the linear growth of the numberof developers sponsored by commercial companies, while for software communitiesbelow 50 trimestral participants the number of sponsored developers becomes irrele-vant. Furthermore, we conjectured and later verified that socio-technical congruenceleads to a lesser number of Community Smells and thus to a higher quality of or-ganisational and social structures. Within the various proposed hypotheses, weconjectured that the number of time-zones, representing the geographic and tem-poral dispersion of a software development community, would weigh heavily on thecreation of Community Smells, but we observed that the number of time-zones in-volved in the development activity do not mediate in any way the emergence of anyCommunity Smell currently detected by our model.
Moreover, we executed a questionnaire in three large and widely known FLOSSdevelopment communities (Firefox, LibreOffice and FFmpeg), aimed at investigat-ing if perceptions of FLOSS developers can be used as indicators of the presence ofCommunity Smells within a development community and we achieved many inter-esting findings. For example, we discovered that software development communitieswith higher perceived documentation quality are characterised by less CommunitySmells.
Chapter 2 discusses the state of the art of important aspects that were funda-mental in the definition and elaboration of this master thesis. Chapter 3 provides anoverview of the problem analysis and research questions that are at the foundationof this work. Identification patterns of several Community Smells are defined in
2

Chapter 4, while the complete list of identified key quality factors composing ourSocio-technical Quality Framework are presented in Chapter 5. Chapter 6 discussesthe survey proposed to Firefox, LibreOffice and FFmpeg development communitiesand provides several findings related to Community Smells and Social Debt. Ourimplementation of Community Smells’ identification patterns and quality factorsbelonging to our Socio-technical Quality Framework is proposed and explained inChapter 7. Further on, Chapter 8 provides the evaluation of our work with therelative findings related to the occurrence of Community Smells within FLOSS de-velopment communities and Chapter 9 concludes this master thesis.
3

1. Introduction
4

Chapter 2
State of the art
This chapter introduces background information and related work which werefundamental in the formulation and execution of this master thesis. The stateof the art of Conway’s law research field, presented in Section 2.1, provided thetheoretical concepts and hypothesis at the foundation of our research; moreover,concepts summarised in this section were important in the identification and defi-nition of quality factors constituting our Socio-technical Quality Framework (e.g.,socio-technical congruence). Sections related to Global Software Development andto its most particular case constituted by Free/Libre and Open Source Software,discussed respectively in Section 2.2 and Section 2.3, are introduced to provide thenecessary background information to understand the context of our empirical re-search; furthermore, the provided concepts were fundamental to identify potentialsocio-technical issues that are intrinsic within the two typologies of developmentenvironments studied within the literature, in order to further comprise and definequality factors capable of capturing every aspect of a software development commu-nity and their associated side effects within our framework. Section 2.4 presents aset of researches, in order to demonstrate the validity, effectiveness and efficacy ofusing Developer Social Networks in empirical software engineering researches, buildconsidering either mailing lists or Version Control Systems. Social Debt and its tech-nical counterpart are introduced in Section 2.5, to ensure a deeper understandingof the main topics covered within this master thesis and to identify potential qual-ity factors capable of impacting the health of a software development community(e.g., communicability). Finally, Section 2.6 summarises two important softwareengineering researches that provided the theoretical foundations and verified theeffectiveness and validity of the applied empirical research approach of this masterthesis.
5

2. State of the art
2.1 Conway’s law and beyond
In 1968 with his article titled “How do committees invent?” [9], Dr. MelvinConway introduced for the first time the idea, now commonly called “Conway’slaw”, that systems designed by an organisation are constrained to produce designswhich are copies of the communication structure of the same organisation. Conway,through the use of linear-graph notation, demonstrated that there is a very closerelationship between the structure of a system and the structure of the organisationwhich designed it. The consequence of this homomorphism is that if subsystems dohave their own separate design group then the structure of each design group and thesystem’s organisation will be identical, otherwise if the same group designed multiplesubsystems, every subsystem’s structure will have the same design group collapsedinto one node representing that group. The phenomenon described by Conway’s lawis more evident as the organisation size increases, because its flexibility diminishes.
Software development is characterized by a technical and a social component.The technical component is composed by the processes, tasks and technologies usedduring the software development, while the social component is constituted by or-ganisations and people involved in the development and their characteristics. Dueto this dichotomy, software development can be considered a social-technical activity,in which the technical and the social components need to be aligned to succeed [5].
To design a computer program or any other type of artefact, the initial stepsare more related to design activity rather then to the system itself since the designactivity cannot proceed until its boundaries and the boundaries of the system to bedefined are understood and until a preliminary notion of the system’s organisationis achieved. As a consequence of this Conway concluded that “the very act oforganizing a design team means that certain design decisions have already beenmade, explicitly or otherwise”. The steps after the choice of such preliminary systemconcepts are [9]: organisation of the design activity and delegation of tasks accordingto that concept, coordination among delegated tasks and consolidation of sub-designsinto a single design . A system is then structured from the interconnection of smallersubsystems, and so on, until a stage in which the subsystems are easy enough to beunderstood without further subdivisions is reached. Large systems naturally tend todisintegrate themselves more than small systems during the development activitiesand so a system management activity should be used to mitigate this dangerouscharacteristic. To achieve an effective coordination among teams, architecture isnot the only dimension that should be considered but even plans, processes andcoordination mechanisms are fundamental elements [10].
Fred Brooks in his book titled “The Mythical Man-Month” [11], in agreementwith Melvin Conway’s theory, verified that the product quality is strongly relatedto the organisational structure. In real world projects estimates can be inaccurate,
6

2.1. Conway’s law and beyond
processes may be executed imperfectly, requirements and technology changes andpeople leave. Even if mature companies should anticipate those events, empiricalstudies suggest that developers rely on informal communications to correct errorsand problems raising from that kind of events [10].
Due to the homomorphic relation between components and the organisationalstructure, Conway [9] proposed the theory that a team can work on many compo-nents but that a single module must be assigned to a single team. This concept wasintroduced for the first time in the software engineering field in 1972 by Parnas [12],who argued that software modules should not only be considered a collection ofsub-programs but instead as work items. Different modules can be developed inparallel and independently from each other and the development time should beshortened since separate teams work on different modules and, as a consequence,the communication need is reduced.
In single location organisations, informal communications and informal meetingsare surprisingly important to keep the project coordinated and to resolve conflicts assoon as possible. Conway’s law do not consider this type of communications becausethey are implicit and invisible in single site companies.
In 1999 Herbsleb and Grinter [10] analysed Conway’s law validity and scalabilityin Global Software Development (GSD). In geographically distributed developmentenvironments different time zones, languages and cultures may complicate informalcommunications. This distributed development’s side effect, in conjunction with theimpossibility of frequent informal physical meetings, influences the project’s coordi-nation structure since participants may not be aware of a coordination need towardother members, without having informal communications with them. In their work,Herbsleb and Grinter, identified the following coordination activities that were in-fluenced by the geographically distributed nature of Global Software Development:knowing whom to contact, difficulty of initial contact, ability to communicate effec-tively and lack of trust.
Since coordination mechanisms and informal communications are both very im-portant in geographically distributed environments, methods to overcome and mit-igate the effect of temporal, cultural and geographic diversity are vital. The fol-lowing quality approaches can be implemented to reduce the cross-communicationneeds between different geographically distributed sites of a same company, andthus reducing one of the GSD’s critical factor [10]:
• consider Conway’s law and keep a good modular design and assign separatedtasks to different sites;
• do not split the development across different sites, whenever it is possible, toavoid the creation of instabilities;
• maintain the documentation available and up to date;
7

2. State of the art
• overcome informal communication barriers whenever it is possible, encouragingthe establishment of informal cross-site relationships (e.g. front-load travels).
In 2002 Mockus [13] considered mailing lists, code repositories and issue trackingsystems of two important FLOSS projects and analysed developers participationand community metrics. He concluded that a higher organisational structure mod-ularity may indicate a lower coordination need and that a “communication-only”approach in a distributed software development environment, as FLOSS ecosystem,does not scale because communication channels will be overwhelmed as the size andthe complexity of the project and community will grow.
Since the beginning of software development, metrics were defined to estimatethe quality of developed software (e.g. LOC, code churn, code complexity, codedependencies) but they measured only the technical aspect of software and ignoredthe “social” factor of software development which is related to people and to theorganisational structure. Using Brooks’ theory as a starting point, Nagappan etal. [1] analysed the relation between organisational structure and software quality.They proposed eight measures to quantify organisational complexity from the codeviewpoint and empirically evaluated their efficacy to identify failure-prone binariesin a commercial project. The failure-proneness prediction model based on the or-ganisational metrics outperformed traditional technical metrics (e.g. code churn,code complexity, LOC).
Conway’s law and Brooks’ theory imply that changes within the organisation caninfluence the software quality because the organisational structure will be modified.Those theories were addressed and verified by Mockus [14], who stated that one ofthe main goal of an organisation is to increase its efficiency. To achieve this goal anorganisation should define roles, processes, formal reporting relationship roles andreporting relationships to improve its internal functioning; therefore, any change inthe organisational structure will affect the software product quality.
In his research Mockus [14] investigated the relationship between developer-centric measures of organisational change and the probability of customer-reporteddefects in the context of a large software project and found that factors negativelyinfluencing the software quality are: proximity to an organisational change, dis-tributed development and recent developers departure. Mockus was not able toidentify at what extent the organisational volatility causes or is a cause of defectsbut from his results it was evident that larger size organisations were associatedwith higher chances of defects. This correlation can be caused by the increasedcoordination need and by the reduced decision making speed.
The concept of socio-technical congruence was introduced by Cataldo et al. asthe “match between the coordination requirements established by the dependenciesamong tasks and the actual coordination activities carried out by the engineers”[5,15]. Cataldo et al. discovered that socio-technical congruence is highly correlated
8

2.1. Conway’s law and beyond
to the software development productivity: a higher socio-technical congruence isproven to speed-up software development, reducing the amount of time needed toperform a task and they demonstrated that over time developers learn to use theavailable communication channels in such a way to reach a higher congruence, thusif the development base is stable then the socio-technical congruence should increaseover time [15].
The concept of socio-technical congruence was later redefined in 2008 by Sarmaet al. as “the state in which a software development organisation harbors sufficientcoordination capabilities to meet the coordination demands of the technical productsunder development” [16] and the following socio-technical congruence characteristicswere identified:
1. it represents a state because it captures a particular moment in time of thecompany’s social and technical context;
2. it is descriptive of a certain state in which an organisation finds itself in adefined time because individuals that perform the work may take non-optimaldecisions;
3. it is dynamic because the technical and social structures change and evolveover time;
4. it is multi-dimensional because it depends on every possible way to coordinatework;
5. it can be considered at multiple levels: individuals, sub-teams, teams or entireorganisation;
6. it involves trade-offs because congruence may differ in every considered leveland achieving congruence in a level may create an incongruence in anotherone.
In 2010 Colfer and Baldwin [17] complemented Conway’s law verifying the valid-ity of their mirroring hypothesis, which assumed that the organisational patters ofa development community (e.g. team co-membership and geographic distribution,communication links) mirror the technical dependency patterns of the software un-der development. Their contribution added the opposite causality relationship toConway’s law: the technical structure mirrors the organisational structure, essen-tially turning Conway’s original argument into an isomorphism. In other words,a change to the communication structure will eventually trigger a change to thedesign structure to return the socio-technical system into a state of socio-technicalcongruence.
The relation between software development organisational changes (e.g. forks,company acquisition, open-sourcing) and software quality was addressed even by
9

2. State of the art
Sato et al. [18], who demonstrated that when multiple organisations (concurrentlyor in temporal succession) modify the same file, the increased modification frequencyand complexity will lead the file to be more faulty.
Summing up, socio-technical congruence states that if two people work on depen-dent tasks then they need to communicate with each other. Communication needscan be computed analysing code modules and their inter-dependences. For example,if two developers work on inter-dependent modules then they have to communicateto coordinate their work and if they do not communicate and this gap is detected,then it can suggests a coordination problem. Socio-technical congruence manage-ment consists in reducing the number of this kind of gaps. To minimize those gaps itis possible to promote coordination mechanisms or reducing the coordination needs(e.g. reducing modules inter-dependences [12]).
2.2 Global Software Development
One of the main innovations that is characterizing the 21th century is global-isation: “the process of international integration arising from the interchange ofworld views, products, ideas and mutual sharing, and other aspects of culture” [19].Globalisation is influencing every aspect of our life, from politic to economy, from so-ciety to technological systems, through the connection and integration of companies,people and nations on a global scale.
Friedman in his book “The World Is Flat: A brief history of the twenty-firstcentury” defined ten “flattener” events that allowed all commercial competitors tohave the same opportunities by playing with the same set of rules, enabling theglobalisation process. Those historical events are [20]:
1. 11 September 1989 – “Fall of Berlin wall”: represents the end of the Cold Warand the revolutionary possibility of creating personal software programs, con-tents and interconnections with other people around the world using PersonalComputers;
2. 8 September 1995 – “Netscape”: Internet is accessible to everyone;
3. “Work-flow software”: virtual applications are now able to cooperate withouthuman assistance. This is considered by Friedman the “genesis” because itis the moment in time where the global platform enabling multiple forms ofcollaboration was born;
4. “Open-sourcing”: communities collaborate and upload their work on on-lineprojects;
5. “Outsourcing”: companies can split and externalise their activities in efficientand effective ways;
10
2.2. Global Software Development
6. “Off-shoring”: international relocation of company’s processes in countrieswhere production costs are lower;
7. “Supply-chaining”: supply and demand management is integrated across com-panies;
8. “In-sourcing”: Commercial companies employees perform services for con-nected third party companies;
9. “Informing”: social and search engines and information-rich websites allowaccess to a massive amount of information;
10. “The steroids”: any analogical content can be digitised and telematically trans-mitted at high speed, in mobility, any time and by anyone.
As a consequence of outsourcing and off-shoring flatteners, commercial softwarestarted to be developed by different geographically distributed and cooperative com-mercial software companies. There two flatteners are the fundamental prerequisitesto enable Global Software Development (GSD), that is defined as “the nature ofglobalisation which reduces temporal, geographic, social, and cultural distance acrosscountries” [21].
Global Software Development differs from traditional software development be-cause in addition to the customer that buys the software and the commercial com-pany that sells it, there are suppliers whom develop software through the mechanismof outsourcing and off-shoring. Global Software Development can be attractive forcommercial companies because it reduces production costs due to its off-shoring na-ture, it allows companies to hire the best developers from any country of the world,it creates the chance of constitute virtual corporations in very fast ways, it allowsto benefit from proximity to the market and it enables a “round the clock” softwaredevelopment approach, through the exploitation of different time zones, improvingthe time-to-market.
In a Global Software Development environment, as previously seen, the lack ofcommunications between developers and the assignment of the same task to twodifferent geographical sites can compromise the development success. Consideringthe off-shoring characteristic of GSD, social and cultural differences between devel-opers can impact on the overall trust and software quality. To achieve the bestperformance from a GSD approach, commercial companies should take some pre-cautions to avoid potential side effects, that can be categorized largely as temporal,geographical, social and cultural barriers [21]. Some useful strategies to limit GlobalSoftware Development side effects are: communication and coordination executedthrough common processes, strategic sub-division of tasks [12], offer cultural educa-tion to employees, understand diversity and taking advantage from it [22].
11

2. State of the art
Diversity arises from attributes that differentiate people as their demographicinformation (e.g., gender, nationality, age), their functional information (e.g., role,knowledge, expertise) or their subjective information (e.g., personality, ethic). Molle-man et al. [23] considered team diversity by addressing demographic characteristics,personality traits, technical skills and knowledge characteristics and analysed theirimpact on team functioning and performance in industrial manufacturing and ser-vice environments. The characteristics of a team can be considered at three differentlevels: global, shared and compositional. Global characteristics can be measuredat team level (e.g., time size), shared characteristics are related to individual teammembers perceptions that tend to be shared by all the other team members (e.g.mutual trust) and compositional characteristics are related to individual team mem-bers attributes (e.g., age, skills). Within global team characteristics Molleman etal. considered team size and verified the intuitive idea that the optimal team sizedepends on the team tasks and discovered that “if workers are independent or onlyhave to share resources such as tools, a larger team will achieve a better performance”because team tasks will be simpler and require less coordination effort. This result issimilar to the one obtained by Parnas [12] and other researches reported in Section2.1. Molleman et al. concluded that demographical similarity (e.g., gender, age)facilitates team functioning and effectiveness, enhancing mutual linking and trust.On the opposite side demographic diversity can cause cliquishness, stereotyping andsubgroups conflicts [23]. Earley et al. [24] discovered that even if team diversitynegatively impacts team functioning and effectiveness in the short-medium term, itsside-effect tends to be less relevant as time passes because a common identity willbe created with the institution of ways to interact and communicate.
In conclusion, the increasing interest in Global Software Development creatednew generations of “software development processes, practices and trends such asubiquitous computing, agile methodologies, project outsourcing, distributed soft-ware development, process improvement and standardization, mobile applicationsdevelopment, social networking, and process tailoring practices” [22]. These newtypologies of software applications generated new software development trends andstyles that should be implemented by commercial companies to improve their effi-ciency and effectiveness in software development (e.g., agile methods).
2.3 Free/Libre and Open Source Software
In February 1986 Richard Stallman, founder of the Free Software Foundation(FSF), defined ”Free Software” as any software that respects user and communityfreedom, allowing users to be free to run, copy, study, change, improve and distributethe software. Free software is an ethical matter of liberty and freedom, it is notrelated to price. Free Software does not mean non-commercial and a free software
12

2.3. Free/Libre and Open Source Software
program must be available for commercial use, development and distribution. Tohighlight the fundamental idea that it does not mean gratis, sometimes Free Softwareis called Free/Libre Software, adding the French or Spanish word that means freein the sense of freedom. Four fundamental freedoms were specified to define FreeSoftware with the purpose of allowing users to control the program and what it cando for them. The four freedoms to classify a software as Free Software are [25]:
1. The freedom to run the program as you wish, for any purpose (Freedom 0);
2. The freedom to study how the program works and possibility to change itso it will compute as you wish (Freedom 1). Access to the source code is aprecondition for this freedom;
3. The freedom to re-distribute copies, so you can help your neighbors (Freedom2);
4. The freedom to distribute copies of your modified versions to others (Freedom3). By doing this you can give to the whole community a chance to benefitfrom your changes. Access to the source code is a precondition for this freedom.
Free Software Foundation’s social activism and the misunderstanding of the word“Free” were considered not appealing to commercial software companies by somedevelopers and to promote the potential business deriving from the collaborationand the sharing of source code, the term “Open Source” was created and in February1998 the Open Source Initiative was founded. A computer software is classified asOpen Source Software (OSS) if its source code is available and it is licensed toprovide the rights to study, change and distribute the software for any purpose. TheOpen Source Initiative states that Open Source does not just mean granting accessto the source code but the software must obey to the following ten criteria [26]:
1. Free re-distribution: the license shall not restrict any party from selling orgiving away the software as a component of an aggregate software distribu-tion containing programs from several different sources. The license shall notrequire a royalty or other fee for such sale;
2. Source code: the program must include source code and must allow distributionin source code as well as compiled form. Where some form of a product is notdistributed with its source code, there must be a well-publicized means ofobtaining the source code for no more than a reasonable reproduction cost,preferably downloading via the Internet without charge. The source codemust be the preferred form in which a programmer would modify the program.Deliberately obfuscated source code is not allowed. Intermediate forms suchas the output of a preprocessor or translator are not allowed;
13

2. State of the art
3. Derived works: the license must allow modifications and derived works andmust allow them to be distributed under the same terms as the license of theoriginal software;
4. Integrity of the author’s source code: the license may restrict source-code frombeing distributed in modified form only if the license allows the distribution of”patch files” with the source code for the purpose of modifying the programat build time. The license must explicitly permit distribution of software builtfrom modified source code. The license may require derived works to carry adifferent name or version number from the original software;
5. No discrimination against people or groups: the license must not discriminateagainst any person or group of persons;
6. No discrimination against fields of endeavor: the license must not restrictanyone from making use of the program in a specific field of endeavor. Forexample, it may not restrict the program from being used in a business, orfrom being used for genetic research;
7. Distribution of license: the rights attached to the program must apply to allto whom the program is redistributed, without the need for execution of anadditional license by those parties;
8. License must not be specific to a product: the rights attached to the pro-gram must not depend on the program’s being part of a particular softwaredistribution. If the program is extracted from that distribution and used ordistributed within the terms of the program’s license, all parties to whom theprogram is redistributed should have the same rights as those that are grantedin conjunction with the original software distribution;
9. License must not restrict other software: the license must not place restrictionson other software that is distributed along with the licensed software. Forexample, the license must not insist that all other software distributed on thesame medium must be open-source software;
10. License must be technology-neutral: no provision of the license may be predi-cated on any individual technology or style of interface.
Even if legally Free Software is qualified as Open Source Software, the Free Soft-ware Foundation consider the term Open Source Software close but not identicalto Free Software as the word “Open” never refers to freedom, which is one fun-damental component of the Free Software definition [25]. Stallman said that thetwo terms describe almost the same category of software, but they stand for viewsbased on fundamentally different values: Free Software is a social movement and
14
2.3. Free/Libre and Open Source Software
Open Source Software is a development methodology. He classifies the Free Softwareas an ethical imperative to respect the user freedom while Open Source concern ishow improve software and increasing its popularity and success [27]. As the maindifference between these definitions can be defined as political, in situations wherethe developer political views are not considered important it is possible to be neutralusing the term Free/Libre and Open Source Software (FLOSS). The term Free andOpen Source Software (FOSS) can also be used but the Free Software Foundationconsiders it misleading because it fails to explain that “free” refers to freedom [28].In this master thesis we will use all the above definitions as synonyms.
An Open Source Community can be defined as a network platform in whichthe source code of the software is opened under an Open Source Software licenseagreement. Open Source Communities are fundamental for Open Source Software’spromotion and development. In the last decade the interest in FLOSS grew widelyand now many commercial companies develop, maintain and distribute their prod-ucts through an Open Source Community (e.g. MySQL, Firefox). The pervasivediffusion and growing interest in FLOSS projects from both voluntary developersand commercial software companies constitute a precious asset since developers canextend, modify or reuse code from already existing projects. This possibility canincrease developers productivity and reduce development costs.
FLOSS development can be driven by voluntary developers encouraging knowl-edge sharing rather than the protection of intellectual property, commercial com-panies and institutions from every part of the world. FLOSS software developmentis a perfect example of Global Software Development and it has all the GSD prosand cons. Group dynamics in FLOSS communities are substantially different fromcommercial off-line teams, for example [29]:
• Geographic dispersion and cultural differences are the norm, as communitymembers rarely meet in person;
• Collaborators assemble in on-line communities and coordinate their activitiesthrough distributed communication channels (e.g., mail lists);
• Teams are fluid: they tend to form and dissolve organically around a specifictask;
• High turnover since FLOSS contributors are often volunteers;
• FLOSS communities are generally constituted by a set of core developers anda more loosely coupled group of contributors that support the developmentby reporting issues, submitting patches or contributing with documentation(core-periphery structure).
Open Source communities have an implicit diverse nature as they are usually com-posed by a variety of contributors ranging from volunteers to developers sponsored
15

2. State of the art
by companies and all of them have different demographic characteristics, knowl-edge, personalities, skills, cultures and educations. Open Source Software projectscan benefit from their intrinsic diversity since it stimulates creativity, diversity ofideas and problem solving skills coming from different background and knowledge,therefore increasing global projects productivity [29]. On the other hand if diver-sity increases but it is not managed, it may create conflicts within the developmentteam negatively effecting the team’s cohesiveness and its performance, due to greaterperceived differences in values, ideas, norms and communication style. [23].
Software licenses define under which conditions software can be used, copied,modified or redistributed without incurring in legal problems. As proprietary li-censing tend to restrict the possible ways in which a software will be used, OpenSource licenses tend to limit the restrictions that can be associated to a software,to ensure development freedom and source code re-distribution. Usually the licenseunder which a project is released can be explicated in three different ways:
1. Adding a licensing comment on top of each file of the project. This approachallows a fine-grained license definition;
2. A specific file specifies the license under which the software is released;
3. The software license is expressed within the project’s official website.
Several FLOSS licenses exist, from highly restrictive (e.g., GPL) to more flexible(e.g., MIT), but their main goal is to promote and enable the right to fork, copy,modify and redistribute the program source code. As it evolves a project can changeits license to better meet the requirements and needs of the development communityor of external actors interested in the project. Vendome et al. [30] highlighted thatthe initial software license is influenced by the communities to which core developersare already contributing and that external actors do not have impact in this choice.As projects grow their current licenses are heavily affected by their need to becommercially reused and, to accomplish this purpose, Open Source projects tendto migrate toward less restrictive and more permissive licenses. Licenses do notonly define how software code source can be reused but they might also affect othercomponents of the projects where the FLOSS code will be used. For example GPLlicense requires that all the source code, in which a GPL licensed component isused, has to be released under the GPL license. More flexible licenses (e.g., MITlicense) do not require this condition and allow the use of FLOSS code under anyother license, including commercial use. This license dependency was found evenby Vendome et al. [30] who stated that a license change of a sub-component mightstart a chain reaction that will influence the final project’s license or will cause thedrop of the sub-component usage due to incompatibilities between licenses.
The number of commercial driven Open Source Projects is increasing year afteryear, FLOSS development has long become an important commercial activity and
16

2.4. Developer Social Networks
the Open Source Software ecosystem is full of successful projects which are com-pletely driven by commercial companies (e.g., Android) or which have developerssponsored by commercial companies (e.g., Linux). When a voluntary-based OpenSource Software project become promising, commercial companies may be inter-ested in participating in its development, to adequate the software to their needs.It is possible to consider the ratio of volunteer to paid work as an indicator for thehealth of FLOSS projects and it can aid project leaders in managing their commu-nity [8]. Riehle et al. [8] in 2014 discovered that even if Open Source Software hasbeen growing near-exponentially, its global ratio of voluntary and paid developmentis almost constant. A possible explanation is that for every project which increasesits economic significance receiving sponsored development, a new totally voluntarydriven project is started. Voluntary FLOSS developers, in contrast to commercialsoftware developers, usually experiment a high degree of development and organi-sational freedom with respect to the possible ways through which contribute to theproject and how to organize themselves and their tasks.
2.4 Developer Social Networks
In a software development community every interaction and relationship betweendevelopers can be modelled through a self-organised network, which can be consid-ered as a latent developer Social Network [31]. In such developer Social Network,considering the case of FLOSS projects, developers and their relationships are sub-jects to continuous variations and changes as the set of active developers and theiractivities change over time.
A Developer Social Networks (DSN) can be modelled through the use of nodes,that represent actors, and edges, that represent relationships between different ac-tors (or groups). A Social Network and its actors have two fundamental properties:connection and distance [32]. Connectivity can be measured using density, size, cen-trality and reachability of the Social Network. As a member of the Social Networkis more connected then he or she is exposed to more information, can be consideredmore influential in the community and may be easily influenced by others. Distancein a Social Network represents the closeness of two actors within the network andmay be a useful indicator to identify macro-properties differences, like diffusion andhomogeneity. Distance influences the information diffusion time across the commu-nity and it can be measured using walks and paths. Connections and distances arefundamental characteristics to enable the identification of sub-communities withina Social Network, which are defined as “subsets of actors among whom there arerelatively strong, direct, intense, frequent, or positive ties” [32].
Since Free/Libre Open Source Software communities number increase daily, theamount of open and accessible information about FLOSS development grow expo-
17

2. State of the art
nentially. Issue tracking systems [33], mailing lists [34] and code repository histo-ries [35] of FLOSS projects can be easily and freely mined by researchers to analysedefects, communication and distributed collaboration habits of Open Source Soft-ware developers. The existence of FLOSS project is enabled by Internet that allowscommunication and coordination (C&C) activities between developers. Such activi-ties are typically public and accessible to anyone and this allows researchers to trackand mine coordination and communication activities and study them through theusage of Developer Social Networks, in contrast to industrial closed-source projectswhere C&C activities are predominantly direct and informal [34].
FLOSS projects are extremely interesting for empirical software engineeringstudies because they imply a distributed development occurring at a global scale andall the information related to a project (communications, code modifications, bugs,etc.) are available on-line (mailing lists, code repositories, bug tracking systems,etc.), granting the possibility of mining them. To take advantage of this enormousquantity of available data and to be able to mine and make sense of the organisa-tional, social, technical and communicational aspects of a FLOSS project, researchersshould re-factor the retrieved information into a structured and analysable form.During last decade the main technique used to model technical and social aspectsof software developers to enable the possibility of studying how people collaborateand organize their work in a global software development environment is the SocialNetwork approach.
Public mailing lists are the classic channel used in FLOSS projects to performcommunication and coordination activities and their archives (usually available on-line) in conjunction with VCS and other on-line development artefacts (e.g., bugtracking systems) allow researchers to create a developer Social Networks able tomodel and understand communication, coordination and collaboration practices andpatterns in FLOSS projects.
During the last decade researchers have generated Developer Networks from ev-ery possible development source of information to enable the usage of Social NetworkAnalysis methodologies and metrics. A Social Network can be created from codesource history and mostly from any other kind of open and accessible data sourceused to support the software development (e.g., bug reporting [31], VCS [36] andmailing lists [34]). As an example, to conduct a knowledge-centric software engi-neering empirical study, the mailing list of a project should be considered: everymember whom sent a message on the mailing list is considered a node and if a personA received a reply to one of his messages from another member B, then it exists anedge connecting A and B.
Conway law states that the project structure is strongly correlated to the or-ganisational structure of the project, thus understanding the Developer Network isfundamental to estimate the quality and efficiency of software development activ-
18

2.4. Developer Social Networks
ities. Social Network Analysis is based on individuals and how these individualsare related between them through relationships. In software engineering these rela-tionships can be extracted mining software development artefacts, allowing to studyall the possible ways in which people interact through all the available channelsused to develop software. Empirical software engineering studies often apply SNAmethodologies because they offer a solid systematic and quantitative framework.
FLOSS projects, due their intrinsic nature of being developed mainly by vol-untary developers without a monetary retribution, can be affected by a sentimentof mistrust from companies that use them in their commercial activity. To avoidthis phenomenon, in 2002, Madey et al. used a Social Networks approach to modelFLOSS communities because “a better understanding of how the OSS communityfunctions may help IT planners make more informed decisions and develop moreeffective strategies for using OSS software” [35].
One of the first attempt to use Social Network Analysis to analyse on-line com-munities was conducted in 2004 by Lin and Chen [32]. In their research study socialties, information flows, information and resource acquisition and coalitions creationwere considered with the scope of accessing team collaborations, evaluate the per-formance of the system and enable the identification of relationships and interactionpatterns within the community.
A socio-technical Developer Network can be created from socio-technical connec-tions found exploiting the collaboration and communication channels and it can beanalysed using SNA metrics. Social Network Analysis metrics calculated on socio-technical Developer Networks, created from connections observed in developmentartefacts, were proved to be representative of actual and real socio-technical rela-tionships present within the software development communities [37]. Nia et al. [38]demonstrated that the effect of paths with broken information flow (consecutiveedges which are out of temporal order) on the centrality measure of nodes withinthe network and the effect of missing links on such measures do not invalidate theSocial Network Analysis metrics validity, but such metrics are stable with respectto such phenomenons. Betweenness centrality and clustering coefficient are stablein presence of a large number of missing links and this this essentially means thatmost of the activity in Developer Social Networks arise from few participants, thusit is sufficient to look at the 10% of developers [38].
In software engineering with the term Version Control (VC), it is considered anypractice devoted to track and control changes to any possible project element: sourcecode, documentation or configuration files. Since FLOSS development is intrinsi-cally distributed and anybody can contribute modifying the source code, VersionControl Systems (VCS) are extremely useful as they can track ownership of changesto the project source code. There are two main VCS typologies: centralized anddistributed. Centralized VCS have a single central authoritative repository on which
19

2. State of the art
developers can synchronize their code-base; file locking and version merging are usedto enable different developers to operate on the same file at the same time. Somefamous Centralized VCS are: Concurrent Versions System (CVS) and Subversion(SVN). Opposed to the client-server approach of Centralized VCS, Distributed VCSimplement a peer-to-peer approach as they don’t have any central authoritativerepository but the source code can be checkout and committed into any existingrepository with a merge operation. Some famous Distributed VCS are: Git, Mercu-rial and Bazaar. Brindescu et al. [39] conducted an empirical software engineeringstudy to compare the impact of Centralized VCS and Distributed VCS on softwarechanges. They discovered that Distributed VCS have a smaller commit size in termsof lines of code and that hybrid repositories (repositories that migrated from a cen-tralized to a distributed VCS) do not show any difference between the size of commitsperformed before and after the switch of paradigm due to commit policies formed inthe team while using the centralized approach. In the past decade Distributed VCSsaw an increase in popularity with respect to Centralized VCS and many popularFLOSS projects migrated from a centralized to a Distributed VCS. Distributed VCShave the following main differences respect to the centralized approach:
1. Only working copies exist because a reference copy of the code does not existby default;
2. Every working copy is a remote backup of the change-history of the entireproject;
3. It is possible to work without the need of being connected to a network;
4. Version Control operations are fast because no communication is needed;
5. Communications are necessary only when sharing a change between peers;
6. A web-of-trust approach can be used to merge changes coming from differentrepositories; this enables new work-flows that are impossible in CentralizedVCS (e.g., intermediate roles can be responsible for integrating new changesproposed by developers);
7. Allow non-core developers (the ones who do not have write permissions on therepository) to contribute to the source code;
8. Authorship of changes of non-core developers is kept in historical records;
9. Individual changed lines of a file can be committed instead sending the wholefile again;
10. Initial repository cloning is slower than Centralized check-out since all branchesand change history are copied.
20

2.4. Developer Social Networks
Version Control Systems (VCS) have been used to construct developer collaborationnetworks since the introduction of Social Networks and Social Network Analysis inempirical software engineering studies, due to their intrinsic capability of capturinginter-relationships among large software project components. Different VCS andVCS typologies will provide different grain level information to construct the collab-oration network. For example Centralized VCS will provide only information aboutthe committer, instead Distributed VCS will usually provide even information aboutthe author of the commit. Since the information volume within a VCS can reachan incredible dimension, this can be considered a Big Data research area. Dataretrieved from VCS is unusable without techniques to extract coherent informationfrom this amount of data and highlight relevant trends and interesting aspects of asoftware project.
The first empirical software engineering research that considered VCS to gener-ate a collaboration network was conducted by Lopez-Fernandez et al. in 2004 [36]and it proposed a set of Social Network Analysis methodologies to characterise theevolution and internal structure of FLOSS projects. They proposed to consider VCScommitters or VCS directories (considered software modules) as nodes and the com-mon commits as weighted edges between two nodes. In 2011 Jermakovics et al. [40]improved the methodology proposed by Lopez-Fernandez and allowed the generationof a more detailed and cleaner collaboration network, considering a file level graininstead of directories level to detect common commits (software modules). Devel-oper networks generated using the methodologies proposed by Lopez-Fernandez orJermakovics can be too dense and inefficient to obtain useful results during devel-oper collaboration analysis. In 2015 Joblin et al. [41] addressed this problem andintroduced a collaboration network generation methodology that consider the codestructure and detect when developers collaborated on the same function of a file,enabling a function level grain collaboration analysis.
After 2004 every other possible development artefact was considered as a datasource and used by researchers to create Developer Networks. Bird et al. [34] in2006 were the first to exploit mailing list archives to construct a Developer SocialNetwork of community members participating in a project. Always in 2006 Howisonet al. [33] created for the first time in software engineering history a Developer SocialNetwork from a bug reporting system. Both mailing lists and bug-tracking systemsof FLOSS projects enable to explore communication and coordination activities ofall the participants of a community and do not limiting the analysis just to softwaredevelopers, as in the case of software code source (VCS) analysis, because mailinglists and bug-tracking systems contain many social interactions and bug reportingactivities performed by users and people not necessarily directly involved in thesoftware development (e.g., report bugs but do not provide patches).
Hong at al. [31] considered how and to what extreme Developer Social Networks
21

2. State of the art
can be analysed using General Social Networks (GSN) techniques, studied the evolu-tion of Developer Social Networks in time and how the DSN topological structurescan be influenced by project events (e.g., release, turnover). General Social Net-works (e.g., Facebook, Twitter) as Developer Social Networks are founded on thefreedom of participation but GSN offer more freedom of topics, while Developer So-cial Networks are mainly focused only on project development activities. DeveloperSocial Networks are latent and not instantly usable, so they have to be extracted andconstructed from information rich artefacts that support software development (e.g.VCS, mailing lists). Some other interesting aspects which characterise DeveloperSocial Networks are [31]:
• DSN are usually characterised by a small portion of developers with high degree(core developers) and many developers with low degree, thus Developer SocialNetworks can be considered as scale-free networks;
• In DSN most pairs of developers can communicate or are connected betweeneach other through an exiguous number of hops in the network (“small world”);
• DSN are highly modular, thus they do have a significant community structure,and modularity tend to increase over time.
Social Network Analysis methodologies and metrics were used in many empiricalsoftware engineering studies to implement models capable of predicting faults [1],failures [42], and vulnerabilities [43]. Nan and Kumar [44] took advantage of SocialNetworks Analysis to examine the joint effect of developer team structure and soft-ware architecture in Open Source Software and discovered that they moderate eachother’s effect on software development performance. Valetto et al. [45] applied SocialNetworks theories to Developer Social Networks and defined a useful methodology tocompute socio-technical congruence, which is based on the direct comparison of thestructure of an organization with the project code source. In 2014 Jorge Colazo usedSocial Networks Analysis to analyse how collaboration DSNs change when collabo-rating teams become temporally dispersed and he discovered that “the collaborationstructure networks of more temporally dispersed teams are sparser and more cen-tralized, and these associations are stronger in those teams exhibiting higher relativeperformance” [46].
2.5 Technical and Social Debt
Since socio-technical decisions influence both the technical and social aspect ofthe software development environment, non-optimal or uninformed socio-technicaldecisions may generate additional costs to the technical or social area, or even both.Due to the nature of these additional costs, they can be considered as a debit because
22

2.5. Technical and Social Debt
their resolution can be postponed in time since usually these non-optimal decisionsare not easily detectable and visible.
Technical debt (TD) is a software engineering metaphor defined in 1992 by Cun-ningham [47] to describe the internal tasks that some decisions imply but that arenot performed. If these tasks are not completed, the debt is not repaid and it willcontinue to accumulate interests, creating future problems and making it harder toimplement changes in the future. A classical example of technical debt generated bya development team is when a decision that simplify a short term goal is taken butit has a great potential to negatively impact the development activity on the longterm.
When a change in the source-code of a project is performed, it is often necessaryto execute some other coordinated changes to other software components (e.g., othercode modules, documentation) due to their inter-dependencies or due to developmentpolicies. Whenever this situation happen but the change associated to the softwaremodification is delayed, technical debt arises and it must be paid off sooner or laterin the future to avoid the failure of the software development.
Kruchten et al. redefined Technical Debt as “the invisible result of past deci-sions about software that negatively affect its future” [4], not limiting the conceptto situations that imply a cost. Technical Debt is generated by invisible aspects ofsoftware aging and its evolution or it can be caused by external events. Some techni-cal debt causes are: technological obsolescence, development environment changes,rapid commercial success and advent of new and better technologies.
During the past decade, technical debt was deeply studied and analysed alongevery software development life cycle process. In 2014 Alves et al. fathomed allthe available literature related to Technical Debt and classified all its forms in thefollowing ontology [48]:
• Architecture debt: issues in the project’s architecture (e.g., violation of modu-larity) that affect some architectural requirements (e.g., performance, robust-ness). It usually cannot be repaid only through source code interventions butit implies more extensive corrective development activities;
• Build debt: issues that make task building more time and processing consumingand harder than the necessary (e.g., unnecessary code to the customer);
• Code debt: bad coding practices in the source code that impact on its main-tainability (e.g., reducing its legibility);
• Defect debt: known software defects whose fix are deferred to the future dueto different priorities or limited resources;
• Design debt: bad design practices that violate the principles of good object-oriented design;
23

2. State of the art
• Documentation debt: missing, inadequate or incomplete project documenta-tion;
• Infrastructure debt: software organization issues that can delay or hinter somedevelopment activities (e.g., infrastructure fix);
• People debt: people issues that can delay or hinder some development activities(e.g., new knowledge brokers);
• Processes debt: issues caused by inefficient processes;
• Requirement debt: trade-off between the requirements that a development teamhas to implement and how they implement them (e.g., requirements implementfor a limited number of cases);
• Service debt: issues introduced by an inefficient web service substitution;
• Test automation debt: unnecessary work done by automated tests of previouslydeveloped functionality to support continuous integration and faster develop-ment cycles;
• Test debt: issues in testing activities that influence testing qualities (e.g. lowcode coverage).
Brown et al. defined the concept of “anti-pattern” as a “commonly occurring solutionthat will always generate negative consequences when it is applied to a recurringproblem” [49], thus an anti-pattern is a pattern which implies negative connotations.
Within the Technical Debt research area, Fowler [50] defined the term “CodeSmell” to refer to code patterns that can be symptoms of poor design and imple-mentation choices. Code smells are usually considered as symptoms of the presenceof anti-patterns and thus are mined to detect them. Since Code Smells can be char-acterised by suboptimal development choices or they can be associated to some poorrecurring design and implementation decisions, they can diminish code comprehen-sion and increase change and fault proneness of a project. Code Smells can be usedas indicators of the presence of accumulated Technical Debt [51].
Tamburri et al. analysed another type of debt in which a software developmentmay incur, generated by non-optimal socio-technical decisions. This “Social Debt”is correlated to the social components of an organisation and it was defined as the“unforeseen project cost connected to a suboptimal development community” [3].Social Debt was later redefined in 2015 by the same authors as the “cumulative andincreasing cost in the current state of things, connected to invisible and negativeeffects within a development community” [6].
While decisions in Technical Debt are about technologies and their applications,decisions that cause Social Debt are about social interactions and people themselves.
24

2.5. Technical and Social Debt
Social Debt shares many aspects with Technical Debt since they have many simi-larities and common points. Social Debt, as well as Technical Debt, can be usedas an indicator of the development process quality, considered as the result of pastaccumulated decisions [6]. Tamburri et al. highlighted this relation between thetwo diametrically opposite typologies of debt paraphrasing the Cunningham’s defi-nition of technical debt and describing Social Debt as “not quite right developmentcommunity - which we postpone making right” [6].
Global Software development is characterised by many socio-technical decisions(e.g., outsourcing, organisational structure, communications organization) that donot only influence the technical area but even the social one, influencing how peopleinteract, communicate and organize themselves. Since socio-technical decisions caninfluence and modify people’s social behaviours, in addition to Technical Debt, theymay produce Social Debt due to non-optimal socio-technical decisions. Social andTechnical Debt can generate delays and addictions costs within the developmentprocess or within the development community, that may increase over time and beinvisible or intentionally delayed due to the intrinsic nature of social and technicaldebt.
De Farias Junior et al. [52] conducted a study on communication related risksin distributed software development that can be considered a Social Debt studybecause it analyses some organisational issues created by a non-optimal usage ofcommunications within a software company. They considered as communicationrelated risks: issues related to physical and temporal distance, trust, difference ofcultural and linguistic orientations between different teams. To avoid or mitigatethe listed communication related risks within a distributed software development,Farias Junior et al. proposed these recommendations:
• encourage frequent communication: it reduces misunderstandings created bycultural and linguistic differences and it increases distributed teams cohesionand trust, which can generate an increment informal communications betweendevelopers;
• establish an appropriate communication infrastructure: it addresses uncer-tainty and unpredictability of the communications and it reduces the negativeeffect of the absence of “face-to-face” meeting;
• promote socialisation: it increases cohesion, inter-personal relationships be-tween different team members, communication effectiveness and informal com-munication;
• encourage effective communication;
• promote visits among distributed sites: it increases trust and it constitutes newinterpersonal relationships with the creation of new informal communications;
25

2. State of the art
• promote informal communication: it diminishes misunderstandings, it createstrust and facilitates knowledge sharing;
• promote cultural awareness and adopt group-ware applications.
In Social Debt studies, mirroring the Code Smell concept, it is possible to define“Community Smells” as social related anti-patterns useful to understand negativecommunity characteristics and trends. Community Smells are formally defined as“socio-technical anti-patterns that may appear normal but in fact reflect unlikeablecommunity characteristics” [6], thus Community Smells identify anti-social organi-sational behaviours within a community. An example of Social Debt is when devel-opers refuse or delay information sharing for any reason. Community Smells are aset of social and organisational circumstances with implicit causal relations which donot constitute a problem if considered alone but that if repeated over time, they maycause Social Debt in the form of delays, mistrust, uninformed and miscommunicatedarchitectural decision-making.
Social Debt, as its technical counterpart, can be paid back adopting specificsocio-technical decisions with the purpose of mitigating a precise Social Debt as-pect, possibly detected by a Community Smell. Tamburri et al. [6] found some“mitigations” that were proven to have a beneficial effect on Social Debt reductionand discovered that some socio-technical decisions made to extinguish contractedSocial Debt eventually worsen the situation or did not yield positive outcomes (40%of socio-technical mitigations considered). Mitigations addressed to resolve Com-munity Smells and to pay back the related Social Debt are called “deodorants”.
Architectural decisions were considered in both Technical Debt [53] and SocialDebt [7] studies and in both cases they are highlighted as one of the most im-portant cause of debt generation in professional software environments. Ernst etal. [53] studied the relation between Technical Debt and architectural decisions andthey concluded that architectural issues are the most relevant cause of technicaldebt generation and that to pay back such generated Technical Debt is hard be-cause usually the incriminated architectural decisions were taken many years in thepast. Tamburri et al. [7] further investigated architectural decisions with a SocialDebt perspective, identifying architectural smells and proposing a possible metric tomeasure potential Social Debt contracted in software architecture processes. Theiridentification methodology, based of Social Network Analysis theories, computes thecommunicability of an architectural design decision to identify architectural smellswith the purpose of avoiding or diminish the related side effects (e.g., architectureerosion, lack of vision, mistrust).
Referring to Conway’s law and its related studies, it is possible to re-conductTechnical Debt to not-optimal development processes decisions and Social Debt canbe re-conducted to not-optimal organisational processes. Since socio-technical deci-
26

2.5. Technical and Social Debt
sions are indirectly correlated to Social Debt [6] and that socio-technical congruencecan be considered an agreement indicator to Conway’s law, socio-technical congru-ence can be considered as a metric to identify possible Social Debt present withina community because it quantifies the similarity of social and technical processeswhenever a communication need is present.
Both Social or Technical Debt can depend from the context evolution because itis possible that the original decision which created it, was correct but as time passedthe context changed and such decision was not positive in retrospect.
In analogy to the monetary debt, Technical or Social Debt in software engineeringis not necessary a bad thing if it is known, accepted and controlled. For examplesometimes Technical Debt is necessary to move forward the project development.Debt, similarly to congruence [16], may imply trade-offs because resolving the debtin a particular level may create another debt in another level. Potdat et al. [54]discovered that self-admitted Technical Debt in Open Software development is acommon phenomenon (from 2.4% to 31% of project files is affected), that developerswith higher experience usually tend to introduce most of the self-admitted TechnicalDebt and that in the optimal case only slightly more than half of the introduceddebt is paid off.
In their Technical Debt ontology published in 2014, Alves et al. [48] identified aTechnical Debt category called “people debt” that can be associated to the conceptof Social Debt. They define people debt as the debt associated to people issues,in the context of software organization, which may delay or hinder developmentactivities and they provide as an example the case of a concentration of expertiselimited to few people as a consequence of delayed training and/or hiring.
Another study that can be considered belonging to the Social Debt research areais the one conducted in 2014 by Zhou et al. [55], concerning the quantification ofglobal team performance and profitability, because it investigated the effects of somesocial and organisational structure properties (e.g., temporal dispersion, languagedifference, skilled workers turnover). Zhou et al. state that “the right organisationalstructure is required to achieve benefits of lower labour costs”, acknowledging thefact that “combined effects of the [social and organisational] factors could lead toreduced profitability” and concluded, in complete accord to Social Debt definition,that “in some extreme cases the cumulative effects of external factors could outweighthe advantage of lower labour rates for globally outsourced work”.
In “Why good developers write bad code”, published in 2015, Lavallée et al [56]analysed the relationships between some organisational factors and their impacton developers’ working conditions and performances. Lavallée et al. identified thefollowing socio-technical organisational issues that may compromise the softwarequality and its success [56]:
• Documenting complexity: presence of large, old and poor documentation that
27

2. State of the art
causes the unwanted situation in which unimplemented requirements are dis-covered at the end of software development. This issue is related to knowledgemanagement and support maintenance activity transmissions;
• Internal dependencies: presence of many inter-dependent modules that createconflicts between projects on the deployment schedule;
• External dependencies: changes to third-party modules result in costly delays;
• Cloud storage: third-parties do not support vulnerability testing;
• Organically grown processes: software defects are documented but developersare not aware of them because information exchange is hindered by frontiersbetween processes. This issue is caused by the creation of “islands of for-mality”, which are zones where different processes have limited interactionsbetween them;
• Budget protection: due to the external dependencies issue an “home-madepatch” approach, through the creation of wrappers, is preferred to avoid ad-ditional third-party costs;
• Scope protection: teams try to deny every other team’s change requests toprotect their project’s scope;
• Organisational polities: issues that arise when the wrong or uninformed personis contacted;
• Human resource planning (truck number [57]): development is performed insilos and there is a high possibility of project knowledge loss due to developerturnover or delays due to developer’s unavailability;
• Undue pressure: developers are threatened to deliver in time by managers andsenior developers.
Comparing this research results to Tamburri et al. researches about Social Debt, itevident that there are many common findings and shared results, especially consider-ing the more “human-related” socio-technical issues: “organically grown processes”,“scope protection” “organisational polities” and “human resource planning”. Laval-lée et al. study, conducted within a large commercial company, can be considered inevery aspect a Social Debt related research because the authors conclude their workstating that software quality can be negatively affected by decisions taken under cer-tain organisational conditions and assert that “the design flaws introduced becauseof the organisational issues presented here will no doubt come back to haunt” [56],which it is a paraphrase of the Social Debt definition proposed by Tamburri et al. [6].
28
2.6. Motivational research
2.6 Motivational research
The first fundamental empirical software engineering research paper that canbe considered as a motivational research for this master thesis was conducted byPalomba et al. and it was named “Mining Version Histories for Detecting CodeSmells” [51]. During the definition and execution of our research we were inspiredby Palomba et al. work and the two empirical researches can be considered similarwith respect to their empirical study structure, research question approach andresearch context. But they had diametrically opposed targets, because Palombaet al. research addressed Technical Debt while ours is founded on Social Debt.Within their research, Palomba and his collaborators, proposed an approach calledHistorical Information for Smell deTection (HIST) that is capable of exploiting aproject’s change historical information, mined from versioning systems, to detectthe presence of Code Smells through heuristics computations. The main innovationof this empirical software engineering research was the introduction of the temporalfactor within Code Smell identification processes, basing such process on revisionhistory analysis rather then the exclusively consideration of structural informationof a project’s source code. Paloma et al. did not limit their research to Code Smellsdetection but further investigated if Code Smells, considered within their study,were actually perceived by Open Source Software developers as poor design andimplementation choices. Some of the research decisions and methodologies that weadopted within this master thesis can find their motivation and empirical validitythrough their assimilations and parallelisms with their study. The following list ofcharacteristics constitutes the minimum common denominator of the two researches:
1. Usage of historical information to detect debt related patterns;
2. Capture developer perceptions with respect to the importance and validity ofidentified patterns, through the execution of a survey;
3. Operationalization of identified hazard situations;
4. Patterns identification is executed at a fine-grained source code level (methodlevel);
5. Patterns identification is considered in different temporal instances of a project’slife cycle and it not limited to the last version of the source code;
6. Research’s context is focused on Open Source Software projects.
An empirical software engineering research paper that constituted a fundamentalcontribution to the Social Debt research area and that can be considered as anothermotivational study for this master thesis was conducted by Tamburri et al. and it
29
2. State of the art
was named “Social Debt in software engineering: insights from industry” [6]. Tam-burri and his collaborators laid the theoretical foundations on which this masterthesis was built, since they improved the Social Debt definition, added backgroundto its insurgence’s conditions, highlighted possible mitigations to Social Debt andprovided the precious contribution of defining several Community Smells that wereproven to be capable of detecting the presence of Social Debt. The operationalisationand characterisation of Community Smells within a FLOSS software developmentcommunity, that constitute a fundamental basic building block of our study, werebased on Community Smells identified by their software engineering research. Tam-burri et al. analysed correlations between a set of socio-organisational circumstancesand the raise of additional costs in software processes within a large industrial soft-ware case study. They summarized the identified Social Debt circumstances in aframework, relating them with their causes, consequences, conditions, contexts, co-variances, contingents, anti-patterns (“Community Smells”) and they suggest somepossible techniques useful to avoid the insurgency of such negative circumstances.In their research Tamburri et al. were able to capture some Social Debt character-istics [6]:
• Socio-technical decisions and Social Debt are indirectly connected;
• Social Debt is an emergent property of the development community itself and,despite Technical Debt, it cannot be ascribed to any particular software arte-fact or operation in the development process but, at the same time, SocialDebt has a strong effect on many different software artefacts;
• Social anti-patterns (i.e., Community Smells) can be considered as indicatorsof the emergence of Social Debt within a community;
• Social Network Analysis methodologies can be used to identify CommunitySmells and quantify Social Debt costs;
• Social Debt can generate Technical Debt;
• Specific socio-technical decisions (“mitigations”) can be implemented to payback totally or partially the detected Social Debt.
It is possible to classify Community Smells within three different classes: smellsrelated to the community structure and its related properties (e.g, community for-mality), smells related to the community context (e.g., political boundaries) andsmells related to the community members’ interactions (e.g., socio-technical rela-tionships). In their industrial case study, Tamburri et al., identified and classifiednine different Community Smells [6]:
30

2.6. Motivational research
1. Organisational Silo Effect: this Community Smell occurs when it is presenta too high decoupling between developers and their related development tasks.This occurrence causes low mutual awareness, low socio-technical congruenceand lack of communications and cooperation in checking task dependencieswithin the community. An organisational silo is present in the developmentcommunity whenever an isolated subgroup of loosely dependent developmentpartners waste resources (e.g., time) or duplicate resources over the develop-ment life-cycle. Another possible side effect of this Community Smell can bethe establishment of a “tunnel vision” due to the lack of cooperation and col-laboration, which may imply a lack of creativity within the development teamand eventually developers will make architectural decisions without the neces-sary authority and knowledge. A mitigation to the Organisational Silo EffectCommunity Smell is the institution of a “social wiki” within the developmentcommunity, combining developers profiles with the artefacts they are workingon and the related documentation.
2. Black-cloud Effect: this Community Smell occurs when two concurrent cir-cumstances take place together: lack of people able to cover the experience orknowledge gap between two software products and the lack of official and peri-odic knowledge sharing opportunities (e.g., daily stand-ups). Whenever thosetwo circumstances are verified, every knowledge exchange initiative can cre-ate a confusing communication overload (“black-cloud”) with back-and-forthemails which obfuscate reality. This Community Smells is caused by the ab-sence of officially defined sharing protocols, lack of boundary spanners (indi-viduals whom link internal team network to other teams) and presence of notefficient information filtering protocols. The main side effects of this Commu-nity Smell are the creation of mistrust between developers, the possibility ofinformation obfuscation and the rise of egoistic behaviours (e.g., developerstake decisions even if they do not have decisional authority). As for the Or-ganisational Silo Effect Community Smell, the adoption of a “social wiki” canmitigate the negative effects of the Black-cloud Effect Community Smell.
3. Prima-donnas Effect: this Community Smell occurs whenever a team ofdevelopers is unreceptive to change its internal processes and/or characteris-tics, or it is unwilling to be influenced by external team members through theforms of collaborations and/or communications. This selfish and condescend-ing team behaviour can create serious isolation problems and tensions betweenthe community and the “prima-donnas” team, which is unable to welcome sup-port from other development partners. Prima-donnas Effect Community Smellcan raise due to stagnant collaboration within the community, due to ineffi-cient structural innovation or due to organisational inertia. The consequences
31
2. State of the art
of the lack of collaboration and communication can be worsened by organi-sational changes because they create fear in the prima-donnas teams and in-crease their egoistical behaviours. A possible mitigation for the Prima-donnasEffect Community Smell is the institution of “culture conveyors”, which al-low an harmonization process of different organisational cultures through thepromotion of developers coming from different communities to the role of ar-chitects. Another mitigation technique is the adoption of a “community-basedcontingency planning” in which managers decide to make technical and socio-technical decisions together and use the learning community as a device togenerate contingency plans, if some decisions lead to undesirable outcomes. Asfor the Organisational Silo Effect and Black-cloud Effect Community Smells,the adoption of a “social wiki” can mitigate the negative effects of the Prima-donnas Effect Community Smell.
4. Leftover-techie Effect: this Community Smell is caused by an increasingisolation of the maintenance and the help-desk operations from the opera-tive people, with a related feeling of abandonment by the technicians. Themain side effect of this Community Smell are mistrust and the emergence of asharing villainy behaviour, related to knowledge and status awareness. A mit-igation capable of reducing Social Debt connected to this Community Smell isthe “full-circle” and it consists in the creation of a dedicated communicationline (e.g., instant-messaging) between key developers, managers and operationtechnicians.
5. Sharing Villainy: this Community Smell is caused by the absence of expe-rience sharing initiative and high-quality knowledge exchange activities (e.g.,face-to-face meetings), in addition to a shared mindset that considers knowl-edge interactions between developers as wasting time activities rather thanpositive opportunities. The main side effect of the Sharing Villainy Com-munity Smell is the limitation to developers’ propensity to share knowledgeand meaningful experiences, to the extreme of sharing outdated, wrong or un-confirmed information. A possible mitigation technique for this CommunitySmell, as for the Prima-donnas Effect Community Smell, is the creation of“culture conveyors”. As for the Organisational Silo Effect, Black-cloud Effectand Prima-donnas Effect Community Smells, the adoption of a “social wiki”can mitigate the negative effects of the Sharing Villainy Community Smell.
6. Organisational Skirmish: this Community Smells occurs whenever opera-tions and development units are misaligned in their organisational culture (e.g.,organisational layout and properties), in their communication habits and intheir expertise levels. These misalignments cause severe managerial issues anddelays.
32

2.6. Motivational research
7. Architecture Hood Effect: this Community Smell occurs whenever decision-makers are not well integrated and geographically distant from other devel-opers and operators of the community and their decisions are taken using asoftware architects board that makes decisions’ responsibility and logic noteasily discernible. The side effects of this Community Smell are the inabilityto identify decision-maker responsibilities and the unwillingness of developersto accept decisions with a related uncooperative behaviour within the develop-ment community. Architecture-hood Community Smell can be mitigated bythe socio-technical decision of adopting “stand-up voting” in an anonymousform to accept decisions at the end of fixed daily stand-ups.
8. Solution Defiance: this Community Smell occurs when the developmentcommunity divides itself into overly similar subgroups with different levelsof cultural and experience backgrounds; those homophile subgroups dividethemselves into smaller factions with opposite and conflicting opinions towardsome socio-technical decisions that should be taken. The side effects of thisCommunity Smell are delays, uncooperative behaviours, decisions ignoringand “organisational rebellion” due to the unwillingness of developers to take ashared decision within different factions until the very last possible moment.A socio-technical decision to mitigate the effect of solution defiance, as forthe Prima-donnas Effect Community Smell, is the adoption of a “community-based contingency planning”. As for the Organisational Silo Effect, Black-cloud Effect, Prima-donnas Effect and Sharing Villainy Community Smells,the adoption of a “social wiki” can mitigate the negative effects of the SolutionDefiance Community Smell.
9. Radio Silence: this Community Smell occurs when the organisational struc-ture is highly formal, complex and constituted by regular procedures whichcause changes to be delayed and people time to be wasted due to requiredformal actions and filters hiding necessary information. The main side effectof this Community Smell is the massive delay in decision making processesdue to people unavailability or due to further information needs. A mitiga-tion able to reduce almost completely the negative effects of the Radio SilenceCommunity Smell is the creation of a “learning community” that involves allthe developers and operators. This socio-technical decision can reduce delaysin a direct way with the creation of strong organisational and social relation-ships between developers and in an indirect way, enabling a passive knowledgesharing channel.
33

2. State of the art
34

Chapter 3
Problem analysis
This chapter summarises the fundamental aspects of this master thesis and itprovides an overview of how our empirical software engineering research was defined,characterised and executed.
Section 3.1 presents the definitions of a set of key terminologies that should bekept in mind while reading this work. The motivations at the root of this mas-ter thesis and the research questions that were addressed within the execution ofthis empirical software engineering study are described in Section 3.2. The orig-inal contributions constituting the basic building blocks of this master thesis arepresented in Section 3.3, together with their characteristics, usefulness and pur-poses. Finally, Section 3.4 explores the context of the dataset considered withinthis research, motivating and providing informations about the set of Open SourceSoftware development communities considered in the analysis.
3.1 Definitions
This section provides definitions of several important and fundamental termi-nologies used within this master thesis.
• Factor: element, circumstance or influence which contribute to produce aresult;
• Socio-technical factors: elements, circumstances or influences which con-tribute to produce a result that has both social and technological aspects;
• Quality factors: elements, circumstances or influences which contribute toincrease or decrease the well-being and quality of a software development com-munity;
• Social Debt: Unforeseen project costs connected to a “suboptimal” develop-ment community [3];
35

3. Problem analysis
• Community Smells: organisational and social patterns that produce nega-tive effects on the long run and lead eventually to Social Debt [6]. Therefore,Community Smells represent a risk correlated to the potential presence of So-cial Debt;
• Identification pattern: model capable of identifying the occurrence of aspecific phenomenon using Social Network methodologies;
• Developer Social Network (DSN): social network model of a softwaredevelopment community, where developers are represented by the means ofnodes and links between nodes represent developer relationships;
• Communication DSN: particular case of Developer Social Network, in whichnodes represent community members who communicate on the project’s devel-opment mailing list and two nodes are connected through a link if and only if,one of the two members replied to a previously sent e-mail of the other. Theweight of each link is the total number of exchanged e-mails between the twoconsidered community members, within a defined time window. Communi-cation DSN represents the organisational structure of a software developmentcommunity and its coordination activities;
• Collaboration DSN: particular case of Developer Social Network, in whichnodes represent developers who contributed to the project’s source code de-velopment (extracted from the project’s VCS) and two nodes are connectedthrough a link if and only if, the two developers collaborated at least once dur-ing software development. Two developers are considered collaborating if theymodify similar portions of the project’s source code. The weight of each linkis the total number of collaborations between the two considered developers,within a defined time window. Collaboration DSN represents the technicalstructure of the project, its task dependencies and its communication needs;
• Global DSN: particular case of Developer Social Network, which is the fusionof communication and collaboration DSNs. Therefore, a node is the represen-tation of a community member who participates to the mailing list and/or tothe development activity and two community members are connected througha link if and only if, they exchanged at least one e-mail and/or collaboratedat least once. The weight of each link is the sum of total number of collabora-tions and the total number of e-mails exchanged between the two consideredcommunity members, within a defined time window;
• Core community member: community member who exhibit a high globalcentrality within the considered DSN.
36

3.2. Research questions
3.2 Research questions
The main goals of this master thesis are the understanding of which qualityfactors of a software development community can influence to the emergence ofCommunity Smells and the identification of meaningful quality thresholds of suchfactors, useful to keep Community Smells under control. To pursue these goals itwas of fundamental importance the identification and quantification of CommunitySmells with respect to their influence from the point of view of the Social Debit inthe context of Open Source Software development communities.
In order to achieve our prefixed goals we performed an empirical software engi-neering research, aimed to discover and quantify Community Smells within devel-opment community, and a survey, necessary to understand if developer perceptionscan act as indicators of the presence of Community Smells. Furthermore, executedsurvey had the purpose of accessing developer perceptions inherent to Social Debtrelated issues.
This master thesis aims at addressing the following three research questions:
• RQ1. Are there quality factors that can influence the emergence of CommunitySmells?
Considering the literature, the following sub-questions were formulated:
– RQ1a. Do sponsored developers decrease Community Smells?– RQ1b. Do temporal and geographic dispersion increase Community
Smells?– RQ1c. Do high socio-technical congruence decrease Community Smells?– RQ1d. Do high communicability decrease Community Smells?– RQ1e. Do high modularity decrease Community Smells?– RQ1f. Do low turnover decrease Community Smells?
• RQ2. If such quality factors exist, is it possible to identify quality thresholds?
• RQ3. Do developer perceptions indicate the presence of Community Smells?
3.3 Contributions
This section briefly introduces the four main basic building blocks on whichthis master thesis is founded. Each of them can be considered a precious originalcontribution to the Social Debt and socio-technical research fields as they provideadditional information, methodologies and tools.
Figure 3.1 provides a graphical representation of the four main contributions andspecifies their relationships through a work-flow in order to describe how proposedcomponents interacted during the execution of this study.
37

3. Problem analysis
Figure 3.1: Work-flow of contributions
The four fundamental contributions of this master thesis are:
• Survey. The survey was aimed to identify important quality factors thatdevelopers perceive as important within a development community, confirmsome assumptions made within this study, collect developer perceptions toachieve a deeper understanding of Social Debt and Community Smells and,moreover, verify if developer perceptions can act as indicators of the presenceof Community Smells;
• Socio-technical Quality Framework. This framework is constituted by40 quality factors, identified from the literature and from the results of theexecuted survey, with the purpose of capturing every possible socio-technicalcharacteristic of a software development community to understand if the insur-gence of Community Smells can be correlated to some specific quality factors;
• Identification patterns of Community Smells. Starting from the liter-ature related to Community Smells, we defined identification patterns of fiveCommunity Smells that, if operationalised, are able to identify and quantifyCommunity Smells within a software development community;
• Codeface4Smells. This is the actual tool that implements our Socio-technicalQuality Framework and operationalise the proposed identification patterns ofCommunity Smells. Furthermore, for every analysed software developmentcommunity, it executes a correlation analysis between all quality factors andCommunity Smells and detects if and to what extend the quality factors in-fluence the number of identified Community Smells within a community.
As suggested from the numbers reported in Figure 3.1, it is possible to identify thefollowing work-flow between the four basic building blocks:
1. The survey results had a fundamental role in the definition and individuationof quality factors considered important by developers and, thus, that neededto be included in our Socio-technical Quality Framework. Moreover, obtainedresponses allowed us to discover further notions and characteristics of SocialDebt and Community Smells within FLOSS development communities;
38

3.4. Dataset selection
2. The proposed Socio-technical Quality Framework and the identification pat-terns of Community Smells were implemented together within the tool namedCodeface4Smells;
3. The results of Codeface4Smells analysis allowed us to identify which qualityfactors were able to influence the occurrence of Community Smells and, insome particular cases, identify quality thresholds. Furthermore, the results ofCodeface4Smells analysis of the three reference projects, in conjunction withthe survey results, allowed us to identify which developer perceptions can bepotentially used as indicators of the presence of Community Smells.
3.4 Dataset selection
The dataset considered in this master thesis consisted of 60 Open Source Softwareprojects. The complete list of analysed projects can be consulted in Table 3.1, wherefor every considered project it is showed its name, its code repository address andthe development mailing list considered as its primary development communicationchannel. As it is possible to deduce from the list of analysed projects, we consideredFLOSS development communities of different dimensions, popularity, developmenthabits, openness and application contexts.
Our choice of FLOSS development communities was not random but it wasguided by specific and rigid requirements, dictated by the infrastructure of Code-face4Smells or by analysis requirements. More specifically, it was mandatory thatevery analysed project was characterised by the following list of requirements:
1. Source code was available on-line through git or SVN repositories;
2. It was possible to identify an «active» development mailing list and its archivewas present on www.gmane.com;
3. Within every analysed window it was sent at least one e-mail to the considereddevelopment mailing list;
4. Within every analysed window it was committed at least one source codecontribution;
5. Codeface’s collaboration and communication analysis terminated without er-rors.
The list of analysed projects were partially retrieved from datasets used in previ-ous empirical software engineering researches [58,59], in which diversity was verifiedwith respect to several factors. We further verified the diversity of our datasetdefining three dimensional categories characterised by an equal number of software
39
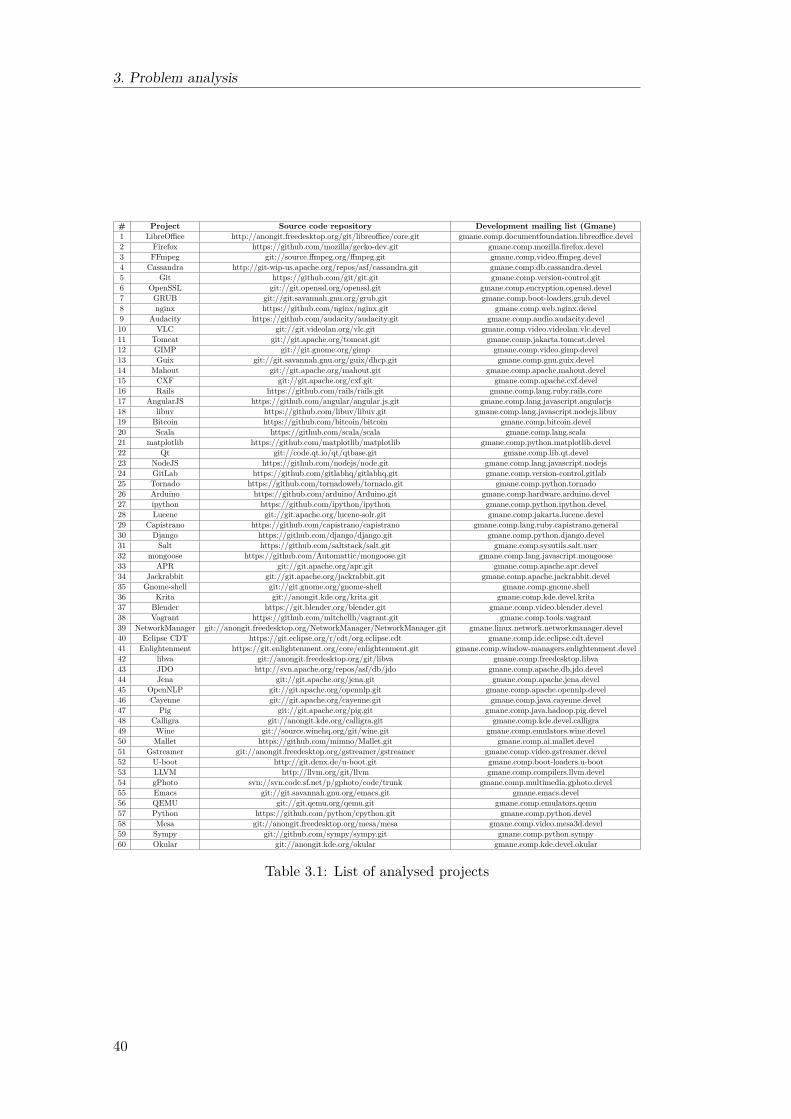
3. Problem analysis
# Project Source code repository Development mailing list (Gmane)1 LibreOffice http://anongit.freedesktop.org/git/libreoffice/core.git gmane.comp.documentfoundation.libreoffice.devel2 Firefox https://github.com/mozilla/gecko-dev.git gmane.comp.mozilla.firefox.devel3 FFmpeg git://source.ffmpeg.org/ffmpeg.git gmane.comp.video.ffmpeg.devel4 Cassandra http://git-wip-us.apache.org/repos/asf/cassandra.git gmane.comp.db.cassandra.devel5 Git https://github.com/git/git.git gmane.comp.version-control.git6 OpenSSL git://git.openssl.org/openssl.git gmane.comp.encryption.openssl.devel7 GRUB git://git.savannah.gnu.org/grub.git gmane.comp.boot-loaders.grub.devel8 nginx https://github.com/nginx/nginx.git gmane.comp.web.nginx.devel9 Audacity https://github.com/audacity/audacity.git gmane.comp.audio.audacity.devel10 VLC git://git.videolan.org/vlc.git gmane.comp.video.videolan.vlc.devel11 Tomcat git://git.apache.org/tomcat.git gmane.comp.jakarta.tomcat.devel12 GIMP git://git.gnome.org/gimp gmane.comp.video.gimp.devel13 Guix git://git.savannah.gnu.org/guix/dhcp.git gmane.comp.gnu.guix.devel14 Mahout git://git.apache.org/mahout.git gmane.comp.apache.mahout.devel15 CXF git://git.apache.org/cxf.git gmane.comp.apache.cxf.devel16 Rails https://github.com/rails/rails.git gmane.comp.lang.ruby.rails.core17 AngularJS https://github.com/angular/angular.js.git gmane.comp.lang.javascript.angularjs18 libuv https://github.com/libuv/libuv.git gmane.comp.lang.javascript.nodejs.libuv19 Bitcoin https://github.com/bitcoin/bitcoin gmane.comp.bitcoin.devel20 Scala https://github.com/scala/scala gmane.comp.lang.scala21 matplotlib https://github.com/matplotlib/matplotlib gmane.comp.python.matplotlib.devel22 Qt git://code.qt.io/qt/qtbase.git gmane.comp.lib.qt.devel23 NodeJS https://github.com/nodejs/node.git gmane.comp.lang.javascript.nodejs24 GitLab https://github.com/gitlabhq/gitlabhq.git gmane.comp.version-control.gitlab25 Tornado https://github.com/tornadoweb/tornado.git gmane.comp.python.tornado26 Arduino https://github.com/arduino/Arduino.git gmane.comp.hardware.arduino.devel27 ipython https://github.com/ipython/ipython gmane.comp.python.ipython.devel28 Lucene git://git.apache.org/lucene-solr.git gmane.comp.jakarta.lucene.devel29 Capistrano https://github.com/capistrano/capistrano gmane.comp.lang.ruby.capistrano.general30 Django https://github.com/django/django.git gmane.comp.python.django.devel31 Salt https://github.com/saltstack/salt.git gmane.comp.sysutils.salt.user32 mongoose https://github.com/Automattic/mongoose.git gmane.comp.lang.javascript.mongoose33 APR git://git.apache.org/apr.git gmane.comp.apache.apr.devel34 Jackrabbit git://git.apache.org/jackrabbit.git gmane.comp.apache.jackrabbit.devel35 Gnome-shell git://git.gnome.org/gnome-shell gmane.comp.gnome.shell36 Krita git://anongit.kde.org/krita.git gmane.comp.kde.devel.krita37 Blender https://git.blender.org/blender.git gmane.comp.video.blender.devel38 Vagrant https://github.com/mitchellh/vagrant.git gmane.comp.tools.vagrant39 NetworkManager git://anongit.freedesktop.org/NetworkManager/NetworkManager.git gmane.linux.network.networkmanager.devel40 Eclipse CDT https://git.eclipse.org/r/cdt/org.eclipse.cdt gmane.comp.ide.eclipse.cdt.devel41 Enlightenment https://git.enlightenment.org/core/enlightenment.git gmane.comp.window-managers.enlightenment.devel42 libva git://anongit.freedesktop.org/git/libva gmane.comp.freedesktop.libva43 JDO http://svn.apache.org/repos/asf/db/jdo gmane.comp.apache.db.jdo.devel44 Jena git://git.apache.org/jena.git gmane.comp.apache.jena.devel45 OpenNLP git://git.apache.org/opennlp.git gmane.comp.apache.opennlp.devel46 Cayenne git://git.apache.org/cayenne.git gmane.comp.java.cayenne.devel47 Pig git://git.apache.org/pig.git gmane.comp.java.hadoop.pig.devel48 Calligra git://anongit.kde.org/calligra.git gmane.comp.kde.devel.calligra49 Wine git://source.winehq.org/git/wine.git gmane.comp.emulators.wine.devel50 Mallet https://github.com/mimno/Mallet.git gmane.comp.ai.mallet.devel51 Gstreamer git://anongit.freedesktop.org/gstreamer/gstreamer gmane.comp.video.gstreamer.devel52 U-boot http://git.denx.de/u-boot.git gmane.comp.boot-loaders.u-boot53 LLVM http://llvm.org/git/llvm gmane.comp.compilers.llvm.devel54 gPhoto svn://svn.code.sf.net/p/gphoto/code/trunk gmane.comp.multimedia.gphoto.devel55 Emacs git://git.savannah.gnu.org/emacs.git gmane.emacs.devel56 QEMU git://git.qemu.org/qemu.git gmane.comp.emulators.qemu57 Python https://github.com/python/cpython.git gmane.comp.python.devel58 Mesa git://anongit.freedesktop.org/mesa/mesa gmane.comp.video.mesa3d.devel59 Sympy git://github.com/sympy/sympy.git gmane.comp.python.sympy60 Okular git://anongit.kde.org/okular gmane.comp.kde.devel.okular
Table 3.1: List of analysed projects
40

3.4. Dataset selection
development communities with respect to the mean number of trimestral commu-nity members present in the global DSN. In conclusion, the 60 considered softwaredevelopment communities were proven to be diversified with respect to:
• code-base size: medium, large (500-850) and very large (850>KLOC);
• main programming language: Java, C#, C, Python, YAML and more;
• community size: 20 medium projects (<50 members), 20 large projects (50>150members) and 20 very-large projects (150>);
• age: young (<24 months), established (24>32 months) and popular (32>months).
Metric Mean Min Max St.deviationGlobal DSN members 143.78 4 949 152.45
Time-zones 6.61 1 36 10.26Core global DSN members 45.53 1 311 44.1
Core communication DSN members 39.27 1 285 37.42Core collaboration DSN members 14.73 0 213 24.3
Sponsored developers 13.35 0 104 17.82Sponsored core developers 1.36 0 21 2.43
Table 3.2: Trimestral variability of analysed projects
Table 3.2 reports an overview of the most important metrics which charac-terised the analyzed Open Source Software development communities within Code-face4Smells analysis and represents their respective trimestral mean, minimum, max-imum and standard deviation values.
Every FLOSS project was analysed executing Codeface4Smells analysis usingthree-month analysis windows for the last three years, therefore every project’s anal-ysis was constituted by a total of 12 ranges. We used this temporal analysis windowbecause it was previously used in another empirical software engineering researchbased on the usage of Codeface [60] and because it was demonstrated that a soft-ware development community does not change significantly after a considerationwindow of three months [37]. The total time lapse of three years was setted in orderto achieve a relevant number of analysed ranges capable of capturing trends andcorrelations. Another motivation to the decision of limiting the analysis to threeyears is that before that temporal limit, the standard within FLOSS developmentwas Centralized VCS, as explained in Section 2.4, and thus information about theauthor of the software contributions were not accessible.
41

3. Problem analysis
42

Chapter 4
Identification patterns ofCommunity Smells
This chapter presents one fundamental contribution of this master thesis, whichis the specification of identification patterns of five Community Smells consideredin the scope of this study, namely: Organisational Silo Effect, Missing Links, Black-cloud Effect, Prima-donnas Effect and Radio Silence.
We considered the set of Community Smells identified within an industrial casestudy, conducted by Tamburri et al. [6], as a starting point and then we proposedidentification patterns, capable of capturing possible social related problematic sit-uations, for five different Community Smells. Proposed identification patterns canbe operationalised in order to provide an automated identification, quantificationand recovery of Community Smells, within a software development community, bymeans of tool-supported processes or software-repository mining techniques.
Every identification pattern of a Community Smell proposed within this chap-ter is founded on the concept of Developer Social Networks, in order to retrieveinformation about communication and collaboration relationships within a softwaredevelopment community. Therefore, the identification process of every Commu-nity Smells is enabled by the availability of the communication and collaborationDeveloper Social Networks of a development community.
While the identification patterns of four Community Smells base their discov-ery logic solely on the state of a development community in a particular point intime, one identification pattern founds its detection capabilities on the additionalconsideration of historical information, i.e., it considers more than one temporalwindow.
In this master thesis, as further explained in Chapter 7, the communicationDSN of a project was build mining communication information from its mailing listarchives, while the collaboration DSN of a project is was build mining its VersionControl System. Thus, in order to operationalise the detection and quantification of
43

4. Identification patterns of Community Smells
Community Smells, based on the exploitation of identification patterns presented inthis chapter, it is necessary to have access to the VCS and mailing list archives of asoftware development community, or to any other typology of development artefactcapable of providing information related to organisational structure and technicaldependencies of a software project.
(a) High-level community representation
(b) Collaboration DSN (c) Communication DSN
Figure 4.1: Example of software development community
An explicative example of a software development community is represented inFigure 4.1a, where it is possible to notice the presence of eight community members,identified by different letters, who are connected through green links if they commu-nicated within the mailing list and community members are connected through bluelinks to software components on which they worked (represented by a file icon).Given such high-level representation of a software development community, it ispossible to generate the communication DSN, representing the social and organ-isational structure of a project, and the collaboration DSN,representing technicalrelationships between developers working on similar portions of a project’s sourcecode. While the communication DSN of the proposed example, represented in Fig-ure 4.1c, can be easily generated considering exclusively communication links of thehigh-level representation of the development community, the generation of the col-laboration DSN, represented in Figure 4.1b, requires additional reasonings because
44

4.1. Organisational Silo Effect and Missing Links
two developers are linked if and only if they worked on a similar portion of sourcecode. Thus, since the file icon in the high-level representation of the developmentcommunity identifies a similar portion of source code, all developers linked to thesame source code portion have to be connected in the collaboration DSN.
Within the proposed example it is possible to consider the communication DSNconstituted by two different sub-communities: developers identified by the lettersB, C and D and developers identified by the letters E, F and G. It is important tohighlight that a Developer Social Network is constituted only by active communitymembers, with respect to the considered development aspect. Therefore, it is pos-sible to notice that, within the previously exposed example, the collaboration DSNdo not contain community members identified by the letters C and F because theyare not working on any source code portion and the communication DSN do notcontain the community member identified by the letter A because he or she is notcommunicating with anyone within the development community.
The following sections address all the Community Smells considered in the scopeof this master thesis. For each Community Smell it is provided an identificationpattern and a synthetic example explaining the behaviour of the identification pat-tern. Furthermore, each section presents a detailed explanation of the execution ofthe considered identification pattern within the development community presentedin Figure 4.1a and a visual representation of identified occurrences of CommunitySmells within such example.
4.1 Organisational Silo Effect and Missing Links
Tamburri et al. [6] defined Organisational Silo Effect Community Smell as theoccurrence of a too high level of decoupling between the organisational structureand development activities. Considering its definition and the literature based onConway’s law, it was possible to assimilate this Community Smell to an imperfectionin the mirroring relationship between the organisational structure and the technicalstructure, constituted by collaborations of software developers.
An Organisational Silo is characterised by an independentist sub-community thatis loosely dependent to other development partners and that duplicates or wastesresources over the development life cycle, due to its isolation from the rest of thesoftware development sub-communities.
This Community Smell is associated to the main side effect of decreasing commu-nication activities between community members belonging to different sub-communities;thus, it negatively impacts on mutual awareness and it implies a degradation of thesocio-technical congruence.Another side effect that can characterise this CommunitySmell is the rise of a “tunnel vision” within the software development community,since members belonging to the Organisational Silo tend to limit their coopera-
45

4. Identification patterns of Community Smells
tion and communication activities with members who do not belong to their sub-community. Moreover, community members belonging to an Organisational Silo canexhibit egoistic and superior behaviours, giving rise to autonomous architectural de-cisions taken without the necessary authority or knowledge. A possible mitigation tothis Community Smell can be the implementation of a “social wiki”, that combinesdocumentation, developer profiles and artefacts [6].
While we were pursuing our goal of identifying a possible automatic identificationpattern of this Community Smell, mining commonly available software developmentartefacts, we focused of the most important Organisational Silo Effect side effects:decrease of communications within the community and generation of a “tunnel vi-sion”. Therefore, we proposed two different identification patterns in order to providethe ability of identifying both typologies of side effects:
1. Organisational Silo Effect
The identification pattern of Organisational Silo Effect Community Smell isbased on the detection of community members who collaborate with other mem-bers but who do not communicate within the analysed communication channel,i.e., mailing list. An explanatory example is represented in Figure 4.2, wherethe occurrence of this Community Smell is due to the developer identified bythe number 1 because he or she does not have outgoing communication edgeseven if there is a collaboration with the developer identified by the number 2.
Figure 4.2: Identification pattern of Organisational Silo Effect
This identification pattern is capable of identifying the presence of actual sub-communities present within the software development community that gen-erate a “tunnel vision” because they do not communicate with communitymembers external to their sub-community. Pushing to its extreme the concept
46

4.1. Organisational Silo Effect and Missing Links
of sub-community, thus considering two developers at a time, an occurrenceof Organisational Silo Effect is detected whenever one of them shows unco-operative behaviours, not participating in the mailing list of the developmentcommunity.
In order to operationalise the proposed identification pattern, the collaborationand communication Developer Social Networks, generated respectively miningthe VCS and mailing list archives of a development community, should be con-sidered at the same time and each collaboration present between two differentcommunity members contributing to adjacent parts of the source code shouldbe considered as an atomic cooperation unit to identify possible Organisa-tional Silo. Since we considered the absence of one developer belonging to anatomic cooperation unit as the trigger of the occurrence of Organisational SiloEffect Community Smell, it is necessary to consider every software develop-ment cooperation present within the collaboration Developer Social Networkand check if the two community members are present or not in the commu-nication Developer Social Network. We quantified the number of occurrencesof Organisational Silo Effect as the number of single collaborations betweendifferent developers in which at least one of them do not participate in thecommunication channel. Therefore, we focused on collaborations and not ondevelopers, in order to capture the repercussions of the absence of developersin communication activities. This choice was made because the absence of ahighly active and highly connected contributor is surely more relevant thanthe absence of an occasional contributor.
Figure 4.3: Example of occurrences of Organisational Silo Effect
Considering the example of development community proposed in Figure 4.1a,in order to execute the proposed identification pattern of this CommunitySmell it is possible to compare directly the collaboration DSN (Figure 4.1b)with its communication counterpart (Figure 4.1c) and verify that the devel-oper identified by the letter A is present in the collaboration DSN but he orshe is not present in the communication Developer Social Network. Since wefocused on collaboration level and not on software developer level, we have toconsider every collaboration link between two different community members ofthe collaboration DSN. The absence of the developer identified by the letter A
47
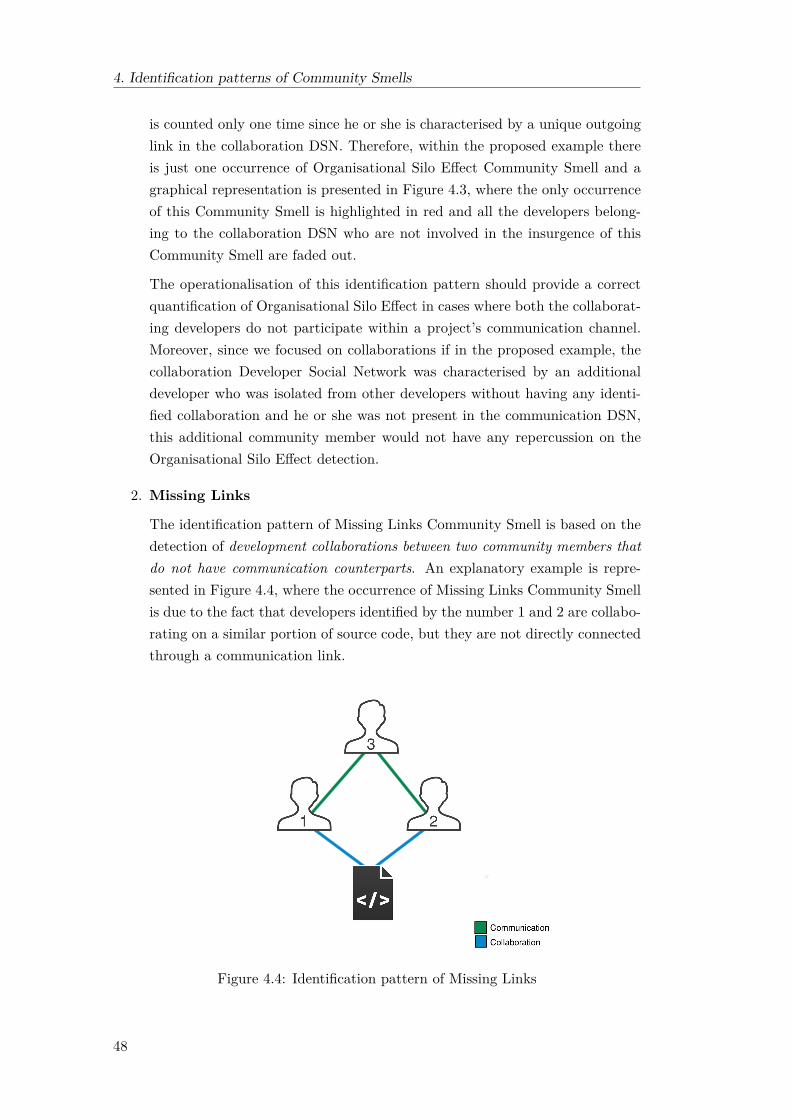
4. Identification patterns of Community Smells
is counted only one time since he or she is characterised by a unique outgoinglink in the collaboration DSN. Therefore, within the proposed example thereis just one occurrence of Organisational Silo Effect Community Smell and agraphical representation is presented in Figure 4.3, where the only occurrenceof this Community Smell is highlighted in red and all the developers belong-ing to the collaboration DSN who are not involved in the insurgence of thisCommunity Smell are faded out.
The operationalisation of this identification pattern should provide a correctquantification of Organisational Silo Effect in cases where both the collaborat-ing developers do not participate within a project’s communication channel.Moreover, since we focused on collaborations if in the proposed example, thecollaboration Developer Social Network was characterised by an additionaldeveloper who was isolated from other developers without having any identi-fied collaboration and he or she was not present in the communication DSN,this additional community member would not have any repercussion on theOrganisational Silo Effect detection.
2. Missing Links
The identification pattern of Missing Links Community Smell is based on thedetection of development collaborations between two community members thatdo not have communication counterparts. An explanatory example is repre-sented in Figure 4.4, where the occurrence of Missing Links Community Smellis due to the fact that developers identified by the number 1 and 2 are collabo-rating on a similar portion of source code, but they are not directly connectedthrough a communication link.
Figure 4.4: Identification pattern of Missing Links
48
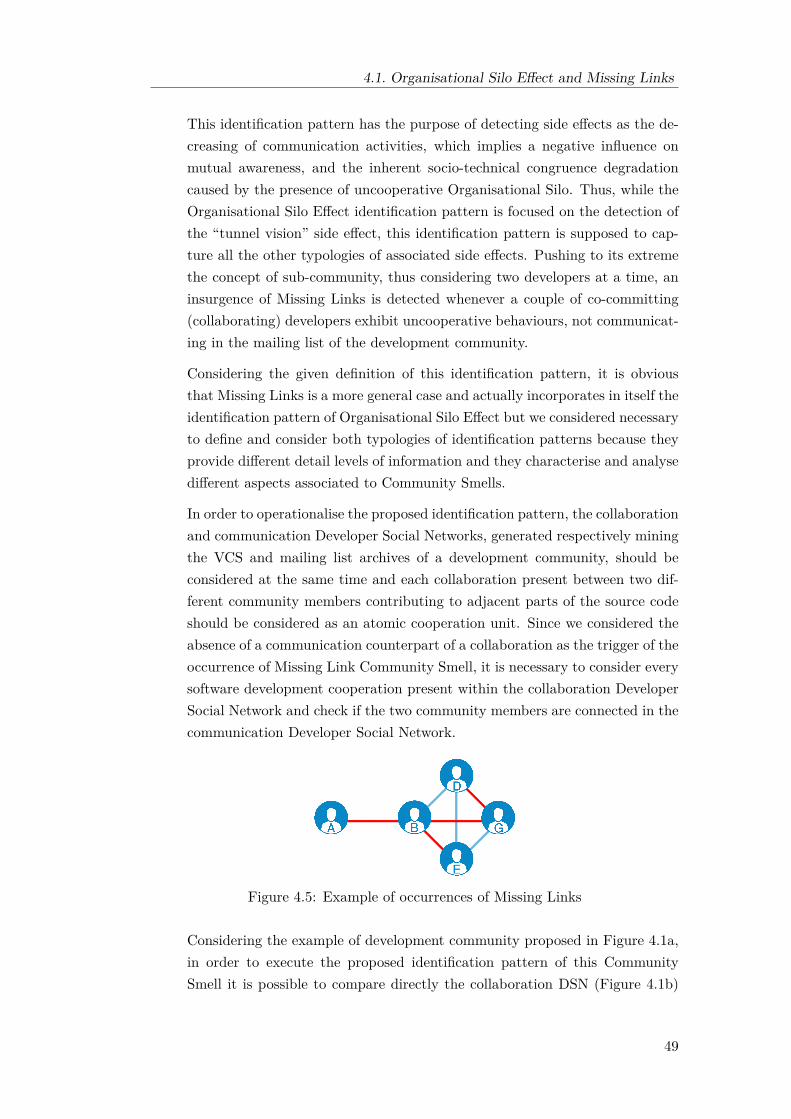
4.1. Organisational Silo Effect and Missing Links
This identification pattern has the purpose of detecting side effects as the de-creasing of communication activities, which implies a negative influence onmutual awareness, and the inherent socio-technical congruence degradationcaused by the presence of uncooperative Organisational Silo. Thus, while theOrganisational Silo Effect identification pattern is focused on the detection ofthe “tunnel vision” side effect, this identification pattern is supposed to cap-ture all the other typologies of associated side effects. Pushing to its extremethe concept of sub-community, thus considering two developers at a time, aninsurgence of Missing Links is detected whenever a couple of co-committing(collaborating) developers exhibit uncooperative behaviours, not communicat-ing in the mailing list of the development community.
Considering the given definition of this identification pattern, it is obviousthat Missing Links is a more general case and actually incorporates in itself theidentification pattern of Organisational Silo Effect but we considered necessaryto define and consider both typologies of identification patterns because theyprovide different detail levels of information and they characterise and analysedifferent aspects associated to Community Smells.
In order to operationalise the proposed identification pattern, the collaborationand communication Developer Social Networks, generated respectively miningthe VCS and mailing list archives of a development community, should beconsidered at the same time and each collaboration present between two dif-ferent community members contributing to adjacent parts of the source codeshould be considered as an atomic cooperation unit. Since we considered theabsence of a communication counterpart of a collaboration as the trigger of theoccurrence of Missing Link Community Smell, it is necessary to consider everysoftware development cooperation present within the collaboration DeveloperSocial Network and check if the two community members are connected in thecommunication Developer Social Network.
Figure 4.5: Example of occurrences of Missing Links
Considering the example of development community proposed in Figure 4.1a,in order to execute the proposed identification pattern of this CommunitySmell it is possible to compare directly the collaboration DSN (Figure 4.1b)
49
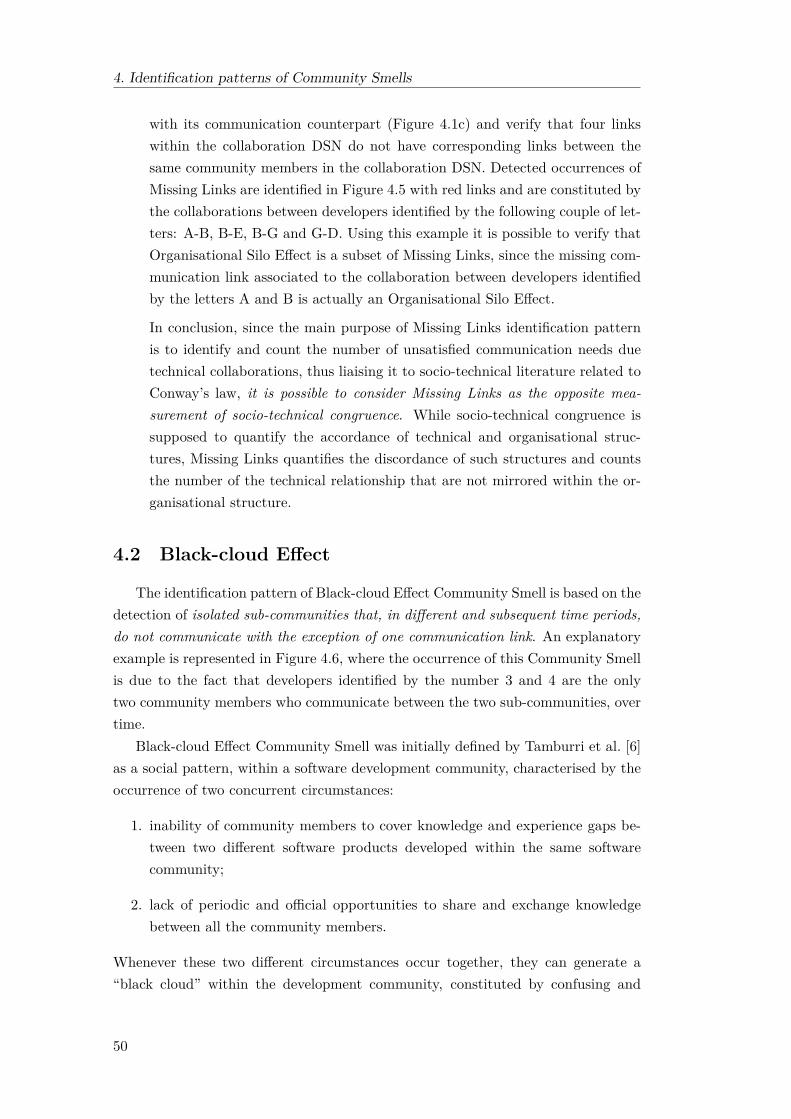
4. Identification patterns of Community Smells
with its communication counterpart (Figure 4.1c) and verify that four linkswithin the collaboration DSN do not have corresponding links between thesame community members in the collaboration DSN. Detected occurrences ofMissing Links are identified in Figure 4.5 with red links and are constituted bythe collaborations between developers identified by the following couple of let-ters: A-B, B-E, B-G and G-D. Using this example it is possible to verify thatOrganisational Silo Effect is a subset of Missing Links, since the missing com-munication link associated to the collaboration between developers identifiedby the letters A and B is actually an Organisational Silo Effect.
In conclusion, since the main purpose of Missing Links identification patternis to identify and count the number of unsatisfied communication needs duetechnical collaborations, thus liaising it to socio-technical literature related toConway’s law, it is possible to consider Missing Links as the opposite mea-surement of socio-technical congruence. While socio-technical congruence issupposed to quantify the accordance of technical and organisational struc-tures, Missing Links quantifies the discordance of such structures and countsthe number of the technical relationship that are not mirrored within the or-ganisational structure.
4.2 Black-cloud Effect
The identification pattern of Black-cloud Effect Community Smell is based on thedetection of isolated sub-communities that, in different and subsequent time periods,do not communicate with the exception of one communication link. An explanatoryexample is represented in Figure 4.6, where the occurrence of this Community Smellis due to the fact that developers identified by the number 3 and 4 are the onlytwo community members who communicate between the two sub-communities, overtime.
Black-cloud Effect Community Smell was initially defined by Tamburri et al. [6]as a social pattern, within a software development community, characterised by theoccurrence of two concurrent circumstances:
1. inability of community members to cover knowledge and experience gaps be-tween two different software products developed within the same softwarecommunity;
2. lack of periodic and official opportunities to share and exchange knowledgebetween all the community members.
Whenever these two different circumstances occur together, they can generate a“black cloud” within the development community, constituted by confusing and
50
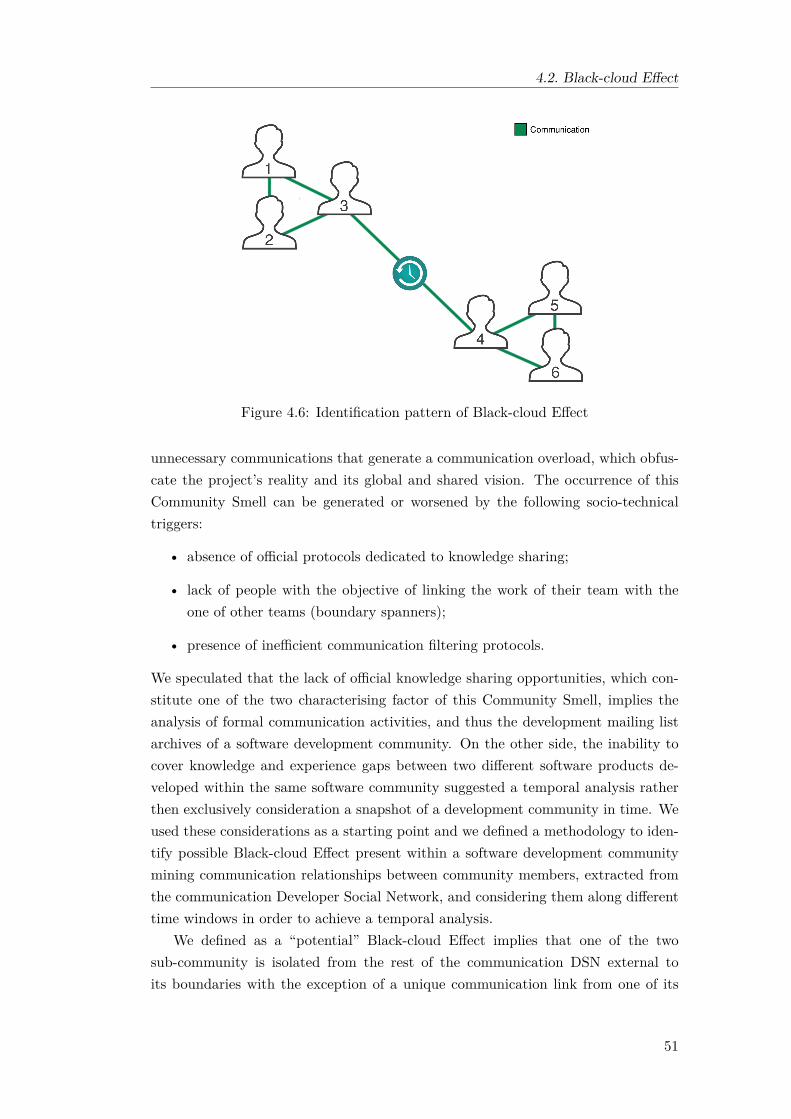
4.2. Black-cloud Effect
Figure 4.6: Identification pattern of Black-cloud Effect
unnecessary communications that generate a communication overload, which obfus-cate the project’s reality and its global and shared vision. The occurrence of thisCommunity Smell can be generated or worsened by the following socio-technicaltriggers:
• absence of official protocols dedicated to knowledge sharing;
• lack of people with the objective of linking the work of their team with theone of other teams (boundary spanners);
• presence of inefficient communication filtering protocols.
We speculated that the lack of official knowledge sharing opportunities, which con-stitute one of the two characterising factor of this Community Smell, implies theanalysis of formal communication activities, and thus the development mailing listarchives of a software development community. On the other side, the inability tocover knowledge and experience gaps between two different software products de-veloped within the same software community suggested a temporal analysis ratherthen exclusively consideration a snapshot of a development community in time. Weused these considerations as a starting point and we defined a methodology to iden-tify possible Black-cloud Effect present within a software development communitymining communication relationships between community members, extracted fromthe communication Developer Social Network, and considering them along differenttime windows in order to achieve a temporal analysis.
We defined as a “potential” Black-cloud Effect implies that one of the twosub-community is isolated from the rest of the communication DSN external toits boundaries with the exception of a unique communication link from one of its
51
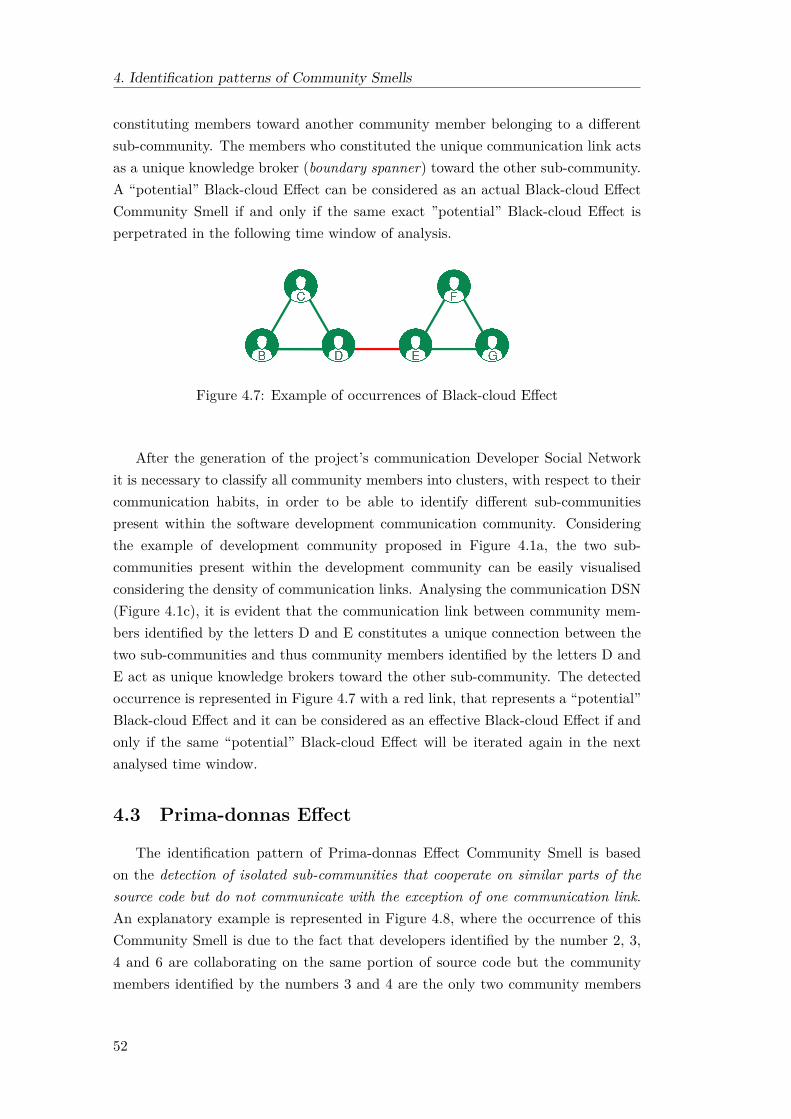
4. Identification patterns of Community Smells
constituting members toward another community member belonging to a differentsub-community. The members who constituted the unique communication link actsas a unique knowledge broker (boundary spanner) toward the other sub-community.A “potential” Black-cloud Effect can be considered as an actual Black-cloud EffectCommunity Smell if and only if the same exact ”potential” Black-cloud Effect isperpetrated in the following time window of analysis.
Figure 4.7: Example of occurrences of Black-cloud Effect
After the generation of the project’s communication Developer Social Networkit is necessary to classify all community members into clusters, with respect to theircommunication habits, in order to be able to identify different sub-communitiespresent within the software development communication community. Consideringthe example of development community proposed in Figure 4.1a, the two sub-communities present within the development community can be easily visualisedconsidering the density of communication links. Analysing the communication DSN(Figure 4.1c), it is evident that the communication link between community mem-bers identified by the letters D and E constitutes a unique connection between thetwo sub-communities and thus community members identified by the letters D andE act as unique knowledge brokers toward the other sub-community. The detectedoccurrence is represented in Figure 4.7 with a red link, that represents a “potential”Black-cloud Effect and it can be considered as an effective Black-cloud Effect if andonly if the same “potential” Black-cloud Effect will be iterated again in the nextanalysed time window.
4.3 Prima-donnas Effect
The identification pattern of Prima-donnas Effect Community Smell is basedon the detection of isolated sub-communities that cooperate on similar parts of thesource code but do not communicate with the exception of one communication link.An explanatory example is represented in Figure 4.8, where the occurrence of thisCommunity Smell is due to the fact that developers identified by the number 2, 3,4 and 6 are collaborating on the same portion of source code but the communitymembers identified by the numbers 3 and 4 are the only two community members
52

4.3. Prima-donnas Effect
Figure 4.8: Identification pattern of Prima-donnas Effect
who communicate between the two sub-communities.Prima-donnas Effect Community Smell was initially defined by Tamburri et al. [6]
and it is characterised by the presence of a sub-community of developers which isunreceptive with respect to different influences coming from outside it boundaries,unwilling to communicate with external community members, unwilling to welcomesupport from other members and resistant to imposed organisational or processeschanges.
In order to operationalise the proposed identification pattern, the collaborationand communication Developer Social Networks, generated respectively mining theVCS and mailing list archives of a development community, should be consideredat the same time and it is also necessary to classify all community members intoclusters, with respect to their communication habits, in order to be able to identifydifferent sub-communities present within the software development communicationcommunity. The proposed of Prima-donnas Effect Community Smell can be subdi-vided into two identification steps:
1. Step one: identification of sub-communities that communicate with each-other exclusively through a unique communication link, thus it is the sameconcept the concept of “potential” Black-cloud Effect Community Smell;
2. Step two: Once potential problematic sub-communities with isolationist be-haviours are identified (“potential” Black-clouds) in the previous step, it isnecessary to consider the collaboration Developer Social Network and computethe collaboration level of developers belonging to every couple of identified sub-communities. If computed collaboration level is over a given threshold, thena Prima-donnas Effect Community Smell is detected. The threshold used
53
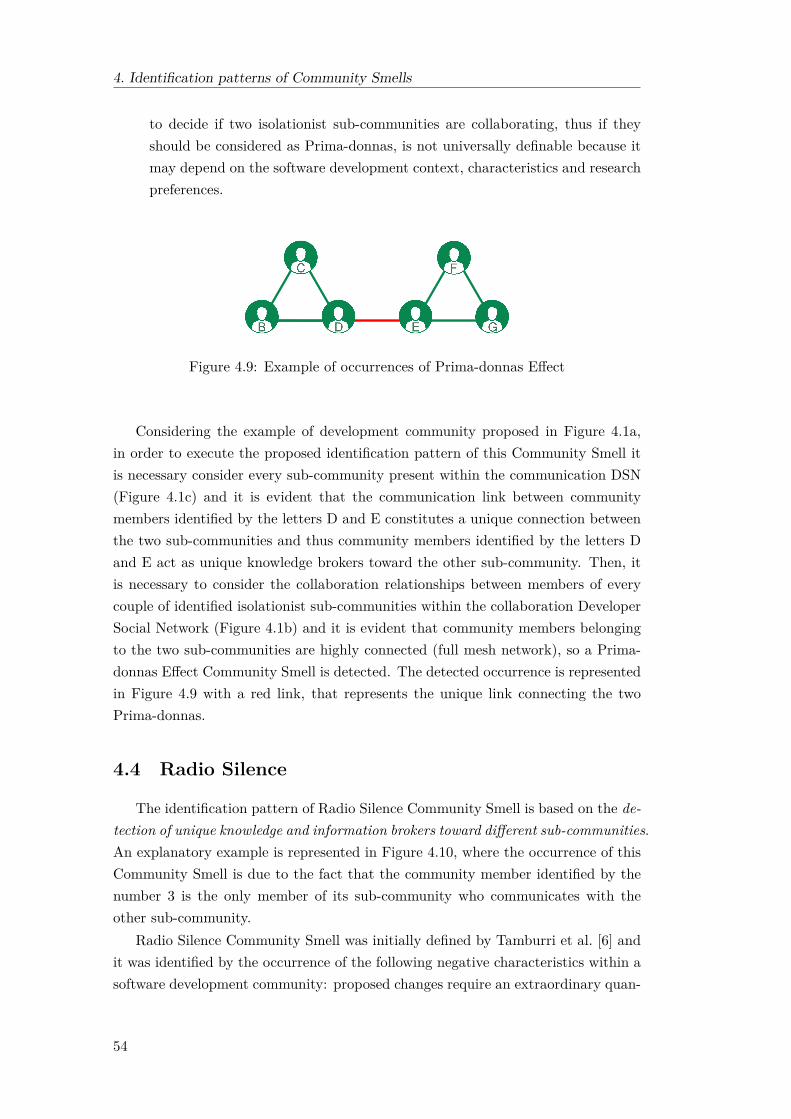
4. Identification patterns of Community Smells
to decide if two isolationist sub-communities are collaborating, thus if theyshould be considered as Prima-donnas, is not universally definable because itmay depend on the software development context, characteristics and researchpreferences.
Figure 4.9: Example of occurrences of Prima-donnas Effect
Considering the example of development community proposed in Figure 4.1a,in order to execute the proposed identification pattern of this Community Smell itis necessary consider every sub-community present within the communication DSN(Figure 4.1c) and it is evident that the communication link between communitymembers identified by the letters D and E constitutes a unique connection betweenthe two sub-communities and thus community members identified by the letters Dand E act as unique knowledge brokers toward the other sub-community. Then, itis necessary to consider the collaboration relationships between members of everycouple of identified isolationist sub-communities within the collaboration DeveloperSocial Network (Figure 4.1b) and it is evident that community members belongingto the two sub-communities are highly connected (full mesh network), so a Prima-donnas Effect Community Smell is detected. The detected occurrence is representedin Figure 4.9 with a red link, that represents the unique link connecting the twoPrima-donnas.
4.4 Radio Silence
The identification pattern of Radio Silence Community Smell is based on the de-tection of unique knowledge and information brokers toward different sub-communities.An explanatory example is represented in Figure 4.10, where the occurrence of thisCommunity Smell is due to the fact that the community member identified by thenumber 3 is the only member of its sub-community who communicates with theother sub-community.
Radio Silence Community Smell was initially defined by Tamburri et al. [6] andit was identified by the occurrence of the following negative characteristics within asoftware development community: proposed changes require an extraordinary quan-
54

4.4. Radio Silence
Figure 4.10: Identification pattern of Radio Silence
tity of time to be implemented, time wasting, hidden information, highly formal or-ganisational structure, complex organisational structure, and highly regular proce-dures. The fundamental side effect generated by this Community Smell is a massivedelay that characterises decision making processes within a software developmentcommunity, due to people unavailability or to the communication overload createdto cope with further generated information needs.
The presence of a unique boundary spanner toward another sub-community,i.e., a unique knowledge and information broker, implies that every informationand knowledge exchange between the two sub-communities needs to be processedby that unique community member. This demanding task requires an additionalamount of time from that single community member, generating delays. Moreover,the absence of a unique boundary spanner can stall every formal interaction betweentwo sub-communities.
Figure 4.11: Example of occurrences of Radio Silence
Considering the example of development community proposed in Figure 4.1a,since the detection of Radio Silence Community Smell is defined through the conceptof unique boundary spanner, it is necessary to identify all community members who
55

4. Identification patterns of Community Smells
are the only members of their sub-community that communicate with another sub-community. Therefore, we have to consider every inter-communication betweendifferent sub-communities.
The decisional process to detect Radio Silence Community Smell using the pro-posed identification pattern within the proposed example, considering one sub-community at a time, is the following:
• Sub-community B-C-D: It communicates with sub-community E-F-G ex-clusively through community member identified by the letter D, then this isidentified as a Radio Silence occurrence and the community member identi-fied by letter D is the knowledge and information broker toward the othersub-community;
• Sub-community E-F-G: It communicates with sub-community A-B-C ex-clusively through community member identified by the letter E, then this isidentified as a Radio Silence occurrence and the community member identi-fied by letter E is the knowledge and information broker toward the othersub-community.
The two detected occurrences are represented in Figure 4.11, where knowledge andinformation brokers are highlighted while all the other community members are fadedout. The quantification of the Radio Silence Community Smell that we proposed isfocused on the number of different developers who act as boundary spanner towardother sub-communities and not on the number of unique communication links.
56

Chapter 5
Socio-technical QualityFramework
After the definition of identification patterns capable of identifying CommunitySmells occurrences and thus enabling the ability of detecting the presence of potentialSocial Debt within a software development community, proposed in Chapter 4, wefocused on the arduous task of identifying which socio-technical development aspectsare related or responsible of the insurgence of Community Smells. Social Debt isconsidered an ubiquitous phenomenon within the entire software development lifecycle and in all its related literature (Section 2.5) it was not possible to clearlyidentify specific socio-technical aspects responsible of increases or decreases of SocialDebt.
Our contribution to cover this further step in the identification of socio-technicalaspects which can be considered responsible of the contraction or extinction of So-cial Debt was the definition of a Socio-technical Quality Framework. Such Socio-technical Quality Framework is a fundamental basic building block of this masterthesis, since it was used to correlate its composing quality factors with the occur-rence of Community Smells within FLOSS development communities in order tounderstand how and to what extend Community Smells are related or caused byspecific socio-technical quality factors.
The Socio-technical Quality Framework proposed in this chapter is composedby a total of 40 socio-technical quality factors, which were mainly extracted fromempirical software engineering literature but the introduction of some of them wereeven suggested and supported by the results of the executed survey (Chapter 6). Theidentified quality factors composing the defined Socio-technical Quality Frameworkanalyze many different software development aspects: from dimensional characteris-tics of Developer Social Networks to core community members quantification, fromturnover rates to socio-technical metrics and from truck numbers to Social NetworkAnalysis metrics.
57
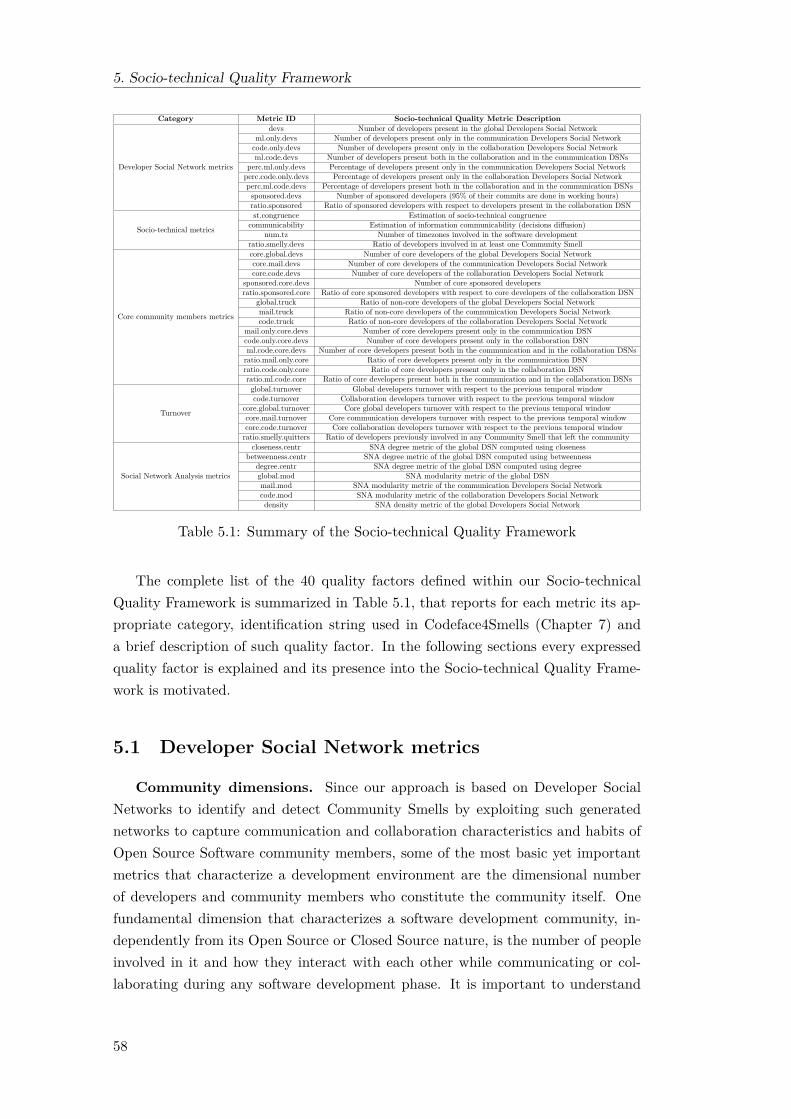
5. Socio-technical Quality Framework
Category Metric ID Socio-technical Quality Metric Description
Developer Social Network metrics
devs Number of developers present in the global Developers Social Networkml.only.devs Number of developers present only in the communication Developers Social Network
code.only.devs Number of developers present only in the collaboration Developers Social Networkml.code.devs Number of developers present both in the collaboration and in the communication DSNs
perc.ml.only.devs Percentage of developers present only in the communication Developers Social Networkperc.code.only.devs Percentage of developers present only in the collaboration Developers Social Networkperc.ml.code.devs Percentage of developers present both in the collaboration and in the communication DSNs
sponsored.devs Number of sponsored developers (95% of their commits are done in working hours)ratio.sponsored Ratio of sponsored developers with respect to developers present in the collaboration DSN
Socio-technical metrics
st.congruence Estimation of socio-technical congruencecommunicability Estimation of information communicability (decisions diffusion)
num.tz Number of timezones involved in the software developmentratio.smelly.devs Ratio of developers involved in at least one Community Smell
Core community members metrics
core.global.devs Number of core developers of the global Developers Social Networkcore.mail.devs Number of core developers of the communication Developers Social Networkcore.code.devs Number of core developers of the collaboration Developers Social Network
sponsored.core.devs Number of core sponsored developersratio.sponsored.core Ratio of core sponsored developers with respect to core developers of the collaboration DSN
global.truck Ratio of non-core developers of the global Developers Social Networkmail.truck Ratio of non-core developers of the communication Developers Social Networkcode.truck Ratio of non-core developers of the collaboration Developers Social Network
mail.only.core.devs Number of core developers present only in the communication DSNcode.only.core.devs Number of core developers present only in the collaboration DSNml.code.core.devs Number of core developers present both in the communication and in the collaboration DSNs
ratio.mail.only.core Ratio of core developers present only in the communication DSNratio.code.only.core Ratio of core developers present only in the collaboration DSNratio.ml.code.core Ratio of core developers present both in the communication and in the collaboration DSNs
Turnover
global.turnover Global developers turnover with respect to the previous temporal windowcode.turnover Collaboration developers turnover with respect to the previous temporal window
core.global.turnover Core global developers turnover with respect to the previous temporal windowcore.mail.turnover Core communication developers turnover with respect to the previous temporal windowcore.code.turnover Core collaboration developers turnover with respect to the previous temporal window
ratio.smelly.quitters Ratio of developers previously involved in any Community Smell that left the community
Social Network Analysis metrics
closeness.centr SNA degree metric of the global DSN computed using closenessbetweenness.centr SNA degree metric of the global DSN computed using betweenness
degree.centr SNA degree metric of the global DSN computed using degreeglobal.mod SNA modularity metric of the global DSNmail.mod SNA modularity metric of the communication Developers Social Networkcode.mod SNA modularity metric of the collaboration Developers Social Networkdensity SNA density metric of the global Developers Social Network
Table 5.1: Summary of the Socio-technical Quality Framework
The complete list of the 40 quality factors defined within our Socio-technicalQuality Framework is summarized in Table 5.1, that reports for each metric its ap-propriate category, identification string used in Codeface4Smells (Chapter 7) anda brief description of such quality factor. In the following sections every expressedquality factor is explained and its presence into the Socio-technical Quality Frame-work is motivated.
5.1 Developer Social Network metrics
Community dimensions. Since our approach is based on Developer SocialNetworks to identify and detect Community Smells by exploiting such generatednetworks to capture communication and collaboration characteristics and habits ofOpen Source Software community members, some of the most basic yet importantmetrics that characterize a development environment are the dimensional numberof developers and community members who constitute the community itself. Onefundamental dimension that characterizes a software development community, in-dependently from its Open Source or Closed Source nature, is the number of peopleinvolved in it and how they interact with each other while communicating or col-laborating during any software development phase. It is important to understand
58

5.1. Developer Social Network metrics
that, especially when analyzing and dealing with Open Source Software projects,it is necessary to consider and capture different roles and behaviors of communitymembers, since many parallel and different contribution and participation levels areusually present within a FLOSS project development environment. The number ofdevelopers contributing to a project can be composed by formal developers, regularand constant contributors to the source code, developers who participate in the soft-ware development with a discontinued attitude and other code contributors that aremore difficultly characterizable, such as: developers who contribute to the projectjust to fix issues that interfere with their software usage, thus potentially once ina lifetime contribution to the project, and official maintainers who are responsibleof the entire project development cycle, who may or may not be directly involvedin the source code development activity. A formal definition of every participationlevel is indeed difficult because every project and every developer can potentially im-ply a different contribution typology and can be associated to a different behavior.Moreover, Open Source Software communities are not only constituted by devel-opers who contribute directly to the project’s source code but they are composedeven from a whole different universe of community members with different func-tionalities and roles not directly involved within the software development activity,performing useful services such as: provide support to software users, seek for helpand thus possibly provide easy-to-find solutions for users that will have the sameproblematic in the future, create project documentation, translate the software andits documentation or its informational pages in different idioms, report bugs or soft-ware malfunctions and suggest possible solutions, test new software functionalitiesor versions and promote the software and/or its community. In order to achieve afiner grain level analysis and capture every possible community member typologyinvolved within the development life cycle, we considered the communication Devel-oper Social Network extracted from the development mailing list, the collaborationDeveloper Social Network extracted from the Version Control System history andthe global Developer Social Network obtained merging the two previously describedDeveloper Social Network. A community member is defined as a person who sup-ports a project in at least one of the two following ways: if he or she participateswithin the communication channel by sending and/or receiving a message withinthe range in analysis or if he or she is the author of at least one software contri-bution (commit) to the source code within the range in analysis. These differentdevelopment dimensions, extracted from the relative Developer Social Networks, arecaptured through the following measurements:
1. The number of community members present only in the communication channel(ml.only.devs). Thus, community members who do not directly contribute toa project’s source code but that provide help, seek for help and/or participateinto community’s activities in different ways;
59

5. Socio-technical Quality Framework
2. The number of developers contributing to the source code but who do not com-municate (code.only.devs). Thus, developers who contribute to a project’ssource code but that are distant or not interested in participating into the com-munity itself, rather they have specific interests only in the developed software.This dimension can capture once in a lifetime contributors or developers whomcontribute to the project by fixing or implementing features that are neededby their specific usage of the software;
3. The number of community members who contribute to the source code andcommunicate (ml.code.devs). Thus, this dimensional metric provides infor-mation about members completely involved in different community’s activities;
4. The number of global distinct community members involved in the community(devs). Thus, this dimensional metric captures every possible person involvedin any possible way into a FLOSS community.
Previously listed dimensional metrics are considered even in their percentages form,in order to achieve a deeper understanding of how community members are in-volved within every different analyzed scenario. Therefore, the following percent-ages are computed by the proposed Socio-technical Quality Framework: commu-nity members involved in the software development of a project who communicate(perc.ml.code.devs), community members involved exclusively in the communica-tion channels (perc.mail.only.devs) and developers who contribute to a project onlyby committing code but that do not communicate (perc.code.only.devs). These ty-pologies of dimensional metrics, related to the size of a community’s organization, aresupported as significant and valid measures to be inserted into our Socio-technicalQuality Framework by Conway’s law [9], which is the foundation of every socio-technical empirical software engineering research, because one of its characteristicswas that this his becomes more reliable as the organizational size increases.
Sponsored developers. FLOSS development is growing year after year as animportant commercial activity and, as soon as an Open Source Software projectbecomes promising, commercial companies may be interested in actively participat-ing into its development in order to adequate the software to their needs. Due totheir status, developers sponsored by commercial companies devolve most of theirtime to software development and to community activities, working on most of thetasks, organizing and coordinating the community. The proposed Socio-technicalQuality Framework considers the presence of software developers who contribute toa FLOSS development that are sponsored by commercial companies or who can beconsidered as self-sponsored developers and quantifies such phenomenon computingthe total number of sponsored developers present in the collaboration DeveloperSocial Network (sponsored.devs) and its relative ratio (ratio.sponsored). Thebackground theory that supports the inclusion of these metrics, related to developers
60

5.2. Socio-technical metrics
sponsored by commercial companies and to self-employed developers, was providedin 2014 by Riehle et al. [8], who stated that the ratio of volunteer and paid work canbe considered as an indicator of the health of an Open Source Software project, aswell as they may indicate the commercial attractiveness of a FLOSS project itself.
5.2 Socio-technical metrics
Software development is a complex activity which is influenced by both socialand technical components of an organization, or of a community in the case ofOpen Source Software. As exhaustively explained in Section 2.1 and in Section 2.5,unhealthy social and technical characteristics of a software project may imply theinsurgence of additional malfunctions within the produced output and affect softwaredevelopers relational dynamics between themselves and with the organization itself.The interdependence of such components, affecting every development phase, wasconsidered so prominent that the term “socio-technical” was coined, to highlight thespecific effects that social and technical aspects of software development are capableto exercise in conjunction on the outcome of a software community. Since unhealthysocio-technical patterns may generate Technical Debt and its social counterpart, weincluded into our Socio-technical Quality Framework some specific metrics whichwere defined or suggested by socio-technical software engineering literature.
Socio-technical congruence. The attention on socio-technical aspects of soft-ware development phases grew in the last decade such that Cataldo et al. [5] in 2008introduced the key idea of “socio-technical congruence”. As previously explained(Section 2.1), socio-technical congruence is meant to measure the level of agreementbetween communication needs of software artefacts and the actual communicationsthat occur within a software development environment. The socio-technical congru-ence measurement methodology introduced by Cataldo et al. was based on the rela-tion between product dependencies, work dependencies and their comparison to co-ordination activities. Instead, the socio-technical congruence (st.congruence) mea-surement implementation that we proposed in our Socio-technical Quality Frame-work is based on the direct comparison of the collaboration Developer Social Net-work, that represents all the development relationships and work dependencieswithin a software development and highlights the communication needs, to thecommunication Developer Social Network, that represents all the actual coordina-tion activities and relationships within a software development community. Thus,our implementation of socio-technical congruence metric, rather than consideringmodule dependencies as proposed by Cataldo et. al, is based on Valetto et al. [45]idea that to investigate and quantify socio-technical congruence within a softwaredevelopment environment, it is necessary to investigate if there is a similarity (con-gruence) between the coordination structure (represented by the collaboration DSN)
61

5. Socio-technical Quality Framework
and the social organization (represented by the communication DSN) of the projectitself. Socio-technical congruence can be considered as one of the most importantsocio-technical quality metrics of the proposed framework because it is correlatedto the Social Debt concept, since in Conway’s law terms it can be considered as anindicator of the presence of possible social related issues, as it compares the socialand technical processes requirements and measures their accordance. Furthermore,Cataldo et al. suggested that a higher socio-technical congruence is correlated to ahigher software development performance.
Temporal and geographic dispersion. Since FLOSS development can be in-herently considered a Global Software Development environment, it will be affectedby all the considerations and problematics previously elicited in Section 2.2. Tem-poral and geographic dispersion, not to mention cultural and linguistic differences,can negatively affect software development performance, software quality and thesoftware development community itself, in case such distances and differences arenot kept under control and exploited to extract the best profit from their existence.It is known that if temporal and geographic distribution and dispersion of a projectoccur to be unaddressed, they can generate important side effects in the softwaredevelopment community or to its product outcome [21]. The temporal and geo-graphic dispersion of contributors whom participate to software development andthe related impact of such dispersions onto the software community is captured bythe our Socio-technical Quality Framework through an indicator that represents thenumber of different time-zones involved in the source code development (num.tz).
Communicability. Another important socio-technical quality metric that in-fluenced our proposed quality framework, was defined in a Social Debt related studyconducted by Tamburri et al. focused on software architecture processes [7]; theyproposed a metric called “Debt-Aimed arcHitecture-Level Incommunicability Anal-ysis” (DAHLIA) that had the purpose of evaluating the in-communicability of ar-chitectural decisions across a software development community. Tamburri et al.defined in-communicability as the “likelihood that who should know about archi-tecture decisions actually does not know anything about them”. We introducedinto our Socio-technical Quality Framework a new metric called communicability(communicability), which can be considered as the inverse of in-communicabilitymeasurement proposed by DAHLIA. Communicability was preferred for practicalreasons, because given the implementation methodology briefly explained in the fol-lowing, in-communicability in FLOSS development communities tends to be char-acterized by very small values. DAHLIA was defined considering the social-networkweak-ties hypothesis and was supposed to be calculated for every project’s architec-tural decision. In order to adapt and implement an estimation of communicability,we treated every technical collaboration between two developers represented in theproject’s collaboration Developer Social Network, as a possible source of design or
62

5.3. Core community members metrics
architectural decisions. To mimic the social-network weak-tie hypothesis adopted inDAHLIA and to pander socio-technical development aspects captured by the collab-oration and the communication DSNs of a software community, we concluded thatdevelopers whom should be made aware of a decision (a collaboration) are those thatdirectly collaborate with at least one of the two developers involved in the decisionmaking. The motivation of such decision reside in the concept that since they arerelated, probably they are interested and are working on the same or on a correlatedpart of the software code source. A developer is considered aware of a technical de-cision if he or she is connected with at least one of the developers implicated in thedecision (collaboration) in the communication Developer Social Network. Since com-municability metric is related to every existent collaboration between two differentproject’s developers, we considered the global communicability metric estimation asthe mean of the communicability metric of all the collaborations present within thecollaboration Developer Social Network.
In the proposed Socio-technical Quality Framework it was introduced a metricthat resides between socio-technical and Developer Social Network metrics cate-gories, as it is directly dependent on actual identified Community Smells, explainedin Chapter 4, and thus it can be considered as an indicator of the presence of Commu-nity Smells and their negative effects. Such metric is constituted by the percentageof total community members present in the global Developer Social Network who areinvolved into at least one identified Community Smell (ratio.smelly.devs) and itspurpose is to quantify the predominance and quantity of members whom incurredin Community Smells during their activities.
5.3 Core community members metrics
Core community members. A group of dimensional metrics related to De-veloper Social Network metrics, which were recognized such important and specificto deserve a dedicated section, are constituted by indicators capable of measuringthe number of core members involved into software development and its associ-ated community activities. Core developers are community members who activelyparticipate into development activities, are associated with important managerialroles, have higher decisional power and pursue the goal of supporting and solicitingsoftware contributions and community participations. Metrics related to core com-munity members were inserted in our Socio-technical Quality Framework because,over the years, many empirical software engineering studies used such indicatorsto characterize the quality of software development activities and many researchersproposed different methodologies to identify such typology of developers from De-veloper Social Networks. The count of core and peripheral developers of a softwaredevelopment community can be considered as very useful indicators of the devel-
63

5. Socio-technical Quality Framework
opment state and of the community general health with respect to the followinghypothesis formulated by Mockus et al. [13]:
• FLOSS projects have a group of core developers (usually 10-15 people) whomcontrol the code base and which are responsible of at least 80% of new imple-mented functionalities;
• Large FLOSS projects are subdivided into different groups, creating severalrelated sub-projects;
• A successful FLOSS project has a larger group of members (one order of mag-nitude bigger than core developers group) committed to bug-fixing and anotherlarger group of members (another other of magnitude) that reports problems;
• A FLOSS project that has a strong group of core developers but at the sametime has a small number of developers committed to bug-fixing, will be ableto implement new functionalities but it will fail as defects will not be foundand corrected.
Crowston et al. [61] stated that core contributors involved in the development ofa FLOSS project are very important because “many of the processes necessary forsuccessful projects likely involve core members differently than peripheral members”and concluded that both the typologies of members (peripheral and core) should beconsidered separately during an empirical software engineering study to obtain validresults. In their study Crowston et al. showed that, while peripheral developersare usually involved in bug fixing or small code enhancements and contribute tothe project in an irregular and short-term manner, core developers have a long-term involvement with the software project, are fundamental to perform systemarchitecture decisions and create the general leadership structure of the projectcommunity. Terceiro et al. [62] correlated core developer behaviours to the structuralcomplexity of a project development environment and discovered that usually coredevelopers generate less structural complexity than peripheral developers, thus astable and healthy team of core developers is a must for the success and sustainabilityof FLOSS projects. We tried to define precisely the properties that characterise coredevelopers using different literature resources but its definition in real world OpenSource communities is quite blurry because the figure of core developers and theprivileges associated to this figure can change within every development community.As an example, in some communities maintainers and core developers terminologiescoincide, while in others they refer to completely different concepts. In this masterthesis we considered as a core community member whoever is characterised by a highdegree of centrality within the specifically considered Developer Social Network.Therefore, the proposed Socio-technical Quality Framework contained the followingmetrics related to the identification of core community members:
64

5.3. Core community members metrics
1. Number of core developers within the global Developer Social Network(core.global.devs);
2. Number of core developers within the communication Developer Social Network(core.mail.devs);
3. Number of core developers within the collaboration Developer Social Network(core.code.devs);
4. Number of core developers within the collaboration Developer Social Networkwho are sponsored by commercial commercial companies or who can be con-sidered as self-employed in the FLOSS project and its corresponding ratiopercentage (sponsored.core.devs, ratio.sponsored.core);
5. Number of core developers whom are present only in the communication De-veloper Social Network but not in its collaboration counterpart and its corre-sponding ratio percentage (mail.only.core.devs, ratio.mail.only.core);
6. Number of core developers whom are present only in the collaboration DeveloperSocial Network but not in its communication counterpart and its correspondingratio percentage (code.only.core.devs, ratio.code.only.core);
7. Number of core developers whom are present both in the communication andcollaboration Developer Social Networks and its corresponding ratio percentage(ml.code.core.devs, ratio.ml.code.core).
Truck number. As soon as peripheral and core community members of the threetypologies of Developer Social Networks are identified, it is possible to computethe truck number (also known as bus factor) of the global DSN (global.truck), ofthe communication DSN (mail.truck) and of the collaboration DSN (code.truck).Such metric typology is important because it measures the concentration of infor-mation within every individual developer and it is considered as a good indicator toevaluate risks associated to knowledge loss due to turnover of developers [57]. Thetruck number is commonly defined as the quantity of members who can be unex-pectedly lost (“hit by a truck”) without dooming the project to failure, due to lack ofknowledge or competent members. While a low truck number can highlight a possi-ble project risk because most of the knowledge is concentrated in few people, a hightruck number can represent a low risk due to developers turnover because the knowl-edge is spread across all the community and, if a developer will leave the project,other developers do have enough knowledge to carry on the software developmentactivity [57]. The decision of including truck number metric into our Socio-technicalQuality Framework was supported by Lavallée et al. [56] research, which consid-ered “human resource planning” issues as one of the possible organizational factorsimpacting on software development quality.
65

5. Socio-technical Quality Framework
5.4 Turnover
The organizational structure of a software project can be influenced from mem-bers joining and leaving the software development community and, while departingcommunity members will lead the project to knowledge loss and relative knowledgegaps that need to be filled in order to avoid the raise of problematic situations,new members might bring innovations and new ideas into the community [14]. Newdevelopers may introduce defects and lower developed software quality due to theirlack of knowledge about the system and it will require time from core communitymembers to answer to their questions and mentoring them. Since the quality of adevelopment community is tightly related to the knowledge and the experience ofmembers, the longer a community member has been involved in a project the fewerdefects will be present in his or her code [63]; consequently the quality of developedsource code is higher when long time and more experienced developers are presentwithin the development community.
While studying the relationship between developer-centric measures of organi-zational changes and the probability of customer-reported defects in the context ofa large software project, Mockus [14] discovered that organizational volatility wascorrelated to an increased probability of customer-reported defects in the software.Therefore, experienced developers leaving an organization create gaps in tacit knowl-edge and, as consequence, the product quality decreases. Furthermore, he discoveredthat new developers bring innovation into the software community but they actuallyhave no impact on software quality, usually the motivation of this phenomenon isthat they are assigned to less critical changes [14].
As the quality of software contributions is usually related to the system knowl-edge of community members, the highest risk for a project is when a core developerleaves the community. This event can generate a big knowledge gap within theproject that should be mitigated as soon as such phenomenon is detected, for exam-ple promoting strong developers to become core developers. Since FLOSS projectsare constituted by the fundamental contributions of voluntary developers, delays inthe process of meritocratic promoting a strong developer to a core developer role(e.g. granting him or her the write permission on the Distributed VCS) can causedepartures of unsatisfied developers from the software community. Thus, a mecha-nism to early identify and monitor promising future core developers is indeed neededto ensure the successful evolution of FLOSS projects [64].
Turnover should be taken into account as it may results in a loss of productivity,personnel re-training and additional recruitment costs. In an industrial scenarioreplacing one worker may costs from three months to one year of salary, depend-ing of the worker needed skills [55]. Core members turnover should be consideredand handled by community maintainers as well, because a stable and healthy core
66

5.5. Social Network Analysis metrics
team is fundamental to ensure the stability of a FLOSS project [62]. Moreover,within the software engineering literature, turnover is considered as one fundamen-tal socio-technical quality measure which is necessary to understand a dynamicsand health of a development community. The inclusion of turnover metrics in oursocio-technical quality framework was further motivated by the fact that Cataldo etal. [15] empirically demonstrated that if a software development base is stable, thenthe socio-technical congruence of an organization will increase over time.
In our framework we considered the turnover of every community member presentin the global DSN and in the collaboration DSN (global.turnover, code.turnover)and the turnover of core community members of the global DSN , communica-tion DSN and collaboration DSN (core.global.turnover, core.mail.turnover,core.code.turnover).
A further metric present within our Socio-technical Quality Framework relatedto turnover of members, is the ratio of community members who left the communityand that were involved in at least one Community Smells in the previously consid-ered temporal range (ratio.smelly.devs). This metric can indicate to what extentCommunity Smells can imply negative effects within a development environment tothe extreme of causing the abandonment of the community by previously involvedmembers.
5.5 Social Network Analysis metrics
As exhaustively described in Section 2.2, during the last decade, empirical soft-ware engineering studies tended to consider and evaluate software development com-munities through the use of Social Networks, applying to them Social Network Anal-yses methodologies [31,32,36]. Meneely et al. [37] proved that socio-technical Devel-oper Social Networks created observing development artifacts are representative ofactual socio-technical relationships present in a software development community.Given the extensive presence of SNA studies in the empirical software engineeringresearch field, it was considered reasonable to include within the proposed Socio-technical Quality Framework some fundamental Social Network Analysis metricswhich are capable of offering an insight about a the structure of Developer SocialNetworks of a community and their characteristics.
Centralization. Centralization [65] is a Social Network Analysis metric thatcalculates the graph-level centrality score, based on node-level centrality measureof the entire considered graph. Centralization Social Network Analysis metric isfounded on the concept of nodes centrality, which is associated to the identificationof nodes which are most popular and that stand in the center of attention in apossible sociometric start concept within the network in analysis. Centralizationcan be considered as the extension of the node centrality concept to the whole
67

5. Socio-technical Quality Framework
network global level, as it refers to a network level indicator of the overall cohesionor integration of all the nodes of the network. Within our Socio-technical QualityFramework the following typologies of Social Network Analysis centrality metricswere considered for the global Developer Social Network [65]:
1. Degree centrality (degree.centr): this centrality metric was the first typologyof Social Network Analysis centrality metric defined in the SNA literature andit is founded on the counting of incident edges upon a social network node, thusit represents how many connections a single network node has. Degree SNAmetric represents the immediate possibility that a network node has of cap-turing an information freely flowing through the entire social network. Withindirected graphs it is possible to consider two different typologies of degree cen-trality, considering the incoming or the outgoing edges from a specific networknode, but as explained in Chapter 7 we considered every generated DeveloperSocial Network as an undirected graph so we are not interested by this furtherdistinction;
2. Closeness centrality (closeness.centr): this centrality Social Network Anal-ysis metric is defined upon the concept of shortest paths present within theconsidered social network, computed using a natural distance metric betweenevery pair of its network nodes. Closeness centrality SNA metric representsthe mean number of steps that an information has to take in order to reachevery other node belonging to the social network;
3. Betweenness centrality (betweenness.centr): this centrality Social NetworkAnalysis metric is based on the quantification of the number of times in whicha single network node acts like an informational bridge, thus the number oftimes in which it is present within the shortest path between two differentnetwork’s nodes. This Social Network Analysis metric is capable of detectingthe importance that each node has with respect to the relationships presentin the other network entire social network between different nodes.
Modularity. Modularity [66] is a Social Network Analysis metric that measuresthe strength of the structure of a community: high modularity indicates that aclear definition and distinction of different sub-communities within the considerednetwork exists, while when the network modularity tend to zero it indicates thatthere are no distinct sub-communities within the considered network. In the SocialNetwork literature it was identified a threshold of 0.3 for the modularity metric [66],over which a community is considered highly modular and thus in posses of a cleardistinction between sub-communities present in its development network. The in-clusion of modularity in the proposed framework was further motivated by Mockus’sstudy [13], who discovered that a higher modularity corresponds to a lower coordi-nation need. In our Socio-technical Quality Framework modularity was computed
68
5.5. Social Network Analysis metrics
not only for the global Developer Social Network (global.mod) but even for thecommunication DSN (mail.mod) and for the collaboration DSN (core.mod).
Density. Density [67] is a Social Network Analysis metric that indicates theratio of the number of edges connecting different network nodes with respect tothe total number of possible edges between every network’s nodes. This metricis fundamental to classify a social network as a dense or sparse graph. Density(density) is computed only for the global Developer Social Network within theproposed Socio-technical Quality Framework.
69

5. Socio-technical Quality Framework
70

Chapter 6
Survey
A survey was conducted among three well-known Open Source Software develop-ment communities. The main motivations and purposes that brought us to consider,design and execute a questionnaire are summarised in Table 6.1.
Although Social Debt and Community Smells were never mentioned during thesurvey execution, it was possible to gather vital information about them consideringdeveloper perceptions. Since the survey copes the existence and characteristics ofSocial Debt and Community Smells within FLOSS development communities, itconstitutes an important and fundamental contribution to the Social Debt researchfield by extending it with further notions and developer perceptions. This is thefirst questionnaire ever done to assess Social Debt characteristics and perceptionsfrom verified FLOSS community members, since we ensured that respondents of adevelopment community contributed to the project’s source code with at least onecontribution.
Generally speaking, considering the results obtained within the three referenceprojects, FFmpeg developers seem to be the most disillusioned with respect to theirproject’s characteristics and inner mechanisms. Respondents related to the FFmpegcommunity exhibited slightly intolerant behaviours toward core community membersand developers sponsored by commercial companies, perceived an important lack ofequality in developer opinion’s importance with respect to decisions and are very
Survey motivations and goalsValidate motivations, constituent theories and assumptions of this master thesis;Verify the existence of Social Debt and Community Smells in FLOSS communities;Support Social Debt and Community Smells discoveries and characterisation;Extract verified FLOSS developer perceptions about possible social related issues;Identify further quality metrics considered important by developers;Qualitatively detect the presence of Community Smells using developer perceptions;Validate empirical results obtained with Codeface4Smells analysis.
Table 6.1: Goals and motivations of the survey
71

6. Survey
upset about the documentation and the clarity of rules and structures of the project.In Section 6.1 we illustrate the structure of the questionnaire and its main sec-
tions, in which all proposed questions were subdivided. Section 6.2 summarisessome characteristics and background information of interviewees who participatedat the questionnaire. The existence of Social Debt within Open Source Softwaredevelopment communities and the validity of using mailing list in order to identifyCommunity Smells are verified in Section 6.3. Section 6.4 constitutes a fundamen-tal contribution of this master thesis as it verifies the existence and effectiveness ofCommunity Smells, proposed in Chapter 4, using respondents perceptions. Finally,Section 6.5 highlights the fundamental role that the survey results had on the iden-tification and definition of quality factors belonging to our Socio-technical QualityFramework.
The structure of the survey with the entire list of questions, the detailed charac-teristics of analysed projects and the complete representations of obtained responsesare presented in Appendix A.
6.1 The questionnaire
The questionnaire, designed specifically for our study, was composed by a list ofquestions aimed to address the aspects and goals reported in Table 6.1. Social Debtand Community Smells were never mentioned during the execution of the question-naire, in order to avoid biases in responses. The subset of proposed questions, whichcontains only the ones considered during our study, can be subdivided into threedifferent sections:
1. The first part of the questionnaire was composed by three general questions,with the purpose of addressing the background of questionnaire respondents,and four questions dedicated to the the relationships of respondents with his orher project community. The background information that respondents had tospecify during the questionnaire were: year of birth, country and occupation.Within this section, after specifying the community in which the respondentwas involved, it was asked to specify the role within the project community.The community and e-mail address specified within this section were used toverify that the respondent actually committed at least one software contribu-tion to the project’s source code.
2. The second part of the questionnaire was composed by four questions. In thissection we asked if the respondent’s participation within the FLOSS commu-nity was remunerated. Then, we tried to understand, between all possiblecommunicational channels, which channel was mainly used inside the respon-dent’s community. Thus, we were interested in the identification of the channel
72
6.2. Background of respondents
through which important project decisions were taken. Finally we tried to as-sess information and perceptions about possible Social Debt existence and itsrelated issues, questioning what respondents consider as the main cause of timewaste within their community during the development phases and the reasonof their longest wait occurred before a proposed commit was considered byproject maintainers.
3. The third part of the questionnaire, like the final part of its second section,was related to possible Social Debt and Community Smells aspects and per-ceptions, but it was composed by fourteen sentences and every respondent hadto specify his or her agreement with every proposed sentence. Agreement wascollected using the Likert scale, composed by the following options: stronglydisagree, partially disagree, neither agree nor disagree, partially agree andstrongly agree. In this part of the questionnaire we tried to capture devel-oper perceptions about the importance of developers sponsored by commercialcompanies and how much a project can be influenced by the absence of adeveloper or the absence of a core developer. We then proceeded to under-stand the perceived degree of formality and if the decisional power, withinFLOSS communities, was shared between every community member or it wasconcentrated within a limited group of members. In this part of the ques-tionnaire we tried to assess to information and opinions related to the qual-ity of development artefacts produced by communities, like the general andsoftware architecture documentations, and if eventual issues in such artefactsresulted in unofficial assumptions made by single developers. We analysed theperceived importance of communications before and after software develop-ment commit activities and then we moved forward considering the clarity ofcommunity rules and structures. Finally, we tried to capture the existenceof sub-communities within the three reference projects and understand somecharacteristics of such sub-communities, like communication behaviours, ho-mophily and antagonisms.
The list of questions considered and used in the elaboration of this master thesisare provided in the Appendix A, together with a detailed summary of receivedresponses relative to the third section of the questionnaire, grouped with respect tothe analysed communities.
6.2 Background of respondents
The list of FLOSS development communities initially considered was composedby 10 software projects, specifically selected to cover different combinations of thefollowing project characteristics:
73

6. Survey
1. Project size: a community is considered “big” if the total number of its commitsis above the average of the total number of commits of all considered projects,otherwise it is considered “small”;
2. Development activity: a community is considered “active” if the total numberof its commits during the last 12 months is above its average yearly commitsnumber (total number of commits / years of activity), otherwise it is consideredin “stall”;
3. Project relevance: a community has a “high” relevance if the total number ofmember involved in its development is above the average of the total numberof developers who contributed to the source code of all the considered projects,otherwise it has a “low” relevance.
The complete list of Open Source communities initially considered and the differentcombinations of factors characterising every project are reported in Table 6.2, whilea more detailed table explaining classification motivations can be found in AppendixA.
Project Size Activity RelevanceFirefox BIG ACTIV E HIGH
Android BIG ACTIV E HIGHWebKit BIG ACTIV E LOW
LibreOffice BIG STALL HIGHFFmpeg SMALL ACTIV E HIGH
OpenSSL SMALL ACTIV E LOWLibreSSL SMALL ACTIV E LOW
AngularJS SMALL STALL HIGHKhtml SMALL STALL LOWlibva SMALL STALL LOW
Table 6.2: Projects initially considered for the survey
Considering the characteristics of all initially considered projects, we decidedto explicitly target our survey toward three well-known FLOSS development com-munities, which covered almost every sampling combination reported in Table 6.2.The three reference projects which were the subjects of our survey are: Firefox,LibreOffice and FFmpeg.
To achieve a higher diversity of developer typologies who contributed in any pos-sible way and in different temporal instants to every considered project, from projectmaintainers to once in a life time contributors, we extracted from the VCS of everyconsidered project the entire list of authors of software contributions committed inthe entire life time of a project. Such list was extracted using a git command con-sidering every unique e-mail address present and every e-mail in an invalid formatwas removed with a regular expression (see Appendix A for further information).
74

6.2. Background of respondents
The questionnaire was created using Google Forms and it was available fromthe 15th of February 2016 to the 5th of March 2016, for a total of 20 days. Thelink to the questionnaire and a short introduction were sent to every extractedunique e-mail. To avoid any possible bias, Social Debt and Community Smells werenever mentioned during the questionnaire or in its introduction and the survey wasintroduced as a general FLOSS questionnaire. To mitigate the side effects of thisgeneralisation, Open Source developers participation was stimulated offering as aprise two Amazon gift cards of the value of 25 dollars each (total jackpot 50$). Thetwo prizes were assigned to two randomly extracted participants few weeks afterthat the survey time window ended.
(a) Community (b) Age
(c) Occupation (d) Role
Figure 6.1: Survey results (part one)
A total of 5169 unique valid e-mail addresses were extracted and contacted fromthe Version Control Systems of the three reference projects, subdivided as follows:1057 valid e-mails of LibreOffice developers, 1162 valid e-mails of FFmpeg developersand 2950 valid e-mails of Firefox developers. At the end of the survey we collected atotal of 59 valid responses. A response was considered valid if and only if the e-mailaddress specified by the respondent was present in list of committer e-mails of thecommunity specified within the same response.
75
6. Survey
As showed in Figure 6.1a, the 59 valid responses obtained from our intervieweeswere divided between reference projects as follows: 33 replies from Firefox com-munity which constitute the 55.93% of total valid replies, 14 replies from FFmpegcommunity which constitutes the 23.73% of total valid replies and 12 replies fromLibreOffice community which constitute the 20.34% of total valid replies.
In the following are presented the results related to the first section of the ques-tionnaire, in order to achieve a better understanding of the background of the inter-viewees and validate the representativeness of survey responses. All the replies wereconsidered as a whole and not subdivided into a finer grain level, considering everysingle community.
Moving to generational characteristics of survey respondents, summarised in Fig-ure 6.1b, we concluded that almost half of interviewees were in the range of agebetween 26 and 35 years old (50.85%). Developers younger then 25 years old anddevelopers with an age between 36 and 50 years old were both almost equivalentlyrepresented by one quarter of the total respondents, while developers over the ageof 50 years old represented only the 5% of the total respondents. We consideredthis subdivision as a reasonable representation of developers’ ages in the FLOSSecosystem.
Figure 6.1c helps to understand the working status of the survey interviewees.The majority of respondents had a full-time job (69.49%), while a small part of themhad a part-time job (8.47%). One out of four developers identified himself or herselfas a student (20.34%) and a small part of the interviewees did not have a job norwere students (1.69%).
Moreover, we asked respondents to specify if their contribution to the projectwas on a voluntary base or if their involvement within the project community wassponsored, in any form, by a commercial company. Globally we retrieved that al-most three developers out of four participated in FLOSS development without anymonetary interest (71.19%); considering the three reference communities, this pa-rameter was a bit fluctuating from a minimum of 57.14% of FFmpeg community toa maximum of 78.77% of Firefox community. Moving to waged development con-tributions, the percentage of developers whose involvement within a FLOSS com-munity was completely supported by a commercial company is 23.73% of the totalrespondents and it was stable within all the reference projects (Firefox: 21.21%;LibreOffice: 25%; FFmpeg: 28.57%). Developers who were paid only partially bya commercial company to contribute to one of the considered projects constitutedthe 5.08% of the total interviewees and its distribution between the three referenceprojects was very different: none of Firefox community respondents was partiallypaid by a company, while considering the other projects: 8.33% of LibreOffice de-velopers and almost the double (14.29%) of FFmpeg developers stated that theircontributions were partially paid by a commercial company.
76

6.2. Background of respondents
An interesting aspect inspected by our questionnaire, in order to verify the rep-resentativeness of received replies with respect to different possible developmentbehaviours and tasks, was the role of respondents within their FLOSS developmentcommunity. As expected, given the modalities through which we retrieved the de-velopers information, the majority of respondents classified themselves as developers(71.19%). An important fraction of interviewees specified their status of softwareengineer (11.86%), while just a small part of the respondents stated that they werethe maintainers of the project (1.69%). Moving toward less technical tasks, we re-ceived replies from translators (3.39%) and a considerable amount of responses frominterviewees that were not able to identify themselves in any of the previously listedcategories (11.86%). Figure 6.1d presents a graphical representation of respondentroles distribution with their related percentages.
Country # respondents Percentage Country # respondents PercentageUnited States 9 15.25% Canada 1 1.69%
Germany 7 11.86% China 1 1.69%France 7 11.86% Estonia 1 1.69%U.K. 5 8.37% Spain 1 1.69%
Brazil 4 6.78% Finland 1 1.69%India 4 6.78% Italy 1 1.69%
Austria 3 5.08% Kazakhstan 1 1.69%Belgium 2 3.39% Romania 1 1.69%Poland 2 3.39% Russia 1 1.69%Sweden 2 3.39% Tunisia 1 1.69%Taiwan 2 3.39% Venezuela 1 1.69%
Argentina 1 1.69%
Table 6.3: Nationalities of survey respondents
The questionnaire had a predominant participation of developers based in theUnited States of America (15.25%) and in Europe, in which the most representedcountries were Germany (11.86%), France (11.86%) and United Kingdom (8.37%).The geographically distribution of the survey respondents can be considered quitehigh since we collected replies coming from 23 different countries of the world, whichare represented with their related number of replies and the associate percentage ofthe total responses in Table 6.3.
Considering the background information of respondents, it was possible to statethat our survey involved developers of every age, geographic location, occupationand characterised with different roles within FLOSS development communities. Inconclusion, these results provide the confirmation that retrieved survey responsescan be considered enough heterogeneous and diversified to be representative of theentire FLOSS ecosystem.
77
6. Survey
6.3 Confirmatory role
The obtained replies allowed us to verify some assumptions made during the ex-ecution of this master thesis, avert possible threats to validity of this study and sup-port the existence of Social Debt from the view point of developer perceptions dueto socio-technical related issues within FLOSS development communities. There-fore, this section has the fundamental goal of motivate and justify this master thesisresearch questions, as it verifies the existence of Social Debt within FLOSS commu-nities through developer perceptions.
As extensively explained in Chapter 4 and Chapter 7, during the execution ofthis master thesis, we relied on Developer Social Networks extracted from FLOSSprojects’ mailing list archives, in order to capture communication habits and socialaspects of a community’s organisational structure. Even if in the literature there aremany empirical software engineering studies that use mailing list archives to achievesuch goal (listed in Section 2.4), in order to verify the effectiveness and demonstratethe validity of our decision of using mailing lists to compute communication DSNsand avoid possible threats to validity, we investigated which communication channelwas the most used in FLOSS communities to settle important project decisions.Thus, we were interested in the identification of the communication channel in whichthe decisional component was most prominent within Open Source developmentcommunities.
A detailed representation of retrieved responses related to this analysed aspectcan be seen in Figure 6.2c. Our detections revealed that mailing lists are yet themain communicational channels used when it comes to decision making in FLOSScommunities, as it was specified by 40.68% of the total questionnaire respondents,while on the basis of individual reference projects the minimum percentage wasachieved by Firefox community with 27.27% of its total interviewees, followed bythe 41.67% of LibreOffice community and FFmpeg community registered an out-standing agreement of 71.43%. Given such results we verified that it is reasonableto consider mailing lists as the main communication channel through which extractFLOSS developers formal relationships and development communications. Mailinglists are then the best candidates to be mined with the scope of generating commu-nication Developer Social Networks and we provided a real world confirmation forour assumption, which is proved to be valid.
We further investigated if FLOSS developers perceived specific socio-technicalissues that can potentially generate Social Debt within an Open Source Softwaredevelopment community and to what extent social related issues were perceived asimpediments with respect to every software development cycle phase.
We asked to respondents to specify the reason of their longest wait before one oftheir software contribution to the project’s source code was considered by maintain-
78

6.3. Confirmatory role
(a) Time waste motivation (b) Contribution approval delay motivation
(c) Important decisions channel
Figure 6.2: Survey results (part two)
79
6. Survey
ers; responses are represented in Figure 6.2b. With respect to this specific softwaredevelopment phase, as expected technical related issues were predominant and iden-tified by the 28.81% of the total responses. We also detected the importance of so-cial related issues, represented in the questionnaire through the unavailable projectsmaintainers option, that globally constituted the 27.12% of the total responses. Thisimportant result supported our research goal and provides the evidence that socialrelated issues captured by Community Smells can cause actual delays and thus theydo generate Social Debt. Considering in detail all the reference projects: LibreOfficeconstituted the perfect representation of this equivalent relevance of technical andsocial issues since both of them were selected by the 16.67% of the project respon-dents, FFmpeg issues related to the maintainer unavailability were not consideredpredominant (14.29%), while social related issues were considered the causes of mostof the delays in software contribution evaluation activity within the Firefox com-munity (36.36%), for which they were even more relevant than the technical ones(33.33%). If we consider long decisional processes as a social related issue, then thepercentage of global developers who identified social aspects of FLOSS developmentas the cause of delays in the software contribution phase reaches the important valueof 35.59%, constituting one third of the entire survey sample. It is necessary specifythat, at global level, almost one respondent out of four (23.73%) stated that he orshe did not remember or did not know the reason of his or her longest wait until aproposed contribution was considered by the project’s maintainers. This uncertaintycan be the symptom of unhealthy FLOSS development characteristics, which caneventually generate mistrust and project abandonment, thus generating indirectlySocial Debt. This consideration can be an hint for future Social Debt studies withinFLOSS environments.
One of the most relevant questions of the entire second section of the question-naire was addressed to capture the major causes of time waste within any phaseof a project development. Figure 6.2a shows such results at global level and at afiner grain level, subdividing the responses for every single reference project. Aboveall the possible answers, project disorganization appeared to be the main disadvan-tage that caused time waste within all the considered projects, reaching the 27.12%of global responses with a minimum value of 16.67% inside LibreOffice communityand an impressive maximum value of 50% inside FFmpeg community. The follow-ing important motivations, identified as possible delay generators within a FLOSSdevelopment environment, received the same amount of responses from all the inter-viewees: bad software design and communication delays. In contrast to the generalconcept of communication delays, agreement delay was considered the most impor-tant reason of time wasting from 15.25% of total respondents and this percentagewas stable in every reference project. Unreasonable software release deadlines andother non specified motivations registered a total of 10.17% each. If we consider
80

6.4. Validity of Community Smells
together the delays due to agreement or generally related to communication needs,the considerable value of 33.89% of total responses is reached: these typologies ofdisadvantages imply inefficient communication and organisational structures or un-healthy habits, which are the basic assumptions at the foundation of Social Debttheory. Since the project organisation is the representation of the developer so-cial structure, we can consider even project disorganisation motivation to FLOSSdevelopment communities delays as a social related issue, thus, a total of 61.01%of the global responses suggested that social related issues are the main causes oftime waste within any phase of Open Source Software development process. Thisresult supports our research questions, guarantees and verifies the effective existenceand presence of Social Debt in Open Source Software communities and its intrinsicnature of being ubiquitous and not limited to a specific development activity.
6.4 Validity of Community Smells
The conducted survey was conceived with a set of questions with the purpose ofcollecting Open Source developer perceptions related to potential socio-technical is-sues, in order to verify the effectiveness and validity of Community Smells definitionsand proposed identification patterns, proposed in Chapter 4.
Delays were considered the main reason of time waste within any project activityby the 33.89% of total respondents: while the 18.64% blamed communication relateddelays as the most impacting source of delay, the remaining 15.25% believed thatthe most debilitating typology of delay was caused by agreement activities.
Agreement delays were specified within all the three reference projects by analmost constant percentage of respondents and it was classified as the fourth mostimportant time waste motivation, therefore this finding verifies the existence of Ra-dio Silence Community Smells within FLOSS development ecosystem, since it isone of the explicitly defined side effects of such Community Smell. Communica-tion delays, instead, verify the existence of Black-cloud Effect, Prima-donnas Effectand, in a more relevant manner, Radio Silence Community Smells because all theirdefinitions are associated to the presence of unique communication and knowledgeconveyors between different sub-communities; thus, communications directed out-side a sub-community will be negatively impacted by all the three listed typologies ofCommunity Smells, generating communication delays. Conversely to agreement de-lays, the percentage of respondents belonging to different communities who selectedcommunication delays as the main cause of time waste in any community activ-ity, was very fluctuating in reference projects: from the minimum value of 7.14%achieved by FFmpeg community to the maximum of 27.27% of Firefox community.
It was recognised by three out of four global respondents (75%) that the absenceof a developer can stall some community activities. Therefore, this finding surely
81
6. Survey
verifies the validity of Black-cloud Effect, Prima-donnas Effect and Radio SilenceCommunity Smells Community Smells, as they are characterised by the presence ofunique communication and knowledge conveyors between different sub-communitieswithin Open Source Software communities. Radio Silence is probably the Commu-nity Smell that is most verified by this result, as its definition is completely basedon the concept of unique boundary spanners and problems related to their absenceor due to overload of their capacities. The level of agreement with respect to thisanalysed aspect was slightly variable within reference projects: from the minimumvalue of 58% of LibreOffice community to the maximum value of 86% of FFmpegcommunity.
One of the agreement statements proposed in the questionnaire had the targetof capturing developer perceptions about a potentially high degree formality withintheir software development community. The global responses suggested that, gen-erally speaking, every developer had a personal perception about the formality levelof his or her community, as the number of agreement, disagreement and neutralityresponses were equally distributed.
The perception of community’s rules and its constituent structure can be con-sidered as another aspect that can represent a triggering factor of Radio SilenceCommunity Smell due to a high level of formality and complexity, as it can be re-lated to how developers perceive and understand their community’s organisationalstructure. Globally, FLOSS development community rules and structures were per-ceived as sound and clear by almost 60% of the total respondents. While LibreOfficeand Firefox respondents exhibited a similar agreement distribution, FFmpeg projectrecorded the most negative record between all reference projects. The global per-centage of disagreement was constituted by the 15% of total responses, but it wascharacterised by a high fluctuation level within the three reference projects: Libre-Office community did not record any disagreement responses, Firefox communityreached a value of 12% and FFmpeg community was characterised by the negativerecord of 38% of disagreement responses. Therefore, the potential presence of RadioSilence Community Smell within FLOSS communities is further demonstrated.
One out of four of total respondents declared that he or she did assumptionsduring development activities due to unclear requirements or documentation; thisdeveloper tendency was stable in Firefox and FFmpeg communities, characterisingthe behaviour of the 21% of respondents of each project, while LibreOffice was thereference community with the highest rate of developers who did assumptions withintheir developers activities, reaching a total of 42% of its respondents. Potentially,assumptions performed by single developers can degenerate into autonomous de-sign and architectural decisions which are not expected, documented and performedwithout the necessary authority or knowledge. Therefore, Organisational Silo Effect,Missing Links and Black-cloud Effect Community Smells existence is verified by this
82

6.5. Quality factors identification
result, as it is one of the possible triggering factors of such Community Smells.Within the proposed questionnaire, four different agreement sentences were present
in order to capture developer perceptions about Community Smells related to thepresence of sub-communities within a community and their behaviours: Black-cloudEffect, Prima-donnas Effect and Radio Silence. In order to verify the existenceof previously listed Community Smells and support their identification patternsthrough the mean of sub-communities detection, as proposed in Chapter 4, it wasnecessary to verify that sub-communities actually exists and within FLOSS devel-opment and that community members perceive the existence of such CommunitySmells; this condition was verified by the questionnaire results since the 47% oftotal respondents indicated that their reference development community was con-stituted by different subgroups. From the results of the executed survey it wasevident that, within Open Source Software communities, sub-communities tend tocommunicate with each other, as only the 12% of total respondents believed thatdifferent subgroups rarely communicate within a software development community.Therefore, this result may indicate an exiguous number of occurrences of Black-cloudEffect and Prima-donnas Effect Community Smells.
Moreover, 36% of total respondents was convinced that every sub-communityis composed by members with a similar mindset and that they behave as a littlestand-alone community inside the actual community, thus the existence of Black-cloud Effect and Prima-donnas Effect Community Smells within FLOSS developmentcommunities is further verified.
An additional hint that may indicate an exiguous number of occurrences ofBlack-cloud Effect and Prima-donnas Effect Community Smells within Open SourceSoftware development communities derives from the 14% of total respondents thatbelieved that different sub-communities can be antagonists, while the 51% of themdenied the existence of such phenomenon. This result suggests that sub-communitiestend to collaborate and not isolate themselves, thus it is possible to assume thatBlack-cloud Effect and Prima-donnas Effect are quite rare in FLOSS developmentcommunities.
6.5 Quality factors identification
The survey had a fundamental role even in the identification of some socio-technical quality factors considered important by Open Source Software developersand, thus, that had to be included within our Socio-technical Quality Frameworkproposed in Chapter 5.
A couple of results obtained within the third part of the questionnaire were veryimportant to suggest the introduction of quality factors founded on the identificationof core and peripheral community members. Therefore, every socio-technical quality
83

6. Survey
metric that distinguish between peripheral community members and core communitymembers (e.g. turnover) is motivated by the two following findings:
1. While 75% of total respondents believed that the absence of a developer canstall some community activities, if the absent developer is a core developersuch result increased and reached the 80% of agreement level. It importantto highlight that such result was due to a decrease of its disagreement level,that passed from the 8% to the 3%. In is interesting to notice that FFmpegwas the only reference project that exhibited a counter-current behaviour withrespect to the others reference projects, as its community members believedthat the absence of general community members was more problematic thatthe absence of core developers, with an impressing margin of 7%;
2. Even if FLOSS communities are usually characterised by open, collabora-tive and welcoming development environment, the idea that they representa democracy in which every community member has the same importance, isstill an utopia and it cannot be considered a world-wide reality. Only 34% oftotal respondents believed that every opinion is equal in important project de-cisions, while almost one out of two respondents (49%) denied the existence ofthis equality and democratic value within Open Source Software community.
An additional contribution, obtained from the results of the questionnaire, to thedefinition of our Socio-technical Quality Framework suggested the importance of theidentification of community members supported by commercial companies or whocan be considered self-employed with respect to a software project. The inclusion ofquality factors related to the identification of sponsored developers was motivatedby the 63% of total respondents who specified their belief that developers sponsoredby commercial companies increased the health of a project and because only the 8%of the global sample was in disagreement with such opinion.
The quality factors introduced in the out Socio-technical Quality Frameworkrelated to the identification of core developers are explained in details in Section5.3, while the ones introduced due to the importance of developers sponsored bycommercial companies within FLOSS development communities are described inSection 5.1. In this master thesis these two typologies of socio-technical qualityfactors were associated to the identification of a total of 19 different socio-technicalquality metrics. Therefore, the conducted questionnaire, in conjunction to the studyof software engineering literature, had a fundamental role in the definition of theproposed Socio-technical Quality Framework.
84

Chapter 7
Operationalising our QualityFramework: Codeface4Smells
This chapter presents Codeface4Smells, our software contribution to performsocio-technical analysis, compute quality factors defined in Chapter 5, identify andquantify Community Smells exploiting identification patterns defined in Chapter 4and empirically detect relevant correlations between socio-technical quality factorsand Community.
Codeface4Smells offers a lens to observe software development communities froma quality perspective and diagnose organisational issues in an automated tool-supportedfashion. Therefore, it can be used for continuous Community Smells managementand improvement.
Section 7.1 presents Codeface, the software project used as a development baseto implement our tool. The architecture and inner workings of Codeface4Smellsare explained in Section 7.2. Finally, details related to the operationalization ofidentification patterns of Community Smells and of socio-technical quality factorsare presented respectively in Section 7.3 and Section 7.4.
7.1 Codeface
Codeface is an Open Source “framework and interactive web front-end for the so-cial and technical analysis of software development projects” [68], which is capableto retrieve and analyse collaboration and communication relationships of a soft-ware development community using different software development artefacts (Ver-sion Control Systems and mailing lists). Codeface was created in 2010 by WolfgangMauerer and most of its developed is internally executed and sponsored by Siemens.It is written mainly using python and R and it is released under the GNU GeneralPublic License v2.0.
Codeface analysis results can be useful to learn more about an embedded soft-
85

7. Operationalising our Quality Framework: Codeface4Smells
ware ecosystem and all the retrieved information about a software project may helpto understand and exploit collaboration and communication patterns and charac-teristics, highlight development issues and assist maintainers in project control andmanagement activities.
Codeface is composed by a variety of modules and components which cooperateand collaborate with each other, the most important are:
• An interactive web front-end to easily monitor and visualise analysed projects.It enables the possibility to assess retrieved information at different levelsof details, from management summaries (communication, collaboration, con-struction, complexity) down to raw data, supporting direct comparisons ofprojects;
• An analysis framework with minimal configuration needs that can scale evento large software projects;
• An holistic database that allows complex insightful queries by coherently inte-grating all available data sources;
• A framework to execute quantitative analysis and objective classification ofsocial aspects of software development.
Codeface implements an interactive web front-end which allows any user to dy-namically modify its views to adapt them to every evaluation needs and personalpreferences. Codeface web front-end provides three main levels of details: overviews,summaries and raw data. The web front-end of Codeface provides an overview withgeneral information related to a considered project and a concise representation ofthe project’s status with respect to its complexity, construction, communicationsand collaborations.
While the concise overview summarises the results of different categories evalu-ations, which are useful to formulate an idea about a project’s strengths and weak-nesses, the detailed summary enables to examine the status of one specific projectarea and see its related analysis. At a lower level, raw data allow to exam a projectarea in depth.
Some characterising features of Codeface are:
• Central contributors are detected using their social influence and not onlystatic measures;
• Many available approaches to compute collaboration relationships from Ver-sion Control Systems;
• Text mining usage in communication analysis to detect most active discussiontopics and discussion culture;
86

7.1. Codeface
• Classification of active and passive contributors in the mailing lists;
• Different clustering algorithms used to detect closely interacting communitiesand their evolution over time;
• Range of traditional software engineering code metrics;
• Time series analysis (e.g. growth data, complexity behavior, communicationvolume) to estimate trends, determine regularity and self-consistency;
• Page-rank analysis to evaluate developers influence, thus not relying just tototal commit count;
• Community detection;
• Time zone analysis.
Figure 7.1: Architecture of Codeface
The software architecture of Codeface, as showed in Figure 7.1, is constituted bythe following layers:
1. Common layer: constituted by common routines, SQL abstraction, projectsconfiguration and logging functionalities;
2. Mailing lists analysis: performs communication analysis;
3. Version Control Systems analysis:
• Timing analysis: computes evolutionary project metrics (e.g. number offiles);
• Collaboration analysis: creates the developer network and execute clusteranalysis.
Codeface can generate a collaboration Developer Social Network using the followingcollaboration detection techniques:
• Proximity analysis: developers are linked when their commits are in closeproximity (e.g. same file and nearby line numbers);
87
7. Operationalising our Quality Framework: Codeface4Smells
• Committer2Author analysis: developers are linked with directional relation-ships extracted from the committer and the author meta-data of every com-mit;
• Tag analysis: developers are linked with directional relationships extractedfrom tags placed in every commit (e.g Signed-Off, Acked-by, Reviewed-by);
• Function analysis: developers are linked considering proximity of their com-mits within the same function of a file;
• Feature analysis: developers are linked consider proximity of their commitswithin the same feature (unlike functions, features are split across differentfiles).
In our work we used Codeface exclusively to exploit its capabilities of extraction andgeneration of Developer Social Networks from communication and collaboration soft-ware development artefacts of FLOSS development communities. We extended itsfunctionalities introducing a brand new socio-technical network analysis layer, con-stituted by a Socio-technical Quality Framework and a Community Smells detectionand quantification mechanism.
7.2 Architecture of Codeface4Smells
Codeface4Smells is build on top of Codeface’s software source code, thus it canbe considered as an extension of Codeface, and it has the purpose of introducingsoftware enhancements and new socio-technical analysis and Community Smellsdetection capabilities. Considering the architecture of Codeface with the additionof Codeface4Smells extension, represented in Figure 7.2, it is possible to concludethat Codeface4Smells constitute a bran new software layer, which resides on topof all the already present Codeface architecture layers, and that its socio-technicalanalysis capabilities are enabled by Codeface’s communication and collaborationanalysis outputs.
Codeface4Smells main contributions are:
1. Creation of a global Developer Social Network, generated from thecombination of communication and collaboration Developer Social Networks.This innovation implies the possibility of a finer-grained socio-technical anal-ysis of a software project development ecosystem, by considering at the sametime both the technical and social relationships between community membersand not as two isolated and independent parts of the development process, aspreviously conceived in Codeface;
2. Introduction of automatic ranges detection to analyse at most the lastthree years of a project considering three months windows;
88

7.2. Architecture of Codeface4Smells
Figure 7.2: Architecture of Codeface with Codeface4Smells extension
3. Identification of sub-communities within the global, communication andcollaboration Developer Social Networks. Codeface provided the identificationof sub-communities within its collaboration analysis but it was necessary to re-implement this functionality with a different approach in order to support thisfeature outside the collaboration analysis, extend it to other DSN typologiesand consider the undirected nature of generated networks;
4. Identification of core developers within the global, communication andcollaboration Developer Social Networks. This feature was already presentin Codeface but it was limited to collaboration analysis and thus it was nec-essary to modify its implementation to support our socio-technical analysisimplementation and extend it to to the other DSN typologies and to the undi-rected nature of generated networks;
5. Identification of developers supported by commercial companies orself-employed within a project development community;
6. Introduction of our Socio-technical Quality Framework to gather moreinformation about socio-technical characteristics of a software project devel-opment environment and its community. It is presented in details in Section7.4;
7. Detection and quantification of Community Smells which may indicatethe presence of Social Debt within the project development. It is presented indetails in Section 7.3;
8. Correlation analysis (Pearson and Spearman) execution between socio-technicalquality factors and the occurrence of Community Smells;
9. Reports and graphs generation to simplify access to socio-technical andCommunity Smells analysis results.
89
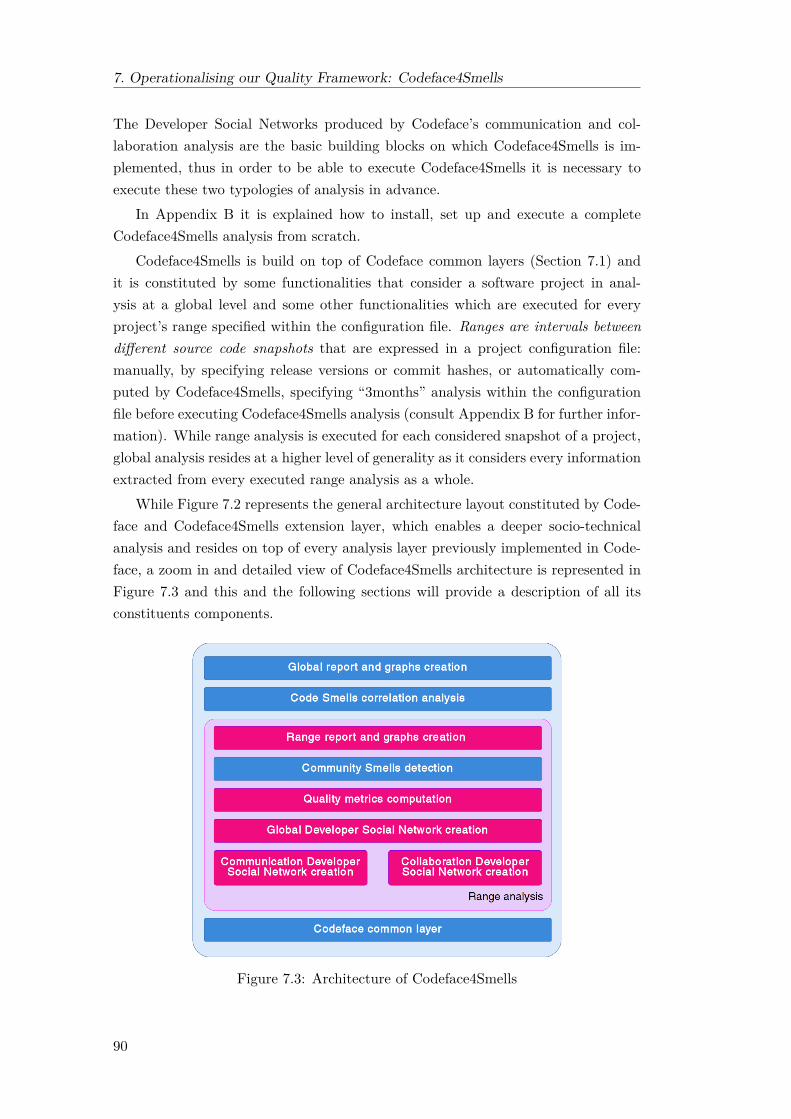
7. Operationalising our Quality Framework: Codeface4Smells
The Developer Social Networks produced by Codeface’s communication and col-laboration analysis are the basic building blocks on which Codeface4Smells is im-plemented, thus in order to be able to execute Codeface4Smells it is necessary toexecute these two typologies of analysis in advance.
In Appendix B it is explained how to install, set up and execute a completeCodeface4Smells analysis from scratch.
Codeface4Smells is build on top of Codeface common layers (Section 7.1) andit is constituted by some functionalities that consider a software project in anal-ysis at a global level and some other functionalities which are executed for everyproject’s range specified within the configuration file. Ranges are intervals betweendifferent source code snapshots that are expressed in a project configuration file:manually, by specifying release versions or commit hashes, or automatically com-puted by Codeface4Smells, specifying “3months” analysis within the configurationfile before executing Codeface4Smells analysis (consult Appendix B for further infor-mation). While range analysis is executed for each considered snapshot of a project,global analysis resides at a higher level of generality as it considers every informationextracted from every executed range analysis as a whole.
While Figure 7.2 represents the general architecture layout constituted by Code-face and Codeface4Smells extension layer, which enables a deeper socio-technicalanalysis and resides on top of every analysis layer previously implemented in Code-face, a zoom in and detailed view of Codeface4Smells architecture is represented inFigure 7.3 and this and the following sections will provide a description of all itsconstituents components.
Figure 7.3: Architecture of Codeface4Smells
90

7.2. Architecture of Codeface4Smells
Codeface4Smells analysis is enabled, in addition to Codeface’s collaboration andcommunication analysis as previously explained, by the general Codeface utilitylayer. This fundamental layer of Codeface is composed by low level functions capableof providing basic but useful functionalities as database connections, communicationand collaboration specific database query executions and information retrieving of aproject’s configuration. We modified this low level layer of Codeface, that is sharedwithin every typology of analysis, in order to allow the selection of socio-technicalanalysis performed by Codeface4Smells, compile produced LATEX output to obtainPDF report files and enhance query and computational tasks capable of performingdifferent range analysis functionalities.
Whenever Codeface4Smells analysis is started, it uses Codeface’s common layerin order to extract the configuration of the project in analysis, its list of snapshots(ranges) to consider and the directory that contains Codeface’s communication andcollaboration analysis outputs. As soon as the list of ranges that have to be analysedis known, each range is analysed separately but in succession, because in order tocompute some socio-technical quality factors (e.g. turnover) or some CommunitySmells (e.g. Black-cloud Effect) it is necessary to consider historical informationextracted from previously analysed ranges. The sequence of steps that compose asingle range analysis is summarised within the magenta coloured box of Figure 7.3and its phases will be explained in the following.
A specific range analysis starts with the generation of the communication Devel-oper Social Network. The date of the start and the end of the range to be consideredare used to query Codeface’s database in order to retrieve the edge list of every com-munication that occurred within the considered time lapse. Every element of suchedge list is composed by a triplet of values that summarises the identifiers of twocommunity members and the number of communications that were initiated by thefirst community member toward the second community member within the analysedrange. If the communication channel was never used within the considered range weterminate Codeface4Smells analysis since it is impossible to achieve a meaningfulsocio-technical analysis without such fundamental data. The communication Devel-oper Social Network is defined as an undirected graph, in order to achieve a highergeneralisation level of a project’s organisational structure and thus the number ofe-mail messages exchanged between two community members is maintained as theweight of the link that connects the two community members within the commu-nication DSN. The generated communication Developer Social Network undergoesa further processing phase that has the target of simplifying the previously gener-ated network, by removing multiple edges and loops and substituting such identifiedmultiple edges with one unique edge characterised by the weight resulting from thesum of all weights of deleted edges.
The data of a specific range necessary to create the communication Developer
91
7. Operationalising our Quality Framework: Codeface4Smells
Social Network are extracted from the adjacency matrix file generated by Codeface’scollaboration analysis. Such text file is a representation of a square matrix in whicheach row/column represents a community member who contributed to the sourcecode of the project in analysis within the considered software snapshot and theintersection element between a row and a column of the matrix represents the numberof collaborations between the two developers identified by the relative row/columnidentifiers. Codeface4Smells exploits the retrieved adjacency matrix to generate thecollaboration Developer Social Network of the analysed range, using the numberof collaborations as edge weights, nullifying the diagonal of the matrix becausethe number of developer self-collaborations are not considered interesting withinour socio-technical analysis and considering an undirected network approach, inorder to achieve a higher generalisation level of a project’s collaboration habitsand behaviours. Similarly to the communication Developer Social Network creationprocess, the generated collaboration DSN undergoes to a simplifying functionalitythat removes multiple edges and loops and substitutes such identified multiple edgeswith one unique edge characterised by the weight resulting from the sum of all theweights of deleted edges.
The availability of communication and collaboration Developer Social Networksenable the further generation of the global Developer Social Network, that is consti-tuted by merging together the two previously computed networks. Such functionalityhad to be implemented from scratch in Codeface4Smells and the fusion process isperformed using the communication DSN as a base, since usually it is constitutedby the greater number of community members, to which are added the project’sdevelopers who were not present in the communication channel and, once everycommunity member present in any considered development phase is present withinthe global DSN, an edge fusion functionality is executed in order to characterise theweight of every edge between two community members of the global DSN as thesum of communication and collaboration edges between the same two consideredcommunity members within the communication and collaboration Developer SocialNetworks. Once again, the generated global Developer Social Network undergoesto a simplification functionality in order to remove multiple edges and loops and itsubstitutes such identified multiple edges with one unique edge characterised by theweight resulting from the sum of all the weights of deleted edges. Therefore, theweights of edges belonging to the global DSN correspond to the sum of total num-ber of collaborations and total number of communications between two communitymembers.
Since some quality factors and Community Smells require the identificationof sub-communities within the three generated Developer Social Networks, Code-face4Smells identifies the cluster (sub-community) of membership of every commu-nity member within all the three typologies of considered DSNs. Every commu-
92

7.2. Architecture of Codeface4Smells
nity detection algorithm is characterised by a different approach and performance,therefore in 2014 Sousa et al. [69] conducted a study in which different commu-nity detection algorithms, implemented and available within the igraph suite (usedby Codeface4Smells), were deeply analysed and ranked according to their perfor-mances in different possible scenarios. The results obtained by de Sousa et al.demonstrated that Walk-trap algorithm outperforms every other considered com-munity detection algorithm, followed by multi-level algorithm and highlighted howSpin-glass approach is highly influenced by the number of nodes that constitute anetwork and its fragmentation degree, thus if network’s modularity is low or thenumber of nodes increases, its performance degrades. Codeface’s collaboration anal-ysis provided a community detection functionality based on Spin-glass but in order toharmonise sub-community identification functionality to all the typologies of DSNsconsidered by Codeface4Smells, support undirected Developer Social Networks withedges weights and given the results obtained by de Sousa et al. [69], Codeface4Smellscomes with a new feature that exploits Walk-trap detection algorithm implementedwithin the igraph package of R language to detect sub-communities within everygenerated Developer Social Networks.
The analysis of a project’s range proceeds with the computation of quality factorsbelonging to the Socio-technical Quality Framework defined in Chapter 5, explainedin details in Section 7.4, and with the identification and quantification of CommunitySmells presented in Chapter 4, explained in details in Section 7.3.
The range analysis terminates with the creation of a report file that summarises,through the mean of graphs, the generated Developer Social Networks and Commu-nity Smells detected by Codeface4Smells. Figure 7.4 represents a real life example ofa project’s range analysis report file. Considering the report analysis of the proposedexample, it is possible to see how communication and collaboration Developer SocialNetworks (Figures 7.4a and 7.4b) are merged together into a global DSN (Figure7.4c) and, within the same images, it is possible to recognise community membersbelonging to different sub-communities, with respect to every DSN typology, con-sidering the colour of every node. The other graphs present within the report fileare related to Community Smells identified within the range in analysis. If Code-face4Smells did not discover any occurrence of a considered Community Smell then amessage will be displayed, otherwise a visual representation of detected CommunitySmell occurrences will be displayed with the following characteristics, related to theCommunity Smell typology:
1. Organisational Silo Effect (Figure 7.4d): This graph represents a version ofthe collaboration Developer Social Network in which every couple of commu-nity members that constitute an identified Organisation Silo is highlighted andlimited by colourful ellipses. Every developer involved in at least one Organi-sation Silo is coloured in red, while all the other developers are transparent;
93

7. Operationalising our Quality Framework: Codeface4Smells
(a)C
omm
unicationD
SN(b)
Collaboration
DSN
(c)G
lobalDSN
(d)O
rganisationalSiloEffect
(e)M
issingLinks
(f)B
lack-cloudEffect
(g)Prim
a-donnasEffect
(h)R
adioSilence
Figure7.4:
Example
ofrangeanalysis
report
94

7.2. Architecture of Codeface4Smells
2. Missing Links (Figure 7.4e): Same convention as Organisation Silo Effect;
3. Black-cloud Effect (Figure 7.4f): This graph represents all the communica-tion links that were identified as occurrences of a Black-cloud Effect, thereforeit shows the community members involved in at least one Black-cloud Effectas nodes coloured in yellow and they are connected through red edges repre-senting the indicted Black-cloud links;
4. Prima-donnas Effect (Figure 7.4g): This graph represents a version of thecommunication Developer Social Network in which every sub-community in-volved in at least one Prima-donnas Effect is highlighted and limited by colour-ful ellipses. Every community member involved in at least one Prima-donnasEffect is coloured in red, while all the other community members are trans-parent;
5. Radio Silence (Figure 7.4h): This graph represents a version of the communi-cation Developer Social Network in which every community member classifiedat least once as a unique knowledge broker toward another sub-community iscoloured in green, while all the other community members are transparent.
Please notice that it is possible to enable the display of identifiers, names and e-mails of community members within every generated Developer Social Networks,but such functionality was disabled to preserve community member privacy, sincein this master thesis we are not interested in evaluating single developers.
Range analysis and all its previously described constituent phases are executedfor every range listed in the relative configuration file and, once all the specifiedranges are analysed, Codeface4Smells execute additional global analysis phases, us-ing the retrieved results of all analysed ranges: correlation analysis and global report.
In correlation analysis layer every identified Community Smell is considered withrespect to every socio-technical quality factor and their correlations are computed,in order to empirically identify if and how socio-technical quality frameworks arerelated to a specific Community Smell. Correlation analysis takes in input two setsof data (measurements related to a specific Community Smell and to a specific socio-technical quality factor), elaborates them and returns a correlation coefficient thatquantifies the extent to which the two variables tend to change together, describingboth the strength, the direction and the p-value of the relationship. Within thisanalysis Codeface4Smells performs two two correlation analysis techniques [70]:
• Pearson product moment correlation evaluates linear relationships withintwo continuous variables, thus it explores the condition in which a change inone of the two analysed variables is associated with a proportional change inthe other variable;
95

7. Operationalising our Quality Framework: Codeface4Smells
• Spearman rank-order correlation is a nonparametric (distribution-free)rank statistic proposed by Charles Spearman that evaluates monotonic rela-tionships within two continuous or ordinal variables, thus it explores situationsin which two variables tend to change in conjunction but not necessarily ata constant rate, without making any assumptions about the frequency dis-tribution of the variables. Usually Spearman’s rank correlation coefficient isconsidered whenever the data distribution makes Pearson’s correlation coeffi-cient undesirable or misleading.
Codeface4Smells analysis terminates with the creation of report files that recap allgenerated data from the execution of every Codeface4Smells socio-technical analysisphase. Real world global report examples of the three reference projects can beconsulted in Appendix C. Moreover, Codeface4Smells generates comma-separatedvalues (CSV) files of every analysed aspect of a software development community,in order to provide easy access to data and facilitate further data analysis. For eachanalysed project such report files contain the following information:
• Measurements of socio-technical quality factors and Community Smells of ev-ery analysed range;
• Pearson’s correlation coefficient and related p-value between every socio-technicalquality metric and Community Smells;
• Spearman’s correlation coefficient and related p-value between every socio-technical quality metric and Community Smells;
• Graphs representing trends of the main socio-technical quality metrics.
7.3 Operationalisation of Community Smells
This section explains how identification patterns of Community Smells, proposedin Chapter 4, are operationalised in CodeFace4Smells. The general functionality ofall the operationalised identification patterns of Community Smells is representedin Figure Figure 7.5 on page 97, where the operationalised identification patternis represented by the blue box and, in order to identify and quantify the numberof occurrences of its specific considered Community Smell, it needs as input thecollaboration DSN, the communication DSN and the list of sub-communities presentwithin the communication DSN. Actually, not all the operationalised identificationpatterns require all the information reported in the figure, as some of them do notneed information related to sub-communities (e.g., Missing Links) and others do notneed the collaboration DSN (e.g., Radio Silence).
The following set of Community Smells is computed for every range specified inthe configuration file of a project and obtained measurements are summarised in the
96

7.3. Operationalisation of Community Smells
Figure 7.5: General functioning of the identification of Community Smells
socio-technical analysis report generated at the end of the global analysis performedby Codeface4Smells.
Organisational Silo Effect Community Smell measures the number of col-laboration links characterised by the absence of at least one of the two developers,constituting the link, within the communication channel; therefore, the identificationof such Community Smell requires as input the collaboration and communicationDeveloper Social Networks. The list of non-communicative developers is obtainedperforming the complement of the collaboration DSN with respect to the commu-nication DSN and appropriate handling functions are implemented to consider acollaboration between two non-communicative developers only once. When everycollaboration belonging to non-communicative developers are counted, the numberof total collaboration links in which one or both of the considered developers are ab-sent in the communication DSN is returned as the measurement that characterisesthe Organisational Silo Effect Community Smell. The R implementation of thisCommunity Smell in Codeface4Smells is proposed in Algorithm 7.1.
Algorithm 7.1 Operationalisation of Organisational Silo Effect identification pat-tern
1 community . smell . organ i sat iona l . s i l o <− function ( mail . graph , code . graph ) {2 ## discover deve lpers not present in the communication DSN3 non . communicative . ids <− setdiff (V( code . graph )$id , V( mail . graph )$ id )4 s i l o s <− l i s t ( )5 ## for each non communicative developer , save his co l laborat ions6 for ( vert in non . communicative . ids ) {7 for ( co l lab in neighbors ( code . graph , V( code . graph ) [V( code . graph )$ id == vert ] )$
id ) {8 ## i f both are non−communicative count the co l laborat ion only once9 ## due to the undirected nature of the graph
10 i f ( ( co l lab %in% non . communicative . ids ) & ( co l lab < vert ) ) {11 next ( )12 }13 ## organisat ional s i l o smel l detected14 s i l o s [ [ length ( s i l o s ) + 1 ] ] <− c( vert , co l lab )15 }16 }17 return( s i l o s )18 }
97

7. Operationalising our Quality Framework: Codeface4Smells
Missing Links Community Smell measures the number of collaboration linksthat do not have a communication counterpart, therefore the identification of suchCommunity Smell requires as input the collaboration and communication DeveloperSocial Networks. The identification process considers every developer within the col-laboration DSN and detects every collaboration link in which the two collaboratingdevelopers are present within the communication DSN but they are not connectedthrough an edge in the communication Developer Social Network. The presence orabsence of a communication link between two collaborating developers is obtainedchecking the presence of the other developer in the list of neighbors of the devel-oper considered within the collaboration DSN. This initial identification phase doesnot consider collaborations in which one or both of implicated developers are notpresent in the communication channel due to optimisation reasons later explainedand it applies appropriate handling functions within the collaboration links analysisin order to consider a Missing Links detection only once, due to the undirected na-ture of the collaboration Developer Social Network. The information about MissingLinks related to non-communicative developers can be extracted from precomputedOrganisational Silo Effect Community Smell, that can be passed to this Commu-nity Smell identification function as a parameter or otherwise it will be computeddirectly. This optimisation is possible due to the fact that, as explained in Section4.1, Organisational Silo Effect is contained in Missing Links Community Smell. ThisCommunity Smell operationalisation returns the list of edges that were classified asMissing Links and not the number of them, therefore to obtain the measurementof Missing Links Community Smell it is necessary to count the number of elementsreturned by this identification process. The R implementation of this CommunitySmell in Codeface4Smells is proposed in Algorithm 7.2.
Black-cloud Effect Community Smell measures the number of communica-tion links that identify unique communication points toward other sub-communities,therefore the identification of such Community Smell requires as input the commu-nication Developer Social Network and the subdivision of its community members indifferent sub-communities. It is important to notice that Black-cloud Effect is a tem-poral related Community Smell, since it needs to consider historical information inorder to identify actual Black-cloud Effect occurrences. Within every range analysisevery sub-community of the communication DSN is considered once at the time andthe number of outgoing edges from every sub-community are counted. If the num-ber of outgoing communication edges is exactly one, then a “potential” Black-cloudEffect Community Smell is detected. This Community Smell identification func-tion returns the list of communication edges classified as “potential” Black-cloudEffect Community Smell and, in order to be classified as actual Black-cloud EffectCommunity Smell within a range analysis, a “potential” Black-cloud Effect has tobe present in the list of “potential” Black-cloud Effect of the previously analysed
98

7.3. Operationalisation of Community Smells
Algorithm 7.2 Operationalisation of Missing Links identification pattern1 community . smell .missing . l i nk s <− function ( mail . graph , code . graph , precomputed .
s i l o=NA) {2 missing <− l i s t ( )3 for ( vert in V( code . graph )$ id ) {4 i f ( ! ( vert %in% V( mail . graph )$ id ) ) {5 next ( ) # the case of one dev not present in the mailing l i s t i s handled
l a t e r6 }7 for ( c o l l in neighbors ( code . graph , V( code . graph ) [V( code . graph )$ id == vert ] )$ id
) {8 i f ( c o l l > vert ) {9 next ( ) # avoid to check twice a graph due to i t s undirected nature
10 }11 i f ( ! ( c o l l %in% V( mail . graph )$ id ) ) {12 next ( ) # the case of one dev not present in the mailing l i s t i s handled
l a t e r13 }14 ## i f a missing communication l ink i s found , i t i s saved15 i f ( ! ( c o l l %in% neighbors ( mail . graph , V( mail . graph ) [V( mail . graph )$ id == vert
] )$ id ) ) {16 missing [ [ length (missing) + 1 ] ] <− c( vert , c o l l )17 }18 }19 }2021 ## i f no precoumputed organisat ional s i l o , we are done22 i f ( length ( precomputed . s i l o ) == 0){23 return(missing)24 }2526 ## I f organisat ional s i l o i s not pre−computed , ca l cu la te i t27 i f ( i s .na( precomputed . s i l o ) ){28 precomputed . s i l o <− community . smell . o rgan i sat iona l . s i l o ( mail . graph , code . graph
)29 }30 ## Add the missing l i n k s due to developers absence in the mailing l i s t s31 for ( edge in precomputed . s i l o ) {32 missing [ [ length (missing) + 1 ] ] <− edge33 }3435 return(missing)36 }
99

7. Operationalising our Quality Framework: Codeface4Smells
Algorithm 7.3 Operationalisation of Black-cloud Effect identification pattern1 community . smell . potent ia l . black . cloud <− function ( mail . graph , c l u s t e r s ) {2 black . l i nk s <− l i s t ( )3 memships <− membership( c l u s t e r s )4 ## For every sub−community check how many edges connect i t to another5 ## sub−community . I f there i s ju s t one extra−c lu s t e r edge , we have6 ## a potent ia l b lack cloud7 for ( c lu s t in 1 : length ( c l u s t e r s ) ) {8 extra . c lu s t . l i nk s <− l i s t ( )9 for ( vert in V( mail . graph ) [ memships == c lus t ]$ id ) {
10 for ( neigh in neighbors ( mail . graph , V( mail . graph ) [V( mail . graph )$ id == vert ] )$ id ) {
11 i f (memships [V( mail . graph ) [V( mail . graph )$ id == neigh ] ] != c lus t ) {12 extra . c lu s t . l i nk s [ [ length ( extra . c lu s t . l i nk s ) + 1 ] ] <− c( vert , neigh )13 }14 }15 }16 i f ( length ( extra . c lu s t . l i nk s ) == 1) {17 # Potentia l b lack cloud smel l detected18 black . l i nk s [ [ length ( black . l i nk s ) + 1 ] ] <− extra . c lu s t . l i nk s [ [ 1 ] ]19 }20 }2122 return( black . l i nk s )23 }
range. Therefore, the measurement of Black-cloud Effect Community Smell is thenumber of communication links resulting from the intersection of the list of “poten-tial” Black-cloud Effect of the actual range in analysis with the list of “potential”Black-cloud Effect of the previously analysed range, thus the Black-cloud Effect as-sociated to the first analysed range will always be zero. The R implementation of“potential” Black-cloud Effect Community Smell in Codeface4Smells is proposed inAlgorithm 7.3.
Prima-donnas Effect Community Smell measures the number of communica-tion links that identify unique communication points toward other sub-communitiesin a situation in which two analysed sub-communities can be considered collaborat-ing within the software source code development, therefore the identification of suchCommunity Smell requires as input the collaboration and communication DeveloperSocial Networks, the subdivision of community members belonging to the commu-nication DSN into different sub-communities and the threshold needed to considertwo distinct sub-communities as collaborating. The default value of the collaborationthreshold is setted to the 20% of total possible collaborations. As explained in Section4.3, the identification process of communication links that are possibly involved ina Prima-donnas Effect is the same as the “potential” Black-cloud Effect, thus inorder to enable a computational optimisation it is possible to specify a precomputedlist of “potential” Black-cloud Effect Community Smell, otherwise the related Com-munity Smell identification function will be invoked. Every communication linkpresent in the “potential” Black-cloud Effect list is considered and the number ofcollaborations between the two different sub-communities identified by a “potential”
100
7.4. Socio-technical Quality Framework implementation
Black-cloud Effect is computed. Then, the number of total possible collaborationsis computed multiplying the numbers of community members constituting the twosub-communities and if the percentage of actual inter-collaborations, thus the resultof the number of collaborations between the two sub-communities over the totalnumber of possible collaborations, is greater than the given threshold then the twosub-communities are considered collaborating within the software development ac-tivity and a Prima-donnas Effect is effectively detected. Therefore, Prima-donnasEffect identification function returns the list of communication links of the commu-nication DSN that identify the occurrence of such Community Smell and in orderto obtain the related measurement it is necessary to count the number of elementsthat constitute the returned list. The R implementation of this Community Smellin Codeface4Smells is proposed in Algorithm 7.4.
Radio Silence Community Smell measures the number of unique knowledgebrokers toward different sub-communities, therefore the identification of such Com-munity Smell requires as input the communication Developer Social Network andthe subdivision of its community members into different sub-communities. The iden-tification process considers one by one every sub-community of the communicationDeveloper Social Network and considers every outgoing communication link towardother sub-communities. If a sub-community is composed by only one communitymember, he or she is considered a unique boundary spanner without further com-putations, otherwise the analysis continues considering two sub-communities at thetime and, if one sub-community communicates with the other one through only onecommunity member, him or her is identified as a knowledge broker and a Radio Si-lence Community Smell is detected. Therefore, Radio Silence identification functionreturns the list of unique knowledge brokers within the sub-communities belonging tothe communication Developer Social Network and in order to compute its associatemeasurement it is necessary to count the number of elements that constitute thereturned list. The R implementation of this Community Smell in Codeface4Smellsis proposed in Algorithm 7.5.
7.4 Socio-technical Quality Framework implementation
This section explains how the 40 socio-technical quality factors that constituteour Socio-technical Quality Framework proposed in Chapter 5 are implemented inCodeFace4Smells. The complete set of socio-technical quality factors is summarisedin Table 5.1 and it is computed for every analysed range and obtained measurementsare summarised in a socio-technical analysis report generated at the end of the globalanalysis performed by Codeface4Smells.
Community dimensions. Some community dimensions that consider thenumber of developers and members who are involved within the software project
101

7. Operationalising our Quality Framework: Codeface4Smells
Algorithm 7.4 Operationalisation of Prima-donnas Effect identification pattern1 community . smell . primadonnas <− function ( mail . graph , c lus te r s , code . graph ,
co l laborat ion =0.2 , precomputed . black=NA) {2 primadonnas <− l i s t ( )3 memships <− membership( c l u s t e r s )4 comms <− communities ( c l u s t e r s )5 ## For every potent ia l black−cloud , check co l laborat ions of involved sub−
communities ;6 ## i f i t i s greater than the threshold , we have two prima−donnas78 ## i f no potent ia l black−cloud , we are done9 i f ( length ( precomputed . black ) == 0){
10 return( primadonnas )11 }1213 i f ( i s .na( precomputed . black ) ) {14 ## I f po ten t ia l black−cloud i s not pre−computed , ca l cu la te i t15 precomputed . black <− community . smell . potent ia l . black . cloud ( mail . graph ,
c l u s t e r s )16 }17 for ( black . link in precomputed . black ) {18 sub .comm. connections <− 019 ## retr i eve c lu s t e r i d e n t i f i e r of the two sub−communities20 id . c lust1 <− memships [V( mail . graph ) [V( mail . graph )$ id == black . link [ 1 ] ] ]21 id . c lust2 <− memships [V( mail . graph ) [V( mail . graph )$ id == black . link [ 2 ] ] ]22 ## count inter−co l laborat ions of the two sub−communities23 for (dev . c lust1 in V( mail . graph ) [ memships == id . c lust1 ]$ id ) {24 i f ( ! (dev . c lust1 %in% V( code . graph )$ id ) ) {25 next ( ) # ignore devs present only in the communication graph26 }27 for (dev . c lust2 in V( mail . graph ) [ memships == id . c lust2 ]$ id ) {28 i f ( ! (dev . c lust2 %in% V( code . graph )$ id ) ) {29 next ( ) # ignore devs present only in the communication graph30 }31 i f (dev . c lust1 %in% neighbors ( mail . graph , V( mail . graph ) [V( mail . graph )$ id
== dev . c lust2 ] )$ id ) {32 sub .comm. connections <− sub .comm. connections + 133 }34 }35 ## I f the fract ion of present co l laborat ions over the t o t a l pos s i b l e
co l laborat ions36 ## (Number of devs of c lus t1 * Number of devs of c lus t2 ) i s greater than37 ## the given threshold then we have two prima−donnas38 tot . poss ib l e . co l l aborat ions <− length (comms [ [ id . c lust1 ] ] ) * length (comms [ [ id
. c lust2 ] ] )39 i f ( (sub .comm. connections / tot . poss ib l e . co l l aborat ions ) > co l laborat ion ) {40 ## prima−donnas e f f e c t detected41 primadonnas [ [ length ( primadonnas ) + 1 ] ] <− c( id . c lust1 , id . c lust2 )42 }43 }44 }4546 return( primadonnas )47 }
102
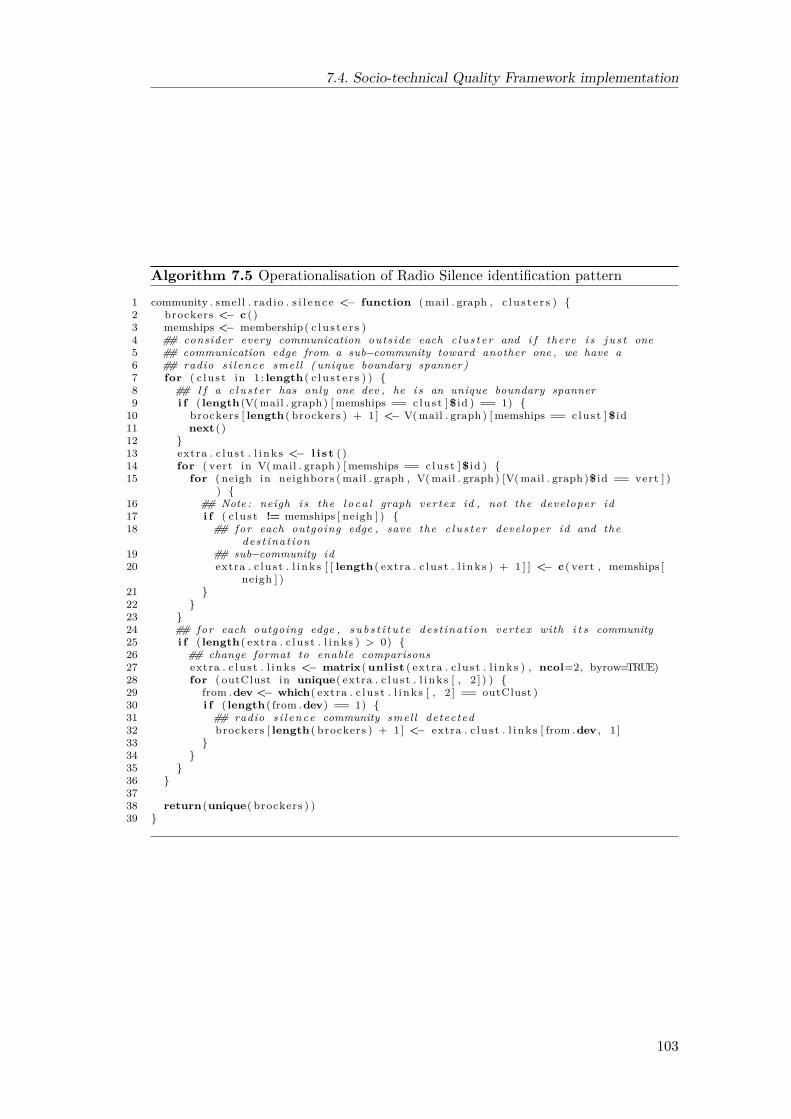
7.4. Socio-technical Quality Framework implementation
Algorithm 7.5 Operationalisation of Radio Silence identification pattern1 community . smell . radio . s i l e n c e <− function ( mail . graph , c l u s t e r s ) {2 brockers <− c ( )3 memships <− membership( c l u s t e r s )4 ## consider every communication outside each c lu s t e r and i f there i s ju s t one5 ## communication edge from a sub−community toward another one , we have a6 ## radio s i l ence smel l ( unique boundary spanner )7 for ( c lu s t in 1 : length ( c l u s t e r s ) ) {8 ## I f a c lu s t e r has only one dev , he i s an unique boundary spanner9 i f ( length (V( mail . graph ) [ memships == c lus t ]$ id ) == 1) {
10 brockers [ length ( brockers ) + 1] <− V( mail . graph ) [ memships == c lus t ]$ id11 next ( )12 }13 extra . c lu s t . l i nk s <− l i s t ( )14 for ( vert in V( mail . graph ) [ memships == c lus t ]$ id ) {15 for ( neigh in neighbors ( mail . graph , V( mail . graph ) [V( mail . graph )$ id == vert ] )
) {16 ## Note : neigh i s the l o c a l graph vertex id , not the developer id17 i f ( c lu s t != memships [ neigh ] ) {18 ## for each outgoing edge , save the c lu s t e r developer id and the
dest inat ion19 ## sub−community id20 extra . c lu s t . l i nk s [ [ length ( extra . c lu s t . l i nk s ) + 1 ] ] <− c( vert , memships [
neigh ] )21 }22 }23 }24 ## for each outgoing edge , s u b s t i t u t e dest inat ion vertex with i t s community25 i f ( length ( extra . c lu s t . l i n k s ) > 0) {26 ## change format to enable comparisons27 extra . c lu s t . l i nk s <− matrix(unlist ( extra . c lu s t . l i nk s ) , ncol=2, byrow=TRUE)28 for ( outClust in unique( extra . c lu s t . l i nk s [ , 2 ] ) ) {29 from .dev <− which( extra . c lu s t . l i n k s [ , 2 ] == outClust )30 i f ( length ( from .dev) == 1) {31 ## radio s i l ence community smel l detected32 brockers [ length ( brockers ) + 1] <− extra . c lu s t . l i nk s [ from .dev , 1 ]33 }34 }35 }36 }3738 return(unique( brockers ) )39 }
103
7. Operationalising our Quality Framework: Codeface4Smells
are retrieved considering the number of nodes that constitute the global, commu-nication and collaboration Developer Social Networks. The total number of peopleinvolved in any possible and analysable way within the considered community ina specific range (dev) is obtained counting the number of nodes that constitutethe Global DSN, while the number of members who are present in every aspectof a FLOSS project development (ml.code.devs) is obtained counting the numberof nodes that constitute the intersection of the collaboration and communicationDeveloper Social Networks. Finally, the number of developers who contribute to aproject’s source code development but do not participate in the communication chan-nel (code.only.devs) and the number of members who participate to every activi-ties of a community with the exception of the development phase (ml.only.devs) areretrieved respectively, subtracting the number of members present in every commu-nity phase (ml.code.devs) to the number of nodes that constitute the collaborationDSN and subtracting the number of members present in every community phase(ml.code.devs) to the number of nodes that constitute the communication DSN.Therefore, given the measured dimensional characteristics of a FLOSS community,it is possible to retrieve the dimensions of the communication or collaboration De-veloper Social Networks summing two different available metrics (ml.code.devs andml.only.devs; ml.code.devs and code.only.devs); these aggregate dimensions were notconsidered within this master thesis study because we considered previously listeddimensions in their disaggregate and finer grain details level. Other insights thatcould help a researcher to understand how a community is structured and subdi-vided between communication and collaboration activities, can be the identificationof how community members are spread into previously classified participation ty-pologies. In order to capture such community’s characteristics, it is calculated thepercentage of people involved in code source development who communicate on theproject’s mailing list (perc.ml.code.devs), people present in the mailing list butthat do not commit code contributions (perc.ml.only.devs) and developers thatcontribute to the community only by committing contributions to a project’s sourcecode (perc.code.only.devs).
Sponsored developers. The list of developers whom are supposed to be spon-sored by commercial companies or whom can be considered self-sponsored developerswith respect to the project in analysis, is retrieved applying an approach proposedby Riehle et al. [8], that considers information related to every commit pushed intoa project’s source code within the range in analysis. A developer is associated witha sponsored status if at least the 95% of his or her commits are executed in workingtime, from 9am to 5pm (local time) and from Mondays to Fridays. In their researchRiehle et al. tried different threshold combinations in order to model differentworking habits present world-wide and concluded that the considered definition ofworking time provided an accurate approximation of the concept on a global work-
104
7.4. Socio-technical Quality Framework implementation
ing scale. The computed list of sponsored developers is used to compute the totalnumber of sponsored developers within the window of analysis (sponsored.devs)and its related ratio with respect to the total number of developers whom contributeto a project’s source code (ratio.sponsored.devs).
Core community members. The identification of core community members ofthe global, communication and collaboration Developer Social Networks is foundedon a methodological approach proposed in 2016 by Joblin et al. [60]. Such iden-tification methodology considers the degree centrality measure of every developersince, in their research, it was demonstrated that core developers exhibit a higherglobal centrality in the developer network and that they are likely to coordinate withother core developers, while peripheral developers are likely to coordinate with coredevelopers. The method proposed by Joblin et al. uses social network analysismethodologies and it was proven to provide a better reflection of developer percep-tion rather than count-based approaches (e.g. commit count, LOC count and mailcount) [60]. Codeface was already able to classify as core or peripheral a developerbelonging to the collaboration Developer Social Network, but this functionality wasapplied only within the collaboration analysis to developers whom contributed to aproject’s source code and it supported only directed graphs. Since the methodologieswe proposed are based on undirected graph topologies, the preexistent solution toidentify core and peripheral community members involved in a project was extendedto support undirected graphs and the ability to apply such classification functionalityto communication, collaboration and global Developer Social Networks. Once thatcore community members of the collaboration, communication and global DeveloperSocial Networks are identified, it is possible to count the number of core memberspresent in a community for each typology of analysed network (core.global.devs,mail.global.devs, core.code.devs). Since the list of developers sponsored by com-mercial companies or self-employed is retrieved from the collaboration DSN, it ispossible to compute the number of sponsored developers whom are classified as coredevelopers within the collaboration DSN (sponsored.core.devs), intersecting thetwo relative information and computing its related ratio (ratio.sponsored.core)with respect to the total number of core developers present in the collaborationDeveloper Social Network. A deeper understanding of how core members behavewithin different community activities can be achieved counting how many commu-nity members are characterised by core status both in the collaboration and in thecommunication Developer Social Networks (ml.code.core.devs), how many coremembers of the communication DSN are not core developers in the collaborationDSN (mail.only.core.devs) and how many core developers of the collaborationDSN are not core members in the communication DSN (core.only.core.devs).These three dimensional metrics related to core members distributions within con-sidered Developer Social Networks are then used to compute the related ratio with
105

7. Operationalising our Quality Framework: Codeface4Smells
respect to the total number of unique core members presents in the communicationand in the collaboration Developer Social Networks and in the two different gener-ated Developer Social Networks alone (ratio.ml.code.core, ratio.mail.only.core,ratio.core.only.core).
Truck number. The truck number represents the ratio of people that anactivity can lose without entering into a stagnation phase. It does not exist aformal definition to calculate truck number (truck factor) [57] but within a FLOSSdevelopment community we can define as vital members associated with a core statuswith respect to each generated network typology. The number of core memberspresent in the communication, collaboration and global developer Developer SocialNetworks previously obtained are then used to calculate the truck number relativeto each network typology (mail.truck, code.truck and global.truck), using thefollowing formula:
Truck number = #peripheralmembers#members = (#members − #coremembers)
#members
Turnover. Different typologies of turnover are calculated using the number ofcommunity members of the current and of the previously analysed ranges. Therefore,the turnover of the first range of an analysis will always be zero. The followingformula is applied to compute turnover:
Turnover = NEEDLY(NEBY +NEEY ) / 2 ∗ 100%
Where:
• NELDY is the number of members who left the project in the analysed range.It is obtained counting the number of members resulting from the intersectionof members of previously analysed range and members of the actual range inanalysis;
• NEBY is the total number of members who constituted the community in thepreviously considered range;
• NEEY is the total number of members who constitute the actual range inanalysis.
Turnover metrics are characterised by a temporal nature because in order to be com-puted they need to have access to historical development analysis information. Thefollowing typologies of turnover are calculated using previously explained formula:
1. turnover of global members (global.turnover);
2. turnover of collaboration members (code.turnover);
106

7.4. Socio-technical Quality Framework implementation
3. turnover of global core members (core.global.turnover);
4. turnover of communication core members (core.mail.turnover);
5. turnover of collaboration core members (core.code.turnover).
Temporal and geographic dispersion. The temporal and geographic dispersionof a software project is calculated as the number of different and unique time-zonesinvolved in every source code contribution to the source code within the range inanalysis (num.tz). Codeface’s collaboration analysis populates a database tablewith all retrievable details of commits and their relative author, hour, date and time-zone. Codeface4Smells comes with a functionality capable to query such databasetable in order to retrieve all the commits information related to the range in analysis,extract their associated time-zones and return the number of unique different time-zones that were involved within the project development in the considered range.
Socio-technical congruence. Socio-technical congruence (st.congruence)is measured as the number of development collaborations that do have a commu-nication counterpart over the total number of collaboration links present in thecollaboration Developer Social Network. Development collaborations that do havea communication counterpart are identified analysing one by one the collaborationlinks that connect different developers present in the collaboration Developer So-cial Network and check within the communication Developer Social Network if suchdevelopers are present and connected through a communication link. Therefore,socio-technical congruence can be computed using Missing Links Community Smellmetric as follows:
Socio-technical congruence = #collaborations−#missingLinks#collaborations
Communicability. Each collaboration between two developers (A and B) in thesoftware development network is considered as a possible source of architectural anddesign decision, therefore a developer is considered aware of a decision if he or she isstrongly connected to at least one of the two developers whom generated the decision.In-communicability is related to every collaboration within the collaboration DSNand it is based on Tamburri et al.’s formulation [DEBT-2]:
MAI = DEM −DAM
DEM = #collaborators of the two developers#developers
DAM = #collaborators of the two developerswhomcommunicatewith them#developers
Therefore, global in-communicability can be defined as the mean MAI over theentire collaboration network. Communicability is a global indicator which consists
107
7. Operationalising our Quality Framework: Codeface4Smells
in the mean of all local communicability measures, calculated for every collaborationbetween two developers within the collaboration Developer Social Network in therange in analysis. Communicability was preferred to in-communicability in orderto simplify measurement comprehension, because in-communicability tend to becharacterised by measurements that tend to zero. Communicability is computed as:
Communicability = 1− incommunicability = 1− 1n
∑MAI
Social Network Analysis metrics. We used some Social Network Analysismethodologies available in R language to calculate the following factors:
• centrality of the global Developer Social Network computed considering close-ness (closeness.centr), betweenness (betweenness.centr) and degree (degree.centr);
• density of the global Developer Social Network (density);
• modularity of the global Developer Social Network (global.mod), commu-nication Developer Social Network (mail.mod) and collaboration DeveloperSocial Network (code.mod).
Smelly developers and smelly quitters. Two socio-technical quality metricsrelated to the outcome of Community Smells identification analysis, specificallycomputed using the list of unique community members involved within at least oneCommunity Smell, are the ratio of smelly developers and the ratio of smelly quitters.The ratio of smelly developers (ratio.smelly.devs) is the ratio of community mem-bers who are involved in at least one Community Smell with respect to the totalnumber of unique members who constitute the global Developer Social Network.The ratio of smelly quitters (ratio.smelly.quitters) represents the ratio of devel-opers who were involved in at least one Community Smell in the previously analysedrange that left the software development community within the range in analysis.The ratio of smelly quitters is characterised by a temporal characteristic becausein order to be computed it needs to have access to historical development analysisinformation, therefore a list of every community member and of smelly developersof the previously analysed range is kept and passed to the next range analysis.
108

Chapter 8
Evaluation
This chapter presents the evaluation of obtained results inherent to the presence,identification and characteristics of Social Debt and Community Smells within OpenSource Software development communities, achieved through the discussed work.
Considering Pearson and Spearman correlation analysis results of the entire setof 60 analysed projects, it was possible to empirically identify quality factors thatcan be considered correlated to the occurrence of Community Smells. Within ouranalysis we considered a correlation as relevant if and only if its associated p-valuewas less than 0.05 and we imposed a minimum threshold of 20% to the numberof relevant correlations found within all the projects or within the different dimen-sional categories, in order to determine which quality factors had to be consideredassociated to a variation of Community Smells.
We evaluated the results of Codeface4Smells analysis of all the 60 consideredprojects and empirically identified relevant correlations between some specific qualityfactors and the occurrence of Community Smells. Section 8.1 presents the evaluationrelated to the existence, occurrence and characteristics of considered CommunitySmells within Open Source Software projects. Moreover, we highlighted thresholdsof such quality factors correlated to the insurgence of Community Smells, in orderto provide precious hints to keep Community Smells under control. This evaluationis presented in Section 8.2 and it addresses the first Research Question (RQ1), itssub-questions and the second Research Question (RQ2). A further evaluation wasperformed considering together the results related to developer perceptions, obtainedwith the executed survey, and the results of the three reference projects obtainedexecuting Codeface4Smells analysis, in order to verify if particular perceptions of de-velopers can be used as indicators of a higher or lower number of Community Smells.This part of the evaluation process is presented in Section 8.3 and it addresses thethird Research Question (RQ3). Section 8.4 summarises the answers to the researchquestions formulated in Chapter 3. Finally, Section 8.5 specifies potential threatsthat could affect the validity of results, evaluations and conclusions of in this study.
109

8. Evaluation
8.1 Occurrences of Community Smells
Considering the number of analysed projects affected by all the typologies ofconsidered Community Smells, summarised in Table 8.1, it was possible to concludethat Radio Silence Community Smell was implicit in every FLOSS development com-munity and even Organisational Silo Effect and Missing Links Community Smellscan be considered omnipresent in Open Source projects, as they were detected inthe 98% of analysed projects. Black-cloud Effect Community Smell occurred onlyin one out of two FLOSS projects and Prima-donnas Effect Community Smell wasthe rarest form of Community Smell within FLOSS communities as it was detectedonly in the 42% of analysed projects.
Dimensional category Organisational Silo Missing Links Radio Silence Black-cloud Prima-donnas<50 19 19 20 8 3
50-150 20 20 20 11 8>150 20 20 20 12 14
ALL 59 59 60 31 25
Table 8.1: Number of analysed projects with Community Smells
Even if it was not possible to empirically correlate additional occurrences ofBlack-cloud Effect and Prima-donnas Effect Community Smells to the number oftrimestral community members, as demonstrated in Section 8.2 for the other threetypologies of Community Smells, it was possible to conclude that such CommunitySmells are more frequent in high dimensional communities:
• Black-cloud Effect Community Smell was detected in the 40% of analysedprojects with less than 50 trimestral community members and in the 55-60%of analysed projects with more than 50 trimestral community members.
• Prima-donnas Effect Community Smell was detected in the 15% of analysedprojects with less than 50 trimestral community members, in the 40% of anal-ysed projects with more than 50 but less than 150 trimestral community mem-bers and in the 70% of analysed projects with less than 150 trimestral commu-nity members. Therefore, a project with more than 150 trimestral communitymembers had more than the 467% of chances of incurring into Prima-donnasEffect Community Smell compared to a project with less than 50 trimestralcommunity members.
Except for the correlation between Missing Links and Organisation Silo Effect Com-munity Smells, that was expected since one includes the definition of the other,globally it was not found any correlation between different Community Smells. Thisfinding is very important as it highlights that Community Smells considered andimplemented in this master thesis are independent and analyse different aspects andrisks, within a software development community.
110
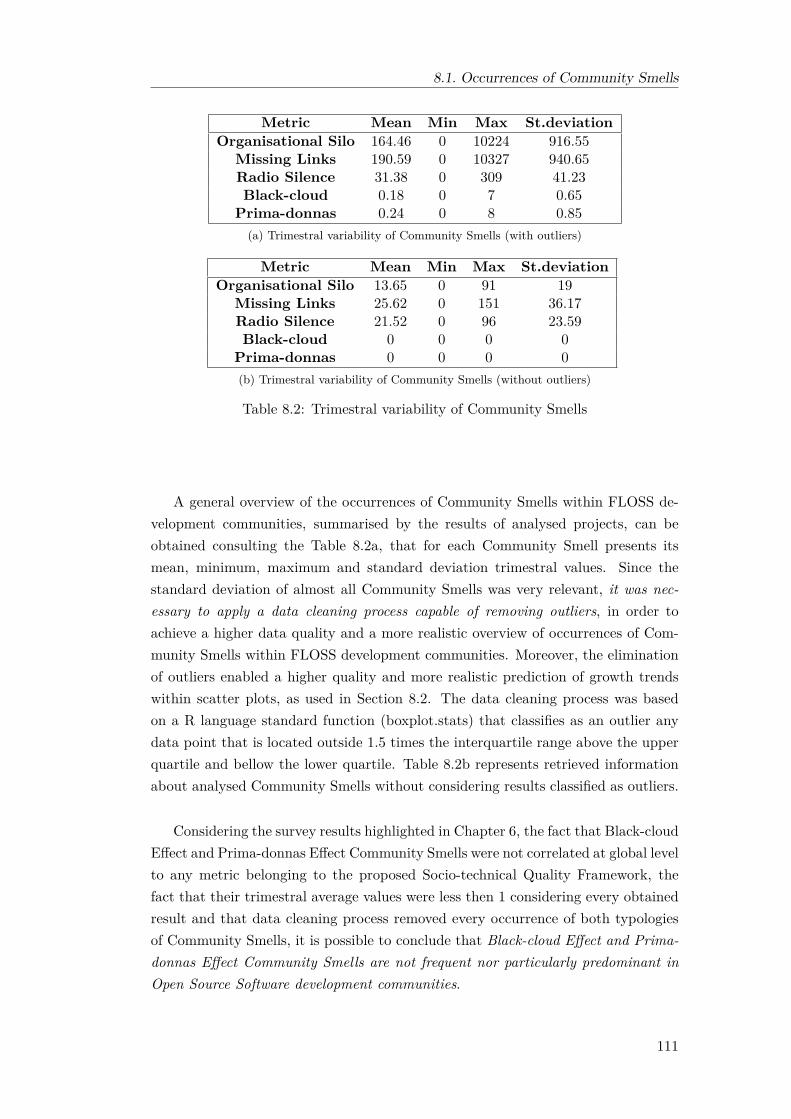
8.1. Occurrences of Community Smells
Metric Mean Min Max St.deviationOrganisational Silo 164.46 0 10224 916.55
Missing Links 190.59 0 10327 940.65Radio Silence 31.38 0 309 41.23Black-cloud 0.18 0 7 0.65
Prima-donnas 0.24 0 8 0.85
(a) Trimestral variability of Community Smells (with outliers)
Metric Mean Min Max St.deviationOrganisational Silo 13.65 0 91 19
Missing Links 25.62 0 151 36.17Radio Silence 21.52 0 96 23.59Black-cloud 0 0 0 0
Prima-donnas 0 0 0 0
(b) Trimestral variability of Community Smells (without outliers)
Table 8.2: Trimestral variability of Community Smells
A general overview of the occurrences of Community Smells within FLOSS de-velopment communities, summarised by the results of analysed projects, can beobtained consulting the Table 8.2a, that for each Community Smell presents itsmean, minimum, maximum and standard deviation trimestral values. Since thestandard deviation of almost all Community Smells was very relevant, it was nec-essary to apply a data cleaning process capable of removing outliers, in order toachieve a higher data quality and a more realistic overview of occurrences of Com-munity Smells within FLOSS development communities. Moreover, the eliminationof outliers enabled a higher quality and more realistic prediction of growth trendswithin scatter plots, as used in Section 8.2. The data cleaning process was basedon a R language standard function (boxplot.stats) that classifies as an outlier anydata point that is located outside 1.5 times the interquartile range above the upperquartile and bellow the lower quartile. Table 8.2b represents retrieved informationabout analysed Community Smells without considering results classified as outliers.
Considering the survey results highlighted in Chapter 6, the fact that Black-cloudEffect and Prima-donnas Effect Community Smells were not correlated at global levelto any metric belonging to the proposed Socio-technical Quality Framework, thefact that their trimestral average values were less then 1 considering every obtainedresult and that data cleaning process removed every occurrence of both typologiesof Community Smells, it is possible to conclude that Black-cloud Effect and Prima-donnas Effect Community Smells are not frequent nor particularly predominant inOpen Source Software development communities.
111
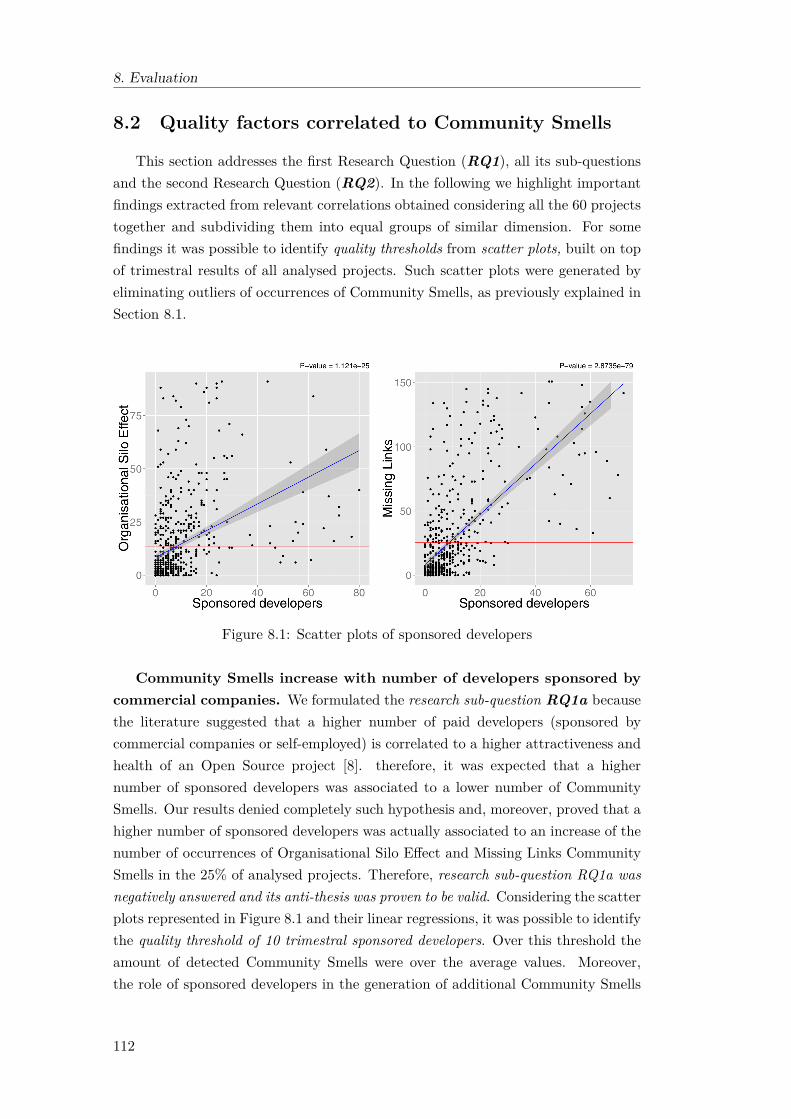
8. Evaluation
8.2 Quality factors correlated to Community Smells
This section addresses the first Research Question (RQ1), all its sub-questionsand the second Research Question (RQ2). In the following we highlight importantfindings extracted from relevant correlations obtained considering all the 60 projectstogether and subdividing them into equal groups of similar dimension. For somefindings it was possible to identify quality thresholds from scatter plots, built on topof trimestral results of all analysed projects. Such scatter plots were generated byeliminating outliers of occurrences of Community Smells, as previously explained inSection 8.1.
Figure 8.1: Scatter plots of sponsored developers
Community Smells increase with number of developers sponsored bycommercial companies. We formulated the research sub-question RQ1a becausethe literature suggested that a higher number of paid developers (sponsored bycommercial companies or self-employed) is correlated to a higher attractiveness andhealth of an Open Source project [8]. therefore, it was expected that a highernumber of sponsored developers was associated to a lower number of CommunitySmells. Our results denied completely such hypothesis and, moreover, proved that ahigher number of sponsored developers was actually associated to an increase of thenumber of occurrences of Organisational Silo Effect and Missing Links CommunitySmells in the 25% of analysed projects. Therefore, research sub-question RQ1a wasnegatively answered and its anti-thesis was proven to be valid. Considering the scatterplots represented in Figure 8.1 and their linear regressions, it was possible to identifythe quality threshold of 10 trimestral sponsored developers. Over this threshold theamount of detected Community Smells were over the average values. Moreover,the role of sponsored developers in the generation of additional Community Smells
112

8.2. Quality factors correlated to Community Smells
assumed different importance with respect to the dimension of software projects:
• In projects with less than 50 trimestral community members, socio-technicalquality factors related to the identification of sponsored developers were notcorrelated at all to the generation of additional Community Smells;
• In projects with more than 50 but less than 150 trimestral community mem-bers, the number of occurrences of Organisational Silo Effect and MissingLinks Community Smells was not only positively correlated to the number ofsponsored developers of a community, but even to the number of sponsoreddevelopers who were associated to the role of core developer. Furthermore, ahigher ratio of sponsored core developers was associated to an increase of thenumber of occurrences of Organisational Silo Effect; this finding highlightedthat in software communities with 50-150 trimestral members, core sponsoreddevelopers tend to isolate themselves and not participate in a project’s com-munication channel.
Community Smells are not influenced by temporal and geographic disper-sion. We formulated the research sub-question RQ1b because the literature sug-gested that temporal and geographic dispersion can generate socio-technical issueswithin a software development community or to its product outcome [21]. Therefore,it was expected that the number of time-zones involved in a software developmentcommunity, used as an indicator of geographic and temporal dispersion, was pos-itively correlated to an increment of detected Community Smells. This expectedcorrelation was detected only in the 5% of analysed projects and thus research sub-question RQ1b was negatively answered. A possible explanation to this finding isthat, nowadays, distributed development is the standard for software developmentenvironments and it implies only delays in communication activities between devel-opers. Moreover, FLOSS is founded on the concept of Global Software Developmentand so there might exist implicit coordination or development mechanisms capable ofavoiding the raise of additional Community Smells due to temporal and geographicdispersion.
The higher the socio-technical congruence, the lower the number ofCommunity Smells. We formulated the research sub-question RQ1c becauseCataldo et al. [5] stated that a higher socio-technical congruence was correlated toa higher software development performance and thus, considering the concept ofsocio-technical congruence as an indicator of the accordance between a organisa-tional structure and its technical requirements, it was reasonable to suppose thata higher level of socio-technical congruence was associated to a lower number ofoccurrences of Community Smells within a software development community. Ourresults verified this hypothesis since in the 50% of analysed projects, an increment ofsocio-technical congruence was correlated to a decrease of the number of occurrences
113

8. Evaluation
Figure 8.2: Scatter plots of socio-technical congruence
of Organisational Silo Effect and Missing Links Community Smells. Therefore, re-search sub-question RQ1c was positively answered. Considering the scatter plotsrepresented in Figure 8.2 and their linear regressions, it was possible to identifythe quality threshold of 0.5 for socio-technical congruence. Over this threshold theamount of detected Community Smells were over the average values.
The higher the communicability, the lower the number of CommunitySmells. We formulated the research sub-question RQ1d because the very sameconjecture was formulated within a research related to Social Debt in software ar-chitectures [7]. Our results demonstrated that in the 62% of analysed projects anincrease of communicability was associated to a decrease of the number of occur-rences of Organisational Silo Effect Community Smell and in the 70% of analysedprojects it was associated to a decrease of the number of occurrences of MissingLinks Community Smell. Therefore, research sub-question RQ1d was positively an-swered. Even if it was empirically demonstrated that communicability influencesthe presence of Community Smells, it was not possible to unequivocally identify aquality threshold.
A high community modularity of communication DSN yields a lowernumber of Community Smells. We formulated the research sub-question RQ1ebecause the literature suggested that a higher modularity, within developer net-works, implies higher interdependency of sub-communities and thus it was possibleto suppose that modularity was associated to a higher value of socio-technical con-gruence and, consequently, to a lower number of occurrences of Community Smells.This hypothesis was verified as in the 40% of analysed projects an increase of commu-nication DSN’s modularity was correlated to a decrease of the number of occurrencesof Radio Silence Community Smell. This finding can be explained by the fact that
114
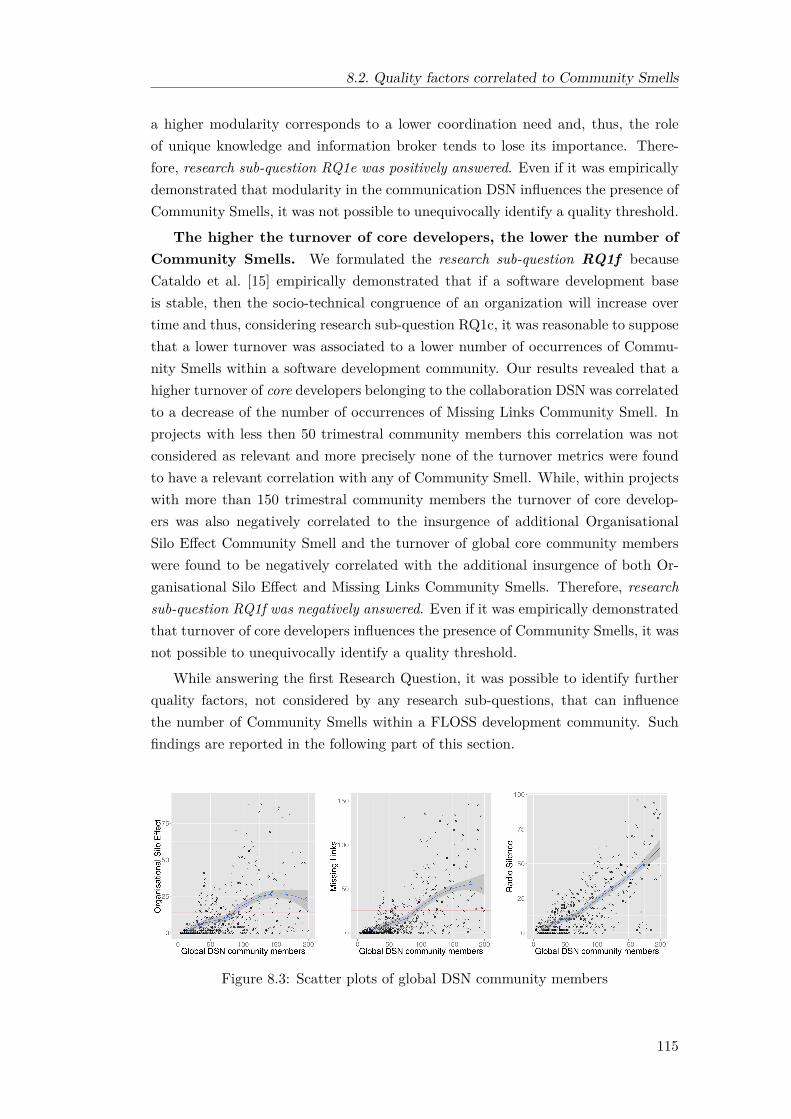
8.2. Quality factors correlated to Community Smells
a higher modularity corresponds to a lower coordination need and, thus, the roleof unique knowledge and information broker tends to lose its importance. There-fore, research sub-question RQ1e was positively answered. Even if it was empiricallydemonstrated that modularity in the communication DSN influences the presence ofCommunity Smells, it was not possible to unequivocally identify a quality threshold.
The higher the turnover of core developers, the lower the number ofCommunity Smells. We formulated the research sub-question RQ1f becauseCataldo et al. [15] empirically demonstrated that if a software development baseis stable, then the socio-technical congruence of an organization will increase overtime and thus, considering research sub-question RQ1c, it was reasonable to supposethat a lower turnover was associated to a lower number of occurrences of Commu-nity Smells within a software development community. Our results revealed that ahigher turnover of core developers belonging to the collaboration DSN was correlatedto a decrease of the number of occurrences of Missing Links Community Smell. Inprojects with less then 50 trimestral community members this correlation was notconsidered as relevant and more precisely none of the turnover metrics were foundto have a relevant correlation with any of Community Smell. While, within projectswith more than 150 trimestral community members the turnover of core develop-ers was also negatively correlated to the insurgence of additional OrganisationalSilo Effect Community Smell and the turnover of global core community memberswere found to be negatively correlated with the additional insurgence of both Or-ganisational Silo Effect and Missing Links Community Smells. Therefore, researchsub-question RQ1f was negatively answered. Even if it was empirically demonstratedthat turnover of core developers influences the presence of Community Smells, it wasnot possible to unequivocally identify a quality threshold.
While answering the first Research Question, it was possible to identify furtherquality factors, not considered by any research sub-questions, that can influencethe number of Community Smells within a FLOSS development community. Suchfindings are reported in the following part of this section.
Figure 8.3: Scatter plots of global DSN community members
115

8. Evaluation
Community Smells increase with number of community members. Anincrement of the number of community members participating to a project’s activ-ities was associated to additional occurrences of Organisational Silo Effect (25% ofanalysed projects), Missing Link (28% of analysed projects) and Radio Silence (45%of analysed projects) Community Smells. Considering the scatter plots representedin Figure 8.3 and their local regressions (loess), it is possible to understand thatCommunity Smells increase quadratically with the linear growth of the number ofcommunity members until the threshold of 150 community members, after which ittends to stabilise itself in the cases of Organisational Silo Effect and Missing LinksCommunity Smell. Moreover, we discovered that in the 32% of analysed projects thenumber of occurrences of Radio Silence Community Smell was positively correlatedto the number of community members who were present both in the communica-tion and in the collaboration Developer Social Networks. This finding allows us tosuppose that, within FLOSS environments, developers who are present in the com-munication channel of a project tend to assume the privileged role of knowledge andinformation broker within the communication channel of a development community.
Community Smells increase with number of Core community mem-bers. An increment of the number of core community members of the global DSNwas correlated to additional occurrences of Organisational Silo Effect (27% of anal-ysed projects), Missing Link (28% of analysed projects) and Radio Silence (30% ofanalysed projects) Community Smells. More specifically, obtained results demon-strated that an increment of the number of core developers belonging to the col-laboration DSN was associated to a higher number of occurrences of OrganisationalSilo Effect Community Smell in the 80% of analysed projects and of Missing LinksCommunity Smell in the 93% of analysed projects. It is important to highlight thatsuch positive correlation was found both with respect to the number of developerswho were considered core members only in collaboration DSN, that with respectto the number of developers who were considered at the same time core memberswithin the collaboration and the communication DSNs. Therefore, an incrementof the number of every typology of core developer within the collaboration DSNwas correlated to an increment of the number of occurrences of Organisational SiloEffect and Missing Links Community Smells. The incidence of core developers inthe generation of additional Community Smells was remarked even by the findingthat a higher truck number related to the collaboration DSN, thus a higher ratio ofperipheral developers, was correlated to a decrease of the number of occurrences ofOrganisation Silo Effect and Missing Links Community Smells, respectively in the42% and in the 52% of analysed projects. Additionally, obtained results highlightedthat, in the 27% of analysed projects, an increment of the number of core communitymembers belonging to the communication DSN was correlated to a higher numberof occurrences of Radio Silence Community Smell. In projects with more than 150
116

8.2. Quality factors correlated to Community Smells
Figure 8.4: Scatter plots related to core community members
trimestral community members, the correlation between the number core commu-nity members belonging to the global or communication DSNs and the number ofoccurrences of Radio Silence Community Smell was not found to be relevant. Apossible explanation can be that within big communities, the relevance of Commu-nity Smells generated by core community members tends to decrease with respect tothe one generated by normal community members. Thus, core community memberstend to lose their role of unique knowledge and information broker in highly dimen-sional development communities. This explanation is further motivated by retrievedresults which revealed that in the 43% of total analysed projects, a higher truck num-ber related to the communication DSN, thus a higher ratio of peripheral communitymembers, was correlated to an increment of the number of occurrences of RadioSilence Community Smell. Therefore, Radio Silence Community Smell is generated
117

8. Evaluation
by both core and peripheral community members belonging to the communicationDSN but additional occurrences of Radio Silence Community Smell generated bycore members tend to be irrelevant in big communities. Considering the scatterplots represented in Figure 8.4 and their linear regressions, it was possible to iden-tify the following quality thresholds, for which the amount of detected CommunitySmells were over the average values:
• 25 trimestral core community members in the global DSN. The quality thresh-old with respect to Missing Links and Radio Silence Community Smells wasa bit higher (30 in both cases), but since the threshold with respect to Or-ganisational Silo Effect Community Smell was 25, it was selected as the globalthreshold for the number of core community members within the global DSN;
• 9 trimestral core developers in the collaboration DSN;
• 30 trimestral core community members in the communication DSN;
• 0.8 for the truck number of the collaboration DSN;
• 0.55 for the truck number of the communication DSN.
Within small communities, the abandonment of members previously in-volved in Community Smells generates additional Community Smells. Inprojects constituted by less than 50 trimestral community members it was found arelevant positive correlation between the ratio of smelly quitters, thus the ratio ofmembers who left the community and were implied in at least one Community Smellin previously analysed range, and the number of occurrences of Organisational SiloEffect and Missing Links Community Smells.
Even if the centrality of global Developer Social Network was not associated toan increase or decrease of the number of occurrences of Community Smells at aglobal lever, some relevant correlations were found considering different dimensionalcategories of FLOSS development communities:
• in projects with less then 50 trimestral community members, the increase ofcloseness centrality was associated to additional occurrences of OrganisationalSilo Effect Community Smell;
• in projects with more than 150 trimestral community members, the increase ofbetweenness centrality was associated to additional occurrences of Black-cloudEffect Community Smell.
All the relevant correlations found between quality factors and Community Smells,that allowed us to respond to the first Research Question, are summarised in Table8.3, where positive correlations are identified by the plus sign while the negativeones with a minus sign.
118

8.3. Qualitative indicators of Community Smells
Quality factor (ID) Organisational Silo Effect Radio Silence Missing Linksdevs + + +
ml.only.devs +code.only.devs + +ml.code.devs +
perc.ml.only.devs - -perc.code.only.devs + +
sponsored.devs + +st.congruence - -
communicability - -ratio.smelly.devs + + +core.global.devs + + +core.mail.devs +core.code.devs + +
mail.truck +code.truck - -
mail.only.core.devs +code.only.core.devs + +ml.code.core.devs + +
ratio.mail.only.core - -ratio.code.only.core + +core.code.turnover -
mail.mod -
Table 8.3: Summary of quality factors correlated to Community Smells
8.3 Qualitative indicators of Community Smells
This section addresses the third Research Question (RQ3). We wanted to verifyif developer perceptions about specific characteristics of their project could act asgood indicators of the presence of Community Smells within FLOSS developmentcommunities. Fundamental prerequisites to the execution of this analysis were theresults obtained from the proposed survey and the results obtained performing Code-face4Smells analysis of the development communities of the three reference projects(i.e., Firefox, LibreOffice and FFmpeg).
Results related to the number of occurrences of Community Smells of every refer-ence project were normalized: for each range of analysis it was computed the numberof occurrences of every typology of Community Smells per community member, thusdividing the total number of occurrences of each Community Smell typology for thetotal number of members constituting the community, and then it was calculated theaverage number of such metric, considering all the analysed ranges of the referenceproject.
In order to empirically verify if developer perceptions were actually associatedto a lower or higher number of Community Smells, estimated considering the meannumber of trimestral occurrences of Community Smells per community member, thefollowing list of steps was executed for every factor considered by every question of
119

8. Evaluation
the executed survey:
1. If the aspect in analysis was addressed within the third part of the question-naire, decide if it is preferred to consider agreement or disagreement results;
2. Define if, for the analysed aspect, it is expected a growth or reduction trend ofthe mean number of occurrences of Community Smells per community mem-ber;
3. Arrange reference projects in ascendant order with respect to their resultsrelated to the analysed aspect, considering the decision taken in Step 1;
4. If the trend speculated in Step 2 is verified in the order of the three referenceprojects identified in Step 3, then developer perceptions is empirically provento be a significant indicator of the presence of additional Community Smellswithin a FLOSS development community, with respect to the analysed aspect.
Table 8.4 represents the summary of the mean number of trimestral occurrences ofCommunity Smells per community member with respect to every reference project.Detailed reports of the three reference projects, related to Codeface4Smells analysisresults and responses of the survey, can be found respectively in Appendix C andAppendix A.
Project Organisational Silo Missing Links Radio Silence Black-cloud Prima-donnasFirefox 10.44444 10.60712 0.02469979 0 0.000527224FFmpeg 0.3967442 0.5849786 0.3842722 0.004148463 0.001766914
LibreOffice 2.261178 3.265845 0.2768581 0.001033613 0.006896172
Table 8.4: Average number of Community Smells per community member
By performing the previously defined list of steps, it was possible to empiricallyverify the validity of the following developer perceptions as significant indicators ofthe presence of Community Smells :
1. Better consideration of developers sponsored by commercial com-panies is correlated to a lower number of Community Smells. Ahigher agreement with the statement that asserted that sponsored developersincreased the health of the project, was correlated to a lower mean numberof trimestral occurrences of Radio Silence and Black-cloud Effect CommunitySmells per community member. The same result was obtained considering thedisagreement levels and correlating them to an increase of Community Smells.
2. Higher perceived decision importance inequality is correlated to ahigher number of Community Smells. A higher disagreement with thestatement that asserted that every opinion was equal in project’s importantdecisions, was correlated to a higher mean number of trimestral occurrences
120

8.3. Qualitative indicators of Community Smells
of Radio Silence and Black-cloud Effect Community Smells per communitymember.
3. Higher perceived importance of communications is partially corre-lated to a lower number of Community Smells. A higher agreementwith the statement that asserted that frequent communication before and af-ter commit activities was essential for the project, was correlated to a lowermean number of trimestral occurrences of Radio Silence and Black-cloud Ef-fect Community Smells per community member. It is interesting to highlightthat the perceived importance of communications within the reference projectswas directly proportional to the mean number of trimestral occurrences of Or-ganisational Silo Effect and Missing Links Community Smells per communitymember. Therefore, communities with well developed communication cultureare intended to generate less Community Smells.
4. Higher perceived quality of documentation is correlated to a lowernumber of Community Smells. A higher agreement with the statementthat asserted that project’s software architecture was well documented, easilyaccessible and understandable and with the one that asserted that project’sdocumentation was understandable and helpful, were correlated to a lowermean number of trimestral occurrences of Radio Silence and Black-cloud Ef-fect Community Smells per community member. This finding highlights theimportant role of documentation within a development community in order toperform informed decisions, understand architectural decisions and achieve ashared and coherent project knowledge, because Black-cloud Effect and RadioSilence Community Smells are characterised by low mutual awareness, lackof knowledge exchanges, hidden information and tunnel vision associated toautonomous architecture decision making activities.
5. More personal assumptions are correlated to a higher number ofCommunity Smells. A higher disagreement with the statement that as-serted that the respondent did assumptions during development due to un-clear requirements or documentation, was correlated to a lower mean numberof trimestral occurrences of Prima-donnas Community Smell per communitymember. It was necessary to consider the disagreement and the decreasingtrend of occurrences of Community Smells because Firefox and FFmpeg com-munities achieved the same exact agreement level. This result further verifiesthe consideration of previous finding.
6. Higher perceived antagonism between sub-communities is correlatedto a higher number of Community Smells. A higher agreement with thestatement that asserted that sometimes different subgroups were antagonists,
121
8. Evaluation
was correlated to a higher mean number of trimestral occurrences of Organisa-tional Silo Effect and Missing Links Community Smells per community mem-ber.
7. Higher perceived communication delays are correlated to a highernumber of Community Smells. A higher number of responses indicatingcommunication delays as the main reason of time waste within any phase of theproject’s development, was correlated to a higher mean number of trimestraloccurrences of Organisational Silo Effect and Missing Links Community Smellsper community member.
Moreover, it was possible to empirically demonstrate the importance of the analysedcommunication channel to be able to achieve a complete and consistent overview ofoccurrences of Community Smells within a software development community. Ahigher number of responses indicating the project’s mailing list as the communica-tion channel through which important project’s decisions were made, was correlatedto a higher mean number of trimestral occurrences of Radio Silence and Black-cloud Effect Community Smells per community member. Therefore, it was proventhat considering the most used and information-rich communication channel withinCommunity Smells analysis, is fundamental in order to capture more occurrences ofCommunity Smells.
8.4 Summary of Research Questions
It was possible to positively answer to the first and second Research Questions,since it was possible to empirically identify quality factors that were correlated toCommunity Smells present within software development communities and, for sameof them, it was possible to elicit quality thresholds that can be used by maintainersto improve the health of communities. Considering the second Research Question,Table 8.5 summarises all the identified quality thresholds that can be used to keepCommunity Smells under control.
It was possible to positively answer to the third Research Question, since itwas possible to identify specific developer perceptions that were actually correlatedto the amount of Community Smells present in the reference projects and thus,such identified developer perceptions, can be used to obtain qualitative indicationsabout the presence of Community Smells and achieve a deeper understanding ofCommunity Smells within FLOSS environments.
In conclusion, Table 8.6 briefly summarises the answers to the research questionsformulated in Chapter 3.
122

8.5. Threats to validity
Quality factor Healthy value# trimestral sponsored developers < 10
Socio-technical congruence > 0.5# trimestral core members in global DSN < 25
# trimestral core members in collaboration DSN < 9# trimestral core members in communication DSN < 30
Truck number of collaboration DSN > 0.8Truck number of communication DSN < 0.55
Table 8.5: Summary of socio-technical quality thresholds
ID Research Question AnswerRQ1 Are there quality factors that can influence the emergence of Community Smells? YESRQ1a Do sponsored developers decrease Community Smells? NORQ1b Do temporal and geographic dispersion increase Community Smells? NORQ1c Do high socio-technical congruence decrease Community Smells? YESRQ1d Do high communicability decrease Community Smells? YESRQ1e Do high modularity decrease Community Smells? YESRQ1f Do low turnover decrease Community Smells? NORQ2 If such quality factors exist, is it possible to identify quality thresholds? YESRQ3 Do developer perceptions indicate the presence of Community Smells? YES
Table 8.6: Summary of Research Questions
8.5 Threats to validity
This section highlights potential threats that could affect the validity of theresults, evaluations and conclusions proposed in this master thesis.
Construct Validity. Threats to construct validity are related to the rela-tionships between theory and observations and, generally, this typology of threatis mainly constituted by imprecisions in performed measurements. In the part ofthe study related to the identification and quantification of Community Smells andquality factors, this typology of threat to validity is mainly concerned to how qual-ity factors and identification patterns of Community Smells, were implemented inCodeface4Smells. Also, part of this research is based on results obtained using asurvey, thus construct validity may be compromised by biased developer perceptionsand because it was used a questionnaires as a measure of comprehension. Thereforethe study can be affected by construct validity.
Internal Validity. Threats to internal validity are related to factors that couldhave influenced our results. In the part of the study related to the identificationan quantification of Community Smells, a factor that can potentially impact on ourability to correctly detect Community Smells is that the considered developmentmailing list is indeed the main communicational channel used by community mem-bers. We were not able to check whether this was so in all the projects composingour sample, however, confirmatory survey results strongly highlight that mailinglists are indeed the key communication channel used within FLOSS development
123

8. Evaluation
communities. Concerning the survey, it was impossible for us to ensure that respon-dents had a good knowledge of all analysed aspects of the software developmentcommunity through which they were contacted. Moreover, a factor that could haveinfluenced our results was the questionnaire response rate, that was quite low (1.14%with respect to the three reference projects) with respect to expected return ratesof this typology of studies (20% - 11% [51,71]). One motivation that may partiallyexplain the low response rate is that we extracted information related to developers,considering the entire life time of analysed projects, therefore considering even veryold information (more than 12 years old).
External Validity. Threats to external validity are related to the generalizationof obtained results. Codeface4Smells currently identifies and quantifies five differentCommunity Smells and considers them as indicators of potential risk related toSocial Debt existence, but there exist other Community Smells not operationalisedyet [6], that may act as significant indicators of the risk of Social Debt. Moreover,we conducted our analysis on a total of 60 FLOSS development projects, ensuringa high generalisation level of our findings, but these results might be influenced bythe temporal window that we selected for the analysis (i.e., 3 months).
124
Chapter 9
Conclusions and future work
The study presented in this master thesis demonstrated that Open Source Soft-ware development communities are not immune to Community Smells, i.e., nastysocio-technical and organisational circumstances that may lead to project delays orthe insurgence of Social Debt [6].
By conducting a survey, we confirmed that developers perceive the presenceof Social Debt and socio-technical issues within FLOSS development communitiesand we empirically identified specific developer perceptions that can be used asqualitative indicators of the presence of additional occurrences of Community Smells.
This master thesis elaborates, operationalises, validates and discusses a Socio-technical Quality Framework for software development communities, constituted bythe measurement of socio-technical quality factors and by the identification andquantification of Community Smells. During our empirical software engineering re-search, it was possible to identify several quality factors correlated to the presence ofCommunity Smells within software development communities. Above all, our resultssuggested that the role of core community member is fundamental in the genera-tion of additional occurrences of Community Smells and, therefore, core communitymembers should make a greater effort to limit their anti-social and non-optimal be-haviors in order to increase the chances of success of their development community.Moreover, while evaluating of our Socio-technical Quality Framework it was possibleto unequivocally identify quality thresholds of some specific socio-technical qualityfactors. Therefore, we concluded that our framework, operationalised in a tool calledCodeface4Smells, does in fact offer a lens to observe software development commu-nities from a quality perspective and diagnose organisational issues in an automatedtool-supported fashion.
The evaluation of our work, presented in Chapter 8, and the results of the exe-cuted survey, allowed us to conclude that Community Smells and Social Debt canactually interfere with the well-being of software development communities. There-fore, while executing project performance analysis, it is important to consider even
125

9. Conclusions and future work
the social and organisational aspects besides the technical ones, in order to lowerthe barriers that can influence the success of the development community.
With the goal of further increasing the identification capabilities of quality fac-tors capable of influencing the presence of Community Smells within a softwaredevelopment community, a possible extension of this work can be the eliminationfrom our framework of quality factors that were not correlated to the insurgenceof Community Smells and the introduction of new quality factors. Furthermore, apossible future enhancement can be the definition and operationalisation of iden-tification patterns of additional Community Smells. Moreover, a possible evolu-tion of this software engineering research consists in the evaluation of the proposedSocio-technical Quality Framework from a technical perspective, with the purposeof identifying correlations between Community Smells and Code Smells.
Finally, we plan to merge the developed tool-support in the main Codeface dis-tribution, potentially transforming Codeface into a full-fledged continuous softwaredevelopment community improvement platform.
126

List of Figures
3.1 Work-flow of contributions . . . . . . . . . . . . . . . . . . . . . . . . 38
4.1 Example of software development community . . . . . . . . . . . . . 444.2 Identification pattern of Organisational Silo Effect . . . . . . . . . . 464.3 Example of occurrences of Organisational Silo Effect . . . . . . . . . 474.4 Identification pattern of Missing Links . . . . . . . . . . . . . . . . . 484.5 Example of occurrences of Missing Links . . . . . . . . . . . . . . . . 494.6 Identification pattern of Black-cloud Effect . . . . . . . . . . . . . . 514.7 Example of occurrences of Black-cloud Effect . . . . . . . . . . . . . 524.8 Identification pattern of Prima-donnas Effect . . . . . . . . . . . . . 534.9 Example of occurrences of Prima-donnas Effect . . . . . . . . . . . . 544.10 Identification pattern of Radio Silence . . . . . . . . . . . . . . . . . 554.11 Example of occurrences of Radio Silence . . . . . . . . . . . . . . . . 55
6.1 Survey results (part one) . . . . . . . . . . . . . . . . . . . . . . . . . 756.2 Survey results (part two) . . . . . . . . . . . . . . . . . . . . . . . . 79
7.1 Architecture of Codeface . . . . . . . . . . . . . . . . . . . . . . . . . 877.2 Architecture of Codeface with Codeface4Smells extension . . . . . . 897.3 Architecture of Codeface4Smells . . . . . . . . . . . . . . . . . . . . 907.4 Example of range analysis report . . . . . . . . . . . . . . . . . . . . 947.5 General functioning of the identification of Community Smells . . . . 97
8.1 Scatter plots of sponsored developers . . . . . . . . . . . . . . . . . . 1128.2 Scatter plots of socio-technical congruence . . . . . . . . . . . . . . . 1148.3 Scatter plots of global DSN community members . . . . . . . . . . . 1158.4 Scatter plots related to core community members . . . . . . . . . . . 117
A.1 Survey results (part three) - All respondents . . . . . . . . . . . . . . 145A.2 Survey results (part three) - Firefox . . . . . . . . . . . . . . . . . . 146A.3 Survey results (part three) - LibreOffice . . . . . . . . . . . . . . . . 147A.4 Survey results (part three) - FFmpeg . . . . . . . . . . . . . . . . . . 148
127
List of Figures
C.1 Codeface4Smells analysis report - Firefox . . . . . . . . . . . . . . . 156C.2 Pearson’s correlation analysis - Firefox . . . . . . . . . . . . . . . . . 157C.3 Spearman’s correlation analysis - Firefox . . . . . . . . . . . . . . . . 158C.4 Codeface4Smells analysis report - LibreOffice . . . . . . . . . . . . . 159C.5 Pearson’s correlation analysis - LibreOffice . . . . . . . . . . . . . . . 160C.6 Spearman’s correlation analysis - LibreOffice . . . . . . . . . . . . . 161C.7 Codeface4Smells analysis report - FFmpeg . . . . . . . . . . . . . . . 162C.8 Pearson’s correlation analysis - FFmpeg . . . . . . . . . . . . . . . . 163C.9 Spearman’s correlation analysis - FFmpeg . . . . . . . . . . . . . . . 164
128
List of Tables
3.1 List of analysed projects . . . . . . . . . . . . . . . . . . . . . . . . . 403.2 Trimestral variability of analysed projects . . . . . . . . . . . . . . . 41
5.1 Summary of the Socio-technical Quality Framework . . . . . . . . . 58
6.1 Goals and motivations of the survey . . . . . . . . . . . . . . . . . . 716.2 Projects initially considered for the survey . . . . . . . . . . . . . . . 746.3 Nationalities of survey respondents . . . . . . . . . . . . . . . . . . . 77
8.1 Number of analysed projects with Community Smells . . . . . . . . . 1108.2 Trimestral variability of Community Smells . . . . . . . . . . . . . . 1118.3 Summary of quality factors correlated to Community Smells . . . . . 1198.4 Average number of Community Smells per community member . . . 1208.5 Summary of socio-technical quality thresholds . . . . . . . . . . . . . 1238.6 Summary of Research Questions . . . . . . . . . . . . . . . . . . . . 123
A.1 Characteristics of projects initially considered for the survey . . . . . 144
129

List of Tables
130

List of Algorithms
7.1 Operationalisation of Organisational Silo Effect identification pattern 977.2 Operationalisation of Missing Links identification pattern . . . . . . 997.3 Operationalisation of Black-cloud Effect identification pattern . . . . 1007.4 Operationalisation of Prima-donnas Effect identification pattern . . 1027.5 Operationalisation of Radio Silence identification pattern . . . . . . 103
131

List of Algorithms
132

Bibliography
[1] Nachiappan Nagappan, Brendan Murphy, and Victor Basili. The influenceof organizational structure on software quality: an empirical case study. InProceedings of the 30th international conference on Software engineering, pages521–530. ACM, 2008.
[2] Damian A Tamburri, Patricia Lago, and Hans van Vliet. Organizational socialstructures for software engineering. ACM Computing Surveys (CSUR), 46(1):3,2013.
[3] Damian A Tamburri, Philippe Kruchten, Patricia Lago, and Hans van Vliet.What is social debt in software engineering? In Cooperative and Human Aspectsof Software Engineering (CHASE), 2013 6th International Workshop on, pages93–96. IEEE, 2013.
[4] Philippe Kruchten, Robert L Nord, and Ipek Ozkaya. Technical debt: Frommetaphor to theory and practice. Ieee software, 29(6), 2012.
[5] Marcelo Cataldo, James D Herbsleb, and Kathleen M Carley. Socio-technicalcongruence: a framework for assessing the impact of technical and work de-pendencies on software development productivity. In Proceedings of the SecondACM-IEEE international symposium on Empirical software engineering andmeasurement, pages 2–11. ACM, 2008.
[6] Damian Andrew Tamburri, Philippe Kruchten, Patricia Lago, and Hans vanVliet. Social debt in software engineering: insights from industry. J. InternetServices and Applications, 6(1):10:1–10:17, 2015.
[7] Damian A Tamburri and Elisabetta Di Nitto. When software architecture leadsto social debt. In Software Architecture (WICSA), 2015 12th Working IEEE/I-FIP Conference on, pages 61–64. IEEE, 2015.
[8] Dirk Riehle, Philipp Riemer, Carsten Kolassa, and Michael Schmidt. Paid vs.volunteer work in open source. In 2014 47th Hawaii International Conferenceon System Sciences, pages 3286–3295. IEEE, 2014.
133

Bibliography
[9] Melvin E Conway. How do committees invent. Datamation, 14(4):28–31, 1968.
[10] James D Herbsleb and Rebecca E Grinter. Architectures, coordination, anddistance: Conway’s law and beyond. IEEE software, 16(5):63, 1999.
[11] Frederick P Brooks Jr. The mythical man-month (anniversary ed.). 1995.
[12] David Lorge Parnas. On the criteria to be used in decomposing systems intomodules. Communications of the ACM, 15(12):1053–1058, 1972.
[13] Audris Mockus, Roy T Fielding, and James D Herbsleb. Two case studies ofopen source software development: Apache and mozilla. ACM Transactions onSoftware Engineering and Methodology (TOSEM), 11(3):309–346, 2002.
[14] Audris Mockus. Organizational volatility and its effects on software defects.In Proceedings of the eighteenth ACM SIGSOFT international symposium onFoundations of software engineering, pages 117–126. ACM, 2010.
[15] Marcelo Cataldo, Patrick A Wagstrom, James D Herbsleb, and Kathleen MCarley. Identification of coordination requirements: implications for the designof collaboration and awareness tools. In Proceedings of the 2006 20th anniver-sary conference on Computer supported cooperative work, pages 353–362. ACM,2006.
[16] Anita Sarma, Jim Herbsleb, and André Van Der Hoek. Challenges in measuring,understanding, and achieving social-technical congruence. In Proceedings ofSocio-Technical Congruence Workshop, In Conjuction With the InternationalConference on Software Engineering, 2008.
[17] Lyra J Colfer and Carliss Y Baldwin. The mirroring hypothesis: Theory, evi-dence and exceptions. Harvard Business School Finance Working Paper, (16-124), 2016.
[18] Seiji Sato, Hironori Washizaki, Yoshiaki Fukazawa, Sakae Inoue, Hiroyuki Ono,Yoshiiku Hanai, and Mikihiko Yamamoto. Effects of organizational changes onproduct metrics and defects. In 2013 20th Asia-Pacific Software EngineeringConference (APSEC), volume 1, pages 132–139. IEEE, 2013.
[19] https://en.wikipedia.org/wiki/Globalization.
[20] Kenneth R Gray and Thomas L Friedman. The world is flat: A brief history ofthe twenty-first century, 2005.
[21] Juyun Cho. Globalization and global software development. Issues in informa-tion systems, 8(2):287–290, 2007.
134
Bibliography
[22] Bogdan Vasilescu, Alexander Serebrenik, and Vladimir Filkov. A data set forsocial diversity studies of github teams. In 2015 IEEE/ACM 12th WorkingConference on Mining Software Repositories, pages 514–517. IEEE, 2015.
[23] Eric Molleman and Jannes Slomp. The impact of team and work characteristicson team functioning. Human Factors and Ergonomics in Manufacturing &Service Industries, 16(1):1–15, 2006.
[24] Christopher P Earley and Elaine Mosakowski. Creating hybrid team cultures:An empirical test of transnational team functioning. Academy of ManagementJournal, 43(1):26–49, 2000.
[25] http://www.gnu.org/philosophy/free-sw.html.
[26] https://opensource.org/osd.html.
[27] http://www.gnu.org/philosophy/open-source-misses-the-point.html.
[28] http://www.gnu.org/philosophy/floss-and-foss.html.
[29] Bogdan Vasilescu, Daryl Posnett, Baishakhi Ray, Mark GJ van den Brand,Alexander Serebrenik, Premkumar Devanbu, and Vladimir Filkov. Gender andtenure diversity in github teams. In Proceedings of the 33rd Annual ACMConference on Human Factors in Computing Systems, pages 3789–3798. ACM,2015.
[30] Christopher Vendome, Mario Linares-Vásquez, Gabriele Bavota, MassimilianoDi Penta, Daniel M German, and Denys Poshyvanyk. When and why developersadopt and change software licenses. In Software Maintenance and Evolution(ICSME), 2015 IEEE International Conference on, pages 31–40. IEEE, 2015.
[31] Qiaona Hong, Sunghun Kim, Shing Chi Cheung, and Christian Bird. Under-standing a developer social network and its evolution. In Software Maintenance(ICSM), 2011 27th IEEE International Conference on, pages 323–332. IEEE,2011.
[32] Fu-ren Lin and Chun-hung Chen. Developing and evaluating the social networkanalysis system for virtual teams in cyber communities. In System Sciences,2004. Proceedings of the 37th Annual Hawaii International Conference on, pages8–pp. IEEE, 2004.
[33] James Howison, Keisuke Inoue, and Kevin Crowston. Social dynamics of freeand open source team communications. In IFIP International Conference onOpen Source Systems, pages 319–330. Springer, 2006.
135

Bibliography
[34] Christian Bird, Alex Gourley, Prem Devanbu, Michael Gertz, and AnandSwaminathan. Mining email social networks. In Proceedings of the 2006 in-ternational workshop on Mining software repositories, pages 137–143. ACM,2006.
[35] Gregory Madey, Vincent Freeh, and Renee Tynan. The open source softwaredevelopment phenomenon: An analysis based on social network theory. AMCIS2002 Proceedings, page 247, 2002.
[36] Luis Lopez-Fernandez, Gregorio Robles, Jesus M Gonzalez-Barahona, et al.Applying social network analysis to the information in cvs repositories. InInternational workshop on mining software repositories, pages 101–105, 2004.
[37] Andrew Meneely and Laurie Williams. Socio-technical developer networks:should we trust our measurements? In Proceedings of the 33rd InternationalConference on Software Engineering, pages 281–290. ACM, 2011.
[38] Roozbeh Nia, Christian Bird, Premkumar Devanbu, and Vladimir Filkov. Va-lidity of network analyses in open source projects. In 2010 7th IEEE Work-ing Conference on Mining Software Repositories (MSR 2010), pages 201–209.IEEE, 2010.
[39] Caius Brindescu, Mihai Codoban, Sergii Shmarkatiuk, and Danny Dig. How docentralized and distributed version control systems impact software changes?In Proceedings of the 36th International Conference on Software Engineering,pages 322–333. ACM, 2014.
[40] Andrejs Jermakovics, Alberto Sillitti, and Giancarlo Succi. Mining and visu-alizing developer networks from version control systems. In Proceedings of the4th International Workshop on Cooperative and Human Aspects of SoftwareEngineering, pages 24–31. ACM, 2011.
[41] Mitchell Joblin, Wolfgang Mauerer, Sven Apel, Janet Siegmund, and DirkRiehle. From developer networks to verified communities: a fine-grained ap-proach. In Proceedings of the 37th International Conference on SoftwareEngineering-Volume 1, pages 563–573. IEEE Press, 2015.
[42] Christian Bird, Nachiappan Nagappan, Harald Gall, Brendan Murphy, andPremkumar Devanbu. Putting it all together: Using socio-technical networks topredict failures. In 2009 20th International Symposium on Software ReliabilityEngineering, pages 109–119. IEEE, 2009.
[43] Yonghee Shin, Andrew Meneely, Laurie Williams, and Jason A Osborne.Evaluating complexity, code churn, and developer activity metrics as indica-
136

Bibliography
tors of software vulnerabilities. IEEE Transactions on Software Engineering,37(6):772–787, 2011.
[44] Ning Nan and Sanjeev Kumar. Joint effect of team structure and softwarearchitecture in open source software development. IEEE Transactions on En-gineering Management, 60(3):592–603, 2013.
[45] Giuseppe Valetto, Mary Helander, Kate Ehrlich, Sunita Chulani, Mark Weg-man, and Clay Williams. Using software repositories to investigate socio-technical congruence in development projects. In Proceedings of the FourthInternational Workshop on Mining Software Repositories, page 25. IEEE Com-puter Society, 2007.
[46] Jorge Colazo. Structural changes associated with the temporal dispersion ofteams: Evidence from open source software projects. In 2014 47th HawaiiInternational Conference on System Sciences, pages 300–309. IEEE, 2014.
[47] Ward Cunningham. The wycash portfolio management system. SIGPLANOOPS Mess., 4(2):29–30, December 1992.
[48] Nicolli SR Alves, Leilane F Ribeiro, Vivyane Caires, Thiago S Mendes, andRodrigo O Spínola. Towards an ontology of terms on technical debt. In Manag-ing Technical Debt (MTD), 2014 Sixth International Workshop on, pages 1–7.IEEE, 2014.
[49] William H Brown, Raphael C Malveau, Hays W McCormick, and Thomas JMowbray. AntiPatterns: refactoring software, architectures, and projects incrisis. John Wiley & Sons, Inc., 1998.
[50] Martin Fowler. Refactoring: Improving the design of existing code. In 11thEuropean Conference. Jyväskylä, Finland, 1997.
[51] Fabio Palomba, Gabriele Bavota, Massimiliano Di Penta, Rocco Oliveto, DenysPoshyvanyk, and Andrea De Lucia. Mining version histories for detecting codesmells. IEEE Transactions on Software Engineering, 41(5):462–489, 2015.
[52] Ivaldir H de Farias Junior, Ryan R de Azevedo, Hermano P de Moura, andDennis S Martins da Silva. Elicitation of communication inherent risks in dis-tributed software development. In 2012 IEEE Seventh International Conferenceon Global Software Engineering Workshops, pages 37–42. IEEE, 2012.
[53] Neil A Ernst, Stephany Bellomo, Ipek Ozkaya, Robert L Nord, and Ian Gorton.Measure it? manage it? ignore it? software practitioners and technical debt.In Proceedings of the 2015 10th Joint Meeting on Foundations of SoftwareEngineering, pages 50–60. ACM, 2015.
137

Bibliography
[54] Aniket Potdar and Emad Shihab. An exploratory study on self-admitted tech-nical debt. In ICSME, pages 91–100, 2014.
[55] Nianjun Zhou, Wesley M Gifford, Krishna Ratakonda, Gregory H Westerwick,and Carl Engel. On the quantification of global team performance and prof-itability. In Services Computing (SCC), 2014 IEEE International Conferenceon, pages 378–385. IEEE, 2014.
[56] Mathieu Lavallée and Pierre N Robillard. Why good developers write bad code:An observational case study of the impacts of organizational factors on soft-ware quality. In Proceedings of the 37th International Conference on SoftwareEngineering-Volume 1, pages 677–687. IEEE Press, 2015.
[57] Valerio Cosentino, Javier Luis Cánovas Izquierdo, and Jordi Cabot. Assessingthe bus factor of git repositories. In 2015 IEEE 22nd International Conferenceon Software Analysis, Evolution, and Reengineering (SANER), pages 499–503.IEEE, 2015.
[58] Ran Mo, Yuanfang Cai, Rick Kazman, Lu Xiao, and Qiong Feng. Decouplinglevel: a new metric for architectural maintenance complexity. In Proceedingsof the 38th International Conference on Software Engineering, pages 499–510.ACM, 2016.
[59] Damian A Tamburri, Elisabetta Di Nitto, and Patricia Lago. “let me measuremy self!” said open-source. (unpublished).
[60] Mitchell Joblin, Sven Apel, Claus Hunsen, and Wolfgang Mauerer. Classifyingdevelopers into core and peripheral: An empirical study on count and networkmetrics. arXiv preprint arXiv:1604.00830, 2016.
[61] Kevin Crowston, Kangning Wei, Qing Li, and James Howison. Core and periph-ery in free/libre and open source software team communications. In Proceed-ings of the 39th Annual Hawaii International Conference on System Sciences(HICSS’06), volume 6, pages 118a–118a. IEEE, 2006.
[62] Antonio Terceiro, Luiz Romario Rios, and Christina Chavez. An empiricalstudy on the structural complexity introduced by core and peripheral develop-ers in free software projects. In Software Engineering (SBES), 2010 BrazilianSymposium on, pages 21–29. IEEE, 2010.
[63] Audris Mockus and David M Weiss. Predicting risk of software changes. BellLabs Technical Journal, 5(2):169–180, 2000.
138

Bibliography
[64] Akinori Ihara, Yasutaka Kamei, Masao Ohira, Ahmed E Hassan, NaoyasuUbayashi, and Ken-ichi Matsumoto. Early identification of future commit-ters in open source software projects. In 2014 14th International Conferenceon Quality Software, pages 47–56. IEEE, 2014.
[65] Linton C Freeman. Centrality in social networks conceptual clarification. Socialnetworks, 1(3):215–239, 1978.
[66] Mark EJ Newman and Michelle Girvan. Finding and evaluating communitystructure in networks. Physical review E, 69(2):026113, 2004.
[67] Stanley Wasserman and Katherine Faust. Social network analysis: Methodsand applications, volume 8. Cambridge university press, 1994.
[68] http://siemens.github.io/codeface.
[69] Fabiano Berardo de Sousa and Liang Zhao. Evaluating and comparing theigraph community detection algorithms. In Intelligent Systems (BRACIS), 2014Brazilian Conference on, pages 408–413. IEEE, 2014.
[70] Jan Hauke and Tomasz Kossowski. Comparison of values of pearson’s andspearman’s correlation coefficients on the same sets of data. Quaestiones geo-graphicae, 30(2):87–93, 2011.
[71] Yehuda Baruch. Response rate in academic studies-a comparative analysis.Human relations, 52(4):421–438, 1999.
[72] https://github.com/smnmgn/codeface.
[73] https://www.vagrantup.com.
[74] https://www.virtualbox.org.
[75] https://github.com/smnmgn/master_thesis.
139

Bibliography
140

Appendix A
Survey
This Appendix lists the subset of questions of the survey that were considered inthis master thesis in order to retrieve information about Social Debt and CommunitySmells, validate research assumptions and capture developer perceptions. Moreover,it presents the characteristics of all initially considered projects and explains howsuch characteristics were computed. Finally, this appendix provides a graphicalrepresentation of results related to the third part of the questionnaire.
A.1 The questionnaire
This section contains the list of questions that composed the survey, which wasspecifically designed to conduct our study.
Part one:
1. Country
2. Year of birth
3. Occupation
(a) Student
(b) Part time employee
(c) Full time employee
(d) Unemployed
(e) Retired
4. Community
141

A. Survey
5. Role
(a) Developer
(b) Maintainer
(c) Software engineer
(d) Translator
(e) Graphic
(f) Other
Part two:
1. Do you contribute to this project as an individual or because your companyis involved in it?
(a) Paid by a company
(b) Partially paid by company
(c) Voluntary developer
2. Through which channel are important project decisions made?
(a) Mailing list
(b) Forum
(c) IRC
(d) Closed group of developers
(e) I don’t know
(f) Other
3. What is the major cause of time waste within any phase of the project’sdevelopment?
(a) Delays in developer communications
(b) Long time to reach an agreement within the community
(c) Development and bug fixing can’t keep up with deadlines
(d) Bad or poor software design decisions end up in reengineering andfixup code
(e) Project disorganization
(f) I don’t know
142

A.1. The questionnaire
(g) Other
4. What was the reason of your longest wait for a commit approval?
(a) Unavailable maintainers stalled the process
(b) Long discussion between developers to decide if accept or deny
(c) Proposed code didn’t follow community standards
(d) Code had to be rewritten to be accepted
(e) I don’t know
(f) I don’t remember
(g) Other
Part three:
1. Developers sponsored by commercial companies increase project health
2. Absence of a developer can stall some community activities
3. Absence of a core developer can stall some community activities
4. The project development has a high degree of formality
5. Every opinion is equal in project’s important decisions
6. Frequent communication before and after commit activities are essential
7. Community rules and structures are sound and clear
8. Software architecture is well documented, easily accessible and understand-able
9. I did assumptions during development due to unclear requirements or doc-umentation
10. Documentation is understandable and helpful
11. There are different subgroups within the community
12. Different subgroups rarely communicate
13. Subgroups have similar mindset and act as little communities inside thecommunity
14. Different subgroups are sometimes antagonists
143
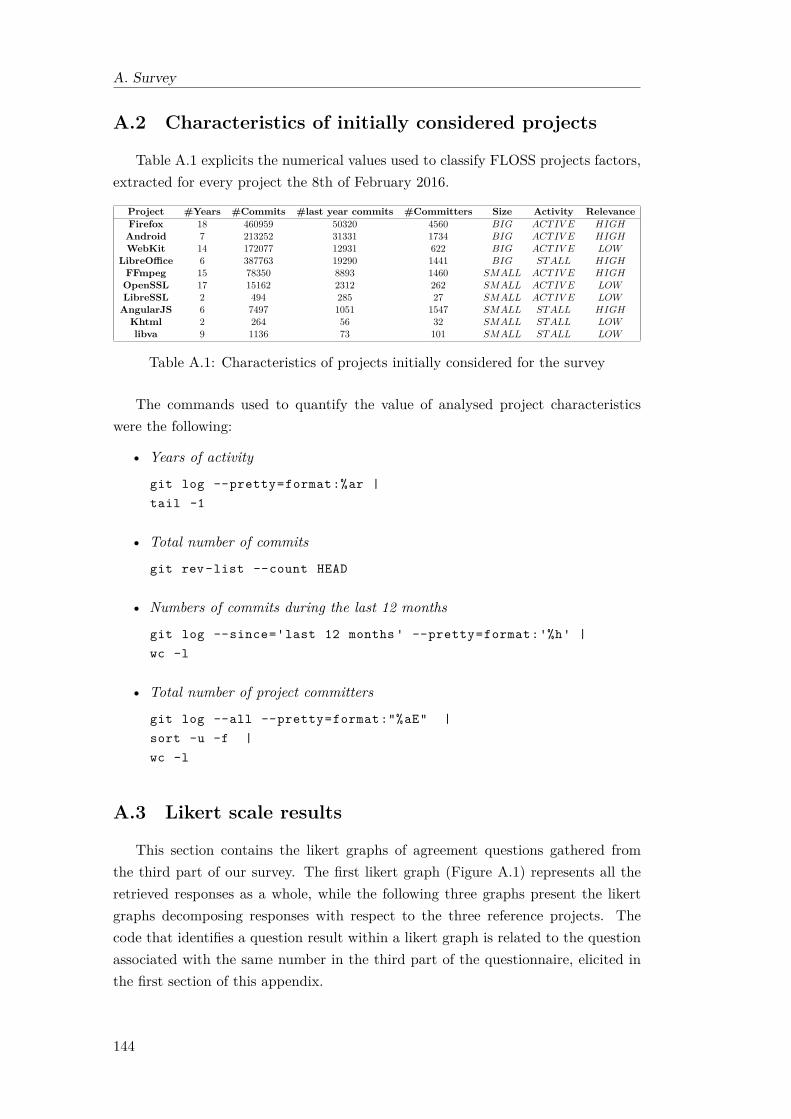
A. Survey
A.2 Characteristics of initially considered projects
Table A.1 explicits the numerical values used to classify FLOSS projects factors,extracted for every project the 8th of February 2016.
Project #Years #Commits #last year commits #Committers Size Activity RelevanceFirefox 18 460959 50320 4560 BIG ACTIV E HIGH
Android 7 213252 31331 1734 BIG ACTIV E HIGHWebKit 14 172077 12931 622 BIG ACTIV E LOW
LibreOffice 6 387763 19290 1441 BIG STALL HIGHFFmpeg 15 78350 8893 1460 SMALL ACTIV E HIGH
OpenSSL 17 15162 2312 262 SMALL ACTIV E LOWLibreSSL 2 494 285 27 SMALL ACTIV E LOW
AngularJS 6 7497 1051 1547 SMALL STALL HIGHKhtml 2 264 56 32 SMALL STALL LOWlibva 9 1136 73 101 SMALL STALL LOW
Table A.1: Characteristics of projects initially considered for the survey
The commands used to quantify the value of analysed project characteristicswere the following:
• Years of activity
git log --pretty=format:%ar |tail -1
• Total number of commits
git rev-list --count HEAD
• Numbers of commits during the last 12 months
git log --since='last 12 months ' --pretty=format:'%h' |wc -l
• Total number of project committers
git log --all --pretty=format:"%aE" |sort -u -f |wc -l
A.3 Likert scale results
This section contains the likert graphs of agreement questions gathered fromthe third part of our survey. The first likert graph (Figure A.1) represents all theretrieved responses as a whole, while the following three graphs present the likertgraphs decomposing responses with respect to the three reference projects. Thecode that identifies a question result within a likert graph is related to the questionassociated with the same number in the third part of the questionnaire, elicited inthe first section of this appendix.
144
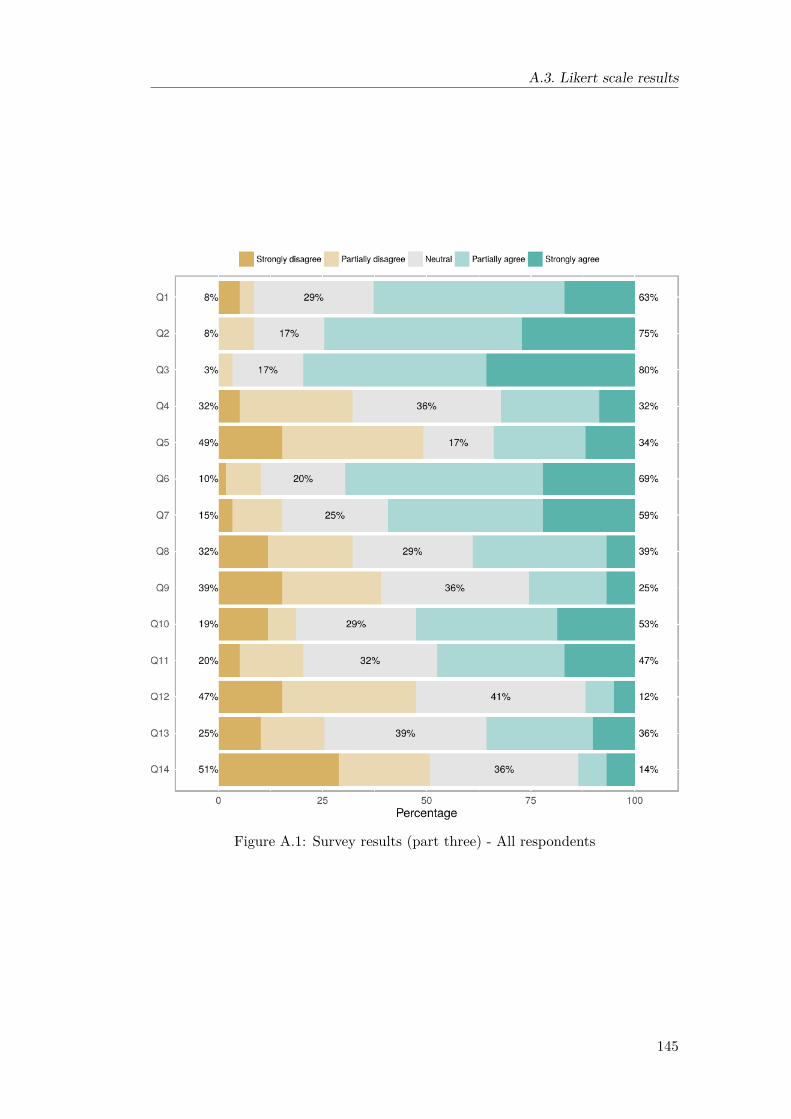
A.3. Likert scale results
Figure A.1: Survey results (part three) - All respondents
145

A. Survey
Figure A.2: Survey results (part three) - Firefox
146

A.3. Likert scale results
Figure A.3: Survey results (part three) - LibreOffice
147

A. Survey
Figure A.4: Survey results (part three) - FFmpeg
148
Appendix B
Codeface4Smells
This Appendix describes how to install, set-up and execute Codeface4Smells,the tool developed during this master thesis, through which we operationalised ourSocio-technical Quality Framework and the identification patterns of CommunitySmells, explained respectively in Chapter5 and Chapter 4. Moreover, we report abrief set of lessons learned, in order to provide useful notions, about how to writea proper configuration file and successfully complete the collaboration analysis of ahigh-volume software project using Codeface. Finally, we present some utility scriptsspecifically developed to cope with particular needs emerged within this study.
B.1 Set-up and analysis execution
Codeface4Smells is hosted on GitHub and then it is possible to download itmanually or cloning its associated git repository [72]. As explained in Chapter 7,Codeface4Smells extends Codeface and thus, it shares its inner workings. Therefore,since Codeface is supposed to be executed in a virtual machine, for practical reasons,the presence of Vagrant [73] and VirtualBox [74] on the machine is a necessaryprecondition in order to continue with the set-up of our tool.
Once the source code of Codeface4Smells is present on the machine, it is pos-sible to initialise the virtual machine and then access it, using the following set ofcommands:
# vagrant up# vagrant ssh
The first command initialises the virtual machine. If it is the first time that theconsidered instance of Codeface4Smells is executed, then Vagrant will download thevirtual machine image and some initialisation scripts will download and install all thenecessary software to correctly execute the tool. The second command establishesan ssh connection with the previously initialised virtual machine, in order to haveaccess to its console.
149

B. Codeface4Smells
Whenever the virtual machine is not needed anymore, it is possible to shut itdown using the following command:
# vagrant halt
Before being able to analyse a project with Codeface4Smells, it is necessary tohave access to the following project resources: source code, mailing list archive files(mbox format) and a configuration file. Moreover, before performing the actualCodeface4Smells analysis it is necessary to execute the collaboration and communi-cation analysis, provided by Codeface, in advance. Therefore, the list of commandsnecessary to correctly execute Codeface4Smells analysis is:
# cd /vagrant/id_service/;nodejs id_service.js ../codeface.conf &cd ..
# codeface run -p conf_file dir_out dir_git# codeface ml -p conf_file dir_out dir_git# codeface st -p conf_file dir_out
Where the following parameters should be substituted:
• conf_file: path to the project’s configuration file;
• dir_git: path to the directory that contains the source code of the project;
• dir_ml: path to the directory that contains the mailing list archive files;
• dir_out: path to the directory that will contain the analysis output.
The first command starts the ID manager service, that is needed to handle the identi-fication and management of developer identities. The second command executes thecollaboration analysis and the third one executes the communication analysis. Thelast command starts Codeface4Smells analysis, which uses both the collaborationand communication analysis output generated by previous commands.
B.2 Project configuration
To perform an analysis with Codeface and Codeface4Smells, it is necessary tospecify a configuration file that contains all the necessary information related to theproject in analysis. The configuration file has to be specified in every command thatperform an analysis, it must have a “.conf” extension and it should contain at leastthe following parameters:
• project: name of the project to analyse;
• repo: name of the directory containing the source code;
• mailinglists: lists of mailing lists names and typologies;
150

B.3. Analyse high-volume communities
• description: description of the project to analyse;
• revisions: lists of versions to analyse. If this parameter is not present all theproject history will be analysed using three months windows. It is possibleto set this parameter to “3months” in order to analyse at most the last threeyears of activity using three months windows;
• tagging: collaboration detection method.
An example of a valid configuration file, which allows to analyse Cassandra project,is the following:
project: Cassandrarepo: cassandramailinglists:
- {name: gmane.comp.db.cassandra.devel ,type: dev, source: gmane}
description: Cassandra projectrevisions: 3monthstagging: proximity
B.3 Analyse high-volume communities
In order to positively conclude collaboration analysis, provided by Codeface, ofhigh-volume software development communities (e.g., Firefox and LibreOffice) it wasnecessary to make the following changes:
• Increase the value of the variable «max_packet_size» in “codeface/dbman-ager.py”
• Add the following parameters to MySQL configuration file:
[ mysqld ]innodb_buffer_pool_size = 3Ginnodb_buffer_pool_instances = 3wait_timeout = 3600innodb_log_buffer_size = 800Mnet_read_timeout = 600net_write_timeout = 600innodb_lock_wait_timeout = 500
[ mysqldump ]max_allowed_packet = 1024M
151
B. Codeface4Smells
B.4 Utility tools
This section illustrates all utility scripts specifically developed to address someproblematics or necessities occurred during this master thesis execution. The firstscript can be used before the collaboration analysis in order to purge unsupportedcharacters from a mailing list archive, to avoid undesired behaviors. The secondscript generates an Excel file that sums up all the relevant correlations found betweenCommunity Smells and quality factors of a set of Codeface4Smells analysis results.Finally, the third and last script generates scatter plots of some specific qualityfactors, considering a set of Codeface4Semlls analysis results. All the developedutility scripts are available on-line [75].
1. Purge mailing list archive
Codeface comes with an R file which allows to download a specific project’smailing list archive from www.gmane.org, generating a valid «.mbox» file thatcan be used to execute Codeface collaboration analysis. In some unlucky casesit is possible that downloaded mailing list archives contain non-readable orinvalid characters, which cause Codeface to crash without successfully ter-minating the collaboration analysis of a project. This situation is likely tohappen when many Asiatic or non-common characters are used in mailing listmessages or within user e-mail addresses.
A python script was created to purge a mailing list archive from all these invalidcharacters and enhance the success probability of communication analysis. Thesequence of steps that should be followed to obtain a bullet proof mailing listarchive is the following:
(a) Download a mailing list archive using the script provided by Codeface:«codeface/R/ml/download.r»;
(b) Rename the mailing list archive as «mail.mbox» and move it in the di-rectory with our script;
(c) Execute the script «clean_mail.py»;
(d) Rename «mail-clear.mbox» to the appropriate mailing list name specifiedin the configuration file.
2. Correlations summary
Codeface4Smells enables to measure at what extent Community Smells areinfluenced by socio-technical quality factors. These relationships are exploredby calculating Pearson and Spearman correlation analysis and the results ofsuch analysis are included in the project report produced by Codeface4Smells.Pearson and Spearman methodologies are both considered because the firstfocuses on linear relationships while the last one focuses on not linear ones.
152

B.4. Utility tools
The «correlation_results.r» R script was developed to automatically gener-ate an Excel file that summarises all the relevant correlation found analysingFLOSS projects. It considers all Codeface4Smells analysis results present atits same hierarchical level and extracts all the correlation information fromthem, identifies all the important correlations (a correlation is interesting ifits p-value is less than 0.05) and groups relevant correlations with respect tothe software development community size. If both Pearson and Spearmanmethodologies detect a relevant correlation between a Community Smell anda socio-technical quality factor, the generated summary will show the one withthe minor p-value.
3. Scatter plots
In order to understand to what extent Community Smells are influenced bydifferent socio-technical quality factors, we generated scatter plots of everyrelevant correlation found between Community Smells and quality factors be-longing to our Socio-technical Quality Framework. Scatter plots were fun-damental to identify thresholds capable of suggesting healthy values of somesocio-technical quality factors. To provide useful models the script removesoutliers and provides two regression model approaches:
(a) loess model: «scatter_plots_loess.r»
(b) linear model: «scatter_plots_lm.r»
153

B. Codeface4Smells
154
Appendix C
Reports of reference projects
This appendix includes detailed results obtained from the execution of Code-face4Smells analysis on the following three reference software projects: Firefox, Li-breOffice and FFmpeg. For each reference project the following information arepresented:
1. Report of Codeface4Smells analysis: constituted by the quantification of qual-ity factors, belonging to our Socio-technical Quality Framework, and Commu-nity Smells for all the twelve ranges, of three months each, considered in theanalysis;
2. Pearson’s correlation analysis: constituted by the correlation coefficient andits associated p-value of every different couple of quality factors, belonging tothe Socio-technical Quality Framework, and/or Community Smells;
3. Spearman’s correlation analysis: as Pearson’s correlation analysis, it is consti-tuted by the correlation coefficient and its associated p-value of every differentcouple of quality factors, belonging to the Socio-technical Quality Framework,and/or Community Smells.
The complete datasets of results and graph reports, that summarise trends of im-portant quality factors with respect to every range and to the entire analysis timeperiod, of the three reference projects are accessible on-line [75], where it is also pos-sible to retrieve Codeface4Smells analysis results of all the 60 software developmentcommunities analysed during the evaluation part of this master thesis.
155

C. Reports of reference projects
C.1
Firefox
FigureC
.1:C
odeface4Smells
analysisreport
-Firefox
156

(a) Pearson’s correlation (coefficient)
(b) Pearson’s correlation (p-value)
Figure C.2: Pearson’s correlation analysis - Firefox
157

C. Reports of reference projects
(a) Spearman’s correlation (coefficient)
(b) Spearman’s correlation (p-value)
Figure C.3: Spearman’s correlation analysis - Firefox
158

C.2
Libr
eOffi
ce
Figu
reC
.4:
Cod
efac
e4Sm
ells
anal
ysis
repo
rt-L
ibre
Offi
ce
159

C. Reports of reference projects
(a) Pearson’s correlation (coefficient)
(b) Pearson’s correlation (p-value)
Figure C.5: Pearson’s correlation analysis - LibreOffice
160

(a) Spearman’s correlation (coefficient)
(b) Spearman’s correlation (p-value)
Figure C.6: Spearman’s correlation analysis - LibreOffice
161

C. Reports of reference projects
C.3
FFmpeg
FigureC
.7:C
odeface4Smells
analysisreport
-FFmpeg
162

(a) Pearson’s correlation (coefficient)
(b) Pearson’s correlation (p-value)
Figure C.8: Pearson’s correlation analysis - FFmpeg
163
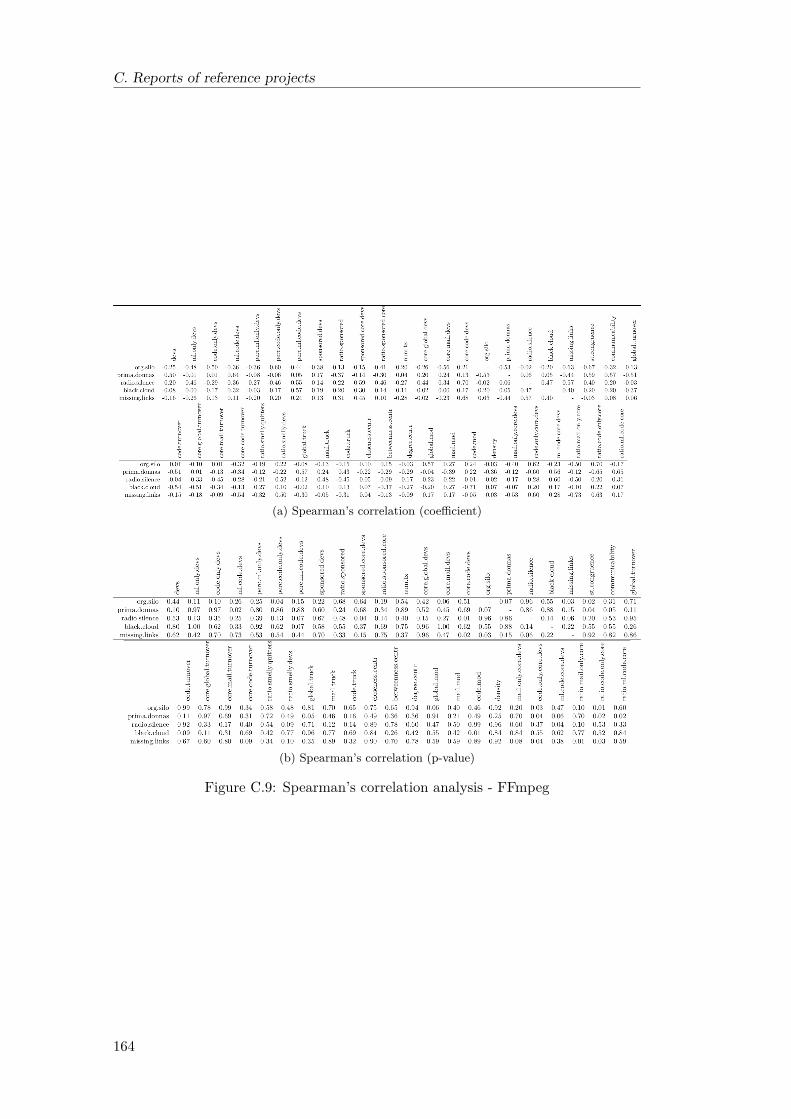
C. Reports of reference projects
(a) Spearman’s correlation (coefficient)
(b) Spearman’s correlation (p-value)
Figure C.9: Spearman’s correlation analysis - FFmpeg
164