an analysis of the value chain for indigenous chickens in ... · an analysis of the value chain for...
TRANSCRIPT

Journal of Agricultural Studies
ISSN 2166-0379
2014, Vol. 2, No. 2
www.macrothink.org/jas 32
An Analysis of the Value Chain for Indigenous
Chickens in Zambia’s Lusaka and Central Provinces
Richard Bwalya
Institute for Economic and Social Research, University of Zambia
P.O. Box 32379, Lusaka, Zambia
Tel: 260-097-119-1231 E-mail: [email protected]
Thomson Kalinda (Corresponding author)
Department of Agricultural Economics and Extension, University of Zambia
Great East Road Campus, P.O. Box 32379, Lusaka, Zambia
Tel: 260-096-645-4366 E-mail: [email protected]
Received: June 4, 2014 Accepted: June 16, 2014
doi:10.5296/jas.v2i2.5918 URL: http://dx.doi.org/10.5296/jas.v2i2.5918
Abstract
Despite the enormous potential that indigenous chickens (Gallus gallus domesticus) have for
sustaining livelihoods, their production and marketing has been mostly neglected resulting in
the sub-sector being highly underdeveloped with poor linkages between producers and
consumers. The main objective of this study was to map and analyze the value chain for
indigenous chickens in Lusaka and Central Provinces of Zambia. The study also analyzes the
value added and the associated costs in the chain. Findings show that although almost all (99
percent) of smallholder households keep indigenous poultry, productivity and production is
very low leading to low and unplanned sales. Low production is due to high mortality of
indigenous chickens mainly as a result of limited producer knowledge of methods of disease
prevention and breeding practices. The absence of processing along the value chain means
that chickens are sold live (in open markets) and consequently cannot be retailed through
formal channels like supermarkets leading to exclusion of potential middle and high income
consumers. Although the value chain for indigenous chicken shows positive gross margins
for all the players along the chain, there is need to address the various constraints affecting
the value chain in order to improve the operation of the chain and hence lead to increased

Journal of Agricultural Studies
ISSN 2166-0379
2014, Vol. 2, No. 2
www.macrothink.org/jas 33
incomes for the value chain actors and at the same time ensuring cheap delivery of
indigenous chicken in a more convenient form and in formal outlets.
Keywords: Indigenous chickens, Value chain, Chicken consumption, Zambia
1. Introduction
1.1 Background
The livestock sector is important to Zambia as it contributes about 42 percent of the national
agricultural output. The sector has potential for growth especially among smallholder farmers.
Available statistics show that in 2001, the livestock population was estimated at 1.5 million
cattle, 1.2 million goats, 500,000 pigs, and 51,000 sheep. By 2008, the population of
livestock had grown to about 2.8 million cattle, 2.4 million goats, 1 million pigs, and 157,000
sheep (Lubungu, et al., 2012). In 2001, poultry production was estimated at around 12
million broiler birds, 3 million commercial layers and 11 million indigenous chickens. By
2011, the country increased its poultry production to an estimated 36 million broiler birds, but
the population of commercial layers was stagnant at about 3 million birds (Songolo, 2001;
Ngosa, undated). A majority of the rural households in Zambia keep flocks of village or
indigenous chickens (Gallus gallus domesticus) with little inputs. The indigenous chickens serve
as the main source of protein; income through sales of eggs and birds; and essential goods
and services through barter (Haazele et al., 2002). There is also a link between indigenous
poultry production and pro-poor livestock policies. According to Dolberg (2003), considering
that the majority of indigenous chickens are owned by women, growth of the sub-sector is
likely to be pro-poor as money in the hands of women tends to bring about educational and
nutritional benefits to the children and households in general.
Although indigenous chickens tend to have lower feed efficiency, their economic strength
lies in the low cost of production when compared to the value of their outputs (King’ori et al.,
2003; Tadella et al., 2003). Unlike broiler production for which feed purchases constitute
over 65 percent of the cost of production (Zambia Poultry Association, 2010), indigenous
chicken mainly survive on scavenging. They also fetch a premium price in Zambia as the
meat is highly preferred to that of broiler chickens, especially among the affluent, due to its
low fat content.
The role of indigenous chicken in asset creation and as an entry point to improved livelihoods
among the resource-poor rural households in Africa has been well-documented. Okello et al.,
(2010) and Magothe et al., (2012) show that in Kenya, indigenous chickens play a significant
role in contributing to the nutritional and economic welfare of resource-poor rural households
through provision of protein and cash income. Indigenous chickens have also been found to
play a significant role in the fight against HIV and AIDS in Zimbabwe where women and
child-headed households have used them as part of their consumption-smoothening strategies
when incomes fluctuate due to various shocks (Mutenje et al., 2008). Indigenous chickens
have also been used as a source of high quality protein and micronutrients in Mozambique
and Zambia where households headed by widows and children find them as the easiest
species of livestock to produce (Alders et al., 2007; Simainga et al., 2010; Simainga et al.,

Journal of Agricultural Studies
ISSN 2166-0379
2014, Vol. 2, No. 2
www.macrothink.org/jas 34
2011). In Botswana, Moreki and Dikeme (2011) report that indigenous chickens provide a
first step in the process (livestock ladder) of acquiring larger livestock such as goats and cows
for resource-poor, HIV and AIDS-stricken households. Government agencies and
development organizations have also acknowledged the role of indigenous chicken in poverty
alleviation. In Zambia, evidence from vulnerability assessments by the National Disaster
Management and Mitigation Unit (DMMU) show that households with chickens are better
able to survive droughts and recover the following year than households without chickens
(DMMU, 2008).
Ownership of indigenous chicken has been shown to have a direct or indirect influence on
improving livelihoods. For instance, as a source of eggs and meat, indigenous chicken can
also contribute to human capital formation through the positive influence that consumption of
food of animal origin has on poor people’s health (Perry et al., 2002; Mack et al., 2005).
Similarly, Asem-Bansa et al. (2012) show that indigenous chicken can contribute to increased
availability and access to micronutrient-rich animal protein in Sub-Sahara Africa where diets
are predominantly plant-based and micronutrient deficiencies in children are highly prevalent.
They also contribute towards increased natural capital through provision of manure that can
be used in maintaining soil fertility.
According to Dolberg (2004), strategies that use poultry production for livelihood
improvement and poverty alleviation are likely to be most relevantly applied in the countries
where it has been most difficult to get development moving. Pica-Ciamarra and Otte (2010)
show that there is evidence that investment in small-scale poultry farming generates
handsome returns and contribute to poverty reduction and increased food security in regions
where a large share of the population keeps some poultry birds. This is the case in Zambia
where over 95 percent of rural households have been shown to keep flocks of indigenous
chicken (Simainga et al., 2011; Haazele et al., 2002). However, regardless of the enormous
potential that the livestock sector (poultry inclusive) has for contributing to national
development, the sector has been mostly neglected as most policies on agriculture have been
biased towards crop production (Yambayamba and Musukwa, 2007). Furthermore, the little
effort given to livestock is mostly directed at cattle while poultry and other small livestock
get very little attention. Consequently, the indigenous poultry sub-sector is still highly
underdeveloped with poor linkages between producers and consumers. For instance,
information on the market players, the market size and market constraints are often lacking.
Furthermore, the few studies done on the sub-sector are focused on the production side while
the marketing aspect has been neglected (Haazele et al., 2002; Yambayamba and Musukwa,
2007). Consequently, growth of the sub-sector is constrained by lack of information and a
poor marketing system.
This study was therefore motivated by the need to contribute to knowledge about markets for
local poultry in Zambia. The main objective of this study was to map and analyze the value
chain for indigenous chickens in Zambia. The study specifically identifies the major players
in the value chain for indigenous chickens in Lusaka and Central Provinces of Zambia. The
study also analyzes the value added and the associated costs in the chain.

Journal of Agricultural Studies
ISSN 2166-0379
2014, Vol. 2, No. 2
www.macrothink.org/jas 35
2. Conceptual Framework
This study employs a Value Chain Analysis (VCA) framework to understand the value chain
for indigenous chickens in Lusaka and Central provinces of Zambia. As defined by Kaplinsky
and Morris (2001), the value chain describes the full range of activities which are required to
bring a product or service from conception, through the different phases of production (i.e.
involving combinations of physical transformation and the input of several producer services),
delivery to final consumers and final disposal after use. The VCA seeks to understand the
various factors that drive the incentives, growth, and competitiveness within a particular
industry and identify opportunities and constraints to increasing benefits for stakeholders
operating throughout the industry. This feature of VCA lends to its completeness as a
strategic tool in exploring different alternative strategies for poverty reduction (AsiaDHRRA,
2008). The purpose of analyzing the value chain for indigenous chickens is to identify key
points of intervention along the chain and to recommend specific policy directions to enhance
the competitiveness of the indigenous chicken sub-sector. The analysis is premised on the
assumption that different agents across the value chain behave based on key market signals
and moderating variables provided by the enabling policy, economic and technical
environment. Producers, wholesalers, processors and consumers interact based on specific
capital requirements and information they obtain from various market sources. Furthermore,
dynamics of market interactions are balanced by the conditions set forth by different market
policies, technological advancements, and socioeconomic, cultural and environmental
concerns (AsiaDHRRA, 2008).
This VCA framework has been widely used to study the indigenous poultry sub-sector and its
effects on the livelihoods of the rural households in Less Developed Countries (LDCs) of
Africa and Asia. For instance, Okello et al. (2010) used the framework to examine the
indigenous and commercial hybrid poultry systems with the aim of identifying the actors,
assessing poultry and poultry products flows as well as highlighting some of the policies and
regulations relevant to potential outbreaks of Highly Pathogenic Avian Influenza (HPAI) in
Kenya. The framework was also used in Kenya to study the indigenous chicken sub-sector in
terms of organizational aspects, sub-sector map revision, value chain mapping and isolation
of constraints as well as matching of opportunities (Mathuva, 2005). In Ghana, Asem-Bansah
et al., 2012 used a value chain framework to qualitatively assess backyard poultry enterprises
with the aim of understanding how the activities and relationships among the actors along the
chain influence enterprise performance and its implications for development of the industry.
Value chain analysis of indigenous chicken has also been used in Asia. Particularly, it has
been used in Cambodia with the aim of contributing to the process of linking rural industries
and enterprises into the mainstream markets, as well as providing information to help
policy-makers harness and maximize the benefits of the value chain and developing strategic
linkages between chicken producers, market players and consumers (ASIADHRRA, 2008). It
has also been used in Myanmar with the aim of finding ways to increase incomes, improve
market access and improve children’s well-being for the poorest households and communities
(Thi Mar Win, 2012). Similarly, as part of a larger framework of studies supported by the
Food and Agricultural Organization (FAO), Sudarman et al. (2010) used VCA to understand

Journal of Agricultural Studies
ISSN 2166-0379
2014, Vol. 2, No. 2
www.macrothink.org/jas 36
the impacts of HPAI as well as highlight the direct commercial and livelihood impacts and
potential socio-economic risk factors emanating from the indigenous chicken value chains in
Indonesia.
3. Methodology
3.1 Data Collection and Study Areas
Both secondary and primary data was collected and utilized for this study. The secondary data
was gathered through desk research and key informant interviews. Secondary data was
collected through a review of published and unpublished material including past value chain
studies. The main archival data was collected from the relevant websites, documents, reports
and academic papers and journals. Focus of the review and key informant interviews was on
the specific research objectives as outlined above and to highlight any pertinent issues
concerning the value chain for indigenous chickens in Zambia.
The primary data was collected from farmers in Zambia’s Lusaka and Central Provinces.
Data was collected from smallholder farmers in Chibombo and Mumbwa Districts as well as
assemblers/wholesalers, retailers, processors and final consumers from Lusaka District.
Multi-stage sampling was used in selecting the farming households. The first stage involved
selecting the districts surrounding Lusaka, leading to Chongwe and Mumbwa Districts being
purposively selected from a list of districts surrounding Lusaka District that include
Chibombo, Kafue, Mumbwa and Chongwe. The main reason for their inclusion is that they
represent the largest proportion of rural households producing local poultry that is consumed
in Lusaka among the surrounding districts. The second stage involved selecting the villages
within these districts and finally the final units (the farm households). Using area maps, 10
villages were randomly selected from each district. Selecting the individual households
involved starting from a central place such as a market place. Then each nth
household was
interviewed in each direction until the quota for each village was reached (15 farm
households). In total, the sample comprised of 315 households of which 161 were drawn
Chongwe and 154 from Mumbwa.
For the consumer households (Lusaka District), the aim was to analyze the data in clusters
based on income. For this purpose, the district was divided into low income, middle income
and high income residential areas so as to be able to assess the effects of income on
consumption of indigenous poultry. A list of suburbs in each cluster was used as a sampling
frame from which a list of suburbs was selected. Starting from a central starting point, every
nth
household was interviewed (depending on size of the suburb) until the quota was reached.
The total consumer sample size was 297 households (that is 97 households from high income
households; 74 households from middle income households and 126 households from low
income households).
For each suburb selected, the closest market was selected and a minimum of three indigenous
poultry traders (retailers) interviewed. This gave a total sample of 30 indigenous poultry
retailers. For the processors, the restaurants where classified into two categories; those around
the town center (central business district) and those in the periphery markets. A total sample

Journal of Agricultural Studies
ISSN 2166-0379
2014, Vol. 2, No. 2
www.macrothink.org/jas 37
of 30 restaurants was included in the sample. The wholesalers/assemblers were drawn from
Soweto and Chibolya markets (the largest wholesale markets for indigenous poultry).
3.2 Data Analysis
For purposes of this study, descriptive data analysis was employed to characterize the value
chain for indigenous chickens in Zambia. The data collected was analyzed to identify the main
actors and to characterize the key structure or elements of the value chain. Quantitative and
qualitative data collected from documents and key informants was also analyzed to assess the
costs and value addition activities in the marketing chain for indigenous chickens. A
descriptive-analytical narrative was used to present the findings from the study in order to have
a comprehensive picture of the key issues concerning the value chain for indigenous chickens,
particularly, in Lusaka and Central Provinces of Zambia.
4. Results and Discussion
4.1 Value Chain Map of Indigenous Chickens in Zambia
The value or marketing chain for indigenous chickens in Zambia is simple and under
developed with no infrastructure at all save for some market stalls in the urban trading centres
in Lusaka and other major towns. The main actors along this value chain are smallholder
farmers, primary collectors and live bird traders and agents, wholesalers and retailers. The
main marketing channels are from farmer to trader or consumer (informal marketing). The
other marketing channel is from farmer to retailer and then to consumer (primary marketing).
Some farmers sell directly to restaurants while others sell to traders (middlemen) who take
their chickens either to secondary markets and urban markets (wholesalers). The final, end
market of indigenous chickens is domestic consumption through retailers. Figure 1 shows the
indigenous chicken value chain map.
Roadside
Village Market
Neighbours
Figure 1. Indigenous chicken value chain map in Zambia
The survey data shows that the majority (32.3 percent) of the indigenous chickens are moved
from the producers to consumers through middlemen. The middlemen buy the chickens from
Producers
Middlemen
Wholesalers Retailers
Processors
Co
nsu
mer
s

Journal of Agricultural Studies
ISSN 2166-0379
2014, Vol. 2, No. 2
www.macrothink.org/jas 38
neighboring farmers for sale at nearby markets within the districts or sell to assemblers for a
markup. The second most important channel was the roadside (30.3 percent). This was
mostly used by those households that are located near the main highways and the targeted
markets are the motorists. Local markets such as schools or hospitals account for 20.1 percent
while another 13.3 percent are sold through neighbors within the same village either on cash
or barter basis.
4.2 Value Chain Actors and Market Chain
4.2.1 Production at Farm Level
Semi-intensive smallholder chicken raring is a common type of poultry production in the rural
areas of Zambia. Indigenous or village chickens freely roam around homesteads and scavenge
for food with very little supplementary feeding being provided. The indigenous chickens cause
minimal destruction to the environment and require minimal external inputs. Reasons for
keeping indigenous chicken are varied and include food security, trading, barter or for quick
cash when a domestic need arise as well as fulfilling customary obligations. The survey data
shows that almost all the households (99.0 percent) in both Chongwe and Mumbwa districts
owned chickens. The data shows that only 43.9 percent of the households reported making
attempts at improving their flock type through deliberate breeding programmes. The data
further shows that ownership of chicken cuts across all gender; women, men and children
owned chickens. However, female-headed households have fewer chickens on average (24)
compared to their male counterparts (30). As shown in Table 1, in terms of flock size and
composition, an average household tends to have more chicks (16.25) followed by hens (10.3)
and cocks (2.6).
Table 1. Average number of Indigenous Chickens owned and Mortality Rates by District
Variable District Chicken type
Cocks Hens Chicks
Flock size
Mumbwa 2.8 10.9 17.5
Chibombo 2.4 9.7 15.0
Total 2.6 10.3 16.25
Mortality
Mumbwa 1.04 2.52 10.16
Chibombo 0.44 0.94 7.93
Total 0.74 1.73 9.05
Furthermore, the data shows that mortality is quite high among chicks (9.05) followed by
hens (1.73) and cocks (0.74). The limited rearing of indigenous chickens in large numbers
could be attributed to their slow growth rates; poor egg production, high mortality rates and
susceptibility to diseases. The major disease that severely affects indigenous poultry
production is Newcastle Disease (ND), the highly infectious viral disease. The extremely high
mortalities reported for ND is a major factor that discourages peasants from investing much of
their time and scarce resources in expanding flock size. At the production level, usage of
improved technologies for producing indigenous chicken is very low. Most producers have

Journal of Agricultural Studies
ISSN 2166-0379
2014, Vol. 2, No. 2
www.macrothink.org/jas 39
not been exposed to any modern technologies that could raise productivity. Basic poultry
housing among respondents in the villages surveyed was generally absent. Some of the
respondents shared accommodation with chickens except in some cases where they have built
separate housing for the chickens. The food resources of indigenous chickens consisted of
herbs or cereal seeds, insects which the birds scavenge with very little supplementary feeding
provided by the owners.
There is a general lack of extension and veterinary services in most rural areas and
consequently producer knowledge of methods of disease prevention and breeding practices is
quite low. About almost 92% of the respondents mentioned that their indigenous chickens
have suffered clinical symptoms consistent with Newcastle Disease (ND) and or Infectious
Bronchitis (IB). Farmers are still using traditional herbs for prevention of diseases while
chickens are housed in unconventional houses that expose them to adverse weather elements
such as rainfall and cold leading to high mortality and seasonality of production. Despite this,
most of Zambia’s rural population lives in areas where the indigenous chicken is best adapted
to the harsh living conditions. It is speculated that with minimal technical and institutional
support, the indigenous chicken could contribute significantly to the agricultural economy and
could curtail the vicious cycle of poverty and poor human nutrition.
4.2.2. Marketing at Farm Gate
As mentioned above, most households rear indigenous chickens as part of their livelihood
strategy. The survey results show that the main reasons for keeping chickens included selling
(14.6 percent); home consumption (12.7 percent); selling and home consumption (70.1
percent). Only 23.6 percent reported keeping and selling chickens sorely for business
purposes. For those that reported selling chickens, the main reasons for selling included the
need to pay for children’s school fees (62.0 percent) and the need to pay medical bills (13.9
percent). The majority of the households (96.2 percent) reported having sold an indigenous
chicken. However, although most of the households reported selling chickens, sales were
quite low (Table 2) with only 17 households reporting selling chickens on a weekly basis.
Even among those who sold, the levels of sales were low (with 88.2 percent selling less than
5 chickens per week). Similarly, consumption of chickens was quite low among these
households. Only 17.1 percent reported consuming a chicken once a week, whereas the
majority (86.0 percent) consumed a chicken monthly
Table 2. Frequency of Selling Chickens
Time frame No of chickens sold Frequency Percentage
Weekly
0 to 10 15 88.2
11 to 15 - -
More than 16 2 11.8
Monthly
0 to 10 149 84.2
11 to 15 23 13.0
More than 16 5 1.7
The marketing system for indigenous poultry is a simple one, involving a number of market

Journal of Agricultural Studies
ISSN 2166-0379
2014, Vol. 2, No. 2
www.macrothink.org/jas 40
intermediaries who take possession of the poultry before passing on the birds to the retailers
or consumers. The prices obtained for the chickens by the farm household were also
dependent on the channel used. For instance, data from the producer household interviews
(Table 3) shows that on average, those that sold through producer groups received the highest
prices for both cocks and hens (K32 273 and K24 091 respectively) while those that sold to
neighbors got the lowest prices (K28 816 and K20 615 respectively)1.
Table 3. Marketing channel used by Price received
Outlet/Channel Average prices received per chicken sold (Zambian Kwacha)
Cocks Hens Chicks Average (hens & cocks)
Middlemen/Assemblers 30 705 23 105 9 349 27 226
Neighboring markets 30 729 22 847 8 897 26 788
Neighbors 28 816 20 615 8 000 24 750
Producer groups 32 273 24 091 11 000 28 181
Roadside 30 618 23 191 10 138 26 904
4.2.3 Wholesaling/Assembling
Table 4 presents a summary of costs incurred during the assembly process. Based on the data
from the assemblers/wholesalers, the average cost of an indigenous chicken at the farm level
(average for cocks and hens) was K22 933. This figure is lower than the average reported as
the selling price from the producer household survey (K27 226) in Table 3. For the sampled
wholesalers, the average number of chickens assembled per trip was 79 while a trip lasted six
days on average. The average spent on food and accommodation during this process was K34
200 per day or K2 579 per chicken bought. The cost of transportation to the roadside was
quite minimal (K77 per chicken). The assemblers paid an average of K1 322 on the trucks to
move the chickens to Lusaka, in addition to council levies along the road which averaged to
about K1 566 per chicken. Other costs incurred are shown in Table 4. When these chickens
are landed in Lusaka, they are either sold in bulk to other retailers at wholesale prices or sold
apiece at retail prices to individual consumers who prefer to buy directly from wholesalers as
they tend to be slightly cheaper than the retailers. The average wholesale (bulk purchase)
price (hens and cocks) was reportedly K33 133 per chicken while the average retail price (for
those who buy one chicken) was K36 633 regardless of whether they purchased directly from
farmers or assemblers/middlemen.
Table 4. Marketing Costs from Farm gate to the Wholesale markets
Activity Purchasing from farmers Purchasing from local assemblers
Average cost (K) Share (total cost)% Average cost (K) Share (total cost) %
Chicken cost 22 933 75.3 27 226 84.68
Assembly costs 2 579 8.47 0 0%
Local transport 77 0.25 77 0.24
Counsel levies 1 566 5.14 1 566 4.87
1 At the time of the study, the Zambian Kwacha/United States Dollar exchange rate was K5 000/US$1

Journal of Agricultural Studies
ISSN 2166-0379
2014, Vol. 2, No. 2
www.macrothink.org/jas 41
Transport to Lusaka 1 322 4.34 1 322 4.11
Market fees 300 0.99 300 0.93
Loss in transit/storage 1 661 5.45 1 661 5.17
Total Cost 30 448 32 152
Selling price (Wholesale) 33 133 33 133
Selling price (retail) 36 633 36 633
4.2.4 Retailing
Retailers are another important component of the indigenous chicken value chain. It is
through them that the majority of the chickens get to the final consumers, the households.
These are usually found in the markets which are scattered around the suburbs and procure
the chickens either directly from the farms or from wholesalers at wholesale prices. The costs
involved in procuring chickens from the wholesalers to the retail markets include the cost of
purchasing the chickens, transportation, market fees, council levy, storage costs as well as
losses in transit and during storage. Table 5 presents a summary of the costs associated with
marketing of indigenous chickens from wholesale to retail markets. In this table, the chicken
cost is based on the average prices computed for wholesale selling price (K33 133).
Table 5. Marketing Costs faced by retailers from Wholesale to Retail markets
Marketing Activity Average cost (Zambian Kwacha) Share to total cost
Chicken cost 33 133 92.7%
Transportation 1 460 4.1%
Market fees 102 0.3%
Losses in transit/storage 1 047 2.9%
Total costs 35 742
Selling price 38 979
4.2.5 Processing
Although restaurants only accounted for a small proportion of indigenous chicken marketed,
they are an important segment of the value chain as they are the only ones adding value
through processing. For this study, 30 restaurants where included in the sample drawn from
low income (33.3 percent); medium income (50.0 percent) and high income (16.7 percent)
areas. The low income areas within Lusaka included Garden, Chaisa and Chilulu compounds;
the medium income areas included Kabwata, COMESA and Town Center markets while the
high income area was Thornpark. Of the sampled restaurants, 60 percent served indigenous or
village chicken to their clients. Furthermore, the survey data shows that the income category
served had a bearing on whether a restaurant served indigenous chicken with those
restaurants catering for the medium and high income categories tending to serve more
indigenous or village chicken compared to those catering for low income category (Figure 2).
Journal of Agricultural Studies
ISSN 2166-0379
2014, Vol. 2, No. 2
www.macrothink.org/jas 42
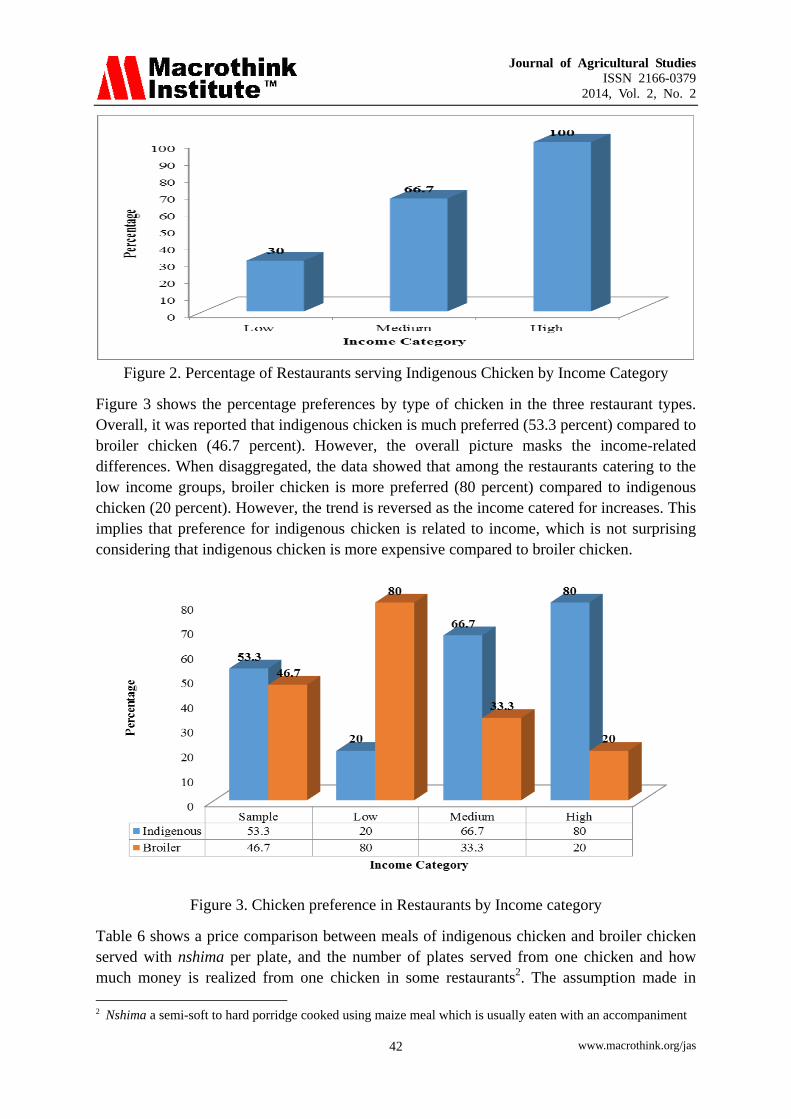
Figure 2. Percentage of Restaurants serving Indigenous Chicken by Income Category
Figure 3 shows the percentage preferences by type of chicken in the three restaurant types.
Overall, it was reported that indigenous chicken is much preferred (53.3 percent) compared to
broiler chicken (46.7 percent). However, the overall picture masks the income-related
differences. When disaggregated, the data showed that among the restaurants catering to the
low income groups, broiler chicken is more preferred (80 percent) compared to indigenous
chicken (20 percent). However, the trend is reversed as the income catered for increases. This
implies that preference for indigenous chicken is related to income, which is not surprising
considering that indigenous chicken is more expensive compared to broiler chicken.
Figure 3. Chicken preference in Restaurants by Income category
Table 6 shows a price comparison between meals of indigenous chicken and broiler chicken
served with nshima per plate, and the number of plates served from one chicken and how
much money is realized from one chicken in some restaurants2. The assumption made in
2 Nshima a semi-soft to hard porridge cooked using maize meal which is usually eaten with an accompaniment

Journal of Agricultural Studies
ISSN 2166-0379
2014, Vol. 2, No. 2
www.macrothink.org/jas 43
making the comparison is that the cost of preparing nshima is the same for both types of
chicken. However, there is likely to be slight variations in terms of costs incurred in
preparing the two types of chicken. Since indigenous chickens are purchased live from
retailers and have to be slaughtered and dressed, it takes more time to prepare. On the other
hand, whereas some restaurant owners prefer to purchase live broiler chickens, most of them
procure dressed ones and hence incur less costs in terms of preparation. Furthermore, most
broiler chickens are usually served grilled (which is a less costly method of preparing), as
compared to indigenous chickens which are usually served as stews (which is more costly).
From this comparison as clearly shown in Table 6, restaurants on average make more money
when they sell or serve indigenous chicken meals as compared to broiler chicken meals. The
average amount raised is computed by multiplying the average number of plates served from
one chicken by the average price per plate.
Table 6. Comparison of Prices between Meals serving Indigenous and Broiler chicken
Meal type/Plates served Sample Income category catered for
Low Medium High
Average Price of nshima served with Indigenous chicken (K) 13 367 7 500 13 000 19 600
Average Number of plates served 8 10 8 5
Average Amount of money raised (K) 98 867 75 000 104 000 117 600
Average Price of nshima served with Broiler chicken (K) 10 312 5 835 10 500 14 600
Average Number of plates served 9 12 8 6
Amount of money raised (K) 80 540 70 020 84 000 87 600
In summary, restaurants are the only ones adding value to indigenous chicken through
processing. However, the quantities processed are quite small compared to that of live birds
sold to most consumers. Indigenous chicken is served in restaurants catering to all income
categories, although it is mostly found in those restaurants catering to the high income
categories. Compared to broiler chicken, it costs more to procure and prepare. However, the
returns per chicken are also much higher than those for broiler as it fetches premium prices.
The direct costs incurred during preparation of indigenous chicken include energy,
ingredients (cooking oil, onions and tomatoes) and labor. However, these direct costs for
preparation were estimated to amount to a maximum of K15 000 per chicken. Based on this
estimation, Table 7 shows the estimated costs and prices involved in delivering indigenous
chicken to consumers in a restaurant.
Table 7. Marketing Costs from Wholesale to Retail markets
Marketing Activity Average Cost (Kwacha) Share to Total Cost (%)
Chicken cost 38 979 72.2
Processing 15 000 27.8
Total costs 53 979
Selling price 98 867
of vegetables and/or livestock products. Nshima is Zambia’s staple food and is commonly served in homes and
restaurants.

Journal of Agricultural Studies
ISSN 2166-0379
2014, Vol. 2, No. 2
www.macrothink.org/jas 44
4.2.6. Consumers
Demand for indigenous chicken, especially among the affluent, is very high because of its
low fat content compared to broiler chicken. The demand for indigenous poultry in Zambia
can be divided into two major segments, urban and rural. The urban segment of the
indigenous chicken market comprises of Lusaka and Copperbelt. According to Haazele et al.
(2002), there are several segments that can be identified within this urban market. These
include (i) the high income groups, (ii) medium income groups, (iii) low income groups, and
(iv) restaurants and lifestyle consumers. For the purposes of this value chain analysis, we
concentrate on the high income, middle income, low income and restaurants.
4.3 Consumption of Indigenous Chicken (analysis of end-market preferences)
The majority of the households (87.7 percent) reported consuming indigenous chicken.
Furthermore, the data shows that households consumed more broiler chicken (3.36 times per
month) than indigenous chicken (2 times per month). Low income households (Figure 4)
consumed more indigenous chicken per month on average (2.34 times) compared to high
income households (1.9 times).
Figure 4. Consumption of chicken by chicken type and income category
For those that did not consume indigenous chicken, among the reasons given included
non-availability (29.8 percent), not easy to prepare3 (19.3 percent) and high cost (14.0
percent) among others. Considering that availability was the main reason for not consuming
indigenous chicken, the respondents were asked to provide information about where they
sourced the chickens from. The survey data shows that whereas broiler chicken, which is
consumed more often, is found in open-markets (53.1 percent), supermarkets (22.2 percent)
3 Preparation includes slaughtering and dressing

Journal of Agricultural Studies
ISSN 2166-0379
2014, Vol. 2, No. 2
www.macrothink.org/jas 45
and among households who rear in the backyards (18.2 percent), indigenous chicken is
mostly found in open markets (87.1 percent) and farms (12.9 percent) making it difficult to
access. The other aspect related to availability was price. On average, indigenous chicken was
more expensive (K34 247) compared to broiler chicken (K26 354). Similarly, there were
more consumers that perceived indigenous chicken as being very expensive (67.9 percent)
compared to those that perceived broiler chicken as being very expensive (32.1 percent).
Figure 6 is a comparison between prices of indigenous chicken and its closest competitors
(broiler chicken, beef and fish). The results show that indigenous chicken costs more than
broiler chicken and fish per kilogram. However, beef costs more than indigenous chicken per
kilogram.
Figure 6. Comparison of prices/kg between indigenous chicken and its competitors
In terms of preferences at household level, indigenous chicken was more preferred (52.5
percent) compared to broiler chicken (40.8 percent), a pattern that was consistent even across
income categories. Comparison of attributes of chicken (Table 8) shows that broiler scores
high on price (75.9 percent) as opposed to indigenous chicken (13.7 percent). Similarly,
broiler chicken scored high on availability (93.5 percent) compared to indigenous chicken
(27.3 percent). However, indigenous chicken scored highly on taste (98.6 percent) as opposed
to broiler (44.4 percent).
Table 8. Reasons for preference by Chicken type
Reason Chicken type Number Percentage
Price Broiler 82 75.9
Indigenous 19 13.7
Availability Broiler 101 93.5
Indigenous 38 27.3
Good taste Broiler 48 44.4
Indigenous 137 98.6
Sale by pieces Broiler 60 55.6
Indigenous 4 2.9

Journal of Agricultural Studies
ISSN 2166-0379
2014, Vol. 2, No. 2
www.macrothink.org/jas 46
For those that purchased indigenous chicken, the majority (35.9 percent) cited health reasons,
followed by good taste (35.1 percent) and size (12.9 percent). Only a few (5.8 percent)
mentioned availability and affordability (4.4 percent) as the reasons for purchasing
indigenous chicken. Similarly, those that did not consume indigenous chicken cited
non-availability (32.3 percent); high cost (29.0 percent) and inconvenience of slaughtering
and dressing (16.1 percent) among others as the reason for not consuming indigenous chicken.
However, the data shows that indigenous chicken is consumed across all households,
although not in similar proportions as broiler. Among the reasons why households do not
consume indigenous chicken include not being available in formal outlets such as
supermarkets, high cost as well as inconveniences faced due to the fact that indigenous
chicken is sold live and has to be slaughtered and dressed.
4.4 Value Chain Analysis
The following section sums up preceding sections by giving a detailed value chain analysis of
indigenous chickens from production to consumption (detailed costs from production,
wholesaling, retailing and processing) are also provided while the margins accruing to the
different players along the chain are also provided.
4.4.1 Margins from Production to Retail Level (Live Indigenous Chickens)
Figure 8 shows the costs from production to retail and also the margins accruing to the different
players. Assuming zero cost of production while a chicken costs K22 933 at the farmgate
(based on the reported cost of chicken by wholesalers when they purchase directly from
farmers), the farmer gets the most in terms of gross margins (100 percent). The assemblers get
the second highest margins (44.5 percent) as they purchase at K22 933 and sell at K33 133
while retailers get the least (17.6 percent). However, it is worth emphasizing that these are
gross margins which ignore the costs incurred in the process by the assemblers and retailers.
Figure 8. Value Chain Analysis
Average Production Cost
K0
Farmer Assembler Retailer Consumer
Average Farm gate Price
K22 933
Average Marketing Cost
K15 864
Average Wholesale Price
K33 133
Average Retail Price
K38 979
Gross Margins
Producer: K22 933 (100%) Assembler: K10 200 (44.5%) Retailer: K5 846 (17.6%)

Journal of Agricultural Studies
ISSN 2166-0379
2014, Vol. 2, No. 2
www.macrothink.org/jas 47
4.4.2 Margins from Processing to Consumption level (Restaurants)
As earlier indicated, the costs at processing include the cost of purchasing the chicken, labor
cost of preparing (i.e. slaughtering, dressing, cooking as well as serving) and cost of
ingredients (tomatoes, onions, oil and energy for preparing). The results from the survey of
the processors (mainly restaurants) showed that the following are the costs and margins
obtained:
Average cost of purchase: K38 979
Average cost of processing: K15 000
Total cost of (chicken + processing): K53 979
Selling price K98 867
Margin= K44 888 (83.2 percent)
Other than the producers who are assumed to almost get 100 percent margins from the
enterprise (because it is assumed that they incur zero cost of production), processors get the
next highest margins (83.2 percent)4 followed by the assemblers (44.5 percent). In
conclusion, it is worth noting that across the value chain, all the players get positive gross
margins with the farmers getting the highest followed by processors.
4.5 Analysis of the Environment
In terms of enabling environment, agricultural policies in Zambia have been highly biased
towards maize production with the aim of ensuring food security. For instance, the Farmer
Input Support Programme (FISP), a programme under which fertilizers and maize seed are
distributed to farmers for maize production, has always accounted for about 40 percent of the
total agricultural budget (Government of the Republic of Zambia, 2004). Similarly, extension
delivery has been tailored towards maize production at the expense of other crops and
livestock. However, in the Sixth National Development Plan (SNDP) for the period
2011-2015, there is a change in the policy direction with livestock development earmarked to
receive significant attention and budgetary allocations (Government of the Republic of
Zambia, 2010).
The low emphasis that small-livestock has received from policy-makers and other agencies
supporting agriculture is manifest through low levels of trainings received by the households
on techniques of indigenous chicken production. The household survey data shows that only
13.5 percent of the households reported having received any training on indigenous poultry
production. Of those that received these trainings, these were provided by government
extension workers (52.4 percent) and Non-governmental Organizations (47.6 percent).
Furthermore, although a good proportion of the farmers (66.3 percent) said they had
sufficient knowledge levels on good feeding practices, only 33.3 percent reported having
sufficient knowledge on disease control methods and only 22.8 percent reported having
sufficient knowledge on breed improvements. This is likely to have contributed to the
observed low production for indigenous chicken.
4 This margin is computed by dividing the margin (the difference between the selling price for processed chicken (98.867)
and the total cost (which is the cost of the chicken plus the processing cost) by the total cost

Journal of Agricultural Studies
ISSN 2166-0379
2014, Vol. 2, No. 2
www.macrothink.org/jas 48
Indigenous chicken production does not require much capital. All a farmer needs is to buy a
hen, build a crib using local materials and all is done. However, for wholesalers, they require
some minimum level of capital for them to engage in the business. For this sample, the
average amount of capital required to get into the indigenous retail business was K511 379
while the maximum was K1 200 000 and the minimum was K70 000. However, regardless of
the relatively little amounts of money required to start the business, only a few wholesalers
reported accessing loans (10.0 percent from microfinance institutions and 6.7 percent from
friends and other private sources). Among the retailers, 36.6 percent reported having access
to credit. The major consequence of lack of credit (as reported by those who did not have
access to credit) was inability to expand their businesses.
5. Conclusions and Recommendations
Based on the findings, it can be concluded that although the majority of smallholder
households keep indigenous poultry, this is considered as a part-time activity with only a few,
if any, that are keeping indigenous poultry on commercial basis. Furthermore, productivity
and production is very low leading to low and unplanned sales at the farmgate level. However,
looking at the differences between the minimum and the maximum production, and
considering that it is a low input activity, potential for growth exists. The indigenous poultry
value chain mainly consists of producers, assemblers/wholesalers and retailers. However, the
absence of processors along the chain means that chickens are sold live and consequently
cannot be retailed through formal channels like supermarkets leading to exclusion of potential
customers in the middle and high income categories who normally shop from supermarkets.
Furthermore, as population and incomes grow, demand for indigenous chicken is likely to
continue growing, especially among the high income groups who not only prefer it for its
taste, but also for health reasons due to its low fat content. Finally, although the value chain
for indigenous chicken shows positive gross margins for all the players along the chain, there
is need to address the various constraints affecting the value chain for indigenous chickens in
order to improve the operation of the chain and hence lead to increased incomes for the value
chain actors and at the same time ensuring cheap delivery of indigenous chicken in a more
convenient form and in formal outlets.
Capacity development on improved production methods (i.e. proper housing, provision of
medications and supplementary feeding) of indigenous chicken through extension programs
targeting producers can profoundly improve the growth, profitability and income
opportunities for a large number of farm households (over 90 percent) who are engaged in
indigenous chicken production, and provide employment to those involved in the marketing
process. Moreover, unlike its closest competitor (broiler), the current marketing system for
indigenous chickens is very rudimentary making it impossible for the product to enter the
modern marketing system such as supermarkets. One way in which this can be addressed is to
increase access to finance both at the production level (leading to increased production) and
the marketing level (leading to improved services). Microcredit institutions could assist some
of the farmers and traders with credit so that they could then be able to procure larger
quantities and process (i.e. slaughter, dress and package) the chickens into a form that can be
stocked in modern supermarkets.

Journal of Agricultural Studies
ISSN 2166-0379
2014, Vol. 2, No. 2
www.macrothink.org/jas 49
Supporting value addition activities along the marketing chain such as slaughtering, dressing
and packaging the indigenous chickens in such a way that they can be sold in formal retail
outlets such as supermarkets can not only assist to bring the product closer to consumers but
also provide it in a more convenient form for urban households and hence increasing demand.
Furthermore, this is likely to reduce the cost of storage, as currently the chickens are stored
live and have to be fed leading to losses. Better storage facilities would also ensure a more
steady supply as dressed processed chickens can be kept in cold storage hence avoiding
seasonality of supply.
Acknowledgement
This study received financial support from the African Economic Research Consortium
(AERC).
References
Asem-Bansah, C. K., Sakyi-Dawson, O., Ackah-Nyamike, E. E., Colecraft, E. K., & Marquis,
G. S. (2012). Enhancing backyard poultry enterprise performance in the techiman area: A
value chain analysis. African Journal of Food, Agriculture, Nutrition and Development, 12(1),
5759-5775. [Online] Available:
http://www.ajol.info/index.php/ajfand/article/view/74830/65428
Asia Dhrra. (2008). Value Chain Analysis Report, Cambodia, Philippines and Vietnam:
Linking Small Farmers to Markets Project Asia Partnership for Development for the Human
Resources in Rural Asia. [Online] Available:
http://asiadhrra.org/activityblogs/2ndlsfmrtw/lsfmvaluechain2.pdf
Disaster Management and Mitigation Unit (DMMU) (2008). Situational Analysis Report,
2007. Office of the Vice-President. Lusaka, Zambia
Dolberg, F. (2003) A Conceptual Framework For Using Poultry as a Tool in Poverty
Alleviation [Revised version] presented at Staying Poor: Chronic Poverty and Development
Policy, Institute for Development Policy and Management, University of Manchester, 7-9
April 2003. Chronic Poverty Research Centre (CPRC), Manchester, UK. [Online] Available:
http://r4d.dfid.gov.uk/PDF/Outputs/ChronicPoverty_RC/AskovJensen.pdf
Dolberg, F. (2004). Review of household poultry production as a tool in poverty reduction
with focus on Bangladesh and India. In V. Ahuja, (ed). Livestock and livelihoods: challenges
and opportunities for Asia in the emerging market environment. India, National Dairy
Development Board, and Rome, FAO, Pro-Poor Livestock Policy Facility (South Asia Hub).
Dolberg, F. (2008). Poultry production for livelihood improvement and poverty alleviation.
In Proceedings of the International Conference Poultry in the Twenty-first Century: Avian
Influenza and Beyond. Proceedings of an International Poultry Conference, Bangkok,
November 2007. [Online] Available: ftp://ftp.fao.org/docrep/fao/011/i0323e/i0323e.pdf
Government of the Republic of Zambia (GRZ) (2004). National Agricultural Policy,
2005-2015. Ministry of Agriculture and Cooperatives (MACO) [Online] Available:

Journal of Agricultural Studies
ISSN 2166-0379
2014, Vol. 2, No. 2
www.macrothink.org/jas 50
http://www.gafspfund.org/sites/gafspfund.org/files/Documents/5.%20Zambia_strategy.pdf
Government of the Republic of Zambia (GRZ) (2010). Sixth National Development Plan
2011-2015. Ministry of Finance and National Planning (MoFNP) [Online] Available:
http://siteresources.worldbank.org/INTZAMBIA/Resources/SNDP_Final_Draft__20_01_201
1.pdf
Haazele, F., Maimbo, F., Lungu, D., & M. Musukwa (2002). Improving the productivity and
marketing of free range village chicken. Smallholder Enterprise Marketing Programme
(SHEMP) Lusaka
Kaplinsky and Morris. (2001). A Handbook for Value Chain Research, IDRC [Online]
Available: http://www.prism.uct.ac.za/papers/vchnov01.pdf
King’ori, A. M., J. K. Tuitoek, H. K. Muiruri & A. M. Wachira (2003). Protein requirements
of growing indigenous chicken during the 14-21 weeks growing period, S. Africa J. Anim.
Sci., 33, 78-82. http://dx.doi.org/10.4314/sajas.v33i2.3759
Lubungu, M., Chapoto, A., & Tembo, G. (2012) Smallholder Farmers Participation in
Livestock Markets: The Case of Zambian Farmers. Working Paper 66. Indaba Agricultural
Policy Research Institute (IAPRI). Lusaka, Zambia. [Online] Available:
http://www.iapri.org.zm/index.php/downloads/doc_view/237--wp66smallholder-farmer-parti
cipation-in-livestokc-marketspdf-?tmpl=component&format=raw
Mack, S., Hoffmann, D., & Otte, J. (2005). The contribution of poultry to rural development.
World's Poultry Science Journal, 61(1), 7-14. http://dx.doi.org/10.1079/wps200436
Magothe, T. M., Okeno, T. O., Muhuyi, W., & Kahi, A. K. (2012). Indigenous chicken
production in Kenya: I. Current status. World's Poultry Science Journal, 68(01), 119-132.
http://dx.doi.org/10.1017/s0043933912000128
Mathuva S. (2005). Value Chain Analysis of Indigenous Poultry Sub-sector, Kilifi and Kwale
Districts. Kenya Costal Rural Support Programme, Kenya. [Online] Available:
http://www.value-chains.org/dyn/bds/docs/515/Aga%20Khan%20Kenya%20Poulty%20VCA
%2005.pdf
Moreki JC & Dikeme R. (2011). Small livestock, food security, nutrition security and
HIV/AIDS mitigation. [Online] Available:
http://www.intechopen.com/download/pdf/pdfs_id/22357
Mutenje, M. J., Mapiye, C., Mavunganidze, Z., Mwale, M., Muringai, V., Katsinde, C. S., &
Gavumende, I. (2008). Livestock as a buffer against HIV and AIDS income shocks in the
rural households of Zimbabwe. Development Southern Africa, 25(1), 75-82
http://dx.doi.org/10.1080/03768350701837754
Ngosa, M. (undated) A Report on the Poultry Industry in Zambia. [Online] Available:
http://www.sapoultry.co.za/pdf%20sadc/POULTRY%20INDUSTRY%20IN%20ZAMBIA.pp
tx

Journal of Agricultural Studies
ISSN 2166-0379
2014, Vol. 2, No. 2
www.macrothink.org/jas 51
Okello, J. J., Gitonga, Z., Mutune, J., Okello, R. M., Afande, M., & Rich, K. M. (2010). Value
chain analysis of the Kenyan poultry industry: The case of Kiambu, Kilifi, Vihiga, and Nakuru
Districts. HPAI Working Paper 24. Washington, DC: IFPRI. [Online]
Available:http://www.ifpri.org/publication/value-chain-analysis-kenyan-poultry-industry
Perry, B. D., Randolph, T. F., McDermott, J. J., Sones, K. R., Thornton, P. K. (2002).
Investing in animal health research to alleviate poverty. 148p. Nairobi (Kenya): ILRI. [Online]
Available: http://books.google.com/books?id=54hL44LMXsYC
Pica‐Ciamarra U., & J. Otte. (2010). Poultry, Food Security and Poverty in India: Looking
beyond the Farm‐gate. World’s Poultry Science Journal, 66(2), 309-320.
http://dx.doi.org/10.1017/s0043933910000358
Simainga S, Banda F, Sakuya N, & Moreki J. C. (2010). Health management in village poultry
in Kalabo and Mongu Districts in the Western Province of Zambia. Livestock Research for
Rural Development. Volume 22 (9), [Online] Available:
http://www.lrrd.org/lrrd22/9/sima22171.htm
Simainga, S., Moreki, J. C., Banda, F., & Sakuya, N. (2011). Socio-economic study of family
poultry in Mongu and Kalabo Districts of Zambia. Livestock Research for Rural
Development, 23(02). [Online] Available: http://www.lrrd.org/lrrd23/2/sima23031.htm
Songolo, A., & J. C. Katongo (2001). Country Report: Zambia. In R.G. Alders, & P.B.
Spradbrow, eds. SADC planning workshop on Newcastle disease control in village chickens.
Proceedings of an international workshop, Maputo, Mozambique, 6-9 March 2000. ACIAR
Proceedings No. 103, pp. 43–45. Canberra, ACIAR.
Sudarman, A., Rich, K. M., Randolph, T., & F. Unger. (2010). Poultry value chains and HPAI
in Indonesia: The case of Bogor. HPAI Working Paper 27. Washington, DC: IFPRI. [Online]
Available: http://www.ifpri.org/publication/poultry-value-chains-and-hpai-indonesia
Yambayamba, E. S. K., & M. N. Musukwa. (2007). Evaluation of Local Chickens for
increased Productivity among smallholder producers in Zambia. Department of Animal
Science, University of Zambia, Lusaka, Zambia.
Copyright Disclaimer
Copyright for this article is retained by the author(s), with first publication rights granted to the
journal.
This is an open-access article distributed under the terms and conditions of the Creative
Commons Attribution license (http://creativecommons.org/licenses/by/3.0/).