an analysis of the technical and economic performance - deep blue
TRANSCRIPT

11% J. Heat Moss Transfer. Vol. 25, No. 9, pp. 1427-1438, 1982 Printed in Greal Britain
0017-9310/82/091427-12 $03.@3/0 Pergamon Press Ltd.
AN ANALYSIS OF THE TECHNICAL AND ECONOMIC
PERFORMANCE OF A PARABOLIC TROUGH CONCENTRATOR
FOR SOLAR INDUSTRIAL PROCESS HEAT APPLICATION
J. A. CLARK
Department of Mechanical Engineering and Applied Mechanics, University of Michigan, Ann Arbor MI 48109, U.S.A.
(Received 30 March 1982)
Abstract-An identification of the principal design factors that influence the technical performance of a parabolic trough concentrator and which relate directly to design and manufacturing decisions is presented. These factors include spectraldirectional reflectivity of the mirror system, the mirror-receiver tube intercept factor, the incident angle modifier and absorptivity-transmissivity product of the receiver tube and cover tube, the end loss factor and a factor describing the effect of tracking errors and receiver tube misalignment. Each of these factors has been quantified in terms of design and manufacturing tolerances and associated performance degradation. Other design considerations that relate to thermal loss from the receiver tube are low emissivity coatings, evacuation and anti-reflection coating.
The analysis ofenergy costs using the parabolic trough concentrator is developed. This analysis determines both the break-even, current metered cost of energy and the annual cash flow over periods of investment ranging from 5 to 15 yr. The economic factors include investment tax credit, energy equipment tax credit, income tax bracket, cost of auxiliary system, foundations and controls, cost of collector at installation, costs of maintenance and taxes, costs of fuel, cost of capital, general inflation rate and fuel escalation rate. Economic determinations were made at three U.S. locations: Albuquerque, New Mexico; Fresno, California; and Caribou, Maine using the thermal performance characteristics of the Sandia Advanced Trough Prototype Collector. The collector costs used were those determined by a manufacturing cost analysis for various manufacturing volumes up to 100 000 modules (each 516 ft’ ; 48 m2) per year.
The results show that for a 10 y; period of investment, the current metered breakeven costs are less than $7.00 ner lo6 BTU at all locations for a collector havine a total installed cost of $15.79 ft-r ($170.00 m-r). II which-includes manufacturing and installation (Sll.SO), foundations, and controls ($1.50) and auxiliary system ($2.79). For a 15 yr period of investment the corresponding fuel costs are less than $4.00 per lo6 BTU at all locations.
For a total installed collector cost of $22.79 ft-’ ($245 m- 2). the break even metered fuel cost is less than $9.00 per 10” BTU at all locations, also for a 1Oyr period of investment. Other conditions are evaluated.
The analysis is general which permits other circumstances to be evaluated.
NOMENCLATURE
collector aperture area [ftf, m,Z] ; receiver area [ft’, m’] ; fuel escalation rate [y - ‘1;
(DoP)lc~; cost of conventional system [$I ; cost of solar-conventional system [$I ; total vendor installed cost of collector [$ ft; ‘, $ m; “1; (1 - Ci - Cr)CO[$ft,z, $m;‘]; cost of auxiliary equipment [$I, vendor price ;
t1 - ci - cT)cE[S];
investment tax credit (1);
energy equipment tax credit (1); income tax bracket (1);
current metered fuel price [SBTU-~,SGJ-~];
(1 - Cs)C,,; diameter of receiver [ft, m] ; Cdl ; focal length [ft, m] ; fraction of annual load provided by solar
(1);
F Ill, mirror-receiver intercept factor (10);
F FIG, t),
tracking/misalignment factor (1); escalation function (l), see Table 1;
I Dlw direct normal insolation [BTU h-r fte2, ‘,
I DSI
I 09 6 1,
Id,
KO,
Kb,
L,
L,
M SC.27 qA,
403
&A,,
RS
Ti,
W mm2]; direct insolation on aperture [BTU h-’ ft’, W me2]; capital recovery factor [yr- ‘1; I&[W’]; rate of general inflation [yr- ‘1; discount rate (interest) [yr- ‘1; maintenance rate [yr- ‘I;
f&,(1 - ‘3; thermal load [BTU yr-‘, kWh yr-‘1; length of collector [ft, m] ; maintenance cost [ $ yr - ‘I; energy absorbed [BTU hr - ‘, kW] ; energy loss [BTU hr-‘, kW]; incident solar energy [BTU hr- ‘, kW] ; total annual useful energy [BTU ft,’ yr-‘,
kJm;‘yr-‘1; tax deduction factor for interest paid in- cluded in I,(l), [lo] ; inlet temperature PF, “C] ;
1427

1428 J. A. CLARK
ambient temperature [“F, “C] ; current tax rate [yr-‘I;
T,(l - CJ EF’I; time [yr] ; receiver loss coefficient [BTU hr-’ ft-’ “F-l, W mm2 ‘Y.-‘1; capital cost escalation rate [yr- ‘1; width of aperture [ft, m] ; radial spread coordinate [ft, m] ;
YAW
Greek symbols
C@, equation (12) (1);
(iY* equation (13) (1); a, absorptivity (1);
z, transmissivity (1);
$1, mirror beam spread (1) ;
ZfY
solar beam spread (1); rim angle (1);
rlt collector eficiency (1) ;
‘lo* optical efficiency (1);
?/E, thermal transport efficiency (1) ;
Vi3 thermal conversion efficiency (conventional system) (1);
4 incident angle (1);
Pin? mirror reflectance (1).
INTRODUCTION
THE CONCENTRATION of solar radiation by reflection (mirrors) or refraction (lenses) on the receiver of a thermal conversion system, has the distinct thermody- namic advantage of reducing the thermal losses in the conversion process in relation to the useful thermal gain in comparison with non-concentrating systems (flat plate coliectors). This results in an increased thermal conversion efficiency for a specified set of operating conditions and allows for the production of higher operating temperatures at acceptable con- version efficiencies. An increased conversion efficiency improves the economic performance of the system and higher operating temperatures (in comparison with those obtained by flat plate collectors) allows con- centrating systems to be used in a wide variety of industrial process heat applications. Concentrating collectors include the compound parabolic concen- trator (CPC) with a concentration ratio (CR) range 2- 10, the parabolic trough concentrator (CR from 10-100) and the parabolic dish concentrator (CR from lOO.-3000). The heliostat mirror system of the central tower receiver is, in principle, a special form of parabolic dish. Apart from the CPC, which can accept diffuse radiation, a concentrating collector can utilize only the direct, or beam, component of solar radiation and is arranged such that its aperture is facing in the direction of the sun as closely as possible, i.e. it tracks the sun. On a clear day the beam component repre-
sents SO-907” of the total solar radiation. The actual concentration of solar radiation is limited in a given system by the dispersion of the radiation created by the finite size of the solar disc. At the mean sun earth distance, the sun subtends an angle of 9 mrad, thus fixing a lower limit to the size of the receiver and an upper limit on the concentration ratio. Other practical considerations such as reflector uniformity, receiver misalignment, tracking errors and optical end losses further limit the degree of concentration that is possible.
The market potential for industrial application of solar concentrators (thermal and photovoltaic) is considerable. In the United States approximately 2OY, of the total thermal energy useage is in the range of temperatures 100- 300°C (212-572 ‘F). In 1980 this represented an energy consumption of about 16 quads (16 x 10 ls BTU). To provide for this using solar concentrators would require a total aperature area of approximately 48 x IO9 ft’ (4.5 x 10’ m’). At the present time the total installed area ofconcentrators is less than lo6 ft’ (93 x 10” m2). Hence, the challenge and opportunity for this type of solar application is evident. The purpose of this paper is to discuss some of the important design parameters and present an economic projection for parabolic trough concen- trators in the United States. The results can be extended to other regions of the world. A recent summary of this technology, including high tempera- ture storage, has been published by Kreith, Castle and Wyman [l]. The SANDIA laboratories at Albuquer- que, New Mexico, have done extensive work on the development of engineering prototype parabolic troughs. A detailed analysis of the manufacturi~lg costs of a parabolic trough concentrator for both high and low volume production has been completed [Z].
A photograph of a typical parabolic trough con- centrator is shown in Fig. 1 and its application to an industrial process, with the associated auxiliary equip- ment and conventional supply system is shown in Fig. 2.
DESIGN AND MANUFACTURING PARAMETERS THAT INFLUENCE THERMAL AND ECONOMIC PERFORMANCE
The economic performance of a parabolic trough concentrator is directly related to its annual thermal performance. The thermal performance, measured in terms of the quantity of useful energy obtained an- nually from the concentrator by solar conversion, is in turn determined by certain critical design parameters and manufacturing process selections. Accordingly, for a comprehensive design study to be conducted and an effective manufacturing system to be identified, it is essential that an understanding be obtained regarding these design parameters and their influence on the thermal performance, and, ultimately the economic performance of the concentrator. The following de- velopment will be a summary of the principal results of

The performance of a parabolic trough concentrator for solar industrial process heat 1429
FIG. 1. Parabolic trough concentrator (courtesy Acurex Corporation).
a thermal analysis which identifies the important or design parameters.
q-4”, (2) Thermal ejiciency of a concentrator 4x
As a figure of merit, the thermal efficiency of a concentrator is defined as follows :
where the useful energy q, is the difference between the energy absorbed at the receiver tube, qA, and the energy loss at the receiver, q,,. Hence,
q- Useful energy produced
Energy incident on collector aperture (1) 4, = qA - 40 (3)
FIG. 2. Parabolic trough field for industrial process heat application (courtesy Acurex Corporation).

1430 J. A. CLARK
also
4, = IoNA, COS e = I,,,& (4)
and
thus,
qA = FR 41 'lo,
40 = FR uo A, vi - T,),
(5)
(6)
'0 tTi - Ta) __-__ ” - (AC/A,) los
(7)
As a practical matter for large coolant flows, F, will be in the range 0.8-0.9. However, the actual value for F, in a given design will depend on Do, the choice of which is a trade-off between minimizing thermal losses from the receiver (proportional to Do) and maximizing the interception of reflected radiation from the mirror by the receiver tube. These processes are influenced by the receiver-tube-mirror intercept factor, which is dis- cussed below in connection with the optical efficiency ‘lo of the system.
The optical efficiency q. is a principal design parameter whose magnitude is determined by the values of six other independent parameters. This quantity is written [4]
Each of the six parameters p,, F,, K,, (a~),, F, and F, will be discussed and their significance to design and manufacturing will be presented.
The mirror rq%ctivity, p,(O). The reflectivity of the mirror, p,(O), is the fraction of the incident radiation that is reflected from the mirror system. The magni- tude of p,(e) will depend on the nature of the mirror system, that is, whether it consists of glass with a reflective metal coating on the second surface, an acrylic coated film, a polished metal surface, etc. In the case of a glass, second surface mirror reflector p,(B) will be influenced by reflection from both the air-glass interface and the glass-metal interface as well as by optical absorption within the glass. Because absorp- tion is the consequence of two light passes through the glass and the optical absorptivity of the glass, the mirror system should be constructed of glass that is thin as possible (0.040-0.200 in) and that contains very small quantities of iron, the principal impurity causing absorption. The reflectivity of the metal surface that forms the mirror should be as high as possible, approx. 0.90-0.95.
The magnitude of the reflectivity is also a function of the angle of incidence B on the mirror surface and the angle of reflection. In general, an ideal situation is one in which the angle of incidence and angle of reflection on the mirror are the same. However, owing to the finite size of the sun, which causes a spread in the incident radiation, and both geometric and optical imperfections in the mirror system there will always be some dispersion of the reflected beam from the re-
flector. Material selection of the mirror system and the precision of its manufacture should be such as to minimize this beam dispersion.
Mirror-receiver tube intercept factor, F,,,(+ ,, $2, A,, 4). Because the sun has finite size, its incident radiation of the collector aperture possesses a small (approx. 9 mrad)conical beam spread of angle 21c/,. Further, the mirror surface itself will have a local surface curvature different from that of a perfect parabola of revolution. This is a consequence of imperfections in the manufac- turing process which produce what are known as slope errors in the parabolic surface. Such errors must be made small and for a particular design should be known. The effect of both solar beam spread and mirror slope errors is to cause an additional dispersion in the reflected beam. Hence, at the receiver tube the reflected energy is spread over a finite angle rather than focused along a line as would be obtained from a point source reflecting from a perfect parabolic trough. The solar beam spread 2$, is predictable and can be described in terms of a statistical variance (square of the standard deviation of the distribution of the beam spread), defined as &. The effect of mirror surface slope errors, however, is not predictable but must be determined from measurements on an actual surface. One technique is to use a highly collimated laser beam that scans the mirror and measures the deflection angle $i of the reflected beam from the focal line of the mirror. Treadwell [3] describes this method and gives a typical scan which is shown in Fig. 3. The effect of these surface imperfections is also described in terms of a statistical variance of the deviations of the surface from that a perfect parabola, defined here as 4ai,,. Employing a principle of statistics which asserts that the variance of a system of random variables is the sum of the variances of each variable, the net variance of the solar beam spread and mirror slope errors is written as
0; = 40;, + a;,,. (9)
Further, the beam spread variance at the receiver, at, of the entire collector surface is obtained by integrating these effects over the complete rim angle (2) of the concentrator trough (4). Thus, for an aperture of width w,
0* _ w26(2 + cos 6) Y 124sin f#~
(10)
The solar beam spread standard deviation is 2.5 mrad and the slope error standard deviation ceL should be such that the beam spread standard deviation oY is less than 7 mrad for a parabolic trough concentrator of high quality.
These effects are fundamental to the selection of the size of the receiver tube. The larger the tube diameter, the more reflected radiation it will intercept. However, as the tube diameter is increased the thermal losses will also increase. The final selection of tube diameter is then made on the basis of a trade-off between increased interception of reflected radiation and acceptably

The performance of a parabolic trough concentrator for solar industrial process heat 1431
762 3
0
0 I 2 3 4 ft
030 0.61 x 091 1.22 m
FIG. 3. Laser scan of parabolic trough mirror [3].
small thermal losses. An example of such a design selection made by the Sandia National Laboratories [3] is given in Fig. 4. The actual determination of tube size is made by statistical analysis, assuming the random distribution of these effects is Gaussian (nor- mal). This assumption leads to the formulation of the mirror-receiver tube intercept factor as follows [4] :
1
s
+.
Fnl(tiI, $2, AC, 4) = (271)1/2 e -=2iz dz (11) _(l
where
Y DoI2 z = -, a-p (12) OY OY
y, being the radial spread coordinate of the reflected and dispersed beam across the focal line of the receiver tube (0 < y < D,/2).
Also, as may be shown from the properties of a Gaussian distribution,
73- 72 - 71-
3 70- ; 69- y68- W 67 - e 66 - k65-
64- 0"63- L 62 - y 61- 6 60 u 59-
58- 57- 56-
* /I,, I I I I I, 11 I I I I,
01 0 3 0.5 0.7 0.9 1.1 1.3 1.5 1.7 RECEIVER OUT DIAMETER Len)
Connecting Llrx
~~=.01209 Rad,ans
FIG. 4. Energy distribution vs collector efficiency [3]
where F(a) is the normal distribution function,
1 a F(a) =(2*)1/z
I
-z'i2 dz, (14)
Numerical values for F(a) may be found in mathemati- cal handbooks [5]. These results are employed in one of two ways. First, the fraction of the intercepted radiation (F,) that is desired (range 0.90-0.95) is specified and the corresponding receiver tube diameter that would produce this for the conditions of the mirror-sun (a,) and concentrator geometry is de- termined. The second way is the inverse of the first. Namely, specifying the tube diameter and from the conditions of the mirror-sun (a,) and the concentrator geometry a determination of n, and thus F(a) is made. The intercept F,($,, ti2, A,, 4) then follows from equation (14). In this case the value of a for the determination of F(a) is (D,/~)/cJ,
K,(8), incident angle modijer and (c(7),,, the absorptivity-transmissivity product at normal incidence of the receiver tube and its glass envelope. From a thermal optical analysis it is found that the net energy absorbed by the receiver tube is proportional to the product of the optical transmissivity, 7, of the glass cover tube over the receiver and the absorptivity of the receiver tube, both within the spectrum of the sun (0.3-2.5 pm). Owing to the physics of the interaction of radiation and solid media, each of these properties (7
and c() is dependent on the angle of incidence (0) of the radiation with the surfaces of the medium. An ad- ditional factor is the absorption of radiation within the media, which in this case, is absorption within the glass cover tube. This should be small, a condition obtained by using a thin-walled tube of low iron glass. Both 7 and tl should be as large as practical, though neither can exceed 1.0.
To account for the influence of various incident angles on (cc~), a factor known as the incident angle modifier, called K,(B) is determined. The value of (ar) for any angle of incidence, 0, is obtained by the product of K,(B) and the value of (UT), corresponding to radiation incident in a direction normal to the surface. Each of these factors can be determined using physical- optical theory or they can be measured experimentally. Typical values for t, a and K,, each as a function of the incident angle, are given in Figs. 5 and 6.
End loss factor, FE(J L, w, 0). By the nature of its design a parabolic trough concentrator has open ends. Because of this a certain amount of radiation incident on the aperture does not reflect from the mirror and intercept the receiver tube. To account for this effect, an end loss factor is introduced, which is given [6] as
F,(TL.w,HJ=1-t[1-~]tan8. (15)
A collector that is long in relation to its focal length has small end loss, as is the case when energy falls on the aperture at normal incidence.
FT(Q,), tracking and receiver misalignment error. The

1432 J. A. CLARK
ir’=[ , , / / ‘\ / 0 20 40 60 80 IO0
INCIDENT ANGLE WITH RESPECT TO NORMAL (Degrees)
FIG. 5. Solar transmissivity and incident angle modifier of receiver tube glass envelope [14].
last of the six factors that are important to design and manufacturing considerations and which influence the thermal performance of a concentrator is the tracking and receiver misalignment error. This error results, in general, whenever the receiver tube is displaced from the designed region of focus. Two common causes for this error in displacement are errors in the tracking mechanism, and manufacturing and/or operational misalignment of the receiver tube resulting from sagging or thermal distortion. Of these the tracking error is the more important as manufacturing and assembly tolerances can be realistically maintained to values well within those demanded for thermal perfor- mance. In current designs ‘stacking’ errors of 0.200 in (0.508 cm) are allowed, whereas manufacturing and assembling tolerances can be realistically specified that produce ‘stacking’ errors of about 0.050in (0.127 cm). The importance of precise tracking capa- bility is shown in Fig. 7 where, for the concentrator shown [7], a 1” tracking error produces a 20% reduction in the efficiency. The actual tracking error will depend on the system geometry but generally the requirements for precision in tracking will be great, within one or two degrees.
Data obtalned for Black Chrome on Sulfamate N,ckel -Curve Ftt
0 20 40 60 80 100 INCIDENT ANGLE WITH RESPECT TO NORMAL (Degrees)
FIG. 6. Solar absorptivity of receiver tube [14].
Other design considerations. While the discussion above has been directed at important desigmmanufac- turing parameters there are others that should be mentioned briefly. The thermal loss from the receiver tube should be made as small as is practical. Con- siderations bearing on this include a low emissivity (at infra-red wave lengths) of the absorber surface and protection of this surface from convection losses. The latter is accomplished by placing a glass tube around the receiver tube. Evacuating the space between the two tubes and coating the glass tube with an anti- reflection coating can act to reduce thermal losses significantly. Anti-reflection coating of the receiver tube, for example, can be expected to improve the collector efficiency by approximately 5”/‘,, making this a highly cost-effective step. To date evacuation of the annulus has not proven satisfactory in field operations.
Finally, the lifetime performance of the various materials used in any particular collector must be taken into account. Durability of the reflector surface is a major factor in this regard, and militates strongly against the use of reflecting surfaces whose perfor- mance degrades substantially with time in an open environment or is damaged by a cleaning process.
Energy cost analysis The utilization of parabolic trough concentrators in
the conservation of solar energy for use in industrial processes depends primarily on the economics and costs of the application. The durability, reliability and maintainability of materials, components and systems also are important to the adoption of this technology. However, for industry to utilize this technology it must be expected that these solar systems be capable of producing useful energy at costs below that for competing energy sources. In this section the econ- omics and costs of the parabolic trough concentrator are analyzed in terms of the appropriate financial, physical and production cost parameters.
These parameters include tax incentives, tax credits, cost of conventional (competing) fuel, cost of capital, cost of ownership (taxes), rate of inflation, rate of fuel cost escalation, type of capital borrowing, period of time of borrowing and the discount rate on capital, maintenance costs, total installed costs of the con-
POINTING ANGLE ERROR 8, (Degrees)
FIG. 7. Tracking accuracy factor as a function of pointing angle error [7].
The performance of a parabolic trough concentrator for solar industrial process heat 1433
centrator, including all manufacturing and materials costs, profit and taxes, cost of auxiliary equipment such as heat exchangers, pumps, piping and controls, the conversion efficiencies of collector conventional boiler and energy transmission system, and the geo- graphic location. The cost analysis ma& here includes an evaluation of the total costs over an investment period (life-cycle analysis) as well as the annual cash flow during this period. Each of these representations has its value in the economic evaluation of the concentrator for industrial process heat application.
The technical performance characteristics of the concentrator are taken from the work of the Sandia National Laboratories, the Component and Sub- system Development Division, the Small Power Sys- tems Applications Division and the Experimental Systems Operations Division (8). Although the ana- lysis developed here is general, the results will be applied to the newer designs of parabolic trough concentrators developed in prototype models at San- dia which have significantly improved performance over current production models. It is anticipated these improved prototypes can be manufactured in volume production during the 1980s. The improvements in the design include improved reflectivity of the mirror, more precise mirror shape (small errors in slope), better beam focusing and reduced thermal losses from the receiver. Both north-south and east-west axes (horizontal) orientation, with tracking, can be con- sidered. Results for three more or less representative U.S. locations are given : Albuquerque, New Mexico, Fresno, California and Caribou, Maine. These results are for an east-west orientation and can be modified for north-south orientation with a corresponding 10-20x improvement in performance [8].
The collector configuration used for these economic calculations is a Sandia design having an aperture 6.56 ft wide (2.0 m), 103 ft long (31.39 m) with a 90” rim angle. The inlet temperature is 500 “F (260°C) and an outlet temperature of approximately 600°F (316°C). The receiver tube has a selective coating and is surrounded by a Pyrex glass tube without evacuation. An anti-reflection coating on the glass cover tube is not included but such a coating would improve the performance by 510%. Evacuation also improves performance but has not proved to be practical in field testing. The effect of shadowing is also not included but this loss can be expected to be compensated by the improvement in performance obtained by the use of anti-reflection coating in future designs. The receiver tube diameter is selected to optimize the performance by minimizing thermal losses while maximimizing beam interception. The exact diameter will vary slight- ly with location but will be in the range of l&1.5 in (2.54-3.81 cm). The optimum performance is not par- ticularly sensitive to small variations in diameter.
Long term averaged solar and weather data are used to determine the technical performance. The Sandia results cited here have used the Typical Meteorological Year (TMY) data generated by Sandia.
Economic analysis
The collector field, auxiliary equipment, conven- tional thermal supply system is shown in Fig. 2. The collector field is described by its total area of aperture, A,, and its total installed cost per unit of aperture area, C,, in dollars per square foot (Sm;‘). This cost is determined by a detailed analysis of the materials and manufacturing costs associated with production of the concentrator for various annual volumes of manufac- ture [2]. These costs include the costs for foundations, controls, profits, taxes, etc., the details of which and the methodology of assessment are given in [2].
Associated with the collector field is a thermal energy conversion sub-system consisting of pumps, valves, heat exchanger and related structure which is represented in the economic analysis by the cost C,, in S. This cost will vary depending on the specific choices made regarding the total system and its application. For purposes of the present analysis this cost will be related to the total collector aperture area as the quantity &/A,, in dollars per unit area of aperture. Studies [2] have indicated that a value of C,/A, equal to $2.79 ft;’ ($30.03 m-‘) would be an appropriate figure. However, other values can be introduced for different situations.
Also indicated on Fig. 2 is the cost C,, dollars, for the conventional boiler and the total thermal load, L, BTU yr - ’ (GJ yr - ’ ), of the combined solar-conventionally fueled plant. Because of the nature of the economic analysis, the cost of the conventional boiler, C,, does not enter explicitly into the economic determinations.
An economic assessment of the parabolic trough concentrator as an energy supply system is made by determining the difference in cost over some period of time between that of a conventional energy supply system and that of the solar concentrator system including its auxiliary equipment and back-up con- ventional boiler. Hence,
where
AC = C, - C,,. (16)
C, = Cost of conventional system ($),
C,, = Cost of solar-auxiliary system ($).
Economic viability for the solar system occurs whenever
AC 2 0,
and economic ‘breakeven’ occurs when
AC = 0.
‘I (17
(18
Considering capital costs, taxes, fuel costs and main tenance costs, AC is written
AC = - (A, Co + C”) (I; + To) F, (x, t)t
+ F&2 F, (a, t)t - M:,, F, (i, t)t, (19)
where the primed notation represents effective costs, to

1434 J.A. CLARK
include the effects ofcertain tax and investment credits. The function F, (x, C) is an escalation function [9] that allows for increases in costs as a result of general inflation (x = i), fuel price escalation (x = a) and variable rate borrowing (x = U) and is given in Table 1. Subscripts 0 refers to current costs or price levels. Accordingly, it may be shown that the product of the current cost (or price) and the function F,(x, t) is the exact mean value of the cost (or, price) of the com- modity or service over the period of time t. Hence, equation (19) is an expression of life-cycle costs written in terms of exact mean values and indexed on the current (thus, known) values with consideration of an assumed rate of increase (x, u, i) over the period t. This formulation is a valid representation of the economic performance for a long term investment in which the cost elements increase according to (I + x)‘.
In the following development these various costs are assumed to have the escalation rates listed :
(i) current capital cost, I& increases at rate, x = t’. (0 = 0 for fixed rate borrowing, the case actually developed here)
0.0 0.0 l.o# 1.ooo 1.000 l.ooo 1.000 0.010 1.0 1.005 1.025 I.051 1.078 1.106 0.020 2.0 1.010 1.051 1.106 1.164 1.227 0.030 3.0 1.015 1.078 1.163 1.258 1.364 0.040 4.0 1.020 1.105 1.224 1.361 1.518 0.050 5.0 1.025 1.133 1.289 1.474 1.694 0.055 5.5 1.027 1.147 1.323 1.535 1.791 0.060 6.0 1.030 1.161 1.357 1.598 1.894 0.065 6.5 1.032 1.175 1.393 1.664 2.004 0.070 7.0 1.035 1.190 1.429 1.733 2.121 0.075 7.5 1.037 1.205 1.467 1.806 2.245 0.080 8.0 1.039 1.220 1.506 1.882 2.378 0.085 8.5 1.042 1.235 1.546 1.961 2.520 0.090 9.0 1.044 1.250 1.587 2.044 2.671 0.095 9.5 1.047 1.265 1.629 2.131 2.833 0.100 10.0 1.049 1.281 1.672 2.222 3.005 0.105 10.5 1.052 1.297 1.717 2.318 3.188 0.110 11.0 1.054 1.313 1.763 2.418 3.384 0.115 11.5 1.056 1.329 1.810 2.522 3.592 0.120 12.0 1.059 1.345 1.858 2.632 3.815 0.125 12.5 1.061 1.362 1.908 2.746 4.052 0.130 13.0 1.064 1.379 1.959 2.866 4.305 0.135 13.5 1.066 1.395 2.012 2.992 4.575 0.140 14.0 1.068 1.413 2.066 3.123 4.863 0.145 14.5 1.071 1.430 2.122 3.260 5.170 0.150 15.0 1.073 1.447 2.179 3.404 5.497 0.155 15.5 1.076 1.465 2.238 3.555 5.847 0.160 16.0 1.078 1.483 2.298 3.713 6.219 0.165 16.5 1.080 1.501 2.361 3.878 6.616 0.170 17.0 1.083 1.519 2.425 4.050 7.040 0.175 17.5 1.085 1.537 2.490 4.231 7.491 0.180 18.0 1.088 1.556 2.558 4.420 7.973 0.185 18.5 1.090 1.575 2.627 4.618 8.486 0.190 19.0 1.092 1.594 2.699 4.825 9.034 0.195 19.5 1.095 1.613 2.772 5.041 9.617 0.200 20.0 1.097 1.633 2.848 5.268 10.239
Y
(“b) 1 5
Table 1 F,(x. t)
(ii) current tax rate, Tb, increases at general inflation rate, x = i.
(iii) current fuel price C’r, (at meter), increases at the fuel escalation rate, x = ~a. where a > i, (u - i = 0.05 in this study)
(iv) mainten~ce costs, MI,,, increase at general inflation rate, I = i.
The solar system maintenance costs are taken to be proportional to the total plant investment, including auxiliary equipment. Hence,
IV;,, = Kb C* (1 + C#z&4,)A,. (20)
Noting that F,L is the annual quantity of useful energy provided by the solar system, this may be written as
F,L = ?, (QsI44. (21)
With these formulations equation (19) may be written in dimensionless form as
(AUrMC,,, _- (??~~~~)~=(Qs/~~)(l - CJF,h f) = '
(1 - Ci - C,)C,(l + C.&,A,)F,(i, t) ._ _
20 25 30 ^_.~
1mO 1.135 1.294 1.480 1.699 1.956 2.102 2.260 2.431 2.618 2.820 3.040 3.279 3.538 3.821 4.127 4.461 4.824 5.218 5.647 6.114 6.621 7.173 7.773 8.425 9.135 9.907
10.746 II.659 12.651 13.730 14.903 16.179 17.565 19.072 20.710
1.000 1.165 1.366 1.610 1.907 2.270 2.480 2.714 2.972 3.258 3.574 3.925 4.314 4.745 5.223 5.753 6.341 6.993 7.716 8.518 9.408
10.395 Il.491 12.707 14.056 15.553 17.214 19.056 21.100 23.367 25.882 28.672 31.766 35.196 38.999 43.216
__--___
The performance of a parabolic trough concentrator for solar industrial process heat 1435
x (T, + K,)( 1 - C,) + I,R, z 1 . (22) 1 4 The function F,(x, t) is given in Table 1 for values of
x from 0% yr- ’ to 20% yr- ’ and time periods of l-30 yr. These ranges should accommodate most practi- cal circumstances.
The economic performance of the parabolic trough concentrator can be determined using equation (22) and its analytical sub-structure to calculate the follow- ing economic/cost conditions :
(i) Total return on investment ft* of collector aperture area, AC/A, ($ ft; ‘, $ mm’), for various periods of investment.
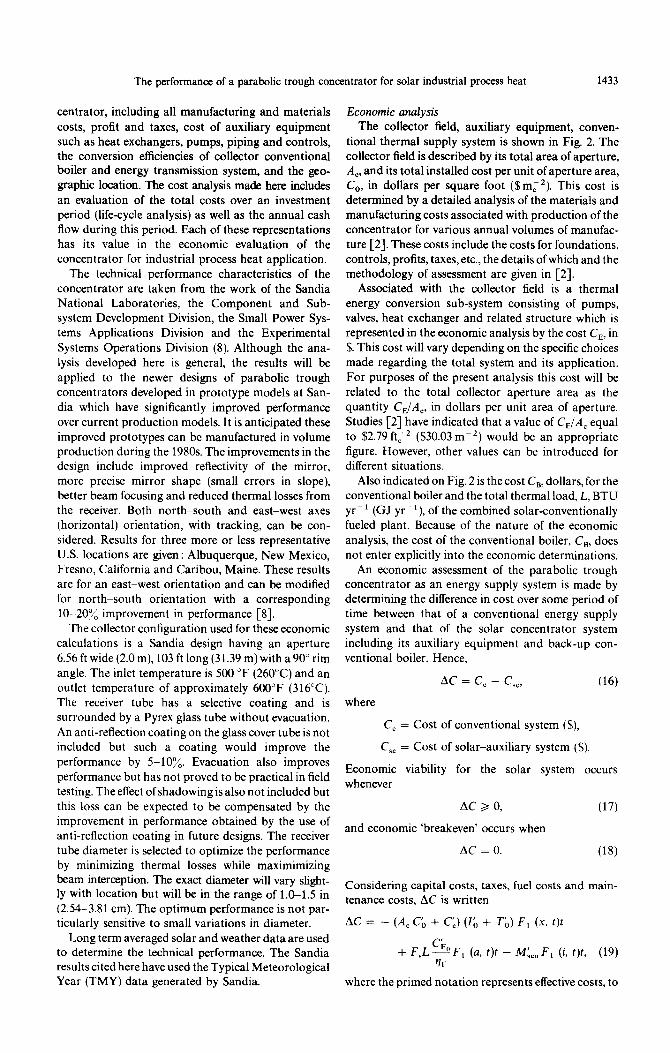
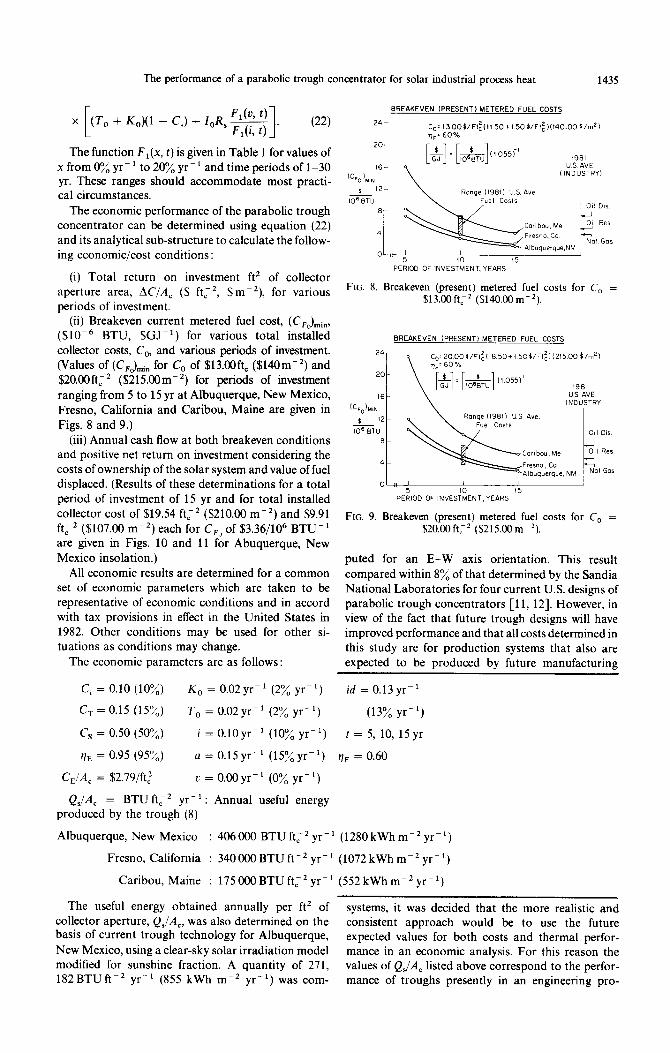
(ii) Breakeven current metered fuel cost, (CFJmin, ($10m6 BTU, $GJ-‘) for various total installed collector costs, C,, and various periods of investment. (Values of (CF,&” for C, of $13.@lft, ($140m-*) and $2O.OOft; * ($215.COm-*) for periods of investment ranging from 5 to 15 yr at Albuquerque, New Mexico, Fresno, California and Caribou, Maine are given in Figs. 8 and 9.)
(iii) Annual cash flow at both breakeven conditions and positive net return on investment considering the costs of ownership of the solar system and value of fuel displaced. (Results of these determinations for a total period of investment of 15 yr and for total installed collector cost of $19.54 ft;* ($210.00 m-‘) and $9.91 ft,* ($107.00 m-‘) each for C,” of $3.36/106 BTU-’ are given in Figs. 10 and 11 for Abuquerque, New Mexico insolation.)
All economic results are determined for a common set of economic parameters which are taken to be representative of economic conditions and in accord with tax provisions in effect in the United States in 1982. Other conditions may be used for other si- tuations as conditions may change.
The economic parameters are as follows :
ci = 0.10 (10%) K, = O.O2yr-’ (2% yr-‘)
c, = 0.15 (15%) T, = 0.02yrV’ (2% yr-l)
c, = 0.50 (50%) i = O.lOyr-’ (10% yr-‘)
?/F = 0.95 (95%) a = 0.15 yr-’ (15% yr-‘)
&/A, = $2.79/ft; c = O.OOyr-’ (0% yr-‘)
Q,/A, = BTU ft,’ yr- ’ : Annual useful energy produced by the trough (8)
Albuquerque, New Mexico
Fresno, California
Caribou, Maine
: 406000 BTUft,*yr-’ (1280kWhm-Zyr-‘)
: 340OOOBTUft-*yr-’ (1072 kWh m-’ yr-‘)
: 175OOOBTUft;*yr-’ (552 kWh m-’ yr-‘)
BREAKEVEN (PRESENT) METERED FUEL COSTS
24 ~,~1300$/Fl~(l150+150$/Ft~~~140.00$/m21 qF: 60%
[&I = [&]“055il 1981 USAVE
(INDUSTRY1
PERIOD OF INVESTMENT, YEARS
FIG. 8. Breakeven (present) metered fuel costs for C, = $13.00ft,Jz ($14000m-*).
BREAKEVEN (PRESENT) METERED FUEL COSTS
C ~2000t/F1~~1850+150~/Ftf1~215.00$/m2~ n”:60%
OLiZ 5 / I I
10 15 PERIOD OF INVESTMENT, YEARS
FIG. 9. Breakeven (present) metered fuel costs for C, = $20.00ft;2 ($215.00m-2).
puted for an E-W axis orientation. This result compared within 8% of that determined by the Sandia National Laboratories for four current U.S. designs of parabolic trough concentrators [ll, 121. However, in view of the fact that future trough designs will have improved performance and that all costs determined in this study are for production systems that also are expected to be produced by future manufacturing
id = 0.13 yr-’
(13% yr-l)
t = 5, 10, 15yr
qF = 0.60
The useful energy obtained annually per ft* of collector aperture, Q,/A,, was also determined on the basis of current trough technology for Albuquerque, New Mexico, using a clear-sky solar irradiation model modified for sunshine fraction. A quantity of 271, 182BTUft-’ yr-’ (855 kWh me2 yr-‘) was com-
systems, it was decided that the more realistic and consistent approach would be to use the future expected values for both costs and thermal perfor- mance in an economic analysis. For this reason the values of QJA, listed above correspond to the perfor- mance of troughs presently in an engineering pro-

1436 J. A. CLARK
FIG. 10. Annual cash flow for breakdown conditions. Albu- querque, New Mexico insolation.
totype state of development but which are expected to
be produced in future volume production. Total return on investment, ACjA,. The total return
on investment per ft* (mf) of collector is that value of AC/A, from equation (25) computed for various economic, geographic and technical conditions that may be given. Because of space limitations results of this determination will not be given.
Breakeven (current) metered fuel cost (C,,l),i,. A convenient economic criterion for system evaluation is the determination of those circumstances that cor- respond to equality of life-cycle costs for the con- ventional and solarconventional systems of the AC equal to zero. Using this criterion and the economic and technical data described, the value of current, metered (hence, known) cost of fuel, (C,,),,,, was determined as a function of total installed collector cost, C,, and various periods of investment up to 15 yr at each of the three locations: Albuquerque, New Mexico, Fresno, California and Caribou, Maine. The results, are given in Figs. 8 and 9. Superimposed on these results is the range of average fuel costs in the U.S. in 1981 [13]. As may be seen for a 10 yr period of investment a solar concentrator shows economic via- bility at all locations for an installed collector cost of $13.OOft,* (S140.OOm,*). At a C, of S2O.OOftt*
ANNUAL CASH FLOW FOR A SYSTEM HAVING A POSITIVE NET A01
ALBUQUERQUE, NM INSOLATION
C,/A,=1279/Ft: ((3002/m~l
01 , 1
0 5 f0 (5 YEARS
FIG. 11. Annual cash flow for a system having a positive net return on investment. Albuquerque, New Mexico insolation.
($215 m;*) a concentrator is economically viable in the western regions when in competition with liquid petroleum fuels.
Annual cashpow. Another way to represent the life- cycle economic performance of the parabolic troughs is to determine the annual dollar cash flows cor- responding to the costs of ownership, (taxes, capital and maintenance) C,.,,, and the costs (value) of fuel saved by the system, C:D,ne,. These quantities, with their appropriate cost escalation effects, may be written
C s.ne, = (1
X
and
- Ci - CT) c0(1 + COICEA~)
[(K, + T,)(l - C,)(l + i)’ + I,,R,].
$ft,2yr-‘($m,2yr-1) (23)
,
$ft,*yr-‘($m;*yrY1). (24)
It should be noted that C,,,,, is a function only of collector cost, C,, for fixed economic and operational conditions and C&,net is a function only of C,() for fixed economic and performance conditions. Hence, under these circumstances any values for C, and C,,, can be used. For the results given here in Fig. 10 the corresponding values for C, and C,(, at breakeven conditions have been used, namely C, = $19.54 ft, * ($210 m,*) and Cpo = $3.36 (lo6 BTU))’ (S3.18GJJ’) at Albuquerque, New Mexico.
The influence of lower collector cost, C,, on produc- ing a positive net return on investment is shown in Fig. 11, also for Albuquerque, New Mexico, for C, = $9.91 ft,* ($107.00m;*).
CONCLUSIONS
Parabolic trough concentrators for industrial pro- cess heat application will become competitive with fossil fuels in most parts of the United States when their total installed costs per unit area of collector aperture, including auxiliary equipment, is $15.79 ft, * ($170.OOm;*) for a 10 yr period of investment under reasonable economic constraints. Recent producibility cost analyses indicate that this cost can be achieved for an advanced prototype concentrator for annual pro- duction volumes of 100000 modules, or 51 600000 ft, * yr- ’ (4 800 000 rn; * yr- ‘). For a total installed collector cost of $22.79 ft;’ ($245.00 m;‘) these parabolic troughs are competitive with fossil fuels in the western part of the U.S. for a 1Oyr period of investment. Longer periods of investment increases the economic competitiveness of solar concentrators for industrial process heat application.
Acknowledgements-The author wishes to express appre- ciation to Mr. Todd Anuskiewicz, President, and Mr. Indra Madan, Senior Process Engineer, of the Central Solar Energy Research Corporation, Detroit, Michigan, U.S.A., for their cooperation and assistance in the work reported here.

The performance of a parabolic trough concentrator for solar industrial process heat 1437
REFERENCES
1. F. Kreith, J. N. Castle and C. E. Wyman, An overview of intermediate temperature solar collector and energy storage technology, in Proc. 6th fnt. Heat Transfer ConjI, Keynote papers Vol., pp. 255-269 (1978).
2. Co~~entrat~ag Collector Mass Production F~~~bi~ify, Vol. I and II, Central Solar Energy Research Corp., Detroit, Michigan, U.S. Department of Energy, Contract No. DE-ACOl-80ET-20636 (1 August 1981).
3. G. W. Treadwell, Design considerations for parabolic- cylindrical solar concentrators, SAND 76-0082, VC-62, SANDIA National Laboratories, Albuquerque, New Mexico (July 1976).
4. F. Kreith and J. F. Kreider, Principles o~.Sotur Engineer- ing. McGraw-Hill (1978).
5. handbook o~Tables~or .~athe~a~ics, 3rd edn, (edited by S. M. Selby) pp. 868875. Chemical Rubber (1967).
6. T. D. Harrison, Midtemperature solar systems test facility program for predicting thermal performance of line-focusing, concentrating solar collectors, SAND 80- 1964, UC-62, SANDIA National Laboratories, Albu- querque, New Mexico (November 1980).
7. J. W. Ramsey, B. P. Gupta and G. R. Knowles, Experim- ental evaluation of a cylindrical parabolic solar con- centrator, Trans. Am. Sot. Me&. Engrs, Series C, .I. Heat Transfer 99, 163-169 (1977).
8. G. W. Treadwell, N. R. Grandjean and F. Biggs, An analysis of the influence of geography and weather on
parabolic trough solar collector design, SAND 79-2032, UC-2, SANDIA National Laboratories, Albuquerque, New Mexico (March 1980).
9. J. A. Clark, Solar energy economics-the a priori dk- cision, fnf. f. Heat Mass Transfer 19,1095-l 107 (1976).
10. J. A. Clark, The a priori decision in solar energy and conservation economics, Chap. 6, Vol. I, General Prin- ciples, Economics of Solar Energy and Conservation Systems (edited by F. Kreith and R. E. West), CKC Press (1980).
11. T. D. Harrison, Midtemperature solar systems test facility predictions for thermal performance based on test data, Sandia National Laboratories, Albuquerque, New Mexico. a. SAND 80-1964/10 May 1981 (Custom Engineering) b. SAND 80-1964/3 January 1981 (Acurex) c. SAND 8~19~/1 November 1980 (Solar Kinetics).
12. V. E. Dudley and R. M. Workhoven, Performance testing of the hexcel parabolic trough concentrators, SAND 78- 081, SANDIA National Laboratories, Albuquerque, New Mexico (1978).
13. R. B. Edelstein, Solar thermal cost goals, SERI/TP-633- 1063, Solar Energy Research Institute, Golden, Colorado (January 1981).
14. T. D. Harrison, G. D. Bond and A. C. Ratzel, Design considerations for a proposed passive vacuum solar annular receiver, SAND 78-0982, SANDIA National Laboratories, Albuquerque, New Mexico (April 1979).
ANALYSE DES PERFORMANCES TECHNIQUES ET ECONOMIQUES DUN CONCENTRATEUR PARABOLIQUE POUR UNE APPLICATION INDUSTRIELLE DE
L’ENERGIE SOLAIRE
R&sumi--On prisente une identification des facteurs principaux qui influencent la performance technique d’un concentrateur parabolique et qui se relient directement ii la conception et a la construction. Ces facteurs incluent la reflectivite spectrale-directionnelle du systdme, le facteur d’interception miroir-recepteur tubulaire, le produit absorptivitbtransmitiviti du tube recepteur et du tube de converture, le facteur de perte d’extremite et un facteur decrivant l’effet d’erreur de poursuite et de mauvais alignement du tube recepteur. Chacun de ces facteurs a ttt quantific en terme de tolerance au dessin et a la fabrication et de degradation de performance. D’autres considerations qui se relient aux per&s the~iqu~ du tube recepteur sont le rev&ement ii basse emissivite et le rev&ement anti-&Iexion.
On developpe l’analyse des coats energetiques. Cette anaiyse determine a la fois la rentabilite, le cot% de l’energie et le cashflow annuel sur une p&iode d’investissement allant de 5 a 15 ans. Les facteurs economiques incluent les taux dint&&t, les coats des systemes auxiliaires, des fondations, des commandes, de l’installation du collecteur, de maintenance, le co& du combustible, du capital, le taux d’inflation. Des determinations dconomiques sont faites a trois sites US: Albtiquique NM, Fresno CA, et Caribou ME en utilisant les caracteristiques de performance thermique du collecteur prototype Sandia. Les cofits du collectem sont ceux determines par une analyse bade sur des volumes de production allant jusqu’a lCO.COO modules (de 48 m*) par an.
Les resultats montrent que pour une p&iode ~nv~tis~~t de 10 ans, le cot% rentable est de 7% par GJ pour tous les sites, pour un collecteur ayant un cot% total installe de 170 S/m’, qui inclue la fabrication et f’installation (124 S), fonctions et commandes (16 $) et syst&me auxitiaire (30 S). Pour tme p&ode d’investissement de 15 ans, les coats correspondants de combustible sont inferieurs a 4 $ par GJ pour tousles sites.
Pour un total en coQt de collecteur installe de 245 S/m*, le cotit rentable est inferieur a 9 Spar GJ en tout site, pour la m&me p&iode d’investissement de 10 ans. D’autres conditions sont kialubs. L’analyse est
generale et elle perrnet une evaluation en d’autres circonstances.

1438 J. A. CLARK
EINE TECHNISCH-WIRTSC~AFTLICHE LEISTUNGSANAL~S~ EINES KONZENTRIERENDEN PARABOLRINNEN-KOLLEKTORS FUR SOLARE PROZESSWARME
IN DER INDUSTRIE
Z~~~nf~~ung-Es wird die Identifikation der wichtigsten Entwurfsparameter behandelt, welche die technische Leistung eines Parabolrinnen-Kollektors beeinflussen und sich direkt auf Entscheidungen der Konstruktion und der Herstelhmg beziehen. Dabei werden folgende GrSOen beriicksichtigt : Spektrale Richtungsabh~~~eit der Reflexion in einem Spiegelsystem, der Auffangfaktor von Spiegel und Absorber- rohr, die Abhgngigkeit vom Einstr~lwinkel und das Tr~smissions-Absorptions -Produkt des Absorber- und des Hiillrohres, der WLrmeverlust an den Rohrenden und ein Faktor, der den EinfluB von Nachfiihrfehlern und falscher Absorberrohr-Ausrichtung beschreibt. Jeder dieser Faktoren wurde in Form von Entwurfs- und Herste~lungstoieranzen und der damit verbundenen ~istungsminde~ng quantitativ untersucht. Weitere Uberlegungen fiir die Konstruktion, die sich auf die thermischen Verluste des Absorberrohrs beziehen, sind Beschichtungen mit geringerer Emission, Evakuierung und Anti-Reflex- Beschichtungen. Es wird eine Analyse der Energiekosten fiir konzentrierende Parabolrinnen-Kollektoren durchgef~hrt. In der Untersu~hung werden sowohi die iaufend e~itteIten Kosten an der Ertrags~hwelie als such die jghrlichen Betriebskosten fiir eine Investitionsperiode im Bereich von 5 bis 15 Jahren bestimmt. Die wirtschaftlichen Faktoren beinhalten die Steuerabzugsftihigkeit der Investitionskosten und der Kosten fiir Energie-Installationen, den Einkommensteuersatz, die Kosten fiir Hilfssystem, Fundamente und Regehmg, die Kosten der Kollektorinstallation, W~tungskosten und Steuem, Brennsto~osten, Kapitaikosten, die allgemeine Inflations- und die Brennstofierteurungs-Rate. Die wirtschaftlichen Berechnungen wurden fiir drei Orte in den USA gemacht : Albuquerque, NM ; Fresno, CA; und Caribou, ME ; wobei die thermische Leistungscharakteristik des “Sandia Advanced Trough Prototype”-Kollektors verwendet wurde. Die Kollektorkosten beruhen auf Untersuchung~ der HerstelIungskosten fiir verschiedene Stiickzahien bis zu 100 000 Modulen (je 48 m2) pro Jahr. Wie die Ergebnisse zeigen, liegen bei einem Investitionszeitraum von 10 Jahren fiir alle Ortedie laufend ermittelten Kosten an der Ertragsschwelle bei weniger als 7,00 $fiir lo6 BTU. Dabei betragen die Gesamt-Installationskost~ des Kollektors 170 S/m*, die sich aufgliedem in Herstel- lungs- und Aufbaukosten von 123,81 S/m’, Kosten fiir Fundamente und Regehmg von 16, 15 s/m’ und Kosten fiir Hilfssysteme von 30,04 $/m’. Fiir einen 15 jiihrigen Investitionszeitraum liegen die entsprechen- den Brennstoffkosten bei weniger als 4 $ fiir lo6 BTU an allen Orten.
Fiir Gesamt-InstaIlationskosten des Kollektorsvon 245 S/m* liegen die Kosten an der Ertragsschwelle bei weniger als 9 S fiir lo6 BTU an allen Orten, ebenfalls fiir einen 10 j&rigen Investitionszeitraum. Das Berechnungsverfahren ist allgemein gehalten, so da0 such andere Faktoren beriicksichtigt werden k&nen.
AHAJIM3 TEXH~qE~K~X XAPAKTEP~~~K I? 3KOHOM~~ECK~X I-IOKA3ATEREfi FIAPAEiOJUfYECKOl-0 JIOTKOBOI-0 KOHUEHTPATOPA &‘IR
l-IPOMbIUlJlEHHO~O ACfIOJIb30BAHHR COJlHEYHOfl 3HEPTMM
AHHoTa~~-npoBe~e~i asanus 0cHomibix tpaiclopos, ~nuK~m~x ua TexmfYecKHe XapaKTepncTnK~ IIapa6OnuYeCKOrO nOTKOBOr0 KOHUeHTpaTOpa, KOTOpbIe IIBnRIOTCIt OlI&.kZ~enSlloLL&iMA upu pacYeTe
K~H~T~~Ku~H II TeXHOnOrBu npou3BonCTBa. K HIlM OTHOCIITCX: CneETpanbHan XapaKTepucwKa H
nuarpaMMa Hanpasnemiocru cucreiw 3epKan, pexmd pa6OTbI npuehwbxx 3epKanbHHx KOJIneKTOpOB,
~ry~K~opyr~a na~eH~xny~e~ w npou3senesue nor~omaTenbH0~ u UponycKaTe~bHo~ cnoco6HocTeii
IlpNeMHOfi II. 3amuTHOii Tpy6, K03@&iUHeHT KOHIJeBbIX UOTepb R K03I$~uI&leHT, OuuCbIBaEOmliii
BnllflHue OmHiiOK HeALleaJIbHOCTW IIpueMHOfi Tpy6U. npOBeneHa KOnuqeCTBeHHaR OUeHKa yKa3aHHbIX
+aKTopoe Ha ocHoBe KOHCT~YKTNBH~IX H TexHonorwIecKux aonycxoe u aMopTH3auuu ycraHoaKH.
PaCCMOTpeHbi TaKXe +aKTOpbE, KOTOpbje OIIpe~en%OT UOTepH Teuna ,,pueMHOii Tpy6Oii: UOKpbITHr
C HII3KOij u3JIy'iaTenbHOk CIIOCO6HOCTbIo,BaKyyMHpOBaHHbIe II I'IpOTHBOOTpaXaTeJIbHbIe UOKpbITuII.
npoBeneH aHam ~T~IIMOCTH meprm npA ucnonb30BaHw napa6onuuecKoro noTKoaor0 KOH-
UeHTPaTOpa. B pe3ynbTaTe OupeiieneHM KaK CTOHMOCTL 3Hepruu, 06eCueq~Ba~maff TeKymyto
peHTa6enbHOCTb, TaK u rOnOBbIe 6anaHcbi nnr rIepuOJ$OB KaIIuTanOBnOXeHHk OT 5 a0 15 neT. 3KOHOMH'IeCKUe @aKTOpbI BKJIMFIBIOT uHl3eCTuUuOHHyIG HanOrOByH, CKWlKy, Ha,,OrOBylO CKRnKY Ha
3HepreTu'IeCKOe o60pyAoBaHue,ypOBeHb EinOrOB Ha npK6b~nb,CrOuMOCTb BCIIOMOraTenbHbIX CuCTeM,
~yH~aMe~Oa M KOHTpOnbHbIX CifCTeM, CTOIiMOCTb MOUTaXa, 3KCnnyaTa~UOHHbIe 3JaTpTbI N HanOrH,
CTOLIMOCTL TOWIuBa, KalIuTana, TeMIIbI HH@TllUuR B pOCT LIeN Ha TOIIJIHBO. 3KOHOMFIeCKHe OUeHKH
IIpOBeneHblJlJHI~peXpaiiOH0B CUIA: Anbliyreplc (IIITaT HbIo-fvfeKcuKo),~pcCHO (mTaT Kane@opHun)
u Kapu6y (ILITaT M~H)C uCuOnb30BaHHeM TeunOBbIX XapaKTepuCTuK yCOZ3epUIeHCTBOBaHHOi Monenu
nOTKOBOr0 KOJlneKTOpa, pa3pa6OTaHHOrO B ~a6o~Topun QHAua. CTOuMOCTb KOnneKTO~ onpe-
LlenXJIaCb u3 aHanu3a rOnOBblX 3aTpaT Ha IlpOH3BOJWBO KOnJIeKTOpOB pa3nu'iHbIX pa3MepOB BIUIOTb
no 100000 bfonyneR(Kamnbl8 nnouranbm 516 KB. +yros = 48 id>
Pe3ynbTaTbI llOKa3bIBaWT, 9TO AJIX lo-neTHer rIepuOLW ICdm%TanOBJlOXeHH& CTOUMOCTL, o6ecne- %fBaIomal TeKymyro peHTa6enbHOcTb, COCTaBnneT MeHee 7 aonnapos Ha M~nnuoH BTE nna Bcex PafiOHOB IIpH IlOnHOii CTOHMOCTH KOJfJIeKTOpa B 15.79 DOJtJlapa 31 KB. (t)yT (170,00 nonnapos 38 M’),
CWna BXOJWI CTOlfMOCTb H3rOTOBneHUB H MOHTaXa (II,50 AO,WIapa), &,H&3MeHTa, KOHTPO,IbHbIX (1 SO aonnapa) R BCnOMoraTenbNbIX (2.79 nonnapa) CAmeM. &jr nepMona Kanmanomoxemfi B 15 ner coomernsyromaa cTouh+ocTb Tonnm3a cocrawT MeHee 4,OO nooJtnapos Ha h4IfnnuoH ETE ~UII( BCeX PaiiOHOB.
npH nonuokc-rou~ocr~ KonneKTopa ~22,79nonnapa3a KB. +y~ (245 nonnapoe 3a ~~)pacre~~an peHTa6eJIbHa5I CrOUMOCTb TOnnKBa COcTaBAT Mewee 9,00 nonnapoa Ha minniioki 6TE iufs ijcex
pairosoe. 3TO OTHOCMTCR 3i K IO-neTHeMy nepuony xanuTa~oanoxen~~. npoaeaeria TaKxe 0eeHKa
npyrHX yCnOBIiti.AHanw3 IIpoBonrrTC~ B o6wehl Bune,qTo AenaeT ero npsronHbIM ann OUCHKU npyrex
+aKTOpOB.