an analysis of the college's economic and social … the college's economic and social...
TRANSCRIPT

PELLISSIPPI STATE
COMMUNITY COLLEGE
An Analysis
Of the College's
Economic and Social
Impact
2008-2013
November 2013
PELLISSIPPI STATE COMMUNITY COLLEGE
A Major Partner in the Economic Vitality of the Knoxville Metropolitan Area

ii
Acknowledgments
Special thanks go to the following Pellissippi State Community College staff for their
invaluable assistance with this annual economic impact study:
Dr. Fred H. Martin, Educational Consultant
Ms. Nancy Donahue, Director of Budget and Payroll
Mr. Richard Smelser, Director of Financial Aid
Ms. Elisa Simmons, Financial Analyst
Note: This report is also available on the College’s web site at
http://www.pstcc.edu/departments/institutional_research/economic/eis_2008-2013.pdf
PELLISSIPPI STATE COMMUNITY COLLEGE is one of 46 institutions in the Tennessee Board of Regents system, the sixth largest system of higher education in
the nation. The Tennessee Board of Regents is the governing board for this system, which is comprised of six universities, 13 two-year colleges, and 27 area
Tennessee Technology Centers. The TBR system enrolls more than 80 percent of all Tennessee students attending public institutions of higher education.
PELLISSIPPI STATE COMMUNITY COLLEGE is an Affirmative Action/Equal Employment Opportunity college. Any person having questions about services
and facilities for persons with disabilities should contact the Services for Students with Disabilities office at (865) 694-6751 (Voice/TDD).
PSTCC 2951319

iii
EXECUTIVE SUMMARY
Pellissippi State Community College (PSCC) has served the Knoxville metropolitan area since
1974, experiencing significant student enrollment growth as indicated in Figure 1. The enrollment
for fall semester, 2013 for the College was a credit headcount of 10,704 students and a credit FTE of
6,826 students.
This twenty-sixth (26th
) annual analysis of the direct economic impact of Pellissippi State
Community College on Knox and Blount counties has recently been completed. It measures the
College's five-year (2008-2013) economic impact on the community in terms of (1) business volume,
(2) employment and (3) individual income. Not included in the study is the indirect economic
impact that naturally results from having a trained and educated work force available to local
business and industry.
The report is based on a standard model of economic impact modified for community colleges.
The economic impact model is based on a circular cash flow model as illustrated in Figure 2. The
model uses conservative income and employment multipliers, as illustrated in Figure 3, to determine
economic impact.
The study reveals that more than $325 million in "new", non-local, and state/federal revenues
flowed into the area during 2008-2013 as a result of the College's presence. These external revenues
represented 65.5 percent of the total college revenues for the period. The College also received more
than $171 million in local revenues during this period, for a grand total of more than $497 million in
revenues.
The following economic impact resulted from college expenditures of these revenues:

iv
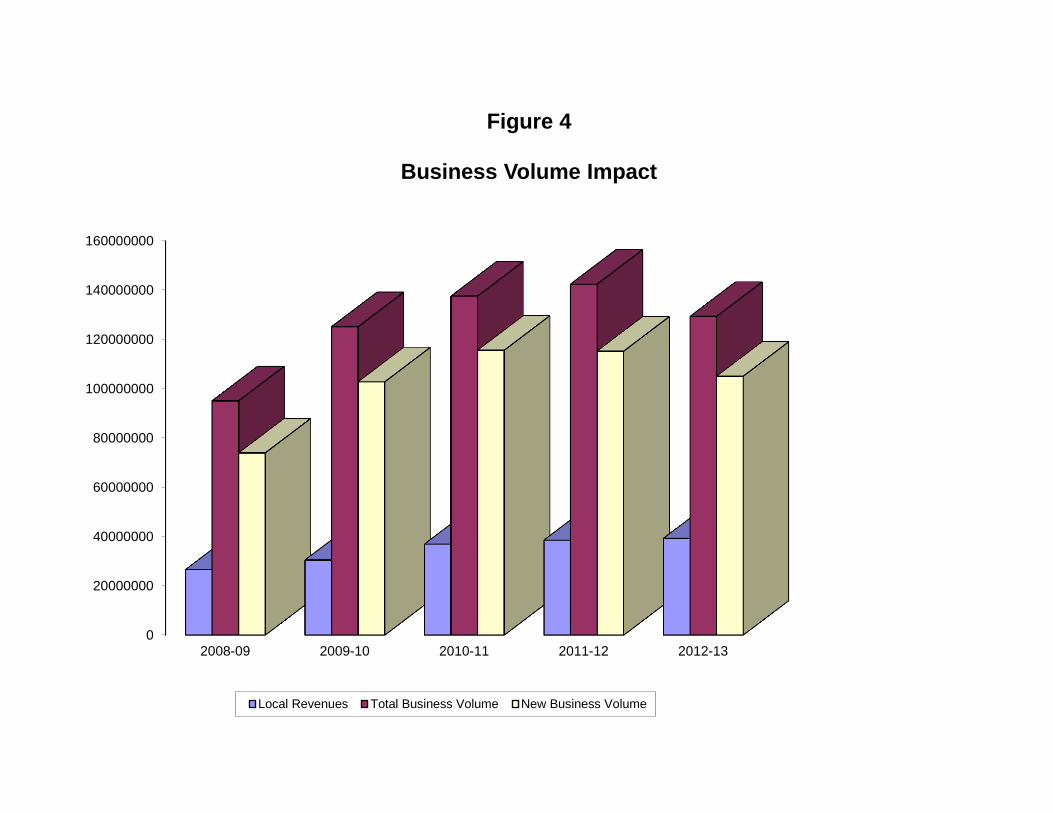
1. Local business volume generated by College expenditures during 2008-2013 was $630
million, with $513 million being due to non-local revenues, as shown in Figure 4. Annual
business volume generated ranged from $95.1 million to $142.4 million.
2. Local full-time-equivalent jobs created and sustained during 2008-2013 as a result of the
College's presence totaled 42,947 jobs, including the College’s own 2,472 jobs over that same
period. Of this total, 32,565 jobs were the result of non-local revenues, as shown in Figure 5.
Annual full-time jobs generated ranged from 6,569 to 9,660 jobs.
3. Local individual income generated by College expenditures during 2008-2013 totaled
$676million, using the more conservative Type I multiplier, with $561 million being due to
non-local revenues, as shown in Figure 6. Annual individual income generated ranged from
$100 million to $154.1 million.
In summary, the combined five-year direct economic impact on the community represents $1.3
billion, or an average of $261 million per year. Of this amount, $1.1 billion, or more than
$214 million per year, is due to the infusion of "new" external/non-local revenues. This impact
would likely not have occurred without the presence of Pellissippi State in the area.
It is significant to note that for every $1.00 of local revenues coming to Pellissippi State,
there was $3.67 of local business volume and from $3.94 to $4.18 of individual income
generated, for a total return on investment (ROI) of $7.61 to $7.85 on the local dollar!
In addition to the above local economic impacts, there are significant individual economic
benefits that accrue to students earning two-year Associate degrees. National research estimates a
differential of at least $350,000 in lifetime earnings for Associate degree graduates compared with
high school diploma holders. Applying that figure to the Spring 2013 class of Pellissippi State

v
graduates results in an estimate of $441 million that this class alone could potentially earn over their
high school diploma counterparts over their work lifetime, plus an increase of about $2.4 million in
annual local, state and federal tax payments.
Research on unemployment rates shows lower unemployment rates for people with college
degrees than for those with high school degrees or less. Finally, there are many demonstrated social
benefits to increased levels of education that accrue to the broader society, in addition to the more
personal economic benefits.
This study continues to document the significant force Pellissippi State has become in the
economic and social vitality of the Knoxville metropolitan area.


INTRODUCTION
Pellissippi State Community College (PSCC) has served the Knoxville metropolitan area since
1974, experiencing significant enrollment growth as indicated in Figure 1. The enrollment for fall
semester, 2013 for the College was a credit headcount of 10,704 students and a credit FTE of 6,826
students.
This report is the twenty-sixth (26th
) annual analysis of the rolling five-year (2008-2013)
economic impact of Pellissippi State on the Knoxville metropolitan area. The primary counties
affected are Knox and Blount, with approximately 83 percent of the College's expenditures being
made, on the average, in those two counties.
The analysis measures the direct, explicit economic impact of Pellissippi State on the
community. It does not include the implicit, intangible economic impact that results from having a
trained and educated work force available for local business/industry or from expansion and
recruitment of business/industry as a result of the presence of the College. The analysis is based on
the Caffrey model of economic impact, originally developed in 1968 through the American Council
of Education. The model has been adapted for application to community colleges.1
The model uses conservative income and employment multipliers to determine Pellissippi
State's economic impact on the following:
1. Business volume--the total amount of local business volume generated as a result of the
College's direct and indirect expenditures.
2. Employment--the total number of local full-time-equivalent jobs generated and sustained by
the College's direct and indirect expenditures.
1Norval L. Wellsfry, "The Los Rios Community College District: A Major Partner in the Sacramento Area's
Economic Vitality," 1988 (unpublished paper).

2
3. Individual income--the total amount of personal income earned by local households as a result
of the College's direct and indirect expenditures.
Two additional components of the College’s impact on the community are included:
(1) an estimate of the projected increase in lifetime earning capacity of the most recent class of
PSCC graduates compared to high school graduates, and (2) a description of the broader societal
benefits of increased levels of higher education.
METHODOLOGY
The economic impact model is based on a circular cash flow model as illustrated in Figure 2.
The community is treated as a semi-closed economic system, with money entering the system
through Pellissippi State from both local and external or "new" sources.
The local sources of revenue include student tuition/fees, local grants/contracts, private
scholarships, gifts and other miscellaneous local revenue. External or "new" revenues include state
appropriations for both operating and capital purposes, federal/state student financial aid revenues, as
well as state/federal grants and contracts.
Pellissippi State circulates its revenues through the local economy via expenditures for
employee salaries and benefits, construction and maintenance of facilities, and local purchases of
equipment and supplies. These expenditures are then re-circulated through the local economy,
increasing in value and having a multiplier or secondary impact as local businesses and households
make expenditures and generate jobs. Figure 3 illustrates the multiplier principle.
Economic impact on the community is measured on two levels: (1) in relationship to total
expenditures from all revenue sources and (2) in relationship to expenditures from only those
external or "new" revenues that would likely not have occurred without Pellissippi State's presence in

3
the economy. The following College revenues and expenditures for the five-year period 2008-2013
were incorporated into a MS Excel spreadsheet template containing the model.
REVENUES
SOURCES 2008-09 2009-10 2010-11 2011-12 2012-13 TOTAL
GENERAL
STATE APPROPRIATION 20,982,932 19,105,332 22,100,482 18,910,275 20,887,437 101,986,458
LOCAL PROPERTY TAX
ENROLLMENT FEES 23,783,077 28,116,198 33,012,450 34,659,338 34,910,095 154,481,158
TOTAL 44,766,009 47,221,530 55,112,932 53,569,613 55,797,532 256,467,616
FEDERAL 61,161 73,313 79,726 74,865 69,297 358,362
OTHER STATE 345 0 12,594 0 11,248 24,187
COUNTY
LOCAL 1,685,732 1,406,431 2,198,727 1,587,774 1,618,365 8,497,029
OTHER LOCAL
SPECIAL REVENUE
FEDERAL 1,326,504 3,473,128 1,515,833 1,129,902 875,524 8,320,891
STATE 456,471 960,049 11,022,235 698,899 1,078,770 14,216,424
LOCAL 256,973 174,280 208,168 261,781 332,456 1,233,658
OTHER
STUDENT FINANCIAL AID
FEDERAL 20,324,910 34,665,236 41,376,791 40,687,203 37,376,126 174,430,266
STATE 4,532,677 4,830,080 5,106,460 5,702,266 5,975,723 26,147,206
LOCAL 846,516 767,403 1,498,139 2,023,054 2,390,340 7,525,452
OTHER
TOTAL REVENUE 74,257,298 93,571,450 118,131,605 105,735,357 105,525,381 497,221,091
LOCAL 26,572,298 30,464,312 36,917,484 38,531,947 39,251,256 171,737,297
NON-LOCAL 47,685,000 63,107,138 81,214,121 67,203,410 66,274,125 325,483,794
LOCAL % 35.8% 32.6% 31.3% 36.4% 37.2% 34.5%
NON-LOCAL % 64.2% 67.4% 68.7% 63.6% 62.8% 65.5%
EXPENDITURES
DATA 2008-09 2009-10 2010-11 2011-12 2012-13 TOTAL
WAGES 26,059,102 27,217,916 28,852,799 30,368,869 31,848,000 144,346,686
NON-SAL. EXPEN. 19,200,986 20,142,375 23,402,236 21,985,136 22,923,753 107,654,486
CAPITAL EXPEN. 8,277,762 14,679,229 11,340,183 15,045,682 4,646,019 53,988,875
STU. FIN. AID 25,704,103 40,262,719 47,981,390 48,412,523 45,742,189 208,102,924
NET WAGES 19,544,327 20,413,437 21,639,599 22,776,652 23,886,000 108,260,015
NON-SALARY, LOCAL 15,840,813 16,617,459 19,306,845 18,137,737 18,912,096 88,814,951
CAPITAL, LOCAL 6,829,154 12,110,364 9,355,651 12,412,688 3,832,966 44,540,822
FTE COLLEGE JOBS 456 479 500 503 534 2,472
NON-LOCAL REVENUE % 64.2% 67.4% 68.7% 63.6% 62.8% 65.5%
TOTAL EXPENDITURES 79,241,953 102,302,239 111,576,608 115,812,210 105,159,961 514,092,971
LOCAL EXPENDITURES 67,918,397 89,403,979 98,283,485 101,739,600 92,373,251 449,718,711
LOCAL EXPENDITURES (NEW) 52,812,396 73,404,925 82,563,502 82,306,213 75,028,346 366,115,382

4
For the five-year period, $325.5 million in non-local revenues was brought into the service
area, along with $171.7 million in local revenues, for a combined total of $497.2 million in revenues.
The five-year average was 65.5 percent non-local and 34.5 percent local revenues.
RESULTS
Business Volume Impact
The local business volume impact generated by Pellissippi State expenditures is shown below:
BUSINESS VOLUME IMPACT
2008-09 2009-10 2010-11 2011-12 2012-13 TOTAL
BUSINESS VOLUME 95,085,755 125,165,571 137,596,879 142,435,439 129,322,551 629,606,196
BUSINESS VOLUME (NEW) 73,937,354 102,766,895 115,588,903 115,228,698 105,039,684 512,561,535
The annual business volume impact of total college expenditures ranged from $95.1 million to
$142.4 million, with a five-year total of $629.6 million. The impact of external or "new" college
funds ranged from $73.9 million to $115.6 million, with a five-year total of $512.6 million. Figure 4
graphs the relationship between local revenues and both total and “new” business volume generated
by the College’s presence.
Employment Impact
The local employment impact in terms of full-time-equivalent (FTE) jobs created and
sustained by Pellissippi State expenditures is shown below:
EMPLOYMENT IMPACT
2008-09 2009-10 2010-11 2011-12 2012-13 TOTAL
EMPLOYMENT 6,568.66 8,525.36 9,345.51 9,659.56 8,847.59 42,947
EMPLOYMENT (NEW) 5,045.94 6,929.49 7,774.46 7,727.26 7,087.92 34,565

5
Pellissippi State's own annual FTE jobs ranged from 456 to 534 during this period, yet the total
annual employment created and sustained by college expenditures ranged from 6,569 to 9,660 jobs,
with a five year total of 42,947 jobs, including the College’s own 2,472 FTE jobs over that period.
The number of FTE jobs created annually by external or "new" funds ranged from 5,046 to 7,774
jobs, with a five year total of 34,565 jobs. Figure 5 graphs the relationship between the College's
full-time jobs and both total and "new" full-time-equivalent jobs generated and sustained by the
College's presence.
Individual Income Impact
The local impact of Pellissippi State's expenditures on personal income is calculated using two
different multipliers to produce a range of impact, shown below as Type I and Type II. The Type I
multiplier is the more conservative measure.
INDIVIDUAL INCOME IMPACT
2008-09 2009-10 2010-11 2011-12 2012-13 TOTAL
TYPE I MULTIPLIER
100,225,200 135,139,001 149,044,638 154,058,682 137,939,952 676,407,473
TYPE II MULTIPLIER 107,661,425 142,905,905 157,278,073 162,724,742 147,028,098 717,598,244
TYPE I (NEW) 79,531,764 112,762,625 127,198,943 127,016,412 114,695,285 561,205,029
TYPE II (NEW) 84,307,003 118,000,837 132,859,335 132,524,397 120,403,001 588,094,574
The total Type I impact of college expenditures on personal income, using the more
conservative multiplier, ranged from $100.2 million to $154.1 million, with a five-year total of
$676.4 million. The impact of external or "new" funds ranged from $79.5 million to $127.2 million,
with a five-year total of $561.2 million. Figure 6 graphs the relationship between local revenues and
both total and “new” Type I personal income generated by the College’s presence.
In summary, the combined five-year direct economic impact on the community represents $1.3
billion, or an average of more than $261.2 million per year. Of this amount, $1.1 billion, or

6
$214.8 million per year, was due to the infusion of "new", external/non-local revenues. This impact
would likely not have occurred without the presence of Pellissippi State in the area.
It is significant to note that for every $1.00 of local revenues coming to Pellissippi State,
there was $3.67 of local business volume and from $3.94 to $4.18 of individual income
generated, for a total return on investment (ROI) of $7.61 to $7.85 on the local dollar!
ECONOMIC BENEFITS OF HIGHER EDUCATION
Many national and state research studies have demonstrated the economic value of
increased levels of education. There is a clear relationship established between increased levels
of education and increased annual incomes and lifetime earnings.
As a 2007 study of the impact of Middle Tennessee higher education institutions states,
“It appears that knowledge, either in the form of human capital or technological advancement,
has become the common denominator in much economic growth and regional competitiveness
literature.”1
Several national research studies have been completed that specifically focus on the
economic benefits of two-year Associate degree programs conferred by community colleges. As
one such study says, “While community colleges serve many goals and missions, their
occupational purposes are central, and virtually all their students enroll in order to enhance their
employment, either directly or by later transferring to 4-year colleges.”2
This same compilation of a dozen national studies of the effect of Associate degrees on
employment outcomes concluded that “completing Associate degrees generally enhances wages,
employment, and earnings by significant amounts…”3 Another such study entitled “Education
Pays: The Benefits of Higher Education for Individuals and Society” conducted by The College

7
Board, further concludes that “there is a correlation between higher levels of education and
higher earnings for all racial/ethnic groups and for both men and women.”4
Most studies of this nature contrast the annual and lifetime earnings potential of
Associate degree graduates compared with high school diploma holders. Lifetime earnings
generally mean the cumulative earnings over a 40 year work life from about age 25-64.
The literature indicates a range of lifetime earnings ratios between Associate degree
graduates and high school diploma holders, generally in the range of 20-30% higher, at a
minimum, for Associate degree graduates.5 This income gap between high school and college
graduates has also increased significantly over time.6
In terms of average annual earnings by Associate degree and high school diploma holders,
the literature also contains a range of findings. The College Board study referenced earlier cites
an average annual earnings differential of $6,800, 7 while a more recent U. S. Census Bureau
study indicates an even greater difference of $11,033 ($32,602 vs. $21,569).8
A 2007 study conducted by the University of Tennessee Center for Business and
Economic Research found that, over the seven year period from 1997 to 2005, Associate degree
graduates in Tennessee earned $33,326 on average one year after graduation, growing to $38,952
four years later, and to $42,921 after seven years, for an average annual growth rate of 4.3%.9
A 2013 study revealed even higher first year earnings ($38,945) for Tennessee Associate
degree completers. Also significant was the finding that Tennessee Associate degree completers
had higher first year earnings than did Bachelor’s degree completers. 10
According to The College Board study, a person with an Associate degree can expect to
earn about $1,769,000 over their work lifetime compared to about $1,419,000 for a high school

8
diploma holder, a difference of more than $350,000.11
It should be noted again that these
differences seem to apply to all genders, races, and ethnic groups.
ECONOMIC BENEFITS APPLIED
TO PELLISSIPPI STATE GRADUATES
During 2008-2013, Pellissippi State graduated 4,569 students with two-year Associate
degrees, as seen below:
Associate Degree Graduates
2008-09 658
2009-10 793
2010-11 755
2011-12 1,103
2012-13 1,260
Total 4,569
Graduates typically either transfer on to four year institutions to continue their education
or they seek immediate employment. The job placement rates for those career/technical graduates
who seek employment have been tracked as follows:
Job Placement Rates
2008 95%
2009 89%
2010 92%
2011 94%
2012 96%

9
An estimate of projected lifetime earnings of a class of Pellissippi State Associate degree
graduates can be gained using average national figures. The 2004 College Board study referenced
earlier found a difference of about $350,000 in lifetime earnings between Associate degree and
high school diploma holders. Taking the 1,260 graduates making up the class of 2012-13, for
example, and applying the $350,000 excess lifetime earnings of Associate degree over high
school diploma holders, one arrives at a figure of $441 million that this class alone could
potentially earn over their high school diploma counterparts.
Pellissippi State typically draws the great majority of its students from its two-county
primary service area. For example, in the fall semester of 2012, 78.5% of the headcount students
came from Knox and Blount County.
The University of Tennessee study referenced earlier found that those earning Associate
degrees were much more likely to stay and work in Tennessee than other degree-earners. In fact,
after one year, 73.3% of Associate-degree earners were working in Tennessee, compared with
62.4% of bachelor’s degree earners and 40.0% of doctoral degree earners.12
Assuming the majority of Pellissippi State’s graduates have remained in the area, the
economic impact of each succeeding graduating class over their earnings lifetime has been and
will continue to be an enormous contributor to local economic activity.
Along with the individual economic benefits associated with greater wages and earnings,
there are also corresponding societal economic benefits that come from increased levels of local,
state, and federal tax payments. The College Board study indicates, for example, average annual
tax payments of $8,600 for Associate degree holders vs. $6,700 for high school degree holders, a
difference of $1,900 per year.13
Applying that figure just to the 1,260 Pellissippi State Associate

10
degree graduates in 2012-13 would generate an estimate of $2,394,000 in increased annual tax
payments to local, state, and federal governments, plus the “multiplier effect” of these taxes as
they are circulated in the local, state and national economy.
Yet another indicator of the economic impact of education can be seen by comparing data
on unemployment rates. A 2012 study of unemployment rates shows the following:
Source: BLS, FactSet, J. P. Morgan Asset Management, 2012
A consistent trend is seen since 1992, with highest unemployment rates for people with
less than a high school degree, followed by people with a high school degree but no college, then
those with some college, and lowest for those with a college degree.

11
SOCIAL BENEFITS
Many studies of the value of higher education identify broader benefits to society at large,
in addition to the considerable economic benefits to the individual. Some of these societal
benefits of increased levels of higher education include:
1. Increased likelihood of attending a 4-year college. Students who enroll in public two-
year colleges increase their likelihood of attending a four-year institution by 5-10%;14
2. Lower levels of unemployment as educational attainment increases;15
3. Reduced poverty rates, particularly for single mother and married couple families
with children;16
4. Less dependence on social “safety-net” programs, resulting in less demand on public
budgets;17
5. Improved perceptions of personal health, along with reduced smoking rates18
, lower
rates of alcohol abuse and health-related absenteeism, and longer life spans;19
6. Reduced levels of crime and incarceration rates, along with reductions in victim costs
(It costs about $26,000 per year to maintain a prisoner whereas it only costs the state
about $3,300 per year to educate a student at Pellissippi State);20
7. Higher cognitive skill levels and greater ability to persist at tasks for young children
of mothers with more education;21
8. Higher levels of participation in civic and volunteer activities, including voting and
blood donation;22
and
9. Increased levels of home ownership.23
These broader societal benefits tend to apply similarly across all gender, racial and ethnic
student groups, as did the economic benefits.

12
CONCLUSIONS
The results of this economic and social impact study clearly demonstrate that Pellissippi State
Community College continues to be a major contributor to the economic bases of Knox and Blount
Counties. In addition to the more implicit impact of a community college on the improved
productivity and quality of life achieved through increased education, the explicit economic impact
noted here is significant. This economic impact is expressed here in terms of jobs created, business
volume generated and personal income earned.
Additionally, it has been demonstrated that a two-year graduate can expect to earn significantly
more over their work lifetime than a high school diploma holder, as well as to pay considerably more
local, state and federal taxes as a result. Also, research indicates lower unemployment rates for
people with college degrees than with high school degrees. Finally, there are demonstrated social
benefits to increased levels of education that accrue to the broader society, in addition to the more
personal economic benefits.
As Pellissippi State continues to grow in enrollment and/or budget, its economic and social
impact on the Knoxville metropolitan area will increase similarly. The College continues to be a
major partner and force in the economic vitality of the Knoxville metropolitan area.

13
REFERENCES
1. Higher Education Institutions in Middle Tennessee: An In-Depth Analysis of Their Impact on
the Region from a Comparative Perspective, Middle Tennessee State University Business and
Economic Research Center, study prepared by Murat Arik (March 30, 2007), p. 4.
2. “Learning and Earning in the Middle, Part I: National Studies of Pre-baccalaureate Education”,
W. Norton Grubb, Economics of Education Review 21 (2002), p. 300.
3. “Learning and Earning in the Middle, Part I: National Studies of Pre-baccalaureate Education”,
W. Norton Grubb, Economics of Education Review 21 (2002), p. 306.
4. Education Pays: The Benefits of Higher Education for Individuals and Society, The College
Board (2004), p. 7.
5. “Learning and Earning in the Middle, Part I: National Studies of Pre-baccalaureate Education”,
W. Norton Grubb, Economics of Education Review 21 (2002), pp. 304, 306.
6. Education Pays: The Benefits of Higher Education for Individuals and Society, The College
Board (2004), p. 7.
7. Education Pays: The Benefits of Higher Education for Individuals and Society, The College
Board (2004), p. 10.
8. “Education and Synthetic Work-Life Earnings Estimate”, U. S. Census Bureau, American
Community Survey (Sept. 2011), p. 3.
9. “School-to-Work: Do Tennessee’s Higher Education Graduates Work in Tennessee?” The
University of Tennessee Center for Business and Economic Research (April 2007), pp. 16-17.
10. “Higher Education Pays: But a Lot More for Some Graduates Than for Others”,
CollegeMeasures.org. (September 3, 2013), pp. 7, 11.
11. Education Pays: The Benefits of Higher Education for Individuals and Society, The College
Board (2004), p. 45.
12. “School-to-Work: Do Tennessee’s Higher Education Graduates Work in Tennessee?” The
University of Tennessee Center for Business and Economic Research (April 2007), p. 11.
13. Education Pays: The Benefits of Higher Education for Individuals and Society, The College
Board (2004), p. 10.
14. National Center for Education Statistics,
http://www.classesusa.com/schools/campus/associates.html (2004).

14
15. Education Pays: The Benefits of Higher Education for Individuals and Society, The College
Board (2004), p. 16.
16. Education Pays: The Benefits of Higher Education for Individuals and Society, The College
Board (2004), p. 17.
17. Education Pays: The Benefits of Higher Education for Individuals and Society, The College
Board (2004), p. 7.
18. Education Pays: The Benefits of Higher Education for Individuals and Society, The College
Board (2004), p. 18-19.
19. “The Socioeconomic Benefits Generated by 39 Community College Districts in Illinois”,
study conducted by C. C. Benefits (2002), p. 3.
20. Education Pays: The Benefits of Higher Education for Individuals and Society, The College
Board (2004), p. 20, and the Tennessee Higher Education Commission Calculation of State
Subsidy Per Student, 2010-11.
21. Education Pays: The Benefits of Higher Education for Individuals and Society, The College
Board (2004), p. 21.
22. Education Pays: The Benefits of Higher Education for Individuals and Society, The College
Board (2004), p. 22-24.
23. “The Economic Impact and Return on Investment of UTC: What Tennessee Taxpayers Get
For Their Money”, study conducted by the Probasco Chair of Free Enterprise (2005-2006), p. 8.

0
2000
4000
6000
8000
10000
12000
19
74
19
75
19
76
19
77
19
78
19
79
19
80
19
81
19
82
19
83
19
84
19
85
19
86
19
87
19
88
19
89
19
90
19
91
19
92
19
93
19
94
19
95
19
96
19
97
19
98
19
99
20
00
20
01
20
02
20
03
20
04
20
05
20
06
20
07
20
08
20
09
20
10
20
11
20
12
20
13
Figure 1
Student Headcount
Student Headcount

Figure 2
Circular Cash Flow Model External (New) Local Revenues Revenues
Wages/Benefits Contracts, Gifts
Fees, Purchases Purchases
Purchases
Wages
Fees
Scholarships Gifts
State
Federal
Local
Households
Local
Business
Pellissippi
State

Initial Spending 1st Recycle 2nd Recycle 3rd Recycle Final Spending
Figure 3
How the Multiplier Works
0
20000000
40000000
60000000
80000000
100000000
120000000
140000000
160000000
2008-09 2009-10 2010-11 2011-12 2012-13
Figure 4
Business Volume Impact
Local Revenues Total Business Volume New Business Volume

0
1000
2000
3000
4000
5000
6000
7000
8000
9000
10000
2008-09 2009-10 2010-11 2011-12 2012-13
Figure 5
Employment Impact
FTE College Jobs Total Employment New Employment

0
20000000
40000000
60000000
80000000
100000000
120000000
140000000
160000000
2008-09 2009-10 2010-11 2011-12 2012-13
Figure 6
Individual Income Impact
Local Revenue Total Indiv. Income New Indiv. Income