an analysis of international outsourcing in iran-china
TRANSCRIPT
Journal of Money and Economy
Vol. 8, No. 1 Winter 2013
An Analysis of International Outsourcing
in Iran-China Trade Relations
Seyed Reza Miraskari
Seyed Komail Tayebi
Mohammad Vaez Barzani
Received: 2/26/2013 Approved: 7/29/2013
Abstract
Iran-China relations are deeply rooted in history and have been enhanced
recently with bilateral cooperation in the areas of energy, arms sales, trade,
political cooperation and cultural ties. The objective of this paper is to analyze
the role of international outsourcing in form of trading intermediate products
on bilateral trade relations between Iran and China. As an empirical work, we
have studied the trade structure of intermediate and final goods between the
two countries during the period 1992-2011. Intermediate and final goods traded
are classified into three groups: 1) electronic product, 2) automobiles and
motorcycles, and 3) apparel and footwear. Observations on such products show
that the share of Iran’s intermediate trade with China in these three industries
to total trade is about 55% on average. We have concluded that trade in
intermediate goods between Iran and China has been more volatile than that of
final goods.
Keywords: International Trade, International Outsourcing, Intermediate
Goods, Global Value Chain (GVC)
JEL classification: F10, F23, O19
Ph.D. student of Economics, Department of Management, University of Guilan, Iran
[email protected] Department of Economics, University of Isfahan, Iran Department of Economics, University of Isfahan, Iran
110 Journal of Money and Economy, Vol. 8, No. 1, Winter 2013
1. Introduction
According to Jones and Kierzkowski (2000), if the term fragmentation suggests
destruction, it is creative destruction in the Schumpeterian tradition. Breaking
down the integrated process into separate stages of production opens up new
possibilities for exploiting gains from specialization. Although such
fragmentation is likely to occur first on a local or national basis, significant cuts
in costs of international coordination often allow producers to take advantage of
differences in technologies and factor prices among countries in designing more
global production networks. The fragmentation and offshoring of production
processes has been an important phenomenon for many years (Hummels, Ishii,
and Yi 2001), having started in the mid-1980s in East Asia and across the US-
Mexico border. Ando and Kimura (2005) and Urata (2001), for example,
document the linked rise of foreign direct investment, offshoring, and parts and
components trade by Japanese firms in East Asia. In North America, the 1980s
saw the widespread emergence of ‘twin plants’ (one on either side of the US-
Mexico border) under the Maquiladora programme (Dallas Fed 2002, Feenstra
and Hanson 1996). Even so, these supplemental statistics illustrate the overall
importance of this activity to some developing countries as over 40 percent of
the total manufactures exports of Mexico, Jamaica, Haiti, Dominican
Republic and El Salvador involve assembly operations using components
manufactured abroad.
Antràs and Helpman (2004) have stated that growth of international
specialization has been a dominant feature of the international economy. The
World Trade Organization provides an example in its 1998 annual report. In the
production of an “American” car, 30 percent of the car’s value originates in
Korea, 17.5 percent in Japan, 7.5 percent in Germany, 4 percent in Taiwan and
Singapore, 2.5 percent in the United Kingdom, and 1.5 percent in Ireland and
Barbados. That is, “only 37 percent of the production value is generated in the
United States” (p. 36).
Veeramani (2009) has studied the impact of imported intermediate and
capital goods on economic growth. He has explained that endogenous growth
models emphasize two important mechanisms through which the participation
in international trade can raise the long-term growth rate of countries. First,
An Analysis of International … 111
trade enables the use of better (Aghion and Howitt 1992) and larger (Romer
1987) variety of intermediate products and capital equipment. Second, trade
plays an important role as a transmission channel for knowledge spillovers
across countries (e.g., Grossman and Helpman 1991, Coe and Helpman 1995,
Coe et al, 1997, Keller 2000, 2004). Countries that use imported intermediate
products and capital equipments derive benefits because these products embody
foreign knowledge. Spillovers arise in this process of knowledge diffusion to
the extent the imported products cost less than its opportunity costs –including
R&D costs to develop products. Further, import might facilitate learning about
the products (for example, reverse engineering), spurring imitation or
innovation of competing products. Adding, trade relationships stimulate
personal interaction and other channels of communication leading to cross
border learning of production methods, product design, organizational methods,
and market conditions.
This paper is structured as follows: Section 2 defines and illustrates the
concept of international outsourcing. Section 3 analyzes the role and impacts of
international outsourcing and intermediate trade on international trade flows. In
section 4, we will describe trends of intermediate and final goods trade in the
world. Section 5 will study structure of intermediate and final goods trade
between Iran and China in period 1992-2011, finally Section 6 will focus on
concluding remarks which meet the main objective of this paper.
2. Concept of International Outsourcing
Feenstra (2004) has stated that international outsourcing refers to geographic
separation of activities involved in producing a good (or service) across two or
more countries. In research by Zorell (2008), value chains have been sliced up
into individual tasks, some of which have been relocated to foreign countries,
either in the form of offshore in-house production or as purchases of foreign
intermediates at arm’s length. Both modes are referred to as offshoring. To
Grossman and Helpman (2005), outsourcing means more than just the purchase
of raw materials and standardized intermediate goods. It means finding a partner
with which a firm can establish a bilateral relationship and having the partner
112 Journal of Money and Economy, Vol. 8, No. 1, Winter 2013
undertake relationship-specific investments so that it becomes able to produce
goods or services that fit the firm’s particular needs. Often, but not always, the
bilateral relationship is governed by a contract, but even in those cases the legal
document does not ensure that the partners should conduct the promised
activities with the same care that the firm would use itself if it were to perform
the tasks.
Antràs and Helpman (2004) have classified and nominated different kinds
of strategy for producing an intermediate good: A firm that chooses to keep the
production of an intermediate input within its boundaries can produce it at home
or in a foreign country. When it keeps it at home, it engages in standard vertical
integration. And when it makes it abroad, it engages in foreign direct investment
(FDI) and intra-firm trade. Alternatively, a firm may choose to outsource an
input in the home country or in a foreign country. When it buys the input at
home, it engages in domestic outsourcing. And when it buys it abroad, it
engages in foreign outsourcing, or arm’s-length trade.
Sometimes, Offshoring and Offshore Outsourcing are used for International
Outsourcing. Feenstra (2004), Feenstra and Taylor (2008), have mentioned that
Production Sharing is a good name for this concept. The term Production
Sharing was conducted by management consultant Peter Drucker in Wall Street
Journal, March, 1977. Hence, a variety of expressions are used for this concept
by different economists that Feenstra (2004) has pointed to some of them which
can be completed:
1. Outsourcing (Katz and Murphy 1992; Feenstra and Hanson 1996)
2. Delocalization (Leamer 1996)
3. Fragmentation (Jones 2000; Arndt and Kierzkowski 2001; Marjit and
Acharyya 2003)
4. Intra-product specialization (Arndt 1998a, 1998b)
5. Intra-mediate trade (Antweiler and Trefler 2002)
6. Vertical specialization (Hummels, Ishi, and Yi 2001)
7. Slicing the value chain (Krugman 1995)
8. International outsourcing (Glass and Saggi 2001; Kohler 2004;
Meshcheryakova 2005; Bachmann and Braun 2011; Falk 212)
9. Foreign outsourcing (Antràs and Helpman 2004; Elwell 2005)
An Analysis of International … 113
10. Production Sharing (Drucker 1977; Feenstra and Taylor 2008)
Thus, international outsourcing can be explained by intermediate goods
imports from a foreign country. This is based on definition that Antràs
and Helpman (2004) have classified and explained in their paper.
3. International Outsourcing and International Trade
As Sturgeon and Memedovic (2010) have stated in their study, there is a rapidly
growing body of research examining the processes of geographic fragmentation,
dispersion, and long distance coordination in both goods and services industries.
Clearly, the rise of what are often referred to as international outsourcing is an
important driver of structural change on many levels. When production
becomes increasingly fragmented, or “roundabout” (Young, 1929), the
increased demand for specialized intermediate goods and services draw a
broader range of establishments, firms, workers, and countries into increasingly
complex and dynamic division of labor. For nations that are very deeply
integrated and economically interdependent with others, the basic structure of
industries, employment, and innovation can be affected.
In theory, each segment, activity, or node in the value chain can contribute a
set of highly specialized tasks and inputs to build up of finished products or
services (Smith, 1776), with the dividing lines between tasks influenced by
points of technological dissimilarity (Richardson, 1972) as well as the
codification schemes and standards that ease the exchange of appropriate
technical information between specialized tasks (Langlois and Robertson, 1995;
Baldwin and Clark, 2000; Sturgeon, 2002; and Principe et al., 2003).
Such factors can influence how the work is divided, not only within a
factory or single firm, but also in globe-spanning business networks that link
several firms, facilities, offices, carriers, and workshops as a product or service
takes shape along a value adding chain of activities. Moreover, the potential for
international outsourcing formation is increasing. Advances in information
technology, better codification schemes, and improvements in transport and
logistics increase the potential for the geographical fragmentation of work.
According to Makusen (2002) the traditional view of internationalization
114 Journal of Money and Economy, Vol. 8, No. 1, Winter 2013
rests on a clear distinction between produced commodities and primary factors.
According to this view, the principle of international arbitrage operates on
goods prices via international exchange of goods, based on a given and well-
defined underlying value-added process. In addition, it operates on factor
prices-directly via international factor movements, and indirectly via the
factor-price effects of trade. However, recent developments appear to challenge
this view. Improvements in communication technology as well as reductions of
formal and technical barriers to trade gave rise to a new vehicle of
internationalization where international arbitrage cuts value-added processes
into ever smaller slices produced in different locations (Jones and Kierzkowski,
1990; Harris, 1995). In contrast to traditional trade theory, a certain value-added
process then no longer takes place under a uniform set of factor prices, but
draws on different factor markets for different fragments. The theoretical
challenge is to analyze the driving forces and effects of this process of
increasing international fragmentation. It is quite obvious that this goes beyond
extending trade theory to include trade on established markets of existing
intermediate goods, and indeed a largely accomplished task.
Growth in exports in the 1990s was mostly in exports of technology and
human capital–intensive production. They grew by around 17 percent per year
as against 9 percent growth for all exports. In contrast, export growth in the
2000s was much more balanced between sophisticated goods and goods more in
line with India’s static comparative advantage, natural resources and unskilled
labor. In the 2000s, however, services exports with much higher human-capital
intensity took off with growth of 18 percent per year. The sources of global
trade growth provide no strong reasons for export pessimism. In recent years
before the global crisis, high-income country imports have grown faster than
GDP, driven by differentiation of goods and outsourcing of some elements of
production. Developing country exports, in contrast, have risen faster than
global GDP because of continuing economic integration, fragmentation of
production, and specialization in globalized production networks (Shephard et
al., 2011). Hummels et al, (2001) have shown that growth of trade in
intermediate goods is more rapid than trade in final goods.
An Analysis of International … 115
Despite significant data gaps, recent research strongly suggests that global
value chain (GVCs) and international outsourcing have become a central force
driving structural change in many economies, and that their rise is likely to have
triggered both positive and negative outcomes. On the positive side, Bernard et
al, (2006) have shown that in the United States, firms that trade tend to be
larger, earn higher profits, spend more on R&D, and pay higher wages than
firms that do not. Empirical research has also shown that access to a range of
competitively priced foreign intermediate goods has been crucial to achieve
higher productivity in both industrialized countries and recent developers such
as India and China (Miroudot et al., 2009; Goldberg et al., 2008).
For developing countries, trade, investment, and knowledge flows that
strengthen international outsourcing can provide mechanisms for rapid learning,
innovation and industrial upgrading (Lall, 2000; Humphrey and Schmitz, 2002).
GVCs can provide better access to information, open up new markets, and
create opportunities for fast technological learning and skill acquisition.
Because GVC-linked transactions and investments typically come with quality
control systems and prevailing global business standards that exceed those in
developing countries, suppliers and individuals in developing countries can be
“pushed” to acquire new competencies and skills through their participation in
GVCs. In the most deeply linked developing countries, these business process
improvements can sometimes be felt far beyond exporting firms and sectors.
At the same time, local firms in developing countries can achieve greater
success in their own markets by combining domestic and foreign intermediate
inputs and creating economies of specialization that leverage cross-border
complementarities. For example, border-spanning GVC linkages can potentially
bring local firms into closer contact with “open innovation” systems (Teece et
al., 1997 cited in Ketels and Memedovic, 2008), where firms draw on and
contribute to freely available technologies and standards. Local firms can also
take advantage of specialized knowledge garnered through participation in
GVCs to export or set up production abroad, either directly or through
contractors and suppliers.
116 Journal of Money and Economy, Vol. 8, No. 1, Winter 2013
The impact of GVCs can be easy to see on the ground. GVC-mediated trade
has clearly driven investments in new productive capacity and massive
infrastructure improvements, especially in key producing countries such as
China, where we see huge factory complexes, sometimes employing 100,000
workers or more, churning out products that are sent to world markets through
vast new port facilities. While little if any of this business or technological
competency is likely to be indigenous to the “host” developing countries, it is
clear enough that GVCs have boosted employment, enabled increased
specialization and larger scale production, driven more efficient geographical
allocation of industrial activities, and increased the availability of a variety of
intermediate goods in the developing world. As a result, GVCs tend to
“compress” the development experience, making non-linear catch up possible,
as has been the case in China (Whittaker et al., 2010; Breznitz, 2011).
4. Analysis of Intermediate and Final Goods Trade in the
World
This section explains briefly a research that has been done by Sturgeon and
Memedovic (2010). They have drawn on the United Nations (UN)
COMTRADE database to examine patterns of final and intermediate goods
trade. Intermediate goods can be parts and components of manufactured goods
for final consumers. Trends in intermediate goods trade are indicative of
GVC formation because fragmented production processes require that parts,
components, and partially manufactured subassemblies cross borders—
sometimes more than once—before final goods are produced and shipped to
final markets (Feenstra, 1998; Arndt and Kierzkowski, 2001). They focus on
trade in goods because goods-producing industries have been at the forefront of
GVC development and, simply put, rich international trade statistics are only
available for goods (Sturgeon et al., 2006; Sturgeon and Gereffi, 2010).
A group of data using novel classifications for final and intermediate goods
trade, overall; and in three industries oft-cited as being at the forefront of global
economic integration has been used: 1) electronics, 2) automobiles and
motorcycles, and 3) apparel and footwear.
An Analysis of International … 117
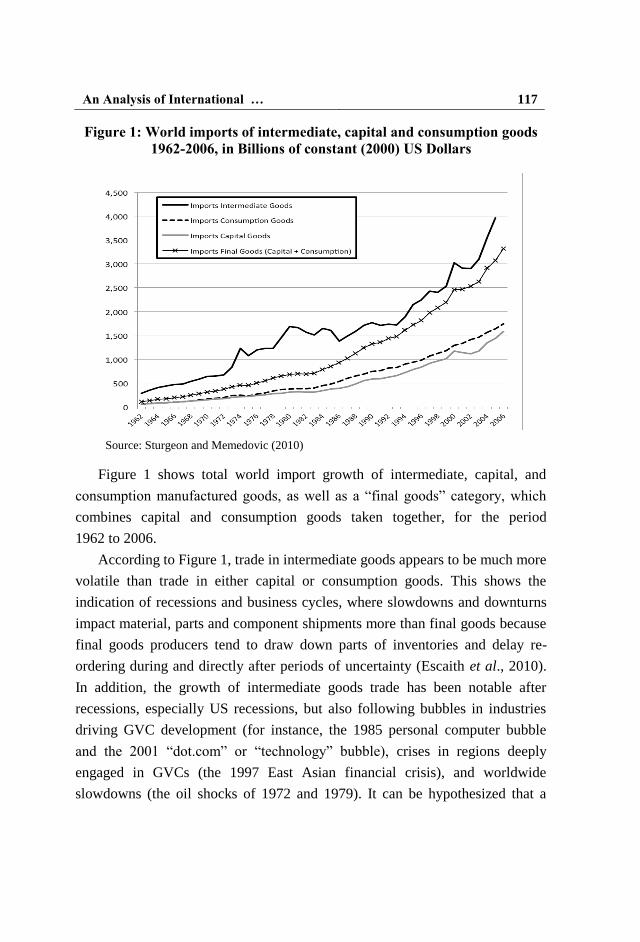
Figure 1: World imports of intermediate, capital and consumption goods
1962-2006, in Billions of constant (2000) US Dollars
Source: Sturgeon and Memedovic (2010)
Figure 1 shows total world import growth of intermediate, capital, and
consumption manufactured goods, as well as a “final goods” category, which
combines capital and consumption goods taken together, for the period
1962 to 2006.
According to Figure 1, trade in intermediate goods appears to be much more
volatile than trade in either capital or consumption goods. This shows the
indication of recessions and business cycles, where slowdowns and downturns
impact material, parts and component shipments more than final goods because
final goods producers tend to draw down parts of inventories and delay re-
ordering during and directly after periods of uncertainty (Escaith et al., 2010).
In addition, the growth of intermediate goods trade has been notable after
recessions, especially US recessions, but also following bubbles in industries
driving GVC development (for instance, the 1985 personal computer bubble
and the 2001 “dot.com” or “technology” bubble), crises in regions deeply
engaged in GVCs (the 1997 East Asian financial crisis), and worldwide
slowdowns (the oil shocks of 1972 and 1979). It can be hypothesized that a
118 Journal of Money and Economy, Vol. 8, No. 1, Winter 2013
similar reason has followed in the wake of the “great recession” or “financial
crisis” of 2008-2009.
Also Chen (2010) has examined the role of intermediate goods in explaining
large trade volatility. This topic is of great importance in analyzing the trade
collapse in the crisis of 2008 and 2009. In aggregate data, trade volatility is
three times greater than GDP volatility, an observation contradicting standard
theories. Using input-output tables of the United States data, he identified the
importance of intermediate goods in production and distinguished them from
final goods. The data showed that the final product trade volatility was
dominated by the fluctuation of the intermediate goods trade. Understanding the
relationship between final consumption goods and intermediate components can
explain why there is high volatility in the trade flow caused by intermediate
goods. The final consumption goods producers are trying to deliver goods that
customers perceive as being different in ways that are important to them, even if
they are producing goods in the same group. Therefore, the production of final
consumption goods always involves advertisements, additional accessories,
customer services, etc. All these procedures increasing sales and appealing to
consumers make final consumption goods imperfect substitute. For example,
consumers care about varieties of computers produced by different firms.
Computer manufacturers, like Lenovo and Dell, can build laptops with the same
specs using quite different designs and materials. They also offer different
customers services, technology supports and accessories.
These steps differentiate laptops between manufacturers. Thus final
consumption goods are imperfect substitute. By contrast, consumers care less
about intermediate goods. Consider the case of laptops. Consumers are more
aware of laptops producers than memory or hard disk producers. Final
consumption goods are less substitutable than intermediate goods. The
production of final consumption goods requires specific intermediate goods
produced either at home or in the foreign country. For example, auto
manufacturers require components like tires, frames, steels. These intermediate
goods are specific and nonexchangeable within the production of a car.
It is well documented that companies tend to be reluctant to hire new
workers after recessions, slowdowns, and crises until demand improvements are
An Analysis of International … 119
sustained, making employment a lagging indicator of recovery (Langdon et al.,
2004). Related to this, however, and less well documented, is the more
aggressive implementation of outsourcing and offshoring strategies, when
expansion resumes, based on a similar reluctance to invest in new internal
production capacity and lingering caution from recession episodes of cost
cutting and downsizing. This pattern is in line with the findings from qualitative
research on the electronics industry, where companies increased outsourcing
and offshoring following recessions and technology bubbles in 1985, 1991 and
2001, because demand uncertainty rendered investments in internal capacity
more risky. Then, as the cycles continued toward new peaks, firms reported
building on successful outsourcing experiences given insufficient time to install
new internal capacity to meet rapidly growing demand (Sturgeon, 2003).
Overall, in different times, outsourcing and offshoring tended to become
more common.
5. Analysis of Iran-China Relations
Iran-China relations are as ancient as the Persian and Chinese civilizations.
According to Olimat (2013), their origins extend far back into the era of the Silk
Road. The Sassanids of Persia, and the Han and Tang Chinese dynasties had
built strong commercial and cultural ties. The Hans signed a commercial treaty
with Persia in 100 BCE to organize their trade and customs relations, while
Tangs enhanced trade and strengthened their cultural ties with Persia. Since
then, trade flourished between the two sides when Silk Road caravans travelled
from China across the plains, mountains and valleys of Central Asia towards
Persia and through Turkey to Europe’s ports. Silk Road merchandise of silk,
species, textiles, horses and camels strengthened relations among world nations
at that time and continued its role in promoting trade and cultural exchange well
into the thirteenth century.
Olimat (2013) classified the five aspects of Sino (China)-Iranian relations as
political cooperation, cultural exchange, arms sales, oil and energy cooperation,
and trade and economic relations that are explained as follow:
120 Journal of Money and Economy, Vol. 8, No. 1, Winter 2013
5.1. Political Cooperation
Persia recognized the Republic of China (ROC) in 1911, signed a friendship
agreement with the ROC in 1922 and withdrew its recognition of China in
1949. However, Iran re-established its diplomatic relations with the ROC in
1956 and maintained close political, economic, trade and diplomatic relations.
Relations continued to improve until the Iran Revolution from 1978 to 1979.
China had called for peaceful negotiations between the Government and the
opposition all along, a process that failed and led to the demise of Shah’s
regime. China recognized the revolution and attempted to continue normal
relations with Iran. Although China did establish diplomatic relations with Iran,
its relations with Iran could not be classified at that time as strategic or
distinguished. During the 8-years war between Iraq and Iran, China sold
weapons to both sides.
After 8-years war, China was delighted that the war had ended, as it was
eager for lucrative deals in the postwar reconstruction period and had an interest
in the energy sectors in both Iran and Iraq. Iran went to China wholeheartedly,
and trade grew rapidly between the two sides.
5.2. Cultural Exchange
Iran-China cultural relations are deeply rooted and embedded within the Silk
Road paradigm. Persian culture, musical instrument (lute), religious doctrines
(Zoroastrianism, Manichaeism), costumes and traditional folklore were highly
celebrated in China, especially during the Tang Dynasty. Familial relationships
of marriage and kinship between the two sides were common throughout history
as well. These cultural relations began to decline with the Mongol near
total destruction of both Islamic and Chinese civilizations. This trend continued
through the era of Chinese isolationism and the century of humiliation
(1848-1949).
Kemp (2010) states that ‘the cultural barriers between the Islamic people of
Persia and Buddhists of China, as well as natural barriers such as the mountains
and deserts of Central Asia, discouraged trade. Meanwhile, nations encouraged
isolationism, which led to xenophobia among their populations, and trade and
communications led to the Silk Road dwindled. Olimat (2013) explains contrary
An Analysis of International … 121
to Kemp’s assumption that the incompatibility of the Islamic and Buddhist
values contributed to isolationism, Islam was well received in China
and celebrated.
Relaxing ideological tensions and improving trade relations led to a
significant volume of cultural contacts not only between China and Iran but also
between China and the people of the Middle East during the Deng Xiaoping era
and afterwards. Cultural exchange is viewed as an instrument to further ties
between two sides. In his visit to Iran in April 2002, Jiang Zemin made sure to
visit Iran’s cultural capital, Shiraz, where he signed a cultural agreement to
translate and publish some Iranian masterpieces into Chinese; the project was
successfully carried out. Both countries celebrate an ‘Iranian” and a Chinese
week, assort of annual cultural festival to highlight culture, cuisine, folklore,
traditions and bilateral cooperation.
Iran opened the doors of its pavilion to millions of visitors in 2010,
Shanghai International Expo. The pavilion fully embodied the traditional
Islamic architecture and revealed its glorious ancient art and colorful
contemporary lives. It was divided into three parts: Iran’s past, present and
future. It reflected Iranian civilizational depth, its current developmental
accomplishments and its future aspirations. Chinese people also have a
tremendous interest in learning Persian. Chinese entrepreneurs are educating
themselves in Iranian language, culture and history. Their goal is to equip
themselves with the necessary tools to conduct successful business deals with
their Iranian counterparts. The Chinese New Year and the Nowruz (Iranian New
Year) festivals are frequently celebrated in both countries. They are a testament
to the cultural depth between China and Iran. There is also an increase in
tourism between the two sides, as Iran is becoming one of the destinations for
Chinese tourists.
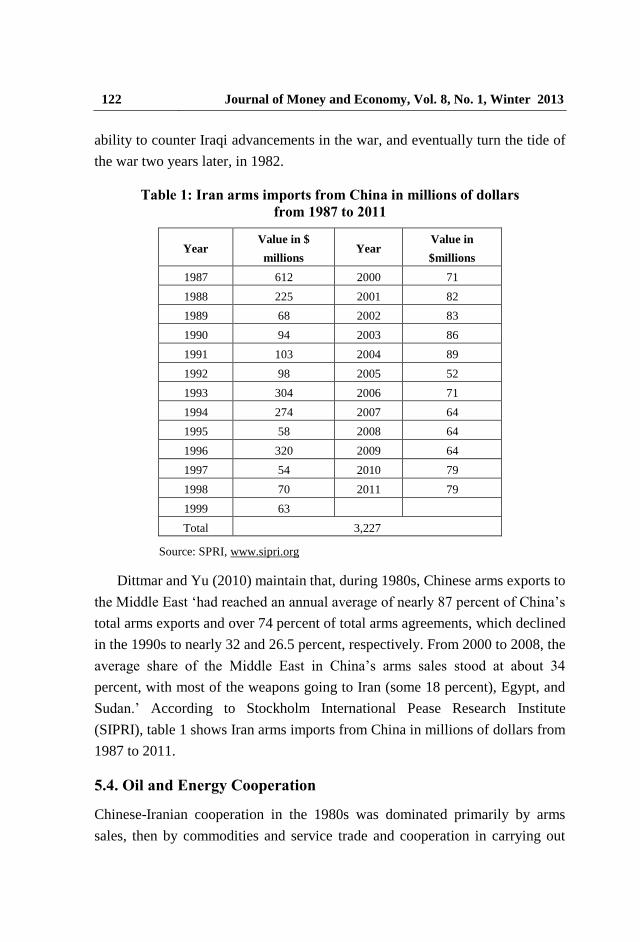
5.3. Arms Sales
China’s arms sales to Iran began in the early 1980s, associated with the Iran-
Iraq War, 1980-88. China’s weapon shipments sustained Iran and boosted its
122 Journal of Money and Economy, Vol. 8, No. 1, Winter 2013
ability to counter Iraqi advancements in the war, and eventually turn the tide of
the war two years later, in 1982.
Table 1: Iran arms imports from China in millions of dollars
from 1987 to 2011
Value in
$millionsYear
Value in $
millionsYear
7120006121987
8220012251988
832002681989
862003941990
8920041031991
522005981992
7120063041993
6420072741994
642008581995
6420093201996
792010541997
792011701998
63 1999 3,227 Total
Source: SPRI, www.sipri.org
Dittmar and Yu (2010) maintain that, during 1980s, Chinese arms exports to
the Middle East ‘had reached an annual average of nearly 87 percent of China’s
total arms exports and over 74 percent of total arms agreements, which declined
in the 1990s to nearly 32 and 26.5 percent, respectively. From 2000 to 2008, the
average share of the Middle East in China’s arms sales stood at about 34
percent, with most of the weapons going to Iran (some 18 percent), Egypt, and
Sudan.’ According to Stockholm International Pease Research Institute
(SIPRI), table 1 shows Iran arms imports from China in millions of dollars from
1987 to 2011.
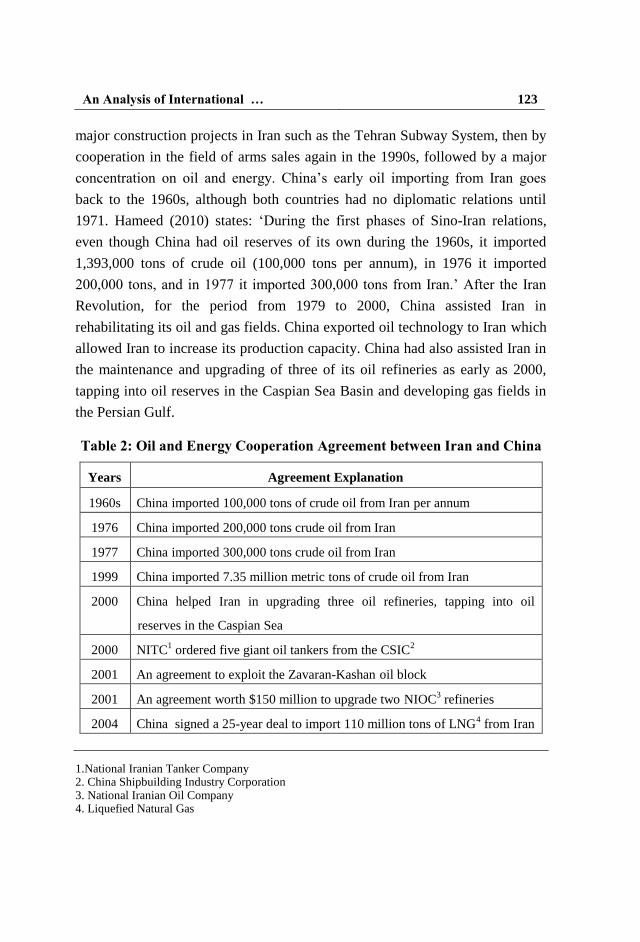
5.4. Oil and Energy Cooperation
Chinese-Iranian cooperation in the 1980s was dominated primarily by arms
sales, then by commodities and service trade and cooperation in carrying out
An Analysis of International … 123
major construction projects in Iran such as the Tehran Subway System, then by
cooperation in the field of arms sales again in the 1990s, followed by a major
concentration on oil and energy. China’s early oil importing from Iran goes
back to the 1960s, although both countries had no diplomatic relations until
1971. Hameed (2010) states: ‘During the first phases of Sino-Iran relations,
even though China had oil reserves of its own during the 1960s, it imported
1,393,000 tons of crude oil (100,000 tons per annum), in 1976 it imported
200,000 tons, and in 1977 it imported 300,000 tons from Iran.’ After the Iran
Revolution, for the period from 1979 to 2000, China assisted Iran in
rehabilitating its oil and gas fields. China exported oil technology to Iran which
allowed Iran to increase its production capacity. China had also assisted Iran in
the maintenance and upgrading of three of its oil refineries as early as 2000,
tapping into oil reserves in the Caspian Sea Basin and developing gas fields in
the Persian Gulf.
Table 2: Oil and Energy Cooperation Agreement between Iran and China
Agreement ExplanationYears
China imported 100,000 tons of crude oil from Iran per annum1960s
China imported 200,000 tons crude oil from Iran1976
China imported 300,000 tons crude oil from Iran1977
China imported 7.35 million metric tons of crude oil from Iran1999
China helped Iran in upgrading three oil refineries, tapping into oil
reserves in the Caspian Sea
2000
NITC1 ordered five giant oil tankers from the CSIC
22000
An agreement to exploit the Zavaran-Kashan oil block 2001
An agreement worth $150 million to upgrade two NIOC3 refineries 2001
China signed a 25-year deal to import 110 million tons of LNG4 from Iran2004
1.National Iranian Tanker Company 2. China Shipbuilding Industry Corporation 3. National Iranian Oil Company 4. Liquefied Natural Gas
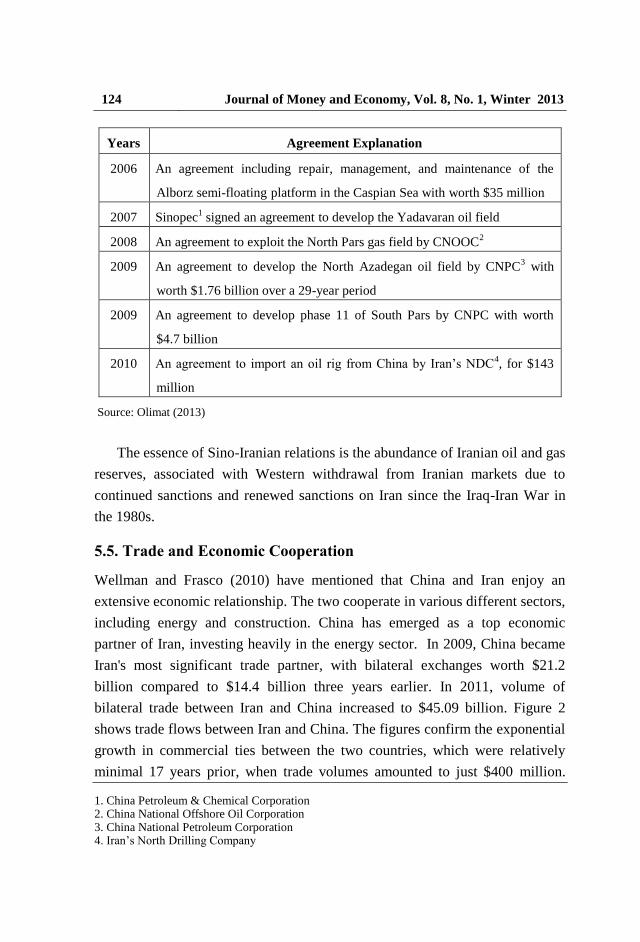
124 Journal of Money and Economy, Vol. 8, No. 1, Winter 2013
Agreement ExplanationYears
An agreement including repair, management, and maintenance of the
Alborz semi-floating platform in the Caspian Sea with worth $35 million
2006
Sinopec1 signed an agreement to develop the Yadavaran oil field 2007
An agreement to exploit the North Pars gas field by CNOOC2
2008
An agreement to develop the North Azadegan oil field by CNPC3 with
worth $1.76 billion over a 29-year period
2009
An agreement to develop phase 11 of South Pars by CNPC with worth
$4.7 billion
2009
An agreement to import an oil rig from China by Iran’s NDC4, for $143
million
2010
Source: Olimat (2013)
The essence of Sino-Iranian relations is the abundance of Iranian oil and gas
reserves, associated with Western withdrawal from Iranian markets due to
continued sanctions and renewed sanctions on Iran since the Iraq-Iran War in
the 1980s.
5.5. Trade and Economic Cooperation
Wellman and Frasco (2010) have mentioned that China and Iran enjoy an
extensive economic relationship. The two cooperate in various different sectors,
including energy and construction. China has emerged as a top economic
partner of Iran, investing heavily in the energy sector. In 2009, China became
Iran's most significant trade partner, with bilateral exchanges worth $21.2
billion compared to $14.4 billion three years earlier. In 2011, volume of
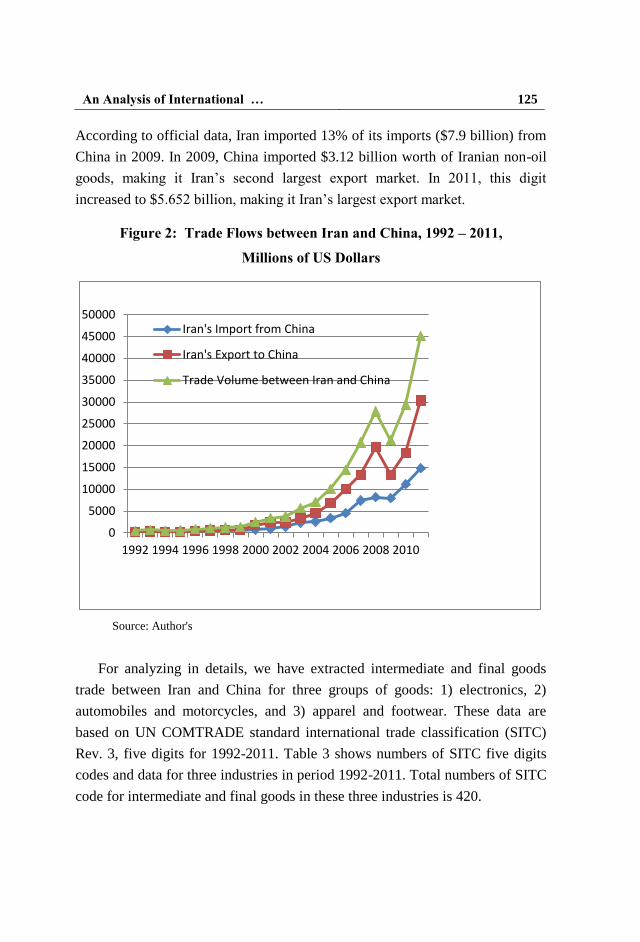
bilateral trade between Iran and China increased to $45.09 billion. Figure 2
shows trade flows between Iran and China. The figures confirm the exponential
growth in commercial ties between the two countries, which were relatively
minimal 17 years prior, when trade volumes amounted to just $400 million.
1. China Petroleum & Chemical Corporation 2. China National Offshore Oil Corporation 3. China National Petroleum Corporation 4. Iran’s North Drilling Company
An Analysis of International … 125
According to official data, Iran imported 13% of its imports ($7.9 billion) from
China in 2009. In 2009, China imported $3.12 billion worth of Iranian non-oil
goods, making it Iran’s second largest export market. In 2011, this digit
increased to $5.652 billion, making it Iran’s largest export market.
Figure 2: Trade Flows between Iran and China, 1992 – 2011,
Millions of US Dollars
Source: Author's
For analyzing in details, we have extracted intermediate and final goods
trade between Iran and China for three groups of goods: 1) electronics, 2)
automobiles and motorcycles, and 3) apparel and footwear. These data are
based on UN COMTRADE standard international trade classification (SITC)
Rev. 3, five digits for 1992-2011. Table 3 shows numbers of SITC five digits
codes and data for three industries in period 1992-2011. Total numbers of SITC
code for intermediate and final goods in these three industries is 420.
0
5000
10000
15000
20000
25000
30000
35000
40000
45000
50000
1992 1994 1996 1998 2000 2002 2004 2006 2008 2010
Iran's Import from China
Iran's Export to China
Trade Volume between Iran and China
126 Journal of Money and Economy, Vol. 8, No. 1, Winter 2013
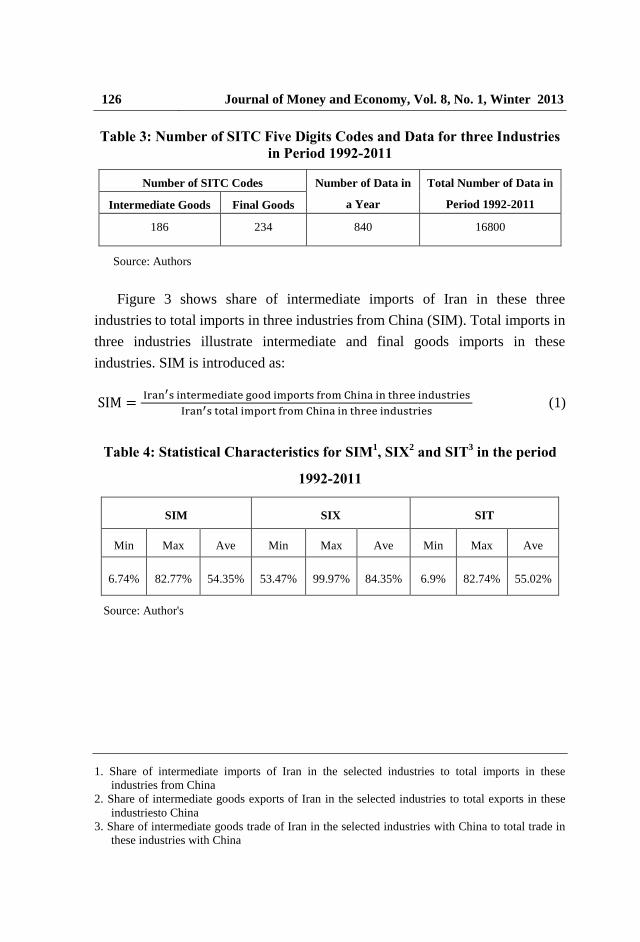
Table 3: Number of SITC Five Digits Codes and Data for three Industries
in Period 1992-2011
Number of SITC Codes Number of Data in
a Year
Total Number of Data in
Period 1992-2011 Intermediate Goods Final Goods
186 234 840 16800
Source: Authors
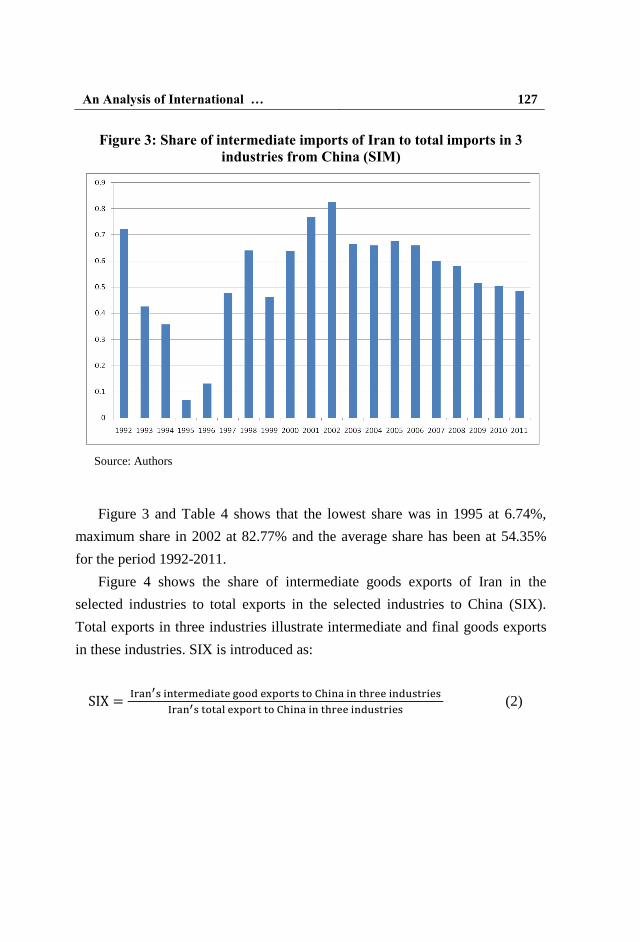
Figure 3 shows share of intermediate imports of Iran in these three
industries to total imports in three industries from China (SIM). Total imports in
three industries illustrate intermediate and final goods imports in these
industries. SIM is introduced as:
(1)
Table 4: Statistical Characteristics for SIM1, SIX
2 and SIT
3 in the period
1992-2011
SIM SIX SIT
Min Max Ave Min Max Ave Min Max Ave
6.74% 82.77% 54.35% 53.47% 99.97% 84.35% 6.9% 82.74% 55.02%
Source: Author's
1. Share of intermediate imports of Iran in the selected industries to total imports in these
industries from China
2. Share of intermediate goods exports of Iran in the selected industries to total exports in these
industriesto China
3. Share of intermediate goods trade of Iran in the selected industries with China to total trade in
these industries with China
An Analysis of International … 127
Figure 3: Share of intermediate imports of Iran to total imports in 3
industries from China (SIM)
Source: Authors
Figure 3 and Table 4 shows that the lowest share was in 1995 at 6.74%,
maximum share in 2002 at 82.77% and the average share has been at 54.35%
for the period 1992-2011.
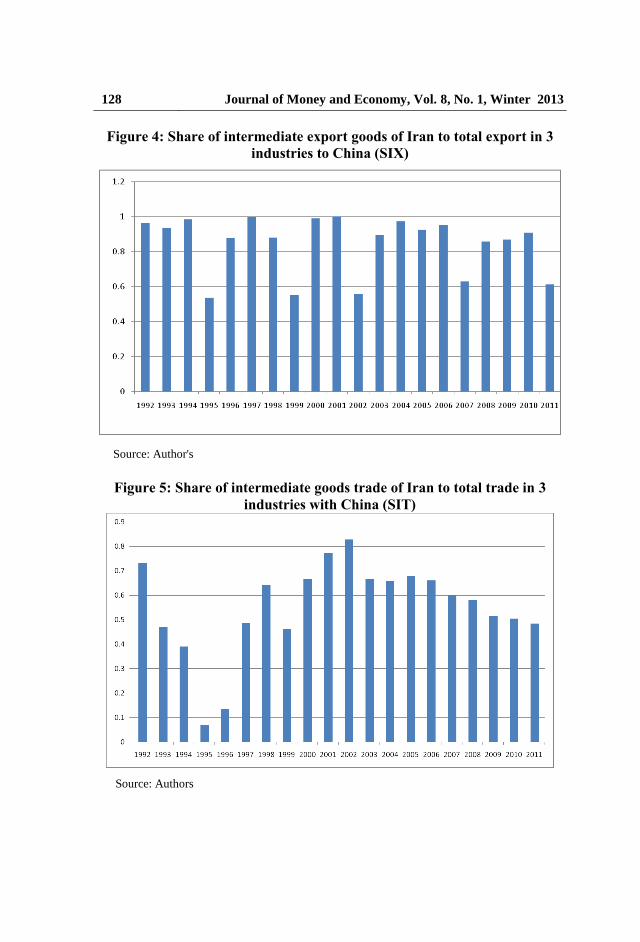
Figure 4 shows the share of intermediate goods exports of Iran in the
selected industries to total exports in the selected industries to China (SIX).
Total exports in three industries illustrate intermediate and final goods exports
in these industries. SIX is introduced as:
(2)
128 Journal of Money and Economy, Vol. 8, No. 1, Winter 2013
Figure 4: Share of intermediate export goods of Iran to total export in 3
industries to China (SIX)
Source: Author's
Figure 5: Share of intermediate goods trade of Iran to total trade in 3
industries with China (SIT)
Source: Authors
An Analysis of International … 129
Figure 4 and Table 4 show that the lowest share is in 1995 at 53.47%,
maximum share is in 2001 at 99.97 and the average share has been at 84.35%
for the period 1992-2011.
Figure 5 shows the share of intermediate goods trade of Iran in three
industries with China to total trade in three industries with China (SIT). SIT is
defined as follows:
(3)
Figure 5 and Table 4 show that the lowest share (SIT) was in 1995 at 6.9%,
maximum share in 2002 at 82.74% and the average share at 55.02% for
1992-2011.
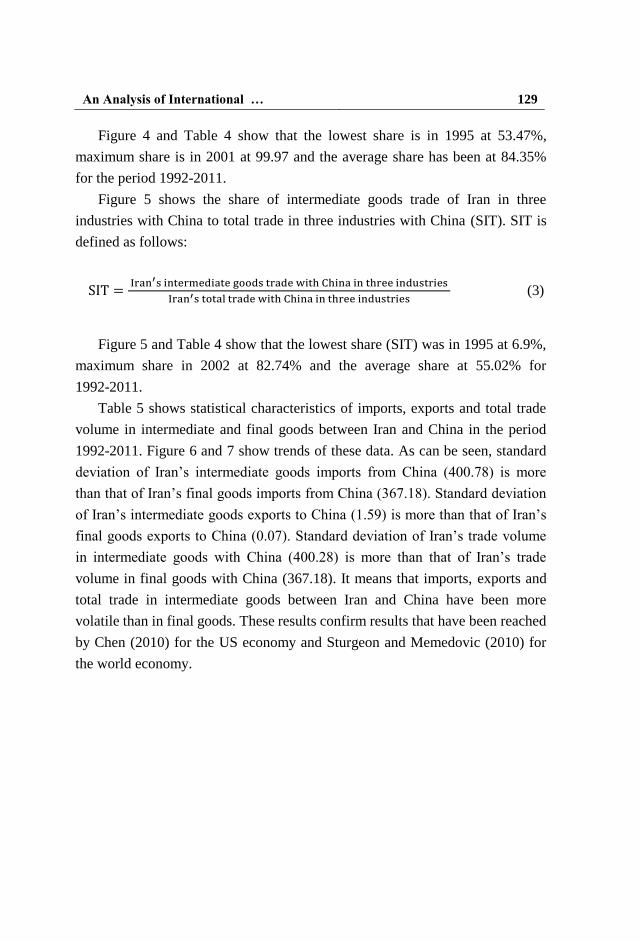
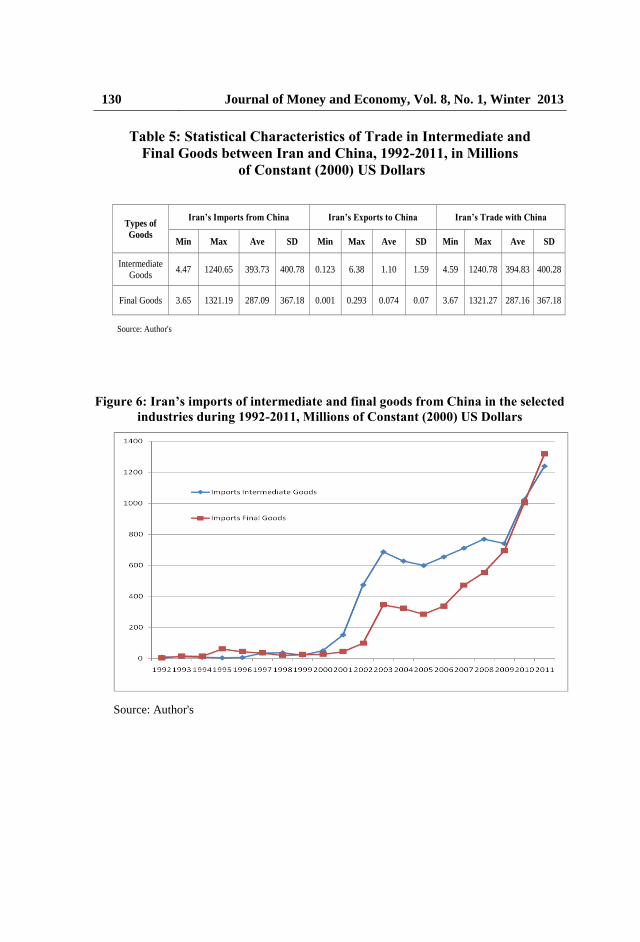
Table 5 shows statistical characteristics of imports, exports and total trade
volume in intermediate and final goods between Iran and China in the period
1992-2011. Figure 6 and 7 show trends of these data. As can be seen, standard
deviation of Iran’s intermediate goods imports from China (400.78) is more
than that of Iran’s final goods imports from China (367.18). Standard deviation
of Iran’s intermediate goods exports to China (1.59) is more than that of Iran’s
final goods exports to China (0.07). Standard deviation of Iran’s trade volume
in intermediate goods with China (400.28) is more than that of Iran’s trade
volume in final goods with China (367.18). It means that imports, exports and
total trade in intermediate goods between Iran and China have been more
volatile than in final goods. These results confirm results that have been reached
by Chen (2010) for the US economy and Sturgeon and Memedovic (2010) for
the world economy.
130 Journal of Money and Economy, Vol. 8, No. 1, Winter 2013
Table 5: Statistical Characteristics of Trade in Intermediate and
Final Goods between Iran and China, 1992-2011, in Millions
of Constant (2000) US Dollars
Figure 6: Iran’s imports of intermediate and final goods from China in the selected
industries during 1992-2011, Millions of Constant (2000) US Dollars
Source: Author's
Types of
Goods
Iran’s Imports from China Iran’s Exports to China Iran’s Trade with China
Min Max Ave SD Min Max Ave SD Min Max Ave SD
Intermediate
Goods 4.47 1240.65 393.73 400.78 0.123 6.38 1.10 1.59 4.59 1240.78 394.83 400.28
Final Goods 3.65 1321.19 287.09 367.18 0.001 0.293 0.074 0.07 3.67 1321.27 287.16 367.18
Source: Author's
An Analysis of International … 131
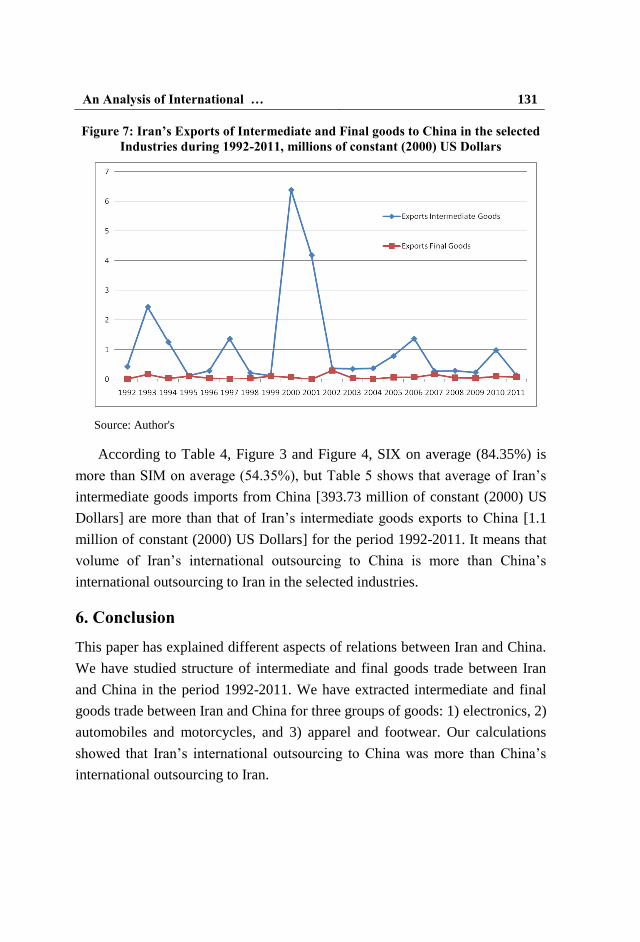
Figure 7: Iran’s Exports of Intermediate and Final goods to China in the selected
Industries during 1992-2011, millions of constant (2000) US Dollars
Source: Author's
According to Table 4, Figure 3 and Figure 4, SIX on average (84.35%) is
more than SIM on average (54.35%), but Table 5 shows that average of Iran’s
intermediate goods imports from China [393.73 million of constant (2000) US
Dollars] are more than that of Iran’s intermediate goods exports to China [1.1
million of constant (2000) US Dollars] for the period 1992-2011. It means that
volume of Iran’s international outsourcing to China is more than China’s
international outsourcing to Iran in the selected industries.
6. Conclusion
This paper has explained different aspects of relations between Iran and China.
We have studied structure of intermediate and final goods trade between Iran
and China in the period 1992-2011. We have extracted intermediate and final
goods trade between Iran and China for three groups of goods: 1) electronics, 2)
automobiles and motorcycles, and 3) apparel and footwear. Our calculations
showed that Iran’s international outsourcing to China was more than China’s
international outsourcing to Iran.
132 Journal of Money and Economy, Vol. 8, No. 1, Winter 2013
Empirical results confirmed that imports and exports in intermediate goods
between Iran and China have been more volatile than in final goods. These
results also confirmed those findings that have been found by Chen (2010) for
the US economy and Sturgeon and Memedovic (2010) for the world economy.
The implication is that economic situation can be affected more volatility
through fluctuation in intermediate trade from the main trading partners.
An Analysis of International … 133
References
Aghion, P. and P. Howitt, (1992). "A Model of Growth through Creative
Destruction", Econometrica, 60(2), 323-351.
Ando, M. & F. Kimura, (2005). "The formation of international production and
distribution networks in East Asia". In T. Ito and A. Rose (Eds.), International
trade, NBER-East Asia seminar on economics, volume 14, Chicago: The
University of Chicago Press. First version, NBER. Working Paper 10167.
Antràs, P. & E. Helpman, (2004). "Global sourcing". Journal of Political
Economics, 112(3), 552–580.
Antweiler, W. & D. Trefler, (2002). "Increasing Returns and All That: A View
from Trade". American Economic Review, 92, 93-119.
Arndt, S. W. (1998a). Globalization and the Gains from Trade. In K. Jaeger and
K. J. Koch, eds. Trade, Growth and Economic Policy in Open Economies. New
York: Springer-Verlag.
Arndt, S. W. (1998b). "Super-specialization and the Gains from Trade".
Contemporary Economic Policy, 16, 480-85.
Arndt, S. W. & H. Kierzkowski. eds., (2001). Fragmentation: New Production
and Trade Patterns in the World Economy. Oxford: Oxford University Press.
Bachmann, R. & S. Braun, (2011). "The Impact of International Outsourcing on
Labour Market Dynamics in Germany". Scottish Journal of Political Economy,
Vol. 58, No. 1
Baldwin, C. & K. Clark, (2000). Design Rules; Unleashing the Power of
Modularity. Cambridge, MA: MIT Press.
Bernard, A.; J. Jensen, J. Bradford; and P. Schott, (2006). "Survival of the
Best Fit: Exposure to Low-Wage Countries and the (Uneven) Growth of
U.S. Manufacturing Plants." Journal of International Economics. January,
68:1, 219-237.
134 Journal of Money and Economy, Vol. 8, No. 1, Winter 2013
Breznitz, D. and M. Murphree, (2011). Run of the Red Queen: Government,
Innovation, Globalization, and Economic Growth in China. New Haven, CT:
Yale University Press.
Chen, P. (2010). "Trade Volatility and Intermediate Goods". Working Paper.
University of Minnesota.
Coe, D. T. & E. Helpman, (1995). "International R&D Spillovers". European
Economic Review, 39(5), 859-87.
Coe, D. T, E. Helpman & A. W. Hoffmaister, (1997). "North-South R&D
Spillovers". The Economic Journal, 107 (439), 134-49.
Dallas, F. (2002). "Maquiladora Industry: Past, Present and Future". Federal
Reserve Bank of Dallas. El Paso Branch. Issue No. 2.
Dittmer, L. & Yu. G. T., (2010). China, the Developing World, and the New
Global Dynamic, Lynne Rienner Publishers, Boulder, Co, p. 164.
Drucker, P. (1977). "The Rise of Production Sharing". Wall Street Journal.
March 15.
Elwell, C. K. (2005). "Foreign Outsourcing: Economic Implications and Policy
Responses". Federal Publications. Paper 263
Escaith, H., L. Nannette & S. Miroudot, (2010). "International Supply Chains
and Trade Elasticity in Times of Global Crisis". Economic Research and
Statistics, World Trade Organization, January 30.
Falk, M (2012). "International Outsourcing and Productivity Growth". Review
of Economics and Institutions. Vol. 3, No 1.
Feenstra, R. C. & G. H. Hanson, (1996). "Globalization, outsourcing, and wage
inequality". American Economic Review, 86, 240–245.
Feenstra, R. C. (1998). "Integration of Trade and Disintegration of Production
in the Global Economy". Journal of Economic Perspectives, 12, 31–50.
Feenstra, R. C. & A. M. Taylor, (2011). International Economics. Second
Edition. Worth Publishers.
An Analysis of International … 135
Feenstra, R. C. (2004). Advanced International Trade: Theory and Evidence.
Princeton University Press. Princeton.
Gamberoni, E., R. Lanz & R. Piermartini (2010). "Timeliness and Contract
Enforceability in Intermediate Goods Trade". Working Paper
ERSD-2010-14.
Glass, A. & K. Saggi, (2001). "Innovation and wage effects of international
outsourcing". European Economic Review 45, 67-86.
Goldberg P., A. Khandelwal, N. Pavcnik & P. Topalova, (2008). "Imported
Intermediate Inputs and Domestic Product Growth: Evidence from India", Asian
and Pacific Department, IMF, October.
Grossman, G. M. & E. Helpman, (1991). Innovation and Growth in the Global
Economy, the MIT Press, Cambridge MA.
Grossman, G. M. & E. Helpman, (2005). "Outsourcing in a Global Economy".
Review of Economic Studies, 72(1): 135–59.
Hameed, R. (2010). "Sino-Iranian Relations Current Developments and Future
Scenario". Policy Perspective, Vol. 7, No. 2, January-June 2010, p. 10.
Harris, R. G. (1995). "Trade and Communication Costs". Canadian Journal of
Economics, 28, 46–75.
Hummels, D., J. Ishi, & Yi, K. M. (2001)."The Nature and Growth of Vertical
Specialization in World Trade". Journal of International Economics, 54, 75-96.
Humphrey, J. & H.S. Hubert, (2002). "How Does Insertion in Global
Value Chains Affect Upgrading in Industrial Clusters?" Regional Studies
36 (9), 1017-27.
Jones, R. W. & H. Kierzkowski, (1990). "The Role of Services in Production
and International Trade: a Theoretical Framework." In Ronald W. Jones and
Anne O. Krueger (eds.), the Political Economy of International Trade, Oxford:
Basil Blackwell, 31–48.
136 Journal of Money and Economy, Vol. 8, No. 1, Winter 2013
Jones, R. and H. Kierzkowski, (2000). Money, Factor Mobility, and Trade.
Cambridge. MIT Press. Chapter: Globalization and the consequences of
international fragmentation, pp. 365–383.
Jones, R. W. (2000). Globalization and the Theory of Input Trade. Cambridge:
MIT Press.
Karimi, M. S. & Z. Yusop, (2009). "FDI and Economic Growth in Malaysia".
Munich Personal RePEc Archive. Online at http://mpra.ub.uni-muenchen.
de/14999
Katz, L. F. & K. M. Murphy, (1992). "Changes in Relative Wages, 1963-1987:
Supply and Demand Factors". Quarterly Journal of Economics, 107, 35-78.
Keller, W. (2000). "Do Trade Patterns and Technology Flows Affect
Productivity Growth?" The World Bank Economic Review, 14 (1), 17-47.
Keller, W. (2004). "International Technology Diffusion". Journal of Economic
Literature, 42 (3), 752-82.
Kemp, G. (2010). The East Moves West: India, China, and the Asia’s Growing
Presence in the Middle East, Brookings Institute, Washington, DC, p. 77.
Ketels, C. & O. Memedovic, (2008). "From Clusters to Cluster-Based
Economic Development". International Journal of Technological Learning,
Innovation, and Development, Vol. 1, No. 3, pp. 375-392.
Kimura, F. & M. Ando, (2005). "Two-Dimensional Fragmentation in East Asia:
Conceptual Framework and Empirics". International Review of Economics and
Finance, V.14-#3, pp. 317-348.
Kohler, W. (2004). "Aspects of International Fragmentation". Review of
International Economics, 12(5), 793-816.
Krugman, P. R. (1995). "Growing World Trade: Causes and Consequences".
Brooking Paper on Economic Activity, 1, 327-62.
Lall, S. (2000). "The technological structure and performance of developing
country manufactured exports, 1985-98", Oxford Development Studies, 28(3),
pp. 337-369.
An Analysis of International … 137
Langdon, D.; R. Krantz, & M. Strople, (2004). "A visual essay: Post-recession
trends in nonfarm employment and related economic indicators". Monthly
Labor Review, US Bureau of Labor Statistics, Sept, 49-56.
Langlois, R., & P. Robertson, (1995). Firms, Markets and Economic Change.
London: Routledge.
Leamer. E. E. (1996). "The Effects of Trade in Services, Technology Transfer,
and Delocalisation on Local and Global Income Inequality". Asia-Pacific
Economic Review, 2, 44-60.
Marjit, S. & R. Acharyya, (2003). International Trade, Wage Inequality, and
the Developing Economy: A General Equilibrium Approach. Heidelberg:
PhysicaVerlag.
Markusen, J. R. (2002). Multinational Firms and the Theory of International
Trade. Cambridge. MA: MIT Press.
Meshcheryakova, Y. (2005). "Macroeconomic Effects of International
Outsourcing". PHD Dissertation of Economocs. Evanston. Illinois.
Miroudot, S. R. Lanz, and A. Ragoussis, (2009). "Trade in intermediate goods
and services". OECD Trade Policy Working Paper No. 93, November 3, from:
http://www.oecd.org/dataoecd/47/14/44437205.pdf
Olimat, M. S. (2013). China and the Middle East: From Silk Road to Arab
Spring. Routledge Press. New York. USA.
Prencipe, A., D. Andrew & M. Hobday, (2003). The Business of Systems
Integration. Oxford: Oxford University Press.
Richardson, G. (1972). "The Organization of Industry". The Economic Journal.
84: 883-96.
Romer, Paul M. (1987). "Growth Based on Increasing Returns Due to
Specialization". American Economic Review, 77(2), pp. 56-62.
Shephard, B. & M. Haddad, (2011). "Managing Openness: Trade and Outward-
oriented Growth after the Crisis'. The World Bank. Washington DC.
138 Journal of Money and Economy, Vol. 8, No. 1, Winter 2013
Smith, A. (1993) [1776]: An Inquiry into the Nature and Causes of the Wealth
of Nations. Oxford: Oxford University Press.
Sturgeon, T. (2002). Modular Production Networks. A New American Model of
Industrial Organization. Industrial and Corporate Change. 11(3):451-496.
Sturgeon, T. (2003). "Exploring the Risks of Value Chain Modularity:
Electronics Outsourcing During the Industry Cycle of 2001-2002". MIT IPC
Working Paper 03-002. May.
Sturgeon, T.; with F. Levy, C. Brown, J. Bradford Jensen, & D. Weil, (2006).
"Why We Can't Measure the Economic Effects of Services Offshoring: The
Data Gaps and How to Fill Them'. Final Report from the MIT Industrial
Performance Center's Services Offshoring Working Group, September. MIT
Industrial Performance Center working paper 06-006.
Sturgeon, T. & G. Gereffi, (2010). Measuring Success in the Global Economy:
Technological Learning, Industrial Upgrading, and Business Function
Outsourcing in Global Value Chains. Transnational Corporations, 17:4.
Sturgeon, T. & O. Memedovic, (2011). Mapping Global Value Chains:
Intermediate Goods Trade and Structural Change in the World Economy.
Working paper. UNIDO.
Tempest, R. (1996). "Barbie and the World Economy". Los Angeles Times, 22
September, A1 and A12.
Urata, S. (2001). Emergence of FDI-trade nexus an economic growth in East
Asia. In Stiglitz and Yussuf (eds) Rethinking the East Asian Miracle, Oxford
University Press.
Veeramani, C. (2009). Impact of Imported Intermediate and Capital Goods on
Economic Growth: A Cross Country Analysis. Working paper, id 2092.
Wellman, A. F. & R. Frasco, (2010). "China- Iran Foreign Relations". Available
at: http://www.irantracker.org/foreign-relations/china-iran foreign-relations
Whittaker, D. H.; Zhu, Tianbiao; T. Sturgeon; Tsai, Mon Han; & Okita, Toshi.
(2010). "Compressed Development". Studies in Comparative International
Development. 45(4): 439-467.

An Analysis of International … 139
World Trade Organization. (1998). Annual Report 1998 (Geneva: World
Trade Organization).
Young, Allyn. (1929). "Increasing returns and economic progress". Economic
Journal, 38: 527-42.
Zorell, N. (2008). "Offshoring and Macroeconomic Volatility: A DSGE model
with endogenous offshoring". University of Tübingen.
http://comtrade.un.org/www.srpri.org