an analysis of battery electric vehicle production...
TRANSCRIPT
1
An Analysis of Battery Electric Vehicle Production Projections
By
John Shamus Cunningham
Submitted to the Department of Mechanical Engineering in Partial Fulfillment of the Requirements for the Degree of
Bachelor’s of Science in Mechanical Engineering
At the Massachusetts Institute of Technology
June 2009
© John Shamus Cunningham. All rights reserved
The author herby grants to MIT permission to reproduce and to distribute publicly paper and electronic copies of this
Thesis document in whole or in part.
Signature of the Author__________________________________________________________________ Department of Mechanical Engineering
May 11, 2009 Certified by:___________________________________________________________________________
John B. Heywood Sun Jae Professor of Mechanical Engineering
Director, Slone Automotive Lab Thesis Supervisor
Accepted by:__________________________________________________________________________
Professor John H. Lienhard V Professor of Mechanical Engineering
Chairman, Undergraduate Thesis Committee
2
Contents List of Figures ................................................................................................................................................ 3
List of Tables ................................................................................................................................................. 3
Abstract ......................................................................................................................................................... 4
Introduction .................................................................................................................................................. 5
Government Involvement in BEV Development ........................................................................................... 6
Battery Electric Vehicle Growth Projections ................................................................................................. 7
The Transition to Electric Vehicles .............................................................................................................. 10
Modeling Automotive Technology Growth Rates ...................................................................................... 11
Case Studies in Adopting New Automotive Technologies .......................................................................... 11
France’s Transition from Gasoline to Diesel ........................................................................................... 11
Growth of the American Hybrid Market ................................................................................................. 13
BEV Growth Model ..................................................................................................................................... 17
Established Automotive Manufacturers- Announced BEV Plans ............................................................ 18
Ford ..................................................................................................................................................... 18
Chrysler ............................................................................................................................................... 18
Honda .................................................................................................................................................. 19
Mitsubishi ............................................................................................................................................ 19
Nissan .................................................................................................................................................. 19
Toyota ................................................................................................................................................. 20
Mini ..................................................................................................................................................... 20
New Automotive Manufacturers- Announced BEV Plans ....................................................................... 21
Tesla Motors ....................................................................................................................................... 21
Detroit Electric .................................................................................................................................... 22
Th!nk ................................................................................................................................................... 22
Growth Rates Required to Meet Projections .............................................................................................. 24
Evaluation of Growth Rates Required to Meet 2020 Projections............................................................... 27
Works Cited ................................................................................................................................................. 28
3
List of Figures Figure 1: Sales Share of Hybrid Light-duty Vehicles by Type in Three Cases ................................................ 9
Figure 2: Exponential Growth Model .......................................................................................................... 11
Figure 3: French Diesel Market Share Growth 1970-2005 ......................................................................... 12
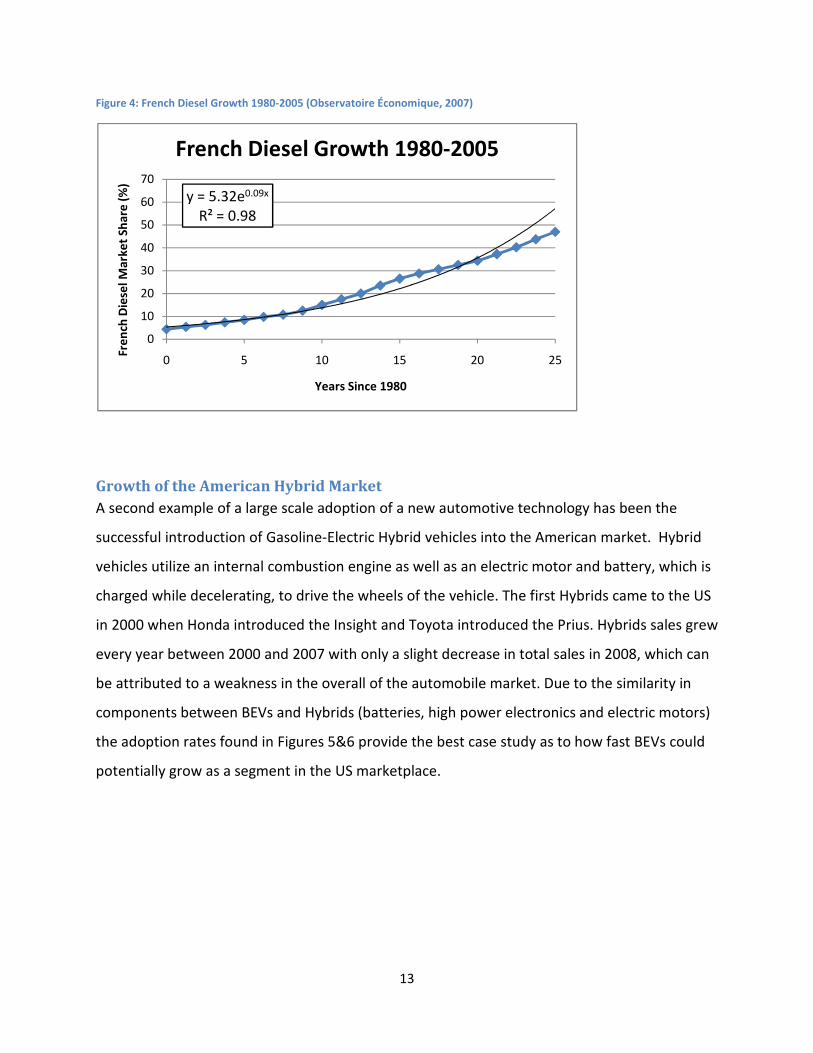
Figure 4: French Diesel Growth 1980-2005 ................................................................................................ 13
Figure 5: Total Hybrid Market Share 2000-2009 ........................................................................................ 14
Figure 6: Total Hybrid Sales 2000-2009 ...................................................................................................... 14
Figure 7: US Hybrid Monthly Sales & Average US Monthly Gasoline Prices............................................... 15
Figure 8: Yearly Hybrid Sales by Model....................................................................................................... 16
Figure 9 : Summary of Near Term EV Production Based Upon Corporate Press Releases ......................... 23
Figure 10: BEV Projections - 2500 Initial Sales in 2010 ............................................................................... 25
Figure 11: BEV Projections - 5000 Initial Sales in 2010 ............................................................................... 25
Figure 12: BEV Projections - 10,000 Initial Sales ......................................................................................... 26
Figure 13: BEV Projections - 20,000 Initial Sales ......................................................................................... 26
List of Tables Table 1: BCG 2020 North American Sales Projections .................................................................................. 8
Table 2: Deutsche Bank 2015-2020 BEV Projections .................................................................................... 9
4
An Analysis of Battery Electric Vehicle Production Projections
By
John Shamus Cunningham
Submitted to the Department of Mechanical Engineering in
Partial Fulfillment of the Requirements for the Degree of
Bachelor’s of Science in Mechanical Engineering
Abstract
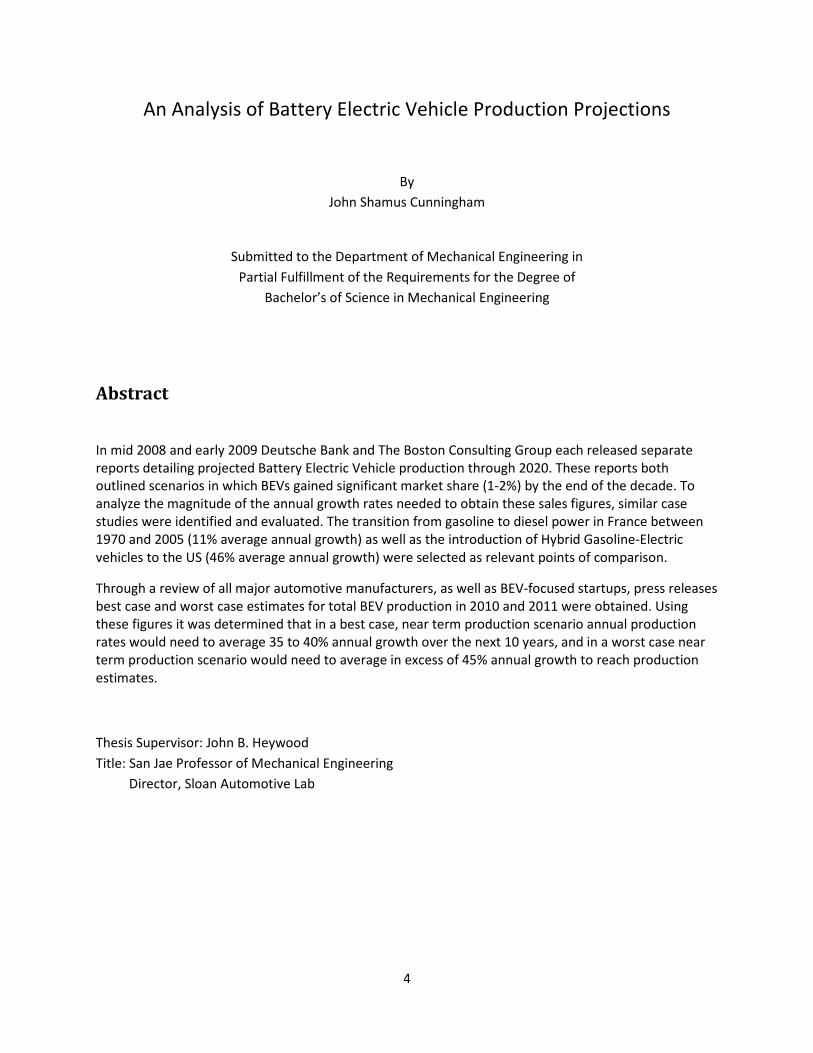
In mid 2008 and early 2009 Deutsche Bank and The Boston Consulting Group each released separate reports detailing projected Battery Electric Vehicle production through 2020. These reports both outlined scenarios in which BEVs gained significant market share (1-2%) by the end of the decade. To analyze the magnitude of the annual growth rates needed to obtain these sales figures, similar case studies were identified and evaluated. The transition from gasoline to diesel power in France between 1970 and 2005 (11% average annual growth) as well as the introduction of Hybrid Gasoline-Electric vehicles to the US (46% average annual growth) were selected as relevant points of comparison.
Through a review of all major automotive manufacturers, as well as BEV-focused startups, press releases best case and worst case estimates for total BEV production in 2010 and 2011 were obtained. Using these figures it was determined that in a best case, near term production scenario annual production rates would need to average 35 to 40% annual growth over the next 10 years, and in a worst case near term production scenario would need to average in excess of 45% annual growth to reach production estimates.
Thesis Supervisor: John B. Heywood
Title: San Jae Professor of Mechanical Engineering
Director, Sloan Automotive Lab
5
Introduction
Recent increases in transportation fuel prices and the growing importance of reducing carbon
dioxide emissions has led the auto industry and world governments to reexamine the role of
Battery Electric Vehicles (BEVs) in the world automotive marketplace. The introduction of new
battery technology, particularly the advancement of Lithium-Ion batteries, has greatly
improved the energy density of the battery stacks and excited both automotive designers and
executives. This excitement was displayed when nine BEV concepts were debuted to the public
at the 2009 North American International Auto Show, a record high. Despite the coverage and
enthusiasm expressed in the media, and government and press releases of the major
automotive manufacturers, less than a thousand BEVs will be sold in 2009. These sales will
represent less than 0.01% of total US light duty vehicle sales. In order for BEVs to make a
significant impact on US carbon dioxide emissions and US dependence on foreign oil sources,
BEV sales must comprise a much larger percentage of new vehicle sales.
Existing projections released by both the Boston Consulting Group and Deutsche Bank predict
pure electric vehicles to encompass 1 to 5 % of North American auto sales by 2020 depending
on government regulation decisions and global energy prices. This growth requires the sale of
an estimated 200,000 to 1 Million BEVs by 2020. Battery Electric Vehicle sales also represent a
portion of the Obama administration’s stated goal of placing 1 Million “Plug-In” capable cars
(BEVs and Plug-in Hybrid Electric Vehicles) on the road by 2015. The growth rates necessary to
reach 2020 BEV production levels will be evaluated relative to historical data on automotive
technology adoption rates. The French transition to diesel powered light duty vehicles and the
American adoption of Hybrid technology over the past decade will be used as points of
comparison to the BEV projected growth rates.
6
Government Involvement in BEV Development
The Obama administration and governments around the world are seeking to push the
advancement of alternative powertrain technologies. As part of the 2009 US Economic Stimulus
Package, the government has allocated $2 Billion in grants for the development of advanced
automotive battery technologies in order to benefit Hybrid, Plug-In Hybrid and BEVs, as well as
$400 Million for “transportation electrification demonstration and deployment projects”.
Finally, in addition to government sponsorship of technological research, the administration has
provided individual incentives for purchasing a PHEV or BEV by offering a $7,500 tax credit for
the first 200,000 families who do so (Obama 2009).
Internationally, governments are also encouraging electric vehicle adoption through specific tax
breaks and infrastructure construction projects. Israel has teamed with Silicon Valley startup
Better Place and Nissan/Renault to build a nationwide charging and battery swap infrastructure
capable of handling 100,000 BEVs and PHEVs by 2011. The Israeli government has agreed to
incentivize BEV purchases by reducing the automotive tax from 78% to 10% for electric
vehicles. Sales to the public through Better Place will begin in 2010 and must increase very
quickly to meet their sales targets. Israel was identified by the EV startup as valuable partner
and testing ground because 90% of its citizens drive less than 70km per day and all major urban
centers are within 150km of one another. Thus, the vast majority of Better Place’s customers
will be able to meet their needs with the help of the planned 500,000 charging spots. Israel is
also extremely sensitive to national energy security and thus is highly receptive to plans which
will reduce petroleum imports. Better Place has similar infrastructure agreements in Denmark,
Australia, California, Hawaii and Ontario, Canada (Roth 2008, 6).
7
Battery Electric Vehicle Growth Projections
Projections of US BEV growth have been popular with American media sources but their
predictions have remained highly variable due to both gasoline price volatility and the dramatic
decrease in automotive sales in 2008 and the early part of 2009. Two main public reports have
been issued which project large numbers of BEVs being sold in the next ten years. The widely
cited January 2009 Boston Consulting Group report “The Comeback of the Electric Car?: How
Real, How Soon, and What Must Happen Next” details three scenarios for electric car
production levels in the year 2020. The market slowdown projection (Scenario 1) describes a
situation in which oil remains at low levels ($60 per barrel range), concern over climate change
diminishes at the national and individual level, and the automotive industry is not seen as a
root cause of global warming. In this scenario BEV and PHEV production fail to reach 1% market
penetration and hybrid sales plateau at 18%. BCG’s Scenario 2 outlines a steady pace of
alternative automotive powertrain development and concern over climate change
intensification, resulting in increased tax incentives to reduce CO2 emissions and oil prices
returning to the $150 per barrel levels of mid 2008. In this steady pace scenario BCG projects
2% market penetration for EVs in North America. Finally, in the accelerated growth Scenario 3,
CO2 emissions become an urgent issue, resulting in high levels of government regulation and
tax subsidies for CO2 reduction and oil prices rising to the $300 per barrel range. In this new
energy paradigm, BCG projects BEVs to obtain 5% penetration by 2020 in North America (Book,
et al. 2009).
8
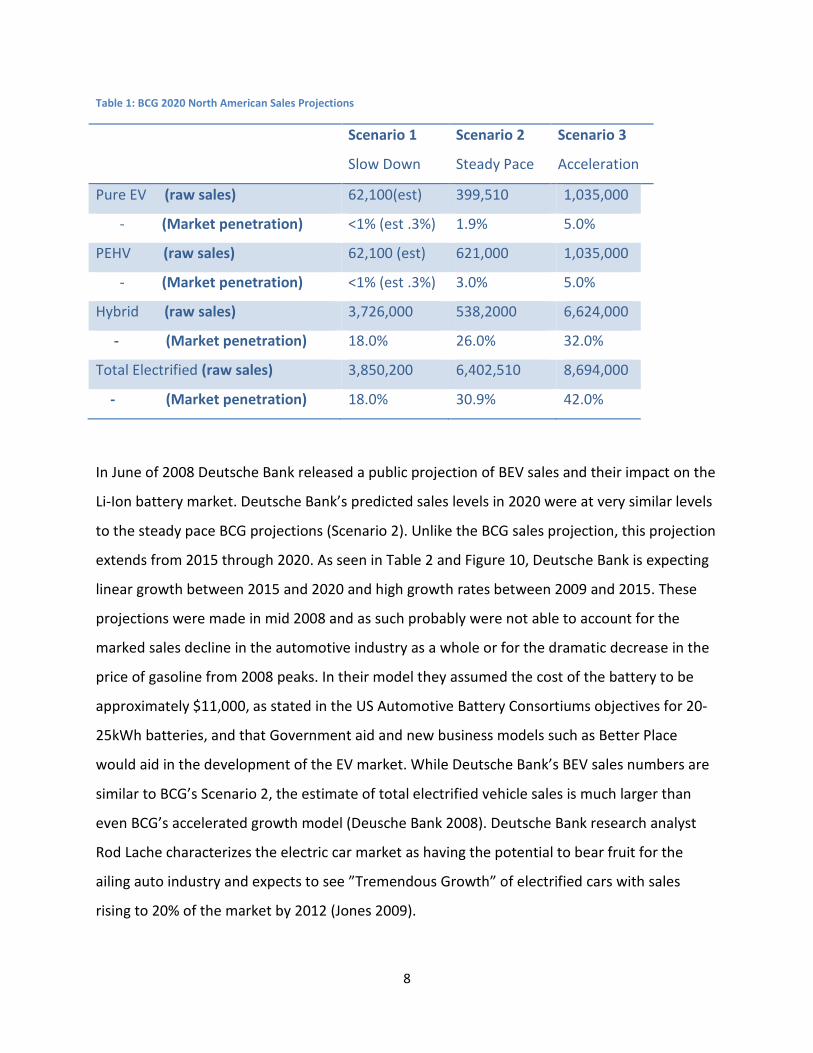
Table 1: BCG 2020 North American Sales Projections
Scenario 1
Slow Down
Scenario 2
Steady Pace
Scenario 3
Acceleration
Pure EV (raw sales) 62,100(est) 399,510 1,035,000
- (Market penetration) <1% (est .3%) 1.9% 5.0%
PEHV (raw sales) 62,100 (est) 621,000 1,035,000
- (Market penetration) <1% (est .3%) 3.0% 5.0%
Hybrid (raw sales) 3,726,000 538,2000 6,624,000
- (Market penetration) 18.0% 26.0% 32.0%
Total Electrified (raw sales) 3,850,200 6,402,510 8,694,000
- (Market penetration) 18.0% 30.9% 42.0%
In June of 2008 Deutsche Bank released a public projection of BEV sales and their impact on the
Li-Ion battery market. Deutsche Bank’s predicted sales levels in 2020 were at very similar levels
to the steady pace BCG projections (Scenario 2). Unlike the BCG sales projection, this projection
extends from 2015 through 2020. As seen in Table 2 and Figure 10, Deutsche Bank is expecting
linear growth between 2015 and 2020 and high growth rates between 2009 and 2015. These
projections were made in mid 2008 and as such probably were not able to account for the
marked sales decline in the automotive industry as a whole or for the dramatic decrease in the
price of gasoline from 2008 peaks. In their model they assumed the cost of the battery to be
approximately $11,000, as stated in the US Automotive Battery Consortiums objectives for 20-
25kWh batteries, and that Government aid and new business models such as Better Place
would aid in the development of the EV market. While Deutsche Bank’s BEV sales numbers are
similar to BCG’s Scenario 2, the estimate of total electrified vehicle sales is much larger than
even BCG’s accelerated growth model (Deusche Bank 2008). Deutsche Bank research analyst
Rod Lache characterizes the electric car market as having the potential to bear fruit for the
ailing auto industry and expects to see ”Tremendous Growth” of electrified cars with sales
rising to 20% of the market by 2012 (Jones 2009).
9
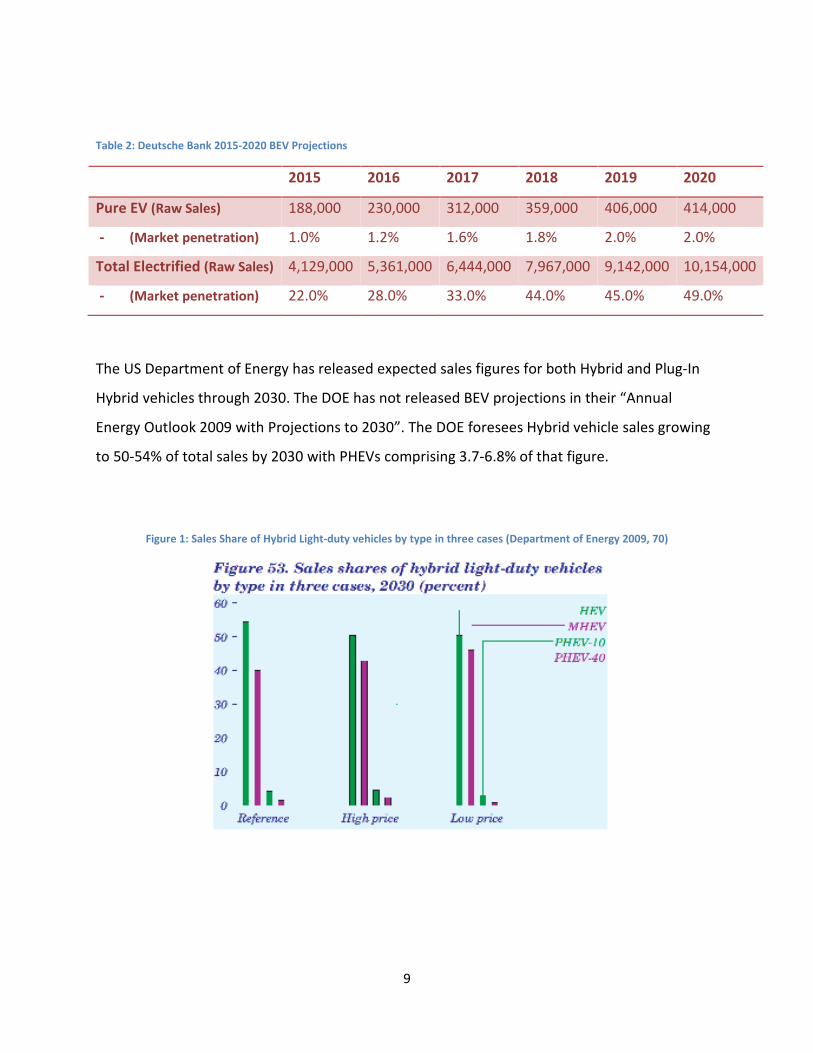
Table 2: Deutsche Bank 2015-2020 BEV Projections
2015 2016 2017 2018 2019 2020
Pure EV (Raw Sales) 188,000 230,000 312,000 359,000 406,000 414,000
- (Market penetration) 1.0% 1.2% 1.6% 1.8% 2.0% 2.0%
Total Electrified (Raw Sales) 4,129,000 5,361,000 6,444,000 7,967,000 9,142,000 10,154,000
- (Market penetration) 22.0% 28.0% 33.0% 44.0% 45.0% 49.0%
The US Department of Energy has released expected sales figures for both Hybrid and Plug-In
Hybrid vehicles through 2030. The DOE has not released BEV projections in their “Annual
Energy Outlook 2009 with Projections to 2030”. The DOE foresees Hybrid vehicle sales growing
to 50-54% of total sales by 2030 with PHEVs comprising 3.7-6.8% of that figure.
Figure 1: Sales Share of Hybrid Light-duty vehicles by type in three cases (Department of Energy 2009, 70)
10
The Transition to Electric Vehicles
The transition to pure electric vehicles will require significant advances in technology as well as
changes in driving habits and expectations by the public. Unlike Hybrid Gasoline-Electric
vehicles, BEVs will require an infrastructure of charging stations separate from the existing
gasoline distribution network. Additional planning on the part of the vehicles owners will be
required initially due to the shorter driving range and slower recharging rates of current battery
technology when compared to equivalent gasoline vehicles. While there are some drawbacks,
an electric vehicle with a 100 or 200 mile range has the potential to fit the daily lifestyle of the
vast majority of Americans. A 1990 US Department of Transportation survey found that 50% of
the public travels less than 25 miles per day and 80% drive less than 50 miles per day. This
survey also found the average trip was only 9.8 miles and that the average daily total was
32.7miles (Davis, Diegel and Boundy 2008). These relatively short average trip distances fall
well within the ranges of many proposed electric vehicles and thus would allow charging at an
individual’s home to be the only form of energy input many consumers would need.
When consumers deviate from their average driving patterns, requiring charging away from
their home, the current generation of electric cars becomes less convenient. Gasoline stations
are able to transfer an incredible amount of chemical energy from the filling station to an
individual’s car in a very short amount of time. A gallon of gasoline contains roughly 132x106
joules of energy and the EPA limits gasoline pumps to flow rates between 5 and 10 gallons per
minute. Thus a typical gasoline pump transmits between 11 – 22 Megawatts of chemical power
from the station to an individual’s automobile. Since electric automobiles are roughly three
times as efficient as their gasoline counterparts (Deusche Bank 2008), even using a high voltage
480 V charging station, a similar power output would require 6000 to 7000 amps. This would
place extreme stress on the electric grid as well as on a car’s battery pack and, as such, is not
currently an option. Full battery replacement, which would occur on the scale of 5-10 minutes
has also been proposed but that would require many additional industry wide standards.
Current press releases from Tesla Motors claim that even on a quick charge 480 Volt system, a
11
complete recharge of their upcoming Model S will necessitate a 45 minute stop (Tesla Motors
2009).
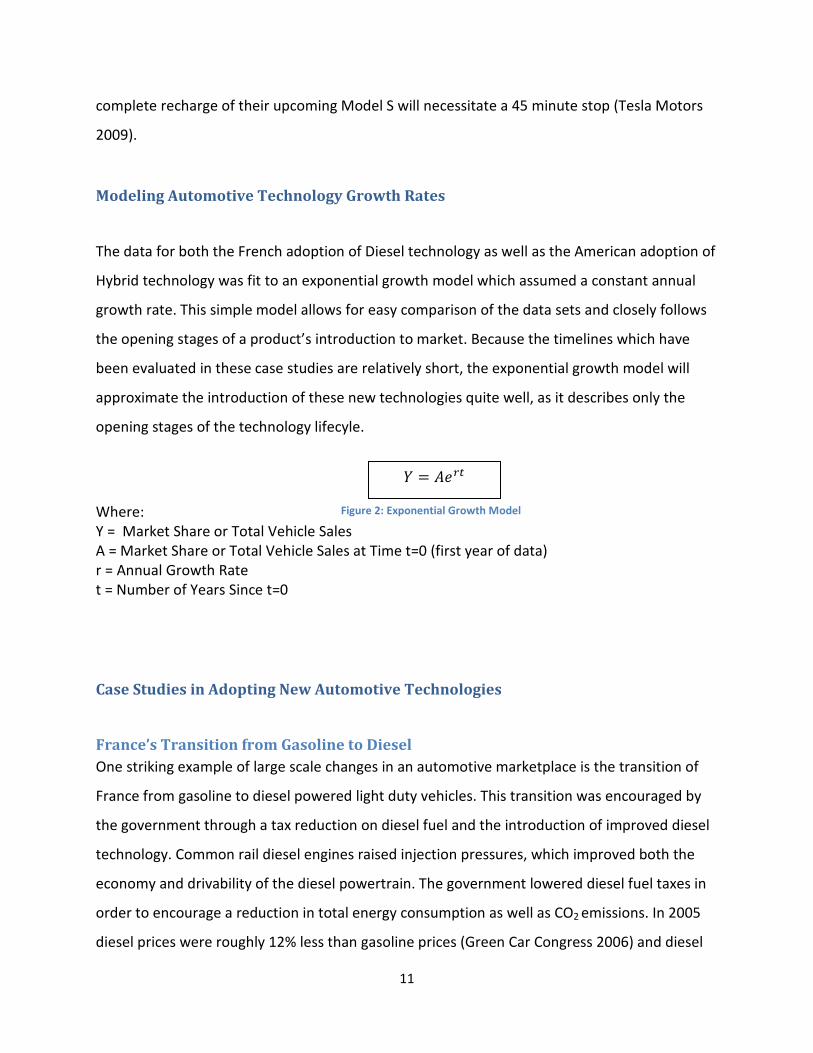
Modeling Automotive Technology Growth Rates
The data for both the French adoption of Diesel technology as well as the American adoption of
Hybrid technology was fit to an exponential growth model which assumed a constant annual
growth rate. This simple model allows for easy comparison of the data sets and closely follows
the opening stages of a product’s introduction to market. Because the timelines which have
been evaluated in these case studies are relatively short, the exponential growth model will
approximate the introduction of these new technologies quite well, as it describes only the
opening stages of the technology lifecyle.
Where: Y = Market Share or Total Vehicle Sales A = Market Share or Total Vehicle Sales at Time t=0 (first year of data) r = Annual Growth Rate t = Number of Years Since t=0
Case Studies in Adopting New Automotive Technologies
France’s Transition from Gasoline to Diesel
One striking example of large scale changes in an automotive marketplace is the transition of
France from gasoline to diesel powered light duty vehicles. This transition was encouraged by
the government through a tax reduction on diesel fuel and the introduction of improved diesel
technology. Common rail diesel engines raised injection pressures, which improved both the
economy and drivability of the diesel powertrain. The government lowered diesel fuel taxes in
order to encourage a reduction in total energy consumption as well as CO2 emissions. In 2005
diesel prices were roughly 12% less than gasoline prices (Green Car Congress 2006) and diesel
Figure 2: Exponential Growth Model
� � ����
12
engines have maintained a 30-35% efficiency gain over similar gas models in this period. (US
Department of Energy n.d.) As a result of these two changes, diesel automobiles grew from 1%
of total light vehicle automotive sales in 1970 to 4.4% in 1980 and finally 47% in 2005. This
dramatic change in the automotive fleet required relatively few changes in manufacturing
processes, when compared to vehicle electrification, but did necessitate a change in the public
perception of diesel technology.
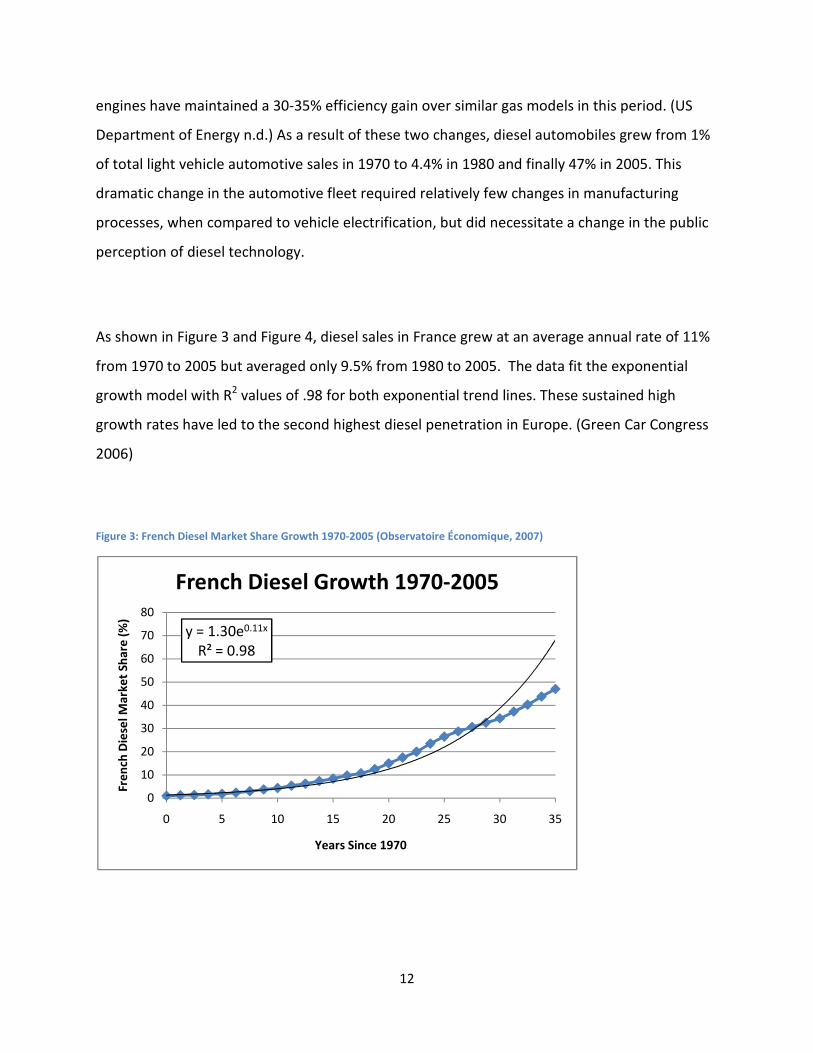
As shown in Figure 3 and Figure 4, diesel sales in France grew at an average annual rate of 11%
from 1970 to 2005 but averaged only 9.5% from 1980 to 2005. The data fit the exponential
growth model with R2 values of .98 for both exponential trend lines. These sustained high
growth rates have led to the second highest diesel penetration in Europe. (Green Car Congress
2006)
Figure 3: French Diesel Market Share Growth 1970-2005 (Observatoire Économique, 2007)
y = 1.30e0.11x
R² = 0.98
0
10
20
30
40
50
60
70
80
0 5 10 15 20 25 30 35
Fre
nch
Die
sel M
arke
t Sh
are
(%
)
Years Since 1970
French Diesel Growth 1970-2005
13
Figure 4: French Diesel Growth 1980-2005 (Observatoire Économique, 2007)
Growth of the American Hybrid Market
A second example of a large scale adoption of a new automotive technology has been the
successful introduction of Gasoline-Electric Hybrid vehicles into the American market. Hybrid
vehicles utilize an internal combustion engine as well as an electric motor and battery, which is
charged while decelerating, to drive the wheels of the vehicle. The first Hybrids came to the US
in 2000 when Honda introduced the Insight and Toyota introduced the Prius. Hybrids sales grew
every year between 2000 and 2007 with only a slight decrease in total sales in 2008, which can
be attributed to a weakness in the overall of the automobile market. Due to the similarity in
components between BEVs and Hybrids (batteries, high power electronics and electric motors)
the adoption rates found in Figures 5&6 provide the best case study as to how fast BEVs could
potentially grow as a segment in the US marketplace.
y = 5.32e0.09x
R² = 0.98
0
10
20
30
40
50
60
70
0 5 10 15 20 25
Fre
nch
Die
sel M
arke
t Sh
are
(%
)
Years Since 1980
French Diesel Growth 1980-2005
14
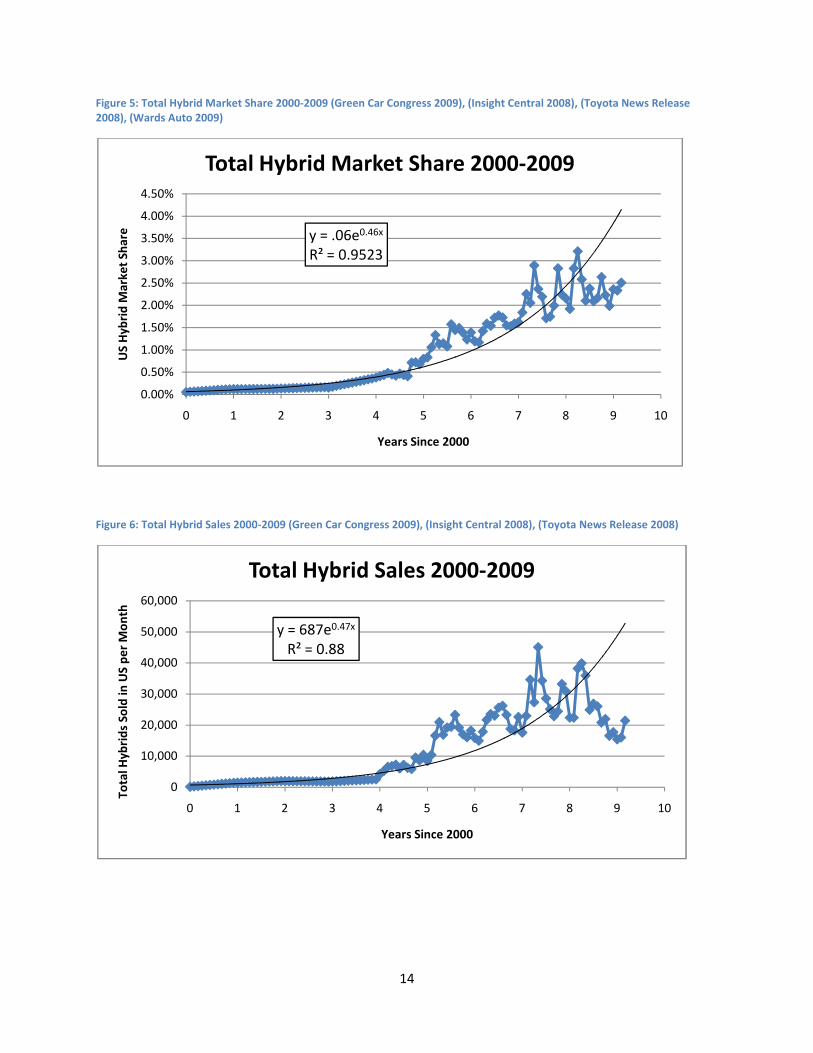
Figure 5: Total Hybrid Market Share 2000-2009 (Green Car Congress 2009), (Insight Central 2008), (Toyota News Release 2008), (Wards Auto 2009)
Figure 6: Total Hybrid Sales 2000-2009 (Green Car Congress 2009), (Insight Central 2008), (Toyota News Release 2008)
y = .06e0.46x
R² = 0.9523
0.00%
0.50%
1.00%
1.50%
2.00%
2.50%
3.00%
3.50%
4.00%
4.50%
0 1 2 3 4 5 6 7 8 9 10
US
Hyb
rid
Mar
ket
Shar
e
Years Since 2000
Total Hybrid Market Share 2000-2009
y = 687e0.47x
R² = 0.88
0
10,000
20,000
30,000
40,000
50,000
60,000
0 1 2 3 4 5 6 7 8 9 10
Tota
l Hyb
rid
s So
ld in
US
pe
r M
on
th
Years Since 2000
Total Hybrid Sales 2000-2009
15
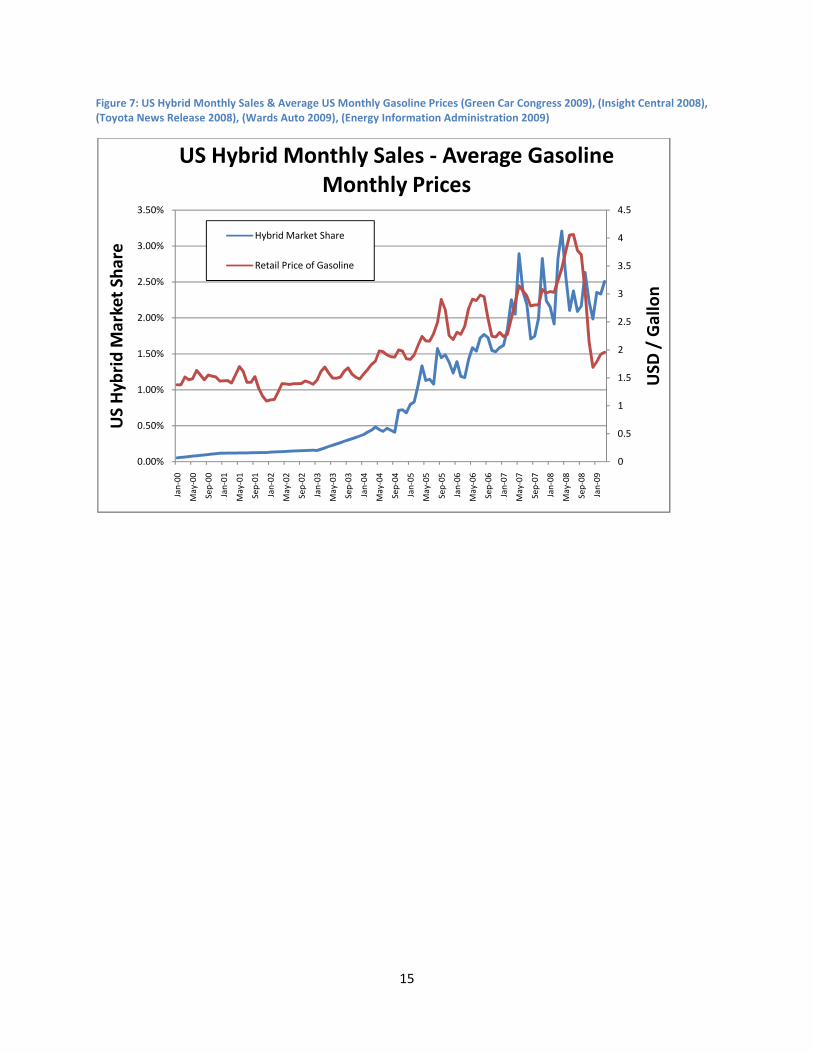
Figure 7: US Hybrid Monthly Sales & Average US Monthly Gasoline Prices (Green Car Congress 2009), (Insight Central 2008), (Toyota News Release 2008), (Wards Auto 2009), (Energy Information Administration 2009)
0
0.5
1
1.5
2
2.5
3
3.5
4
4.5
0.00%
0.50%
1.00%
1.50%
2.00%
2.50%
3.00%
3.50%
Jan
-00
May
-00
Sep
-00
Jan
-01
May
-01
Sep
-01
Jan
-02
May
-02
Sep
-02
Jan
-03
May
-03
Sep
-03
Jan
-04
May
-04
Sep
-04
Jan
-05
May
-05
Sep
-05
Jan
-06
May
-06
Sep
-06
Jan
-07
May
-07
Sep
-07
Jan
-08
May
-08
Sep
-08
Jan
-09
USD
/ G
allo
n
US
Hyb
rid
Mar
ket
Shar
e
US Hybrid Monthly Sales - Average Gasoline Monthly Prices
Hybrid Market Share
Retail Price of Gasoline
16
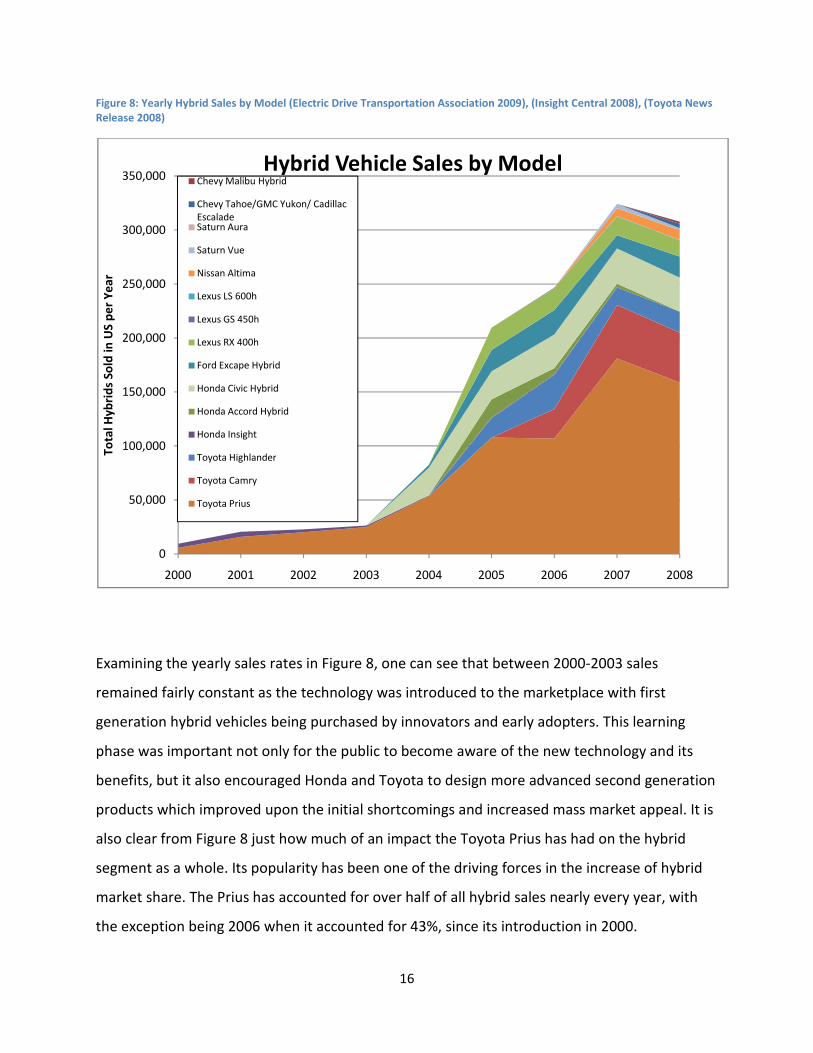
Figure 8: Yearly Hybrid Sales by Model (Electric Drive Transportation Association 2009), (Insight Central 2008), (Toyota News Release 2008)
Examining the yearly sales rates in Figure 8, one can see that between 2000-2003 sales
remained fairly constant as the technology was introduced to the marketplace with first
generation hybrid vehicles being purchased by innovators and early adopters. This learning
phase was important not only for the public to become aware of the new technology and its
benefits, but it also encouraged Honda and Toyota to design more advanced second generation
products which improved upon the initial shortcomings and increased mass market appeal. It is
also clear from Figure 8 just how much of an impact the Toyota Prius has had on the hybrid
segment as a whole. Its popularity has been one of the driving forces in the increase of hybrid
market share. The Prius has accounted for over half of all hybrid sales nearly every year, with
the exception being 2006 when it accounted for 43%, since its introduction in 2000.
0
50,000
100,000
150,000
200,000
250,000
300,000
350,000
2000 2001 2002 2003 2004 2005 2006 2007 2008
Tota
l Hyb
rid
s So
ld in
US
pe
r Y
ear
Hybrid Vehicle Sales by ModelChevy Malibu Hybrid
Chevy Tahoe/GMC Yukon/ Cadillac EscaladeSaturn Aura
Saturn Vue
Nissan Altima
Lexus LS 600h
Lexus GS 450h
Lexus RX 400h
Ford Excape Hybrid
Honda Civic Hybrid
Honda Accord Hybrid
Honda Insight
Toyota Highlander
Toyota Camry
Toyota Prius
17
As shown in Figure 5, hybrid market share growth again follows an exponential curve. With an
R2 value of 0.95 the model showed average annual growth rates of 46%. The raw sales numbers
(Figure 6) did not fit the exponential growth curve as well with an R2 of 0.88. Raw sales showed
an annual growth rate of 47%. Not only did the number of hybrids sold increase between 2000
and 2009 but the variety of cars equipped with hybrid drivetrain architecture increased greatly
as well. Hybrids were introduced to the luxury sports car segment (Lexus GS and Lexus LS), the
small SUV segment (Ford Escape and Toyota Highlander), the large SUV segment (Lexus RX and
Chevy Suburban), and the midsize family car segment (Toyota Camry, Honda Accord, Nissan
Altima and Saturn Aura) by 2008. As seen in Figure 7 hybrid sales were clearly affected by short
term changes in gasoline prices. Monthly hybrid market share closely followed the increases
and decreases in gasoline prices, especially between May of 2006 and August of 2008. Between
2000 and 2009 the US government incentivized sales of hybrid cars. Between 2001 and 2006
the federal government offered a flat tax credit of $2000 for any hybrid vehicle purchased. The
system was modified in 2007 to a graduated rebate program with incentives ranging from $650
to $3400, depending on the model of car (US Departement of Energy 2009).
BEV Growth Model
In order to determine the annualized growth rates necessary to reach the projections of BCG
and Deutsche Bank, a baseline sales figure must be found to act as “A” in our growth model
(see Figure 2). Many traditional automotive companies as well as newer startups have made
public announcements over the past 6 to 12 months outlining their plans for BEV introduction
timelines and occasionally their planned production levels. After cataloging these
announcements it became clear that 2010 and 2011 will represent the beginning of
commercially viable large scale BEV sales in the marketplace.
18
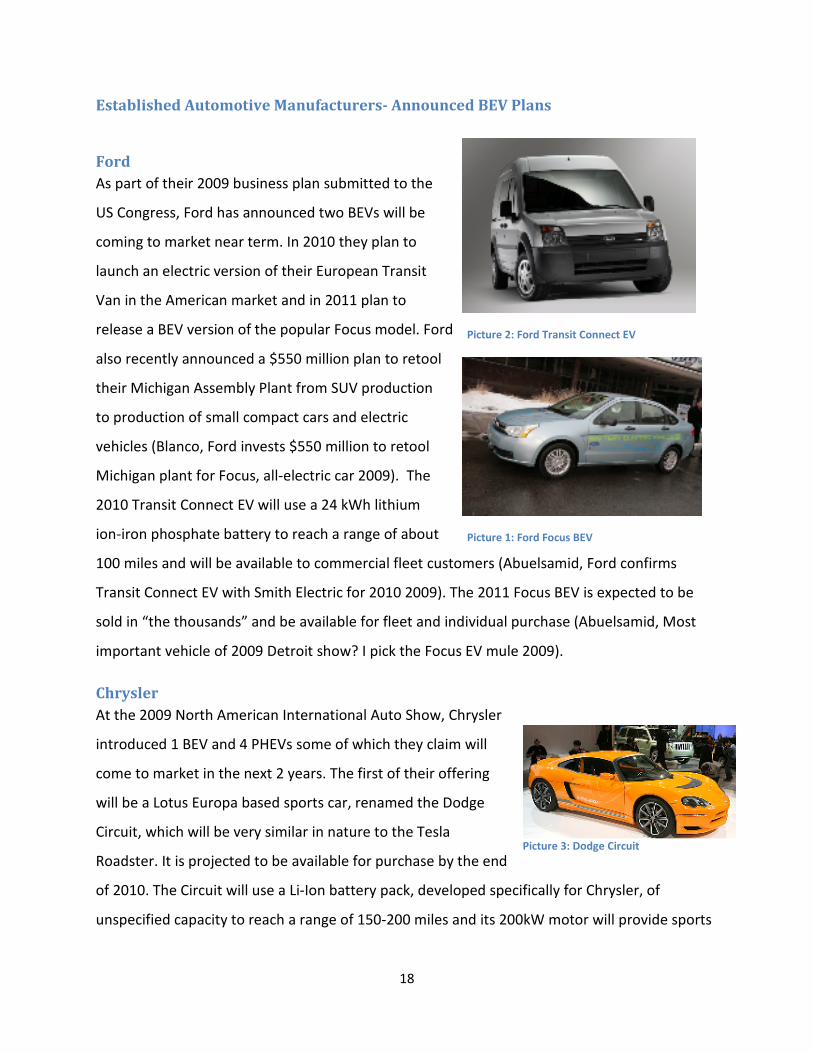
Picture 2: Ford Transit Connect EV
Established Automotive Manufacturers- Announced BEV Plans
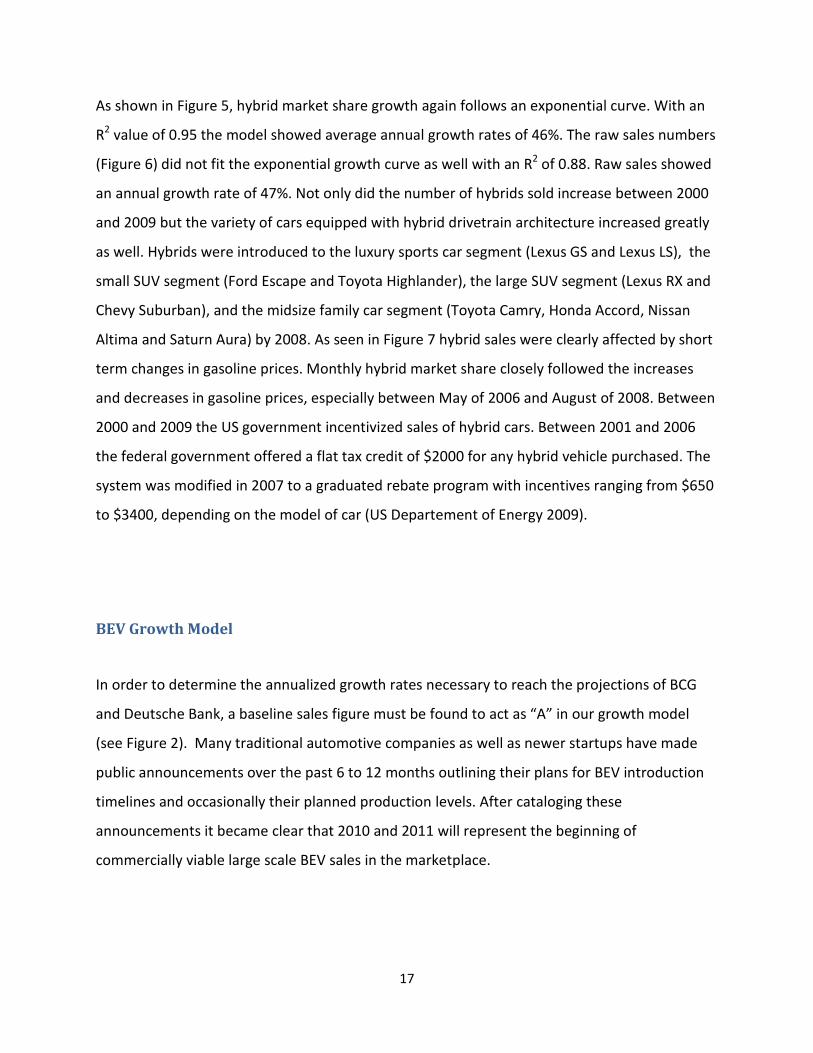
Ford
As part of their 2009 business plan submitted to the
US Congress, Ford has announced two BEVs will be
coming to market near term. In 2010 they plan to
launch an electric version of their European Transit
Van in the American market and in 2011 plan to
release a BEV version of the popular Focus model. Ford
also recently announced a $550 million plan to retool
their Michigan Assembly Plant from SUV production
to production of small compact cars and electric
vehicles (Blanco, Ford invests $550 million to retool
Michigan plant for Focus, all-electric car 2009). The
2010 Transit Connect EV will use a 24 kWh lithium
ion-iron phosphate battery to reach a range of about
100 miles and will be available to commercial fleet customers (Abuelsamid, Ford confirms
Transit Connect EV with Smith Electric for 2010 2009). The 2011 Focus BEV is expected to be
sold in “the thousands” and be available for fleet and individual purchase (Abuelsamid, Most
important vehicle of 2009 Detroit show? I pick the Focus EV mule 2009).
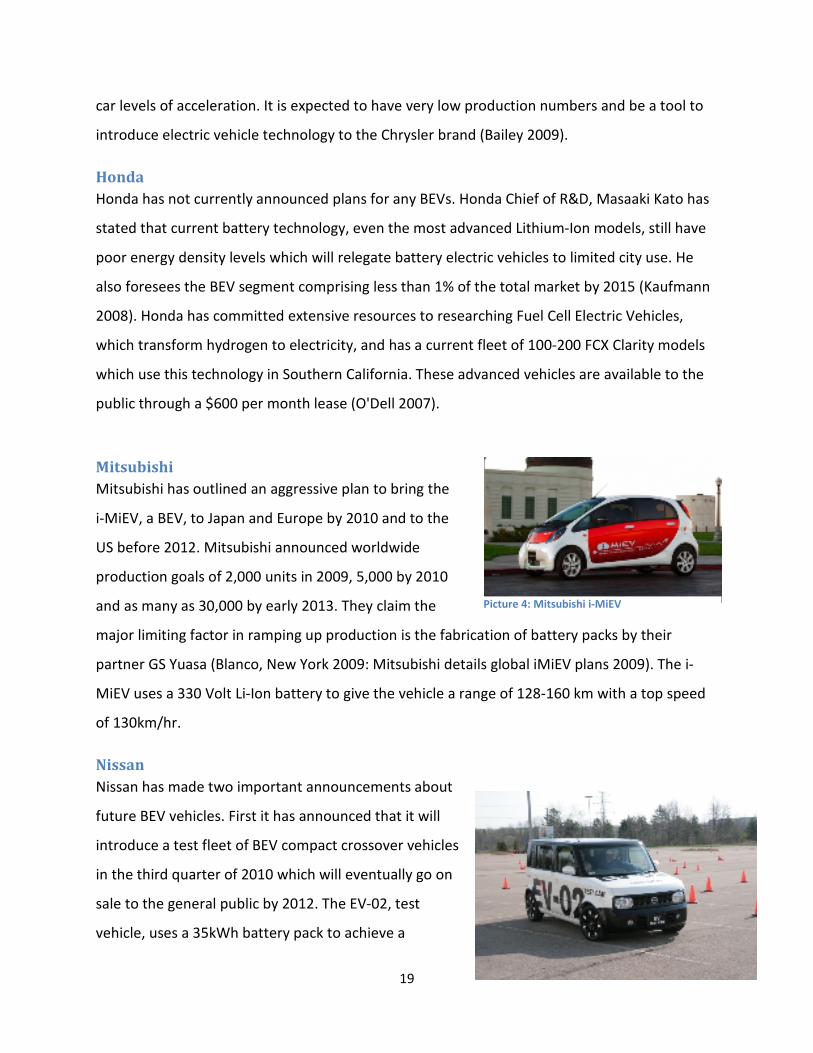
Chrysler
At the 2009 North American International Auto Show, Chrysler
introduced 1 BEV and 4 PHEVs some of which they claim will
come to market in the next 2 years. The first of their offering
will be a Lotus Europa based sports car, renamed the Dodge
Circuit, which will be very similar in nature to the Tesla
Roadster. It is projected to be available for purchase by the end
of 2010. The Circuit will use a Li-Ion battery pack, developed specifically for Chrysler, of
unspecified capacity to reach a range of 150-200 miles and its 200kW motor will provide sports
Picture 1: Ford Focus BEV
Picture 3: Dodge Circuit
19
car levels of acceleration. It is expected to have very low production numbers and be a tool to
introduce electric vehicle technology to the Chrysler brand (Bailey 2009).
Honda
Honda has not currently announced plans for any BEVs. Honda Chief of R&D, Masaaki Kato has
stated that current battery technology, even the most advanced Lithium-Ion models, still have
poor energy density levels which will relegate battery electric vehicles to limited city use. He
also foresees the BEV segment comprising less than 1% of the total market by 2015 (Kaufmann
2008). Honda has committed extensive resources to researching Fuel Cell Electric Vehicles,
which transform hydrogen to electricity, and has a current fleet of 100-200 FCX Clarity models
which use this technology in Southern California. These advanced vehicles are available to the
public through a $600 per month lease (O'Dell 2007).
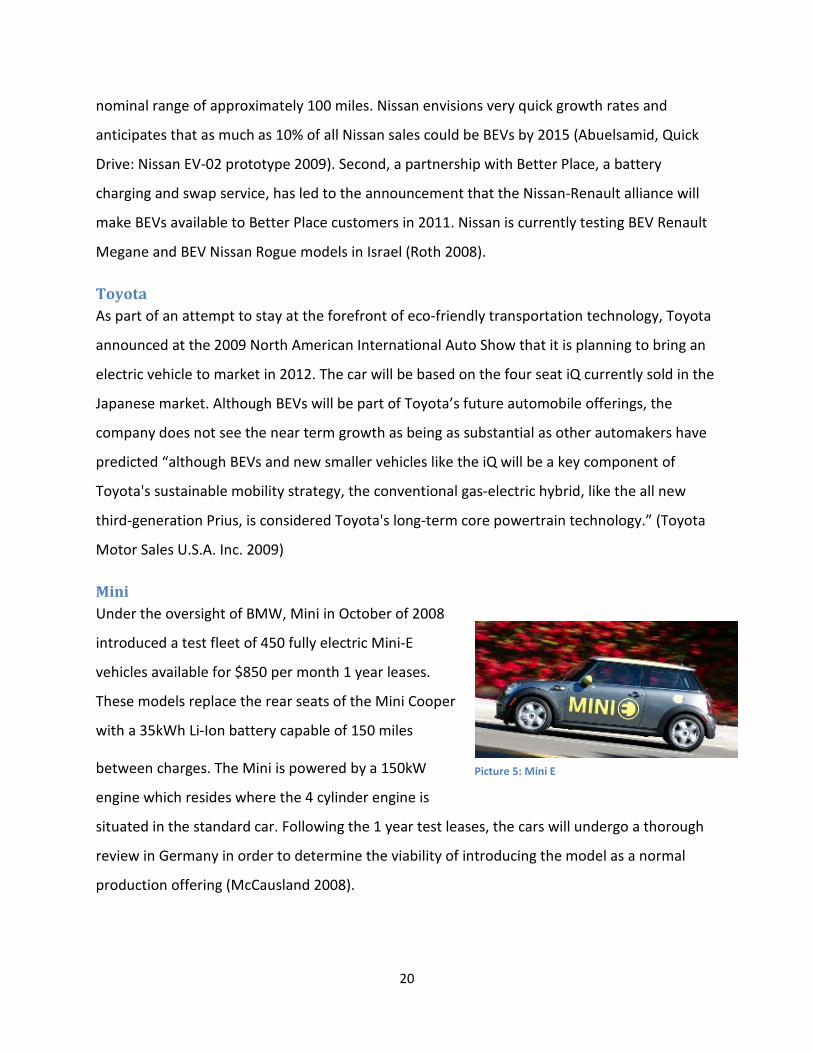
Mitsubishi
Mitsubishi has outlined an aggressive plan to bring the
i-MiEV, a BEV, to Japan and Europe by 2010 and to the
US before 2012. Mitsubishi announced worldwide
production goals of 2,000 units in 2009, 5,000 by 2010
and as many as 30,000 by early 2013. They claim the
major limiting factor in ramping up production is the fabrication of battery packs by their
partner GS Yuasa (Blanco, New York 2009: Mitsubishi details global iMiEV plans 2009). The i-
MiEV uses a 330 Volt Li-Ion battery to give the vehicle a range of 128-160 km with a top speed
of 130km/hr.
Nissan
Nissan has made two important announcements about
future BEV vehicles. First it has announced that it will
introduce a test fleet of BEV compact crossover vehicles
in the third quarter of 2010 which will eventually go on
sale to the general public by 2012. The EV-02, test
vehicle, uses a 35kWh battery pack to achieve a
Picture 4: Mitsubishi i-MiEV
20
nominal range of approximately 100 miles. Nissan envisions very quick growth rates and
anticipates that as much as 10% of all Nissan sales could be BEVs by 2015 (Abuelsamid, Quick
Drive: Nissan EV-02 prototype 2009). Second, a partnership with Better Place, a battery
charging and swap service, has led to the announcement that the Nissan-Renault alliance will
make BEVs available to Better Place customers in 2011. Nissan is currently testing BEV Renault
Megane and BEV Nissan Rogue models in Israel (Roth 2008).
Toyota
As part of an attempt to stay at the forefront of eco-friendly transportation technology, Toyota
announced at the 2009 North American International Auto Show that it is planning to bring an
electric vehicle to market in 2012. The car will be based on the four seat iQ currently sold in the
Japanese market. Although BEVs will be part of Toyota’s future automobile offerings, the
company does not see the near term growth as being as substantial as other automakers have
predicted “although BEVs and new smaller vehicles like the iQ will be a key component of
Toyota's sustainable mobility strategy, the conventional gas-electric hybrid, like the all new
third-generation Prius, is considered Toyota's long-term core powertrain technology.” (Toyota
Motor Sales U.S.A. Inc. 2009)
Mini
Under the oversight of BMW, Mini in October of 2008
introduced a test fleet of 450 fully electric Mini-E
vehicles available for $850 per month 1 year leases.
These models replace the rear seats of the Mini Cooper
with a 35kWh Li-Ion battery capable of 150 miles
between charges. The Mini is powered by a 150kW
engine which resides where the 4 cylinder engine is
situated in the standard car. Following the 1 year test leases, the cars will undergo a thorough
review in Germany in order to determine the viability of introducing the model as a normal
production offering (McCausland 2008).
Picture 5: Mini E
21
New Automotive Manufacturers- Announced BEV Plans
Tesla Motors
As the most popularly celebrated electric vehicle
manufacturer in the United States, Tesla Motors has
succeeded in producing a very fast electric sports car and has
announced plans to produce a sedan by 2011. The first Tesla
roadster was delivered in February of 2008 and as of April of
2009 Tesla has delivered 320 vehicles. The roadster seats two
and uses a 53kWh Li-ion cobalt oxide battery pack comprised
of 6,831 cells, similar to those used in laptops and other personal electronics. Tesla claims the
battery back has an expected lifetime of 7 years or 160,000 km and quotes the current
replacement cost as $30,000 (Abuelsamid, Tesla offers laundry list of new options, $12k prepaid
battery replacement 2009). The Roadster lists a base price of $101,500 and has a wait list of
“almost 1000” (van der Sande 2009).
In March of 2009 Tesla announced plans to produce a 7-
passenger sedan targeted at the mass market. The new
sedan, the Model S, is currently scheduled to come to
market in 2012. With a base price of $49,900, after a
$7,500 federal rebate, the Model S has generated a
significant amount of public interest. Tesla received 520
reservation deposits in the first week following the
model’s introduction (Tesla Motors 2009). The Model S plans to use battery technology similar
in nature to the existing Tesla Roadster and have a driving range of 260 to 480 km depending
on the battery specifications a customer chooses. Model S plans call for it to be capable of quick
battery swaps and have the ability to be recharged using 110V, 220V and 480V sources.
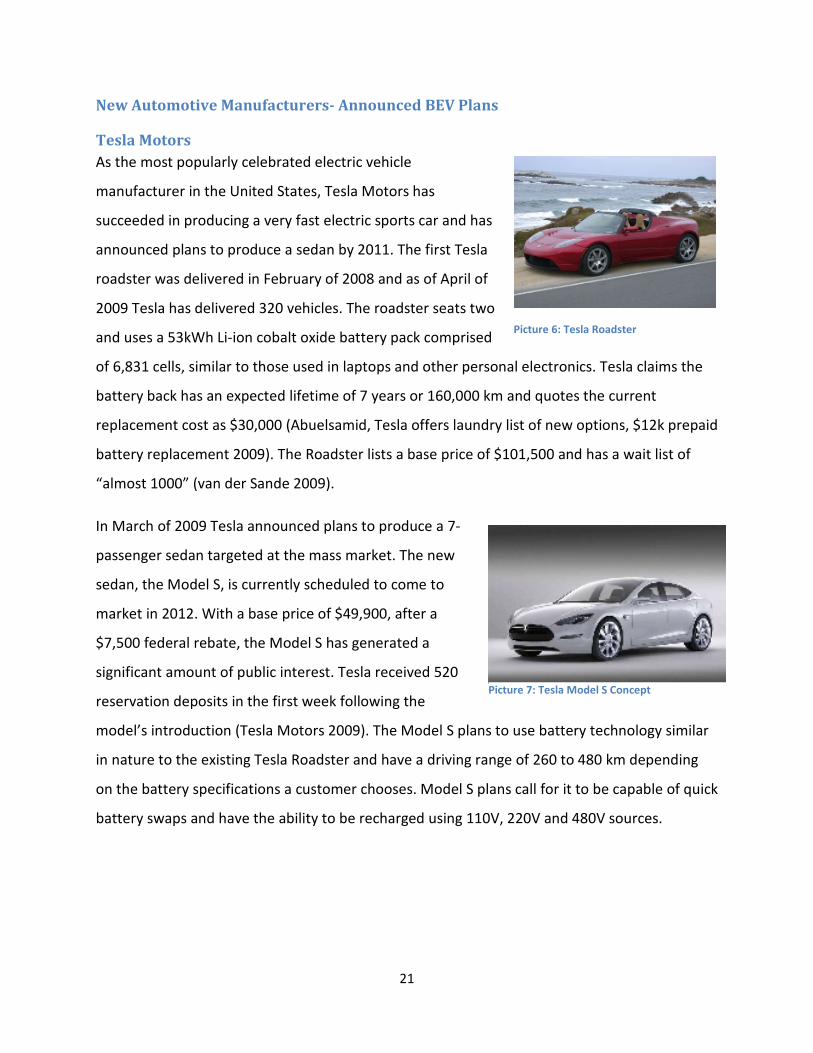
Picture 6: Tesla Roadster
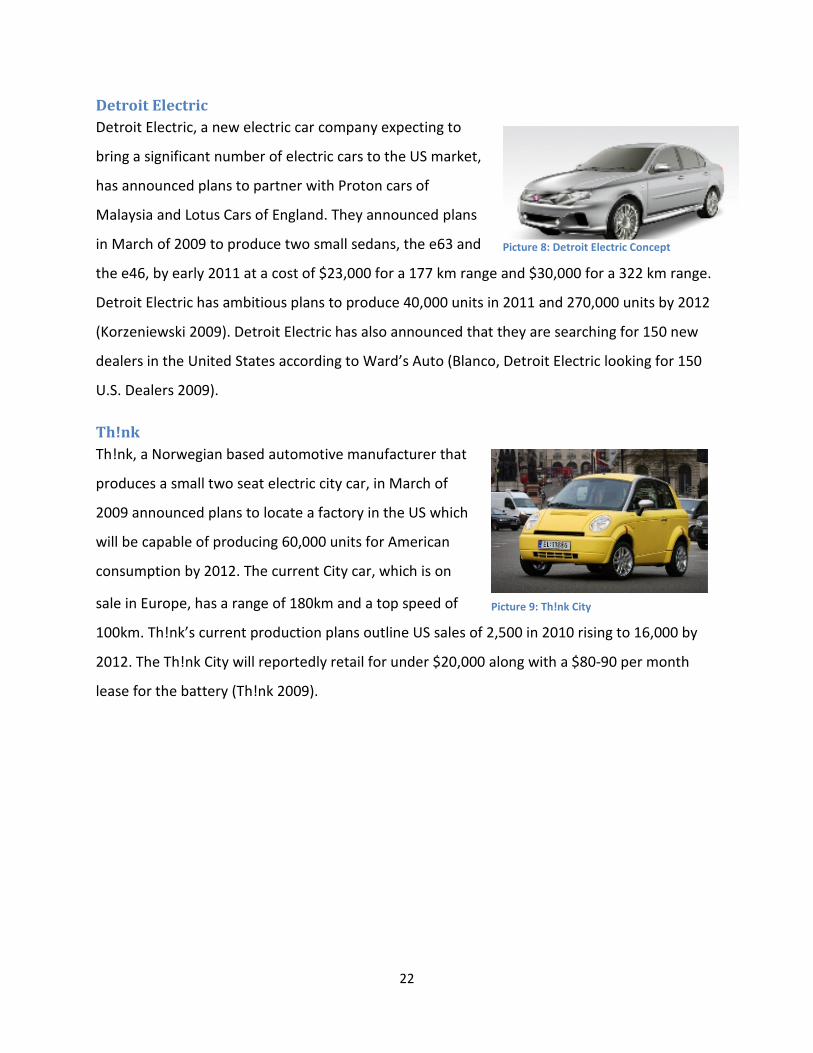
Picture 7: Tesla Model S Concept
22
Detroit Electric
Detroit Electric, a new electric car company expecting to
bring a significant number of electric cars to the US market,
has announced plans to partner with Proton cars of
Malaysia and Lotus Cars of England. They announced plans
in March of 2009 to produce two small sedans, the e63 and
the e46, by early 2011 at a cost of $23,000 for a 177 km range and $30,000 for a 322 km range.
Detroit Electric has ambitious plans to produce 40,000 units in 2011 and 270,000 units by 2012
(Korzeniewski 2009). Detroit Electric has also announced that they are searching for 150 new
dealers in the United States according to Ward’s Auto (Blanco, Detroit Electric looking for 150
U.S. Dealers 2009).
Th!nk
Th!nk, a Norwegian based automotive manufacturer that
produces a small two seat electric city car, in March of
2009 announced plans to locate a factory in the US which
will be capable of producing 60,000 units for American
consumption by 2012. The current City car, which is on
sale in Europe, has a range of 180km and a top speed of
100km. Th!nk’s current production plans outline US sales of 2,500 in 2010 rising to 16,000 by
2012. The Th!nk City will reportedly retail for under $20,000 along with a $80-90 per month
lease for the battery (Th!nk 2009).
Picture 8: Detroit Electric Concept
Picture 9: Th!nk City
23
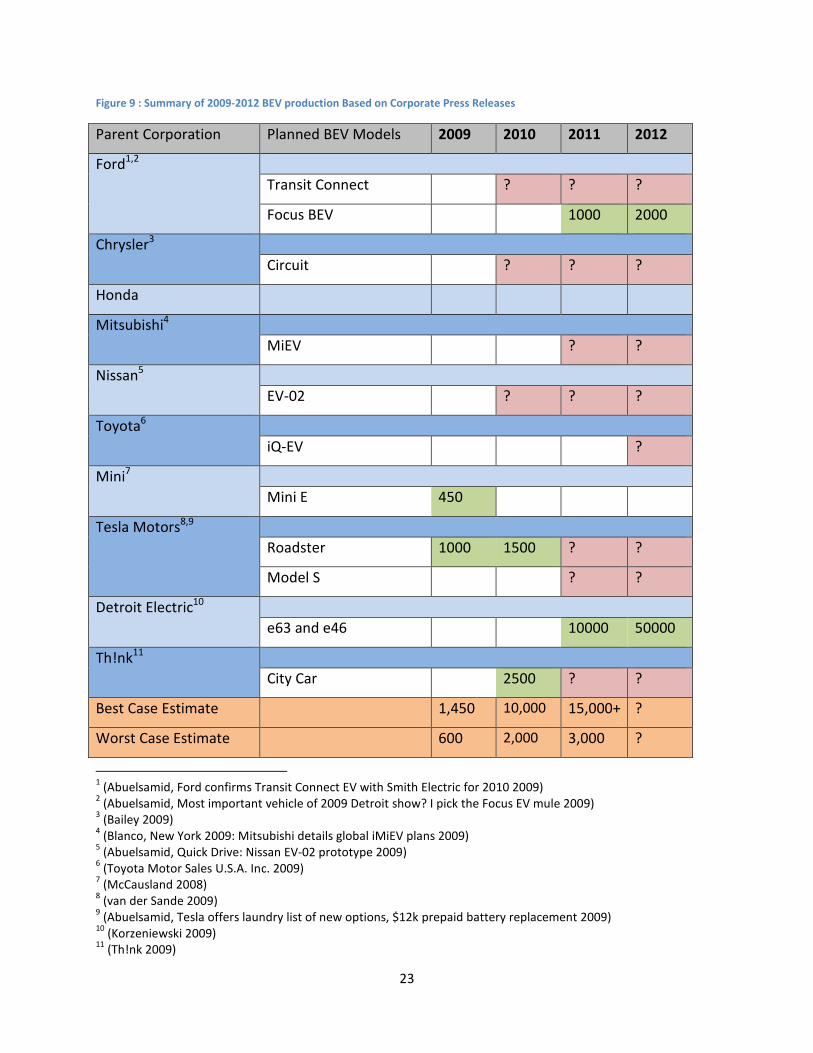
Figure 9 : Summary of 2009-2012 BEV production Based on Corporate Press Releases
Parent Corporation Planned BEV Models 2009 2010 2011 2012
Ford1,2
Transit Connect ? ? ?
Focus BEV 1000 2000
Chrysler3
Circuit ? ? ?
Honda
Mitsubishi4
MiEV ? ?
Nissan5
EV-02 ? ? ?
Toyota6
iQ-EV ?
Mini7
Mini E 450
Tesla Motors8,9
Roadster 1000 1500 ? ?
Model S ? ?
Detroit Electric10
e63 and e46 10000 50000
Th!nk11
City Car 2500 ? ?
Best Case Estimate 1,450 10,000 15,000+ ?
Worst Case Estimate 600 2,000 3,000 ?
1 (Abuelsamid, Ford confirms Transit Connect EV with Smith Electric for 2010 2009)
2 (Abuelsamid, Most important vehicle of 2009 Detroit show? I pick the Focus EV mule 2009)
3 (Bailey 2009)
4 (Blanco, New York 2009: Mitsubishi details global iMiEV plans 2009)
5 (Abuelsamid, Quick Drive: Nissan EV-02 prototype 2009)
6 (Toyota Motor Sales U.S.A. Inc. 2009)
7 (McCausland 2008)
8 (van der Sande 2009)
9 (Abuelsamid, Tesla offers laundry list of new options, $12k prepaid battery replacement 2009)
10 (Korzeniewski 2009)
11 (Th!nk 2009)
24
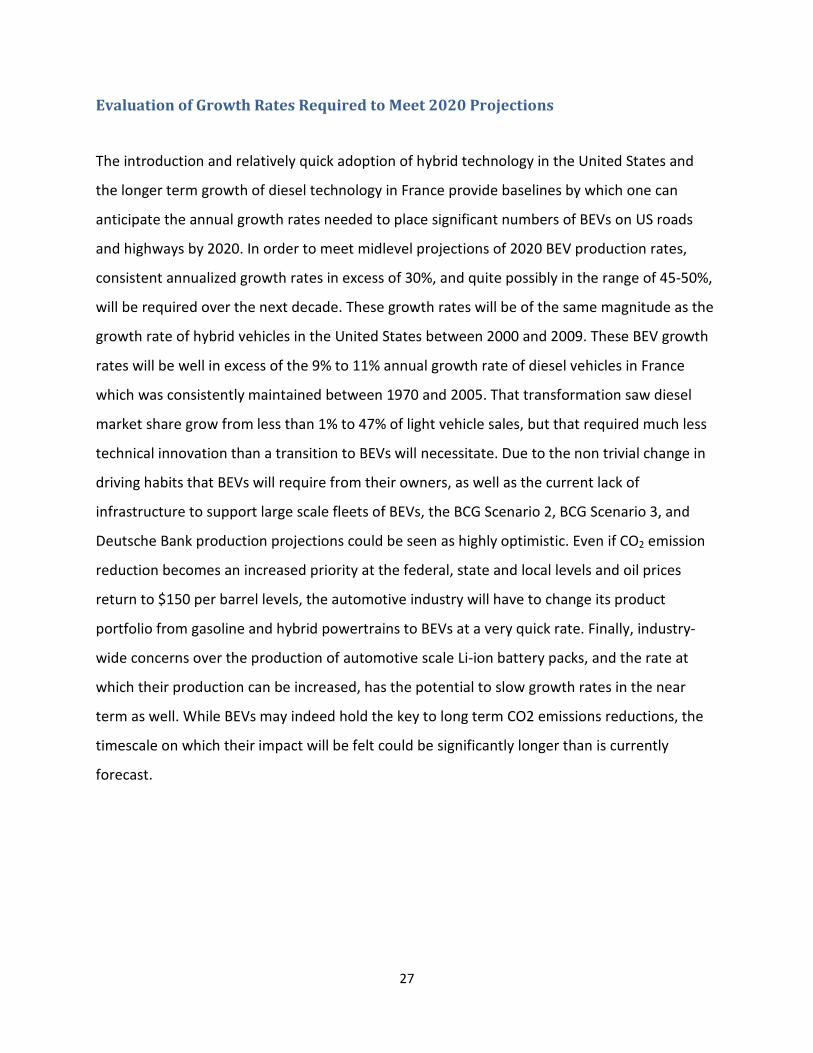
Growth Rates Required to Meet Projections
Given that the projected near term production figures for pure EVs are very low relative to the
long term production estimates forecasted in BCG, Deutsche Bank and US Government
projections, some consistent long term growth will be required to meet 2020 sales estimates. In
order to evaluate the range of annualized growth rates necessary to meet those projections a
range of initial 2010 production figures as well as growth rates were plotted (See Figures 10 to
14). With initial sales in 2010 and 2011 on the low end of the sales spectrum (Figure 9) 2500 to
5000 BEV sales in 2010, annualized growth rates on the order of 45% to 55% will be required to
meet the BCG Scenario 2 and Deutsche Bank projections. If some of the newer electric vehicle
manufacturers such as Detroit Electric and Th!nk deliver on their recent statements to place
thousands of cars on the road in the very near term, thus raising the total number of BEVs sold
in 2010 and 2011 into the 10,000 to 20,000 unit range, much lower average annualized growth
rates, on the order of 30% to 37%, will be required to meet Deutsche Bank and BCG Scenario 2
projections.
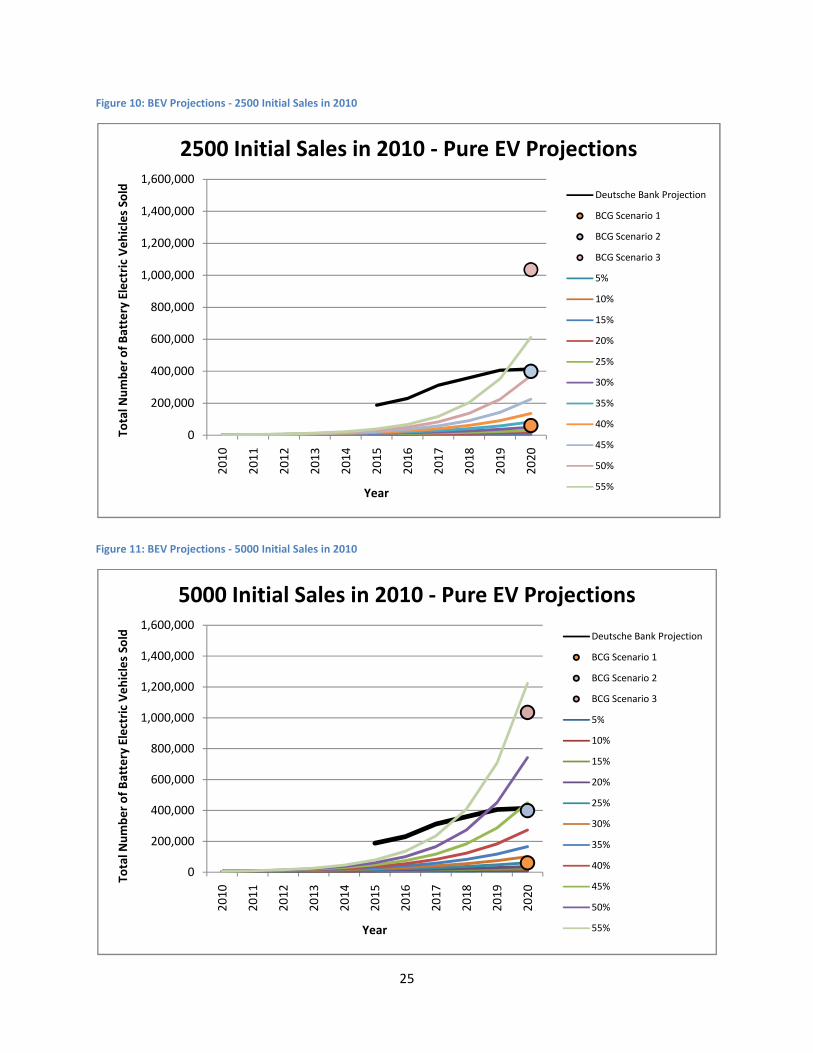
25
Figure 10: BEV Projections - 2500 Initial Sales in 2010
Figure 11: BEV Projections - 5000 Initial Sales in 2010
0
200,000
400,000
600,000
800,000
1,000,000
1,200,000
1,400,000
1,600,000
20
10
20
11
20
12
20
13
20
14
20
15
20
16
20
17
20
18
20
19
20
20
Tota
l Nu
mb
er
of
Bat
tery
Ele
ctri
c V
eh
icle
s So
ld
Year
2500 Initial Sales in 2010 - Pure EV Projections
Deutsche Bank Projection
BCG Scenario 1
BCG Scenario 2
BCG Scenario 3
5%
10%
15%
20%
25%
30%
35%
40%
45%
50%
55%
0
200,000
400,000
600,000
800,000
1,000,000
1,200,000
1,400,000
1,600,000
20
10
20
11
20
12
20
13
20
14
20
15
20
16
20
17
20
18
20
19
20
20
Tota
l Nu
mb
er
of
Bat
tery
Ele
ctri
c V
eh
icle
s So
ld
Year
5000 Initial Sales in 2010 - Pure EV Projections
Deutsche Bank Projection
BCG Scenario 1
BCG Scenario 2
BCG Scenario 3
5%
10%
15%
20%
25%
30%
35%
40%
45%
50%
55%

26
Figure 12: BEV Projections - 10,000 Initial Sales
Figure 13: BEV Projections - 20,000 Initial Sales
0
200,000
400,000
600,000
800,000
1,000,000
1,200,000
1,400,000
1,600,000
20
10
20
11
20
12
20
13
20
14
20
15
20
16
20
17
20
18
20
19
20
20
Tota
l Nu
mb
er
of
Bat
tery
Ele
ctri
c V
eh
icle
s So
ld
Year
10,000 Initial Sales in 2010 - Pure EV Projections
Deutsche Bank Projection
BCG Scenario 1
BCG Scenario 2
BCG Scenario 3
5%
10%
15%
20%
25%
30%
35%
40%
45%
50%
55%
0
200,000
400,000
600,000
800,000
1,000,000
1,200,000
1,400,000
1,600,000
20
10
20
11
20
12
20
13
20
14
20
15
20
16
20
17
20
18
20
19
20
20
Tota
l Nu
mb
er
of
Bat
tery
Ele
ctri
c V
eh
icle
s So
ld
Year
20,000 Initial Sales in 2010 - Pure EV Projections
Deutsche Bank Projection
BCG Scenario 1
BCG Scenario 2
BCG Scenario 3
5%
10%
15%
20%
25%
30%
35%
40%
45%
50%
55%
27
Evaluation of Growth Rates Required to Meet 2020 Projections
The introduction and relatively quick adoption of hybrid technology in the United States and
the longer term growth of diesel technology in France provide baselines by which one can
anticipate the annual growth rates needed to place significant numbers of BEVs on US roads
and highways by 2020. In order to meet midlevel projections of 2020 BEV production rates,
consistent annualized growth rates in excess of 30%, and quite possibly in the range of 45-50%,
will be required over the next decade. These growth rates will be of the same magnitude as the
growth rate of hybrid vehicles in the United States between 2000 and 2009. These BEV growth
rates will be well in excess of the 9% to 11% annual growth rate of diesel vehicles in France
which was consistently maintained between 1970 and 2005. That transformation saw diesel
market share grow from less than 1% to 47% of light vehicle sales, but that required much less
technical innovation than a transition to BEVs will necessitate. Due to the non trivial change in
driving habits that BEVs will require from their owners, as well as the current lack of
infrastructure to support large scale fleets of BEVs, the BCG Scenario 2, BCG Scenario 3, and
Deutsche Bank production projections could be seen as highly optimistic. Even if CO2 emission
reduction becomes an increased priority at the federal, state and local levels and oil prices
return to $150 per barrel levels, the automotive industry will have to change its product
portfolio from gasoline and hybrid powertrains to BEVs at a very quick rate. Finally, industry-
wide concerns over the production of automotive scale Li-ion battery packs, and the rate at
which their production can be increased, has the potential to slow growth rates in the near
term as well. While BEVs may indeed hold the key to long term CO2 emissions reductions, the
timescale on which their impact will be felt could be significantly longer than is currently
forecast.
28
Works Cited Abuelsamid, Sam. Ford confirms Transit Connect EV with Smith Electric for 2010. February 9,
2009. http://www.autobloggreen.com/2009/02/09/ford-confirms-transit-connect-ev-
with-smith-electric-for-2010/ (accessed March 21, 2009).
—. Most important vehicle of 2009 Detroit show? I pick the Focus EV mule. January 19th, 2009.
http://www.autobloggreen.com/2009/01/19/most-important-vehicle-of-2009-detroit-
show-i-pick-the-focus-ev/ (accessed March 21, 2009).
—. Quick Drive: Nissan EV-02 prototype. May 4, 2009.
http://www.autobloggreen.com/2009/05/04/quick-drive-nissan-ev-02-prototype/
(accessed May 4, 2009).
—. Tesla offers laundry list of new options, $12k prepaid battery replacement. January 17, 2009.
http://www.autobloggreen.com/2009/01/17/tesla-offers-laundry-list-of-new-options-
12k-prepaid-battery-r/ (accessed March 21, 2009).
Bailey, Shaun. Dodge Circuit EV. January 31, 2009.
http://www.roadandtrack.com/article.asp?section_id=15&article_id=7416 (accessed
MArch 21, 2009).
Blanco, Sebastian. Detroit Electric looking for 150 U.S. Dealers. April 13, 2009.
http://www.autobloggreen.com/2009/04/13/detroit-electric-looking-for-150-u-s-
dealers/ (accessed April 21, 2009).
—. Ford invests $550 million to retool Michigan plant for Focus, all-electric car. May 6, 2009.
http://www.autobloggreen.com/2009/05/06/ford-invests-550-million-to-retool-
michigan-plant-for-focus-al/ (accessed May 6, 2009).
—. New York 2009: Mitsubishi details global iMiEV plans. April 11, 2009.
http://www.autobloggreen.com/2009/04/11/new-york-2009-mitsubishi-details-global-
imiev-plans/ (accessed April 22, 2009).
Book, Michael, Marcus Groll, Xavier Mosquet, Dimitrios Rizoulis, and Georg Sticher. The
Comeback of the Electric Car?: How Real, How Soon, and What Must Happen Next.
Boston Consulting Group, 2009.
Davis, Stacy C., Susan W. Diegel, and Robert G. Boundy. Transportation Energy Data Book:
Edition 27. Oak Ridge, Tennessee: U.S. Departement of Energy, 2008.
Departement of Energy. "EIA - Annual Energy Outlook 2009." Washington D.C., 2009.
29
Deusche Bank. Electric Cars: Pluged In. Markets Research, Automobiles Auto Manufacturing ,
Deutsche Bank, 2008.
Electric Drive Transportation Association. "Hybrid Sales Figures/Tax Credits for Hybrids." ETDA.
March 2009.
http://www.electricdrive.org/index.php?ht=d/Articles/cat_id/5514/pid/2549 (accessed
March 15, 2009).
Energy Information Administration. "Gasoline Components History." Energy Information
Administration Official Energy Statistics from the US Government. March 2009.
http://tonto.eia.doe.gov/oog/info/gdu/gaspump.html (accessed March 15, 2009).
Green Car Congress. "US Hybrid Sales in March 2009 Down 44% Year-on-Year; Monthly New
Vehicle Market Share of 2.5%." Green Car Gongress. April 3, 2009.
http://www.greencarcongress.com/2009/04/us-hybrid-sales-in-march-2009-down-44-
yearonyear-monthly-new-vehicle-market-share-of-25.html#more (accessed April 6,
2009).
Green Car Congress. Diesel Auto Sales Trending to Exceed Gasoline in Europe in 2006. January
30, 2006. http://www.greencarcongress.com/2006/01/diesel_auto_sal.html (accessed
March 20, 2009).
Insight Central. "Sales Statistics." Insight Central. 2008.
http://www.insightcentral.net/KB/sales.html (accessed March 15, 2009).
Jones, Roland. Automakes All Charged Up Over Electric Cars. January 16, 2009.
http://www.msnbc.msn.com/id/28659906 (accessed March 15, 2009).
Kaufmann, Alex. Honda opts out of EV production until batteries mature. September 8, 2008.
http://www.motorauthority.com/honda-will-not-build-ev-while-battery-technology-
remains-inefficient.html (accessed March 15, 2009).
Korzeniewski, Jeremy. Detroit Eectric sign deal with Proton, plans 2 new electric cars. March 30,
2009. http://www.autobloggreen.com/2009/03/30/detroit-electric-signs-deal-with-
proton-plans-2-new-electric-ca/ (accessed April 21, 2009).
McCausland, Evan. Green: 2009 Mini E Electric Vehicle. October 18, 2008.
http://www.automobilemag.com/green/news/0810_2009_mini_e_electric_vehicle/ind
ex.html (accessed March 21, 2009).
Obama, Barack. "Obama Prepared Remarks at Tour of the Electric Vehicle Technical Center."
Pomona, California, March 19, 2009.
Observatoire Économique et Statistique des Transports. 2007. Fleet-level data for France provided by Lee Schipper, Research Director, EMBARQ
30
O'Dell, John. Honda's Fuel-Cell Electric Car is No Trailer Queen. November 26, 2007.
http://www.edmunds.com/insideline/do/Drives/FirstDrives/articleId=123662 (accessed March
21, 2009).
Roth, Daniel. Driven: Shai Agassi's Audacious Plan to Put Electric Cars on the Road. August 18, 2008.
http://www.wired.com/cars/futuretransport/magazine/16-09/ff_agassi (accessed April 2009).
Tesla Motors. "Tesla take more than 500 Model S reservations in a week." Tesla Motors. April 2, 2009.
http://www.teslamotors.com/media/press_room.php?id=1299 (accessed April 21, 2009).
—. "Tesla unveils world’s first mass-produced, highway-capable EV." Tesla Motors Press Room. March
26, 2009. http://www.teslamotors.com/media/press_room.php?id=1284 (accessed April 21,
2009).
Th!nk. "Think Announces U.S. Factory Plans." Th!nk. March 12, 2009. http://www.think.no/think/Press-
Pictures/Press-releases/Think-Announces-U.S.-Factory-Plans (accessed March 21, 2009).
Toyota Motor Sales U.S.A. Inc. "Detroit 2009: Toyota's iQ based FT-EV concept to hit production in
2012." Autoblog Green. January 10, 2009. http://www.autobloggreen.com/2009/01/10/detroit-
2009-toyotas-iq-based-ft-ev-concept-to-hit-production/ (accessed March 16, 2009).
Toyota News Release. "Worldwide Prius Sales Top 1 Million Mark." Toyota. May 15, 2008.
http://www.toyota.co.jp/en/news/08/0515.html (accessed March 15, 2009).
US Departement of Energy. Diesel Vehicles. http://www.fueleconomy.gov/feg/di_diesels.shtml
(accessed March 21, 2009).
—. New Energy Tax Credits for Hybrids. April 15, 2009.
http://www.fueleconomy.gov/feg/tax_hybrid.shtml (accessed April 16, 2009).
van der Sande, Michael. Sales Update - Buuying a Tesla Roadster just got easier. March 26, 2009.
http://www.teslamotors.com/blog2/?p=71 (accessed April 11, 2009).
Wards Auto. "U.S. Light Vehicle Sales Summary." Wardsauto.com. 2009.
http://wardsauto.com/keydata/USSalesSummary0903/ (accessed March 15, 2009).