an analysis of a strategic transformation plan: the case
TRANSCRIPT
23
JTRF Volume 52 No. 1, Spring 2013
by Paul Caster and Carl Scheraga
In 2003, amid the turmoil of theU.S. airline industry in the post-9/11 environment, the seniormanagementoftheAlaskaAirGroupannounceda“strategicvision”entitled“Alaska2010.”Thepronouncementarticulatedpositionswith regard to cost leadership,productdifferentiation,andgrowth.Thisstudyempiricallyassessestheefficacyofthisdecisionwithregardtothemajornetworkcarrierof theairgroup,AlaskaAirlines.Theanalysis focuseson theperiodbeginningwith theannouncementandendingin2010.
The implementation of such a strategic protocol is dynamic and inter-temporal in nature.Therefore,itisoftendifficulttoassesstheeffectivenessofchangesinstrategies,particularlysincesucheffectivenessisoftenafunctionoftheconfoundingforcesoforganizationalstrategyandmarketconditions.Thus,thisstudyutilizesthemulti-periodmethodologyofthestrategicvarianceanalysisofoperatingincome.
Thismethodologydecomposesoperatingincomeintothreecomponents:(1)growth,(2)pricerecovery,and(3)productivity.Thisisofparticularinterestfromastrategicplanningperspective,asthepricecomponentevaluatesacompany’sproductdifferentiationstrategywhiletheproductivitycomponentevaluateswhetheranairline’s lowcost strategywassuccessfulbecauseofefficiencygains.
INTRODUCTION
In 2003, the U.S. airline industry was in turmoil. Airline traffic continued to be below 2001 levels, still reeling from the aftermath of the 9/11 terrorist attacks. A slow U.S. economy combined with rising fuel costs produced billions of dollars in losses for airlines. In addition, both US Airways and United Airlines filed for bankruptcy protection in 2002. In such a challenging business environment, it was clear that airlines had to change their operating strategies.
The management of Alaska Air Group, led by Chairman, President, and CEO William S. Ayer, did just that, announcing a “strategic vision” called “Alaska 2010.” The plan was communicated to employees in June 2003, and elements of the plan were made public in the company’s annual report to shareholders for the year ended December 31, 2003, as well as in subsequent years. Highlights of the plan included a goal of making permanent cost reductions to save the company $307 million per year, and to drive down the non-fuel unit cost to 7.25 cents per available seat mile (Ayer 2004). In the letter to shareholders, Ayer stated, “Our task is to make the critical changes necessary to transform ourselves into a thriving enterprise.”
Alaska Air Group consists of two airlines: Alaska Airlines and Horizon Air Industries. As explained in the annual report to shareholders, the “business plans, competition, and economic risks differ substantially” (SEC 2004). The focus of this research is on the impact of the Alaska 2010 strategic plan on Alaska Airlines, since it is the major network carrier in the group.
From a research perspective, questions arose as to how Alaska Airlines was performing relative to other airlines. It was also asked if management was correct in perceiving a need to transform the company’s operations. After all, by its own perception, the company was doing very well relative to the industry. In 2001, the company reported that “Alaska [Airlines] posted remarkable results following the 9/11 tragedy. For instance, industry traffic was down 19% in the fourth quarter, and
An Analysis of a Strategic Transformation Plan: The Case of Alaska Airlines

Alaska Airlines
24
Alaska’s was only down 5.6%. Likewise, yield per revenue passenger mile and unit revenues were down 17% and 20% respectively for the major carriers combined, while Alaska’s were down only 7.3% and 5.5%.” (Kelly 2002). Similarly, in 2002, the company stated that “Alaska [Airlines] had the best traffic, revenue, and yield performance of the majors.” (Kelly 2003). Nonetheless, the company was losing money.
This paper assesses the Alaska 2010 strategic transformation using strategic variance analysis (SVA). SVA is used to analyze a company’s profitability by breaking it down into strategic components, namely, cost leadership, product differentiation, and growth (Horngren et al. 2000, 2006, 2012). Sopariwala (2003) extended the analysis to include a fourth component, capacity underutilization. SVA has been used by Mudde and Sopariwala (2008) and Bailey et al. (2009) to analyze a given airline’s profitability, and by Caster and Scheraga (2011) to analyze the performance of all U.S. network carriers.
THE ALASKA AIR GROUP LONG-TERM STRATEGIC PLAN
In discussing “Alaska 2010,” the Alaska Air Group long-term strategic plan, Ayer noted that the company’s goal for the future was “a combination of ideas that generate savings or increase revenue while enhancing our standing with customers” (Ayer 2004). Ayer stated that cost management was a significant challenge. He went on to explain why the plan was called “Alaska 2010.” He said that “if we make the right moves now, 2010 will be the year we look back with great pride at how we transformed ourselves - - how we took control and willed ourselves to be one of the preeminent airlines in the United States” (Ayer 2004).
Additional details of the strategic plan emerged in the annual report to shareholders for calendar year 2004. In the letter to shareholders dated April 11, 2005, Ayer (2005) explained that permanent reductions in annual costs of $185 million had been achieved. This reduction was accomplished in part through a fuel hedging program, in addition to savings achieved through a “top-to-bottom review of our supply chain.” Cost savings were also achieved by streamlining the fare structure, by improving the website for the purchase of fares online, and by improving turn times of aircraft between flights. Ayer acknowledged that competitors were improving their cost structures at an even faster pace than Alaska Air Group, and to that end, it was necessary to reduce the workforce, in part by outsourcing some of its maintenance operations. Ayer (2005) also reported that “a big part of our Alaska 2010 plan focuses on achieving competitive labor costs for all major work groups.” The company estimated that wages and benefits were approximately $125 million above market, with most of that amount due to pilots.
Although some details of the strategic plan are disclosed in the annual reports, the information does not provide a complete picture. In fact, only those details that management chooses to disclose are available. Strategic variance analysis provides a better means for analysis of Alaska’s performance. It provides an independent lens through which to view and analyze that performance. In addition, it allows for benchmarking with peer companies, in this case, the other network carriers. The following two sections provide a description of strategic variance analysis and the details on calculation and interpretation of the variances.
STRATEGIC VARIANCE ANALYSIS
SVA was introduced by Shank and Govindarajan (1993) as a management tool that combined the then rising field of business strategy to traditional profit variance analysis in cost accounting. SVA, as modified by Sopariwala (2003), takes a company’s profit (or loss) and breaks it down into four components: growth, price-recovery, productivity, and capacity underutilization. Each component is discussed in greater detail in the following section of the paper. Variances are defined as the differences between actual results and expected results, and they are calculated for each component.
25
JTRF Volume 52 No. 1, Spring 2013
Sopariwala (2003) based his version of SVA on Horngren et al. (2000). Horngren et al. (2012, 478-485) illustrate how SVA can be used to analyze profitability “from one period to any future period.” Their illustration shows how to calculate and interpret the growth component, the price-recovery component, and the productivity component. As discussed in Horngren et al. (2012), the price-recovery component is related to product differentiation and the productivity component is related to cost leadership.
Product differentiation and cost leadership are two of the three generic strategies developed by Porter (1980, 35) for “outperforming competitors in the industry.” His third strategy is “focus,” which involves specializing in a niche area of the market. Cost leadership means that a company is recognized throughout the industry as the low cost provider of goods or services. Porter states that it requires “a great deal of managerial attention to cost control.” (Porter 1980, 35). According to Porter (1980, 37), product differentiation involves “creating something that is perceived industrywide as being unique. Having a unique product or service leads to brand loyalty, which allows a company to charge a higher price, thereby outperforming others in the industry without having low costs as a primary objective. Horngren et al. (2012) refer to this as price-recovery, because the company is able to recover its higher costs through higher revenues, thus earning a decent return.
Porter’s third strategy is similar to the other two, in that a company chooses to follow a low cost strategy or a product differentiation strategy, but it does so in a narrow niche of the market. Therefore, the focus strategy is not an industry-wide strategy.
Porter then goes on to describe companies that are “stuck in the middle.” It is possible that Alaska Air Group perceived itself in 2003 as a company that could be “stuck in the middle.” A company that is stuck in the middle “lacks the market share, capital investment, and resolve to play the low-cost game, the industry-wide differentiation necessary to obviate the need for a low-cost position, or the focus to create differentiation or a low-cost position in a more limited sphere” (Porter 1980, 41).
SVA is an ideal technique for assessing the success or failure of a long-term strategic plan, such as Alaska 2010. Management of Alaska Airlines measures its success by looking at profitability, goals for reducing its cost structure, and customer satisfaction. But the acid test is how Alaska Airlines has performed relative to its peers. SVA provides easy comparisons between Alaska Airlines and the rest of the U.S. network carriers.
DEVELOPMENT OF VARIANCES
The variances used for SVA are calculated based on Sopariwala (2003), using the four components of a company’s performance as described in Mudde and Sopariwala (2008). Each component, and the variances associated with that component, is explained as follows:
Growth Component
The growth component measures the change in operating income due to a change in revenue passenger miles (RPMs). Four separate variances are calculated related to changes in RPMs. The revenue effect of growth captures the change in revenues due to a change in RPMs, holding air fares (revenue per RPM) constant. As explained in Mudde and Sopariwala (2008, 25), it would show “higher expected revenue due to higher RPMs.”
The other three variances relate to costs and expenses, namely, fuel costs, flight-related costs, and passenger-related costs. Mudde and Sopariwala (2008) base the cost drivers on Banker and Johnston (2003), who suggested volume-based and non-volume-based cost drivers appropriate for the airline industry. The fuel cost effect of growth is calculated using available seat miles (ASMs) as the cost driver, while holding the price of fuel constant. The variance is calculated based on budgeted ASMs compared with actual ASMs. Thus, an airline would experience higher fuel costs

Alaska Airlines
26
and a corresponding decline in operating profit if it experienced growth in the market that exceeded expectations, while holding the price per gallon of jet fuel constant to isolate the impact of growth. In a similar manner, expectations and variances are developed for the growth effect of flight-related and passenger-related costs, while holding all else equal.
Price-Recovery Component
The price-recovery component measures the change in operating income due to changes in the prices of inputs and outputs, holding all else equal. Four separate variances are calculated related to changing prices. The revenue effect of price-recovery captures the change in airfares, holding RPMs constant. The other three variances relate to the cost of inputs, namely, fuel costs, flight-related costs other than fuel, and passenger-related costs. For example, if the cost of jet fuel increases in the current period, operating profit would decline, holding gallons of fuel used and budgeted ASMs constant.
Productivity Component
The productivity component measures the change in operating income due to changes in the use of inputs, holding all else equal. Productivity is measured in terms of fuel usage efficiencies and passenger cost related efficiencies, as calculated by Mudde and Sopariwala (2008). Three variances are calculated, two of which are related to fuel usage. The first fuel usage efficiency variance measures fuel usage per gallon, holding the cost per gallon and budgeted ASMs constant. Gallons used per ASM in the previous period are the expectation for the current period, and the variance is then based on actual gallons used per ASM in the current period. The passenger load factor also has an impact on fuel usage, so a second fuel usage variance is calculated by holding the price per gallon constant and the gallons used per ASM constant, while comparing budgeted ASMs to actual ASMs in the current period. The third variance is calculated based on the difference between budgeted revenue passengers and actual revenue passengers served, while holding the cost per passenger constant. The variance is favorable, and thus operating profit would increase if an airline achieves the same RPMs while carrying fewer passengers, and hence the cost associated with that would decrease.
Capacity Underutilization Component
The capacity underutilization component measures the change in operating income due to changes in capacity, holding all else equal. Three variances are calculated, each of which involves the impact on flight-related costs (excluding fuel costs). The first variance is the cost of acquiring additional capacity that goes unused in the current period. The variance is calculated by subtracting actual RPMs in the current period from actual ASMs in the current period. The second variance is the cost of underutilization of available capacity. The variance is simply the change in actual ASMs over the period under study, holding the cost per ASM constant. The third variance measures the impact of a change in capacity actually used. The variance is simply the change in RPMs over the period under study, holding the cost per ASM constant.
THE DATA SET
Data were obtained from two sources: The International Civil Aviation Organization, FinancialData:CommercialAirCarriers,SeriesF and Traffic:CommercialAirCarriers,SeriesT, and from the U.S. Department of Transportation, Bureau of Transportation Statistics, Transtats AviationDatabase. We chose three, three-year time periods for the analysis, 2001 to 2003, 2004 to 2006,

27
JTRF Volume 52 No. 1, Spring 2013
and 2007 to 2009. We also examine the one-year period from 2009 to 2010 to include the last year of Alaska’s strategic plan. The three-year time frame is consistent with the work of Caster and Scheraga (2011).
Alaska Airlines is a U.S. network air carrier, as classified by the Department of Transportation, therefore, we collected data on the other network air carriers for benchmarking purposes. In the first two three-year time periods, we construct a composite based on the seven network carriers: Alaska, American, Continental, Delta, Northwest, United, and US Airways. In the last three-year time period, US Airways was dropped from the analysis due to its merger with America West, which would make the data non-comparable to the earlier periods.
RESULTS OF THE STRATEGIC VARIANCE ANALYSIS
Table 1 provides the financial data for Alaska Airlines. It is interesting to note, just from the raw data, that operating profit changed dramatically during the period. For the year ended December 31, 2000, Alaska Airlines reported a net operating loss of $12,375,000. The annual operating loss grew to $103,629,000 for the year ended December 31, 2006. But three years later, they reported an annual net operating profit of $208,421,000.
Table 1: Alaska Airlines – Financial Data ($)2000 2003 2006 2009
Operating revenues 1,759,867,000 2,027,376,000 2,692,507,000 3,005,999,000
Operating expenses 1,772,242,000 2,037,996,000 2,796,136,000 2,797,578,000
Flying operations 662,612,000 737,423,000 1,141,147,000 1,014,188,000
Maintenance 204,115,000 244,001,000 269,370,000 293,567,000Depreciation and amortization 83,860,000 119,467,000 137,811,000 178,488,000
User charges 35,185,000 57,771,000 51,976,000 54,161,000
Station expenses 266,623,000 346,011,000 393,344,000 369,387,000
Aircraft and traffic servicing 301,808,000 403,782,000 445,320,000 423,548,000
Passenger services 155,622,000 200,381,000 207,062,000 211,298,000
Promotion and sales 248,499,000 218,672,000 209,078,000 176,864,000
General & Administrative 104,851,000 103,267,000 364,515,000 216,133,000
Transport related expenses 10,875,000 11,003,000 21,833,000 283,492,000
Operating profit -12,375,000 -10,620,000 -103,629,000 208,421,000
Data Source: International Civil Aviation Organization, FinancialData:CommercialAirCarriers,SeriesF, Montreal, Quebec, Canada, 2000, 2003, 2006, and 2009
Table 2 provides the operating data and Table 3 provides the fuel data for Alaska Airlines needed to perform the strategic variance analysis. Table 4 reclassifies the operating data to show fuel costs, flight-related costs less fuel costs, and passenger-related costs, the three cost drivers used in prior studies (e.g., Caster and Scheraga 2011, Mudde and Sopariwala 2008). Table 5 uses the data from Tables 2, 3, and 4 to calculate the data needed for strategic variance analysis of Alaska Airlines.

Alaska Airlines
28
Table 2: Alaska Airlines – Operational Data2000 2003 2006 2009
Revenue passengers 13,512,111 15,046,919 17,148,313 15,523,498Revenue passenger miles 11,976,022,528 14,553,539,641 17,810,371,493 18,315,689,560Available seat miles 17,291,684,686 20,803,557,288 23,257,684,435 23,070,335,242
Data Source: International Civil Aviation Organization, Traffic:CommercialAirCarriers,SeriesT, Montreal, Quebec, Canada, 2000, 2003, 2006, and 2009
Table 3: Alaska Airlines – Fuel Data2000 2003 2006 2009
Total gallons used 302,437,826 336,686,178 353,844,599 303,896,417Total fuel costs 286,073,111 296,732,291 716,950,639 529,385,990Average fuel cost per gallon ($) 0.95 0.88 2.03 1.74
Data Source: U. S. Department of Transportation, Research and Innovative Administration, Bureau of Transportation Statistics, TranStatsDatabase, Washington, D.C., 2000, 2003, 2006, and 2009
Table 4: Alaska Airlines – Reclassified Financial Data ($)2000 2003 2006 2009
Total operating revenues 1,759,867,000 2,027,376,000 2,692,507,000 3,005,999,000Less: Total operating expenses 1,772,242,000 2,037,996,000 2,796,136,000 2,797,578,000Fuel costs 286,073,111 296,732,291 716,950,639 529,385,990Flight-related costs 935,861,889 1,118,809,709 1,424,787,361 1,667,780,010Passenger-related costs 550,307,000 622,454,000 654,398,000 600,412,000Operating income/(loss) -12,375,000 -10,620,000 -103,629,000 208,421,000
2000 2003 2006 2009Flying operations 662,612,000 737,423,000 1,141,147,000 1,014,188,000Less: Fuel Cost 286,073,111 296,732,291 716,950,639 529,385,990Flying operations (excluding fuel cost) 376,538,889 440,690,709 424,196,361 484,802,010
Maintenance 204,115,000 244,001,000 269,370,000 293,567,000Passenger service 155,622,000 200,381,000 207,062,000 211,298,000General and administrative 104,851,000 103,267,000 364,515,000 216,133,000Depreciation and amortization 83,860,000 119,467,000 137,811,000 178,488,000Transport related 10,875,000 11,003,000 21,833,000 283,492,000Total flight-related costs 935,861,889 1,118,809,709 1,424,787,361 1,667,780,010
2000 2003 2006 2009Aircraft and traffic servicing 301,808,000 403,782,000 445,320,000 423,548,000Promotion and sales 248,499,000 218,672,000 209,078,000 176,864,000Total passenger-related costs 550,307,000 622,454,000 654,398,000 600,412,000
Data Sources: 1) Data Source: International Civil Aviation Organization, FinancialData:CommercialAirCarriers,SeriesF, Montreal, Quebec, Canada, 2003, 2006, and 2009 and 2) U. S. Department of Transportation, Research and Innovative Administration, Bureau of Transportation Statistics, TranStatsDatabase, Washington, D. C., 2003, 2006, and 2009
29
JTRF Volume 52 No. 1, Spring 2013
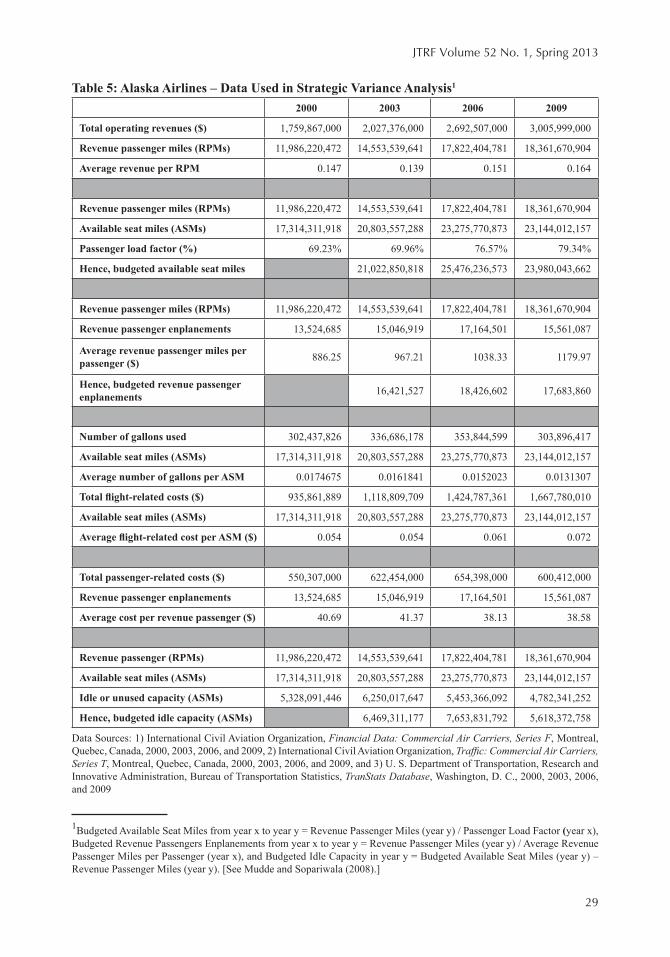
Table 5: Alaska Airlines – Data Used in Strategic Variance Analysis1
2000 2003 2006 2009
Total operating revenues ($) 1,759,867,000 2,027,376,000 2,692,507,000 3,005,999,000
Revenue passenger miles (RPMs) 11,986,220,472 14,553,539,641 17,822,404,781 18,361,670,904
Average revenue per RPM 0.147 0.139 0.151 0.164
Revenue passenger miles (RPMs) 11,986,220,472 14,553,539,641 17,822,404,781 18,361,670,904
Available seat miles (ASMs) 17,314,311,918 20,803,557,288 23,275,770,873 23,144,012,157
Passenger load factor (%) 69.23% 69.96% 76.57% 79.34%
Hence, budgeted available seat miles 21,022,850,818 25,476,236,573 23,980,043,662
Revenue passenger miles (RPMs) 11,986,220,472 14,553,539,641 17,822,404,781 18,361,670,904
Revenue passenger enplanements 13,524,685 15,046,919 17,164,501 15,561,087
Average revenue passenger miles per passenger ($) 886.25 967.21 1038.33 1179.97
Hence, budgeted revenue passenger enplanements 16,421,527 18,426,602 17,683,860
Number of gallons used 302,437,826 336,686,178 353,844,599 303,896,417
Available seat miles (ASMs) 17,314,311,918 20,803,557,288 23,275,770,873 23,144,012,157
Average number of gallons per ASM 0.0174675 0.0161841 0.0152023 0.0131307
Total flight-related costs ($) 935,861,889 1,118,809,709 1,424,787,361 1,667,780,010
Available seat miles (ASMs) 17,314,311,918 20,803,557,288 23,275,770,873 23,144,012,157
Average flight-related cost per ASM ($) 0.054 0.054 0.061 0.072
Total passenger-related costs ($) 550,307,000 622,454,000 654,398,000 600,412,000
Revenue passenger enplanements 13,524,685 15,046,919 17,164,501 15,561,087
Average cost per revenue passenger ($) 40.69 41.37 38.13 38.58
Revenue passenger (RPMs) 11,986,220,472 14,553,539,641 17,822,404,781 18,361,670,904
Available seat miles (ASMs) 17,314,311,918 20,803,557,288 23,275,770,873 23,144,012,157
Idle or unused capacity (ASMs) 5,328,091,446 6,250,017,647 5,453,366,092 4,782,341,252
Hence, budgeted idle capacity (ASMs) 6,469,311,177 7,653,831,792 5,618,372,758
Data Sources: 1) International Civil Aviation Organization, FinancialData:CommercialAirCarriers,SeriesF, Montreal, Quebec, Canada, 2000, 2003, 2006, and 2009, 2) International Civil Aviation Organization, Traffic:CommercialAirCarriers,SeriesT, Montreal, Quebec, Canada, 2000, 2003, 2006, and 2009, and 3) U. S. Department of Transportation, Research and Innovative Administration, Bureau of Transportation Statistics, TranStatsDatabase, Washington, D. C., 2000, 2003, 2006, and 2009
1Budgeted Available Seat Miles from year x to year y = Revenue Passenger Miles (year y) / Passenger Load Factor (year x), Budgeted Revenue Passengers Enplanements from year x to year y = Revenue Passenger Miles (year y) / Average Revenue Passenger Miles per Passenger (year x), and Budgeted Idle Capacity in year y = Budgeted Available Seat Miles (year y) – Revenue Passenger Miles (year y). [See Mudde and Sopariwala (2008).]

Alaska Airlines
30
Table 6a provides the strategic variance analysis for Alaska Airlines and six other network carriers for the three-year time frame ending December 31, 2003. The first column shows the results for Alaska Airlines, and the last column is a composite of all of network carriers in the sample. The annual net operating loss in 2003 was $10.6 million, an improvement of approximately $1.8 million compared with 2000 (Table 1). Strategic variance analysis provides a breakdown of the change in annual operating profitability. Alaska Airlines achieved productivity gains of nearly $84 million. More than half of the gain is from passenger-related costs, i.e., lower costs due to flying more miles per passenger. The growth component contributed approximately $59 million to increased profitability. All of that increase is due to the revenue effect of growth, meaning that Alaska Airlines had higher RPMs in 2003 than in 2000. In contrast, the price-recovery component showed a large decrease of approximately $93 million. Nearly all of that decrease is due to the revenue effects, meaning that Alaska Airlines charged lower airfares in 2003 than in 2000. The capacity underutilization component shows a decrease of more than $48 million. A large increase in ASMs led to a $190 million decrease in operating profits due to underutilization of available capacity. However, by increasing its RPMs in the period, Alaska enjoyed a $139.5 million increase in operating profits due to the capacity it actually used.
Table 6b provides the strategic variance analysis for Alaska Airlines and six other network carriers for the three-year time frame ending December 31, 2006. The net operating loss increased by approximately $93 million compared with December 31, 2003 (Table 1). The strategic variance analysis reveals results very similar to the prior period. Alaska Airlines’ operating profits improved by almost $73 million due to the growth component, with all of that improvement attributable to the revenue effect of growth. Productivity gains were achieved from all three measures, amounting to an improvement of $166.2 million in annual operating profits. Capacity underutilization was not material in this period, although the pattern was similar to the prior period in terms of unused ASMs and RPMs actually flown. However, the decrease in profitability due to the price-recovery component of more than $334 million in the period overwhelmed the increases in the other three components. Although Alaska Airlines raised its fares in this time period, the revenue effect of fare increases was not sufficient to recover increased costs of fuel, primarily, and also other flight-related costs.
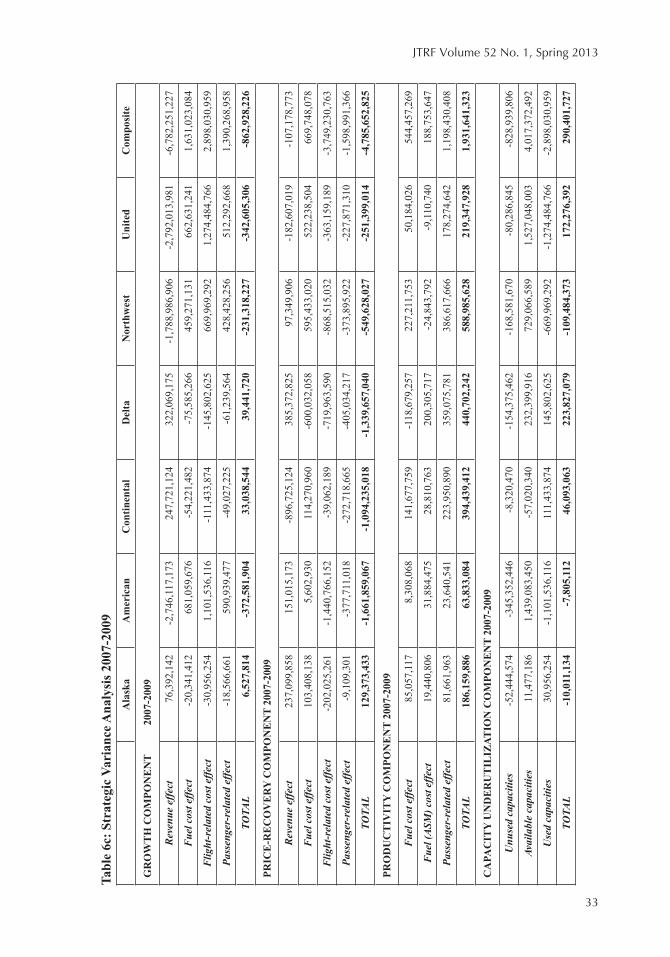
Table 6c provides the strategic variance analysis for Alaska Airlines and five other network carriers for the three-year time frame ending December 31, 2009. Alaska Airlines experienced dramatic improvement in its annual operating profits, going from a loss of $103.6 million to a profit of $208.4 million (Table 1). The first three components of the strategic variance analysis show positive impacts on annual operating profits. The growth component was much less of a factor than in the previous two periods, contributing just $6.5 million to increased profitability. Productivity gains were quite significant, contributing $186.2 million to increased profitability. Alaska Airlines was able to significantly reduce the amount of jet fuel used, resulting in a savings of approximately $85 million. It also had a savings of $81.7 million in passenger-related costs by flying more miles per passenger than in the earlier period. Perhaps most interesting is the $129.4 million increase in annual operating profits due to the price-recovery component. The revenue effect of price-recovery shows that Alaska Airlines was able to charge higher fares, which helped to recover higher flight-related costs. They also achieved some cost savings in fuel costs during the period. Capacity underutilization was relatively insignificant during the period, with a decrease in operating profitability of approximately $10 million. The fact that management was able to increase profitability through higher airfares and through further gains in productivity shows that a blended strategy, as discussed in Caster and Scheraga (2011) was in use during this three-year period.

31
JTRF Volume 52 No. 1, Spring 2013
Tabl
e 6a
: Str
ateg
ic V
aria
nce A
naly
sis 2
001-
2003
Ala
ska
Am
eric
anC
ontin
enta
lD
elta
Nor
thw
est
Uni
ted
US
Air
way
sC
ompo
site
GR
OW
TH
CO
MPO
NE
NT
2001
-200
3
Rev
enue
effe
ct
378,
764,
093
542,
547,
377
-795
,290
,979
-2,6
47,8
08,2
99-1
,474
,097
,506
-3,5
07,6
58,4
20-1
,784
,221
,315
-9,2
32,6
78,9
35
Fue
l cos
t effe
ct
-61,
569,
552
-65,
736,
738
112,
306,
023
305,
811,
129
235,
419,
092
419,
454,
747
217,
716,
581
1,18
1,31
7,90
8
Flig
ht-r
elat
ed c
ost e
ffect
-1
39,5
00,5
79-2
02,0
26,3
2429
8,06
1,67
71,
002,
067,
784
513,
324,
575
1,41
8,48
9,06
875
0,98
2,71
63,
547,
436,
803
Pas
seng
er-r
elat
ed e
ffect
-1
18,4
38,7
98-1
60,5
84,6
2923
1,45
3,81
972
2,53
0,89
647
8,92
3,29
099
2,81
0,81
650
8,83
2,69
72,
688,
384,
420
TOTA
L59
,255
,164
114,
199,
686
-153
,469
,460
-617
,398
,489
-246
,430
,549
-676
,903
,789
-306
,689
,321
-1,8
15,5
39,8
04
PR
ICE
-RE
CO
VE
RY
CO
MPO
NE
NT
2001
-200
3
Rev
enue
effe
ct
-111
,255
,093
-1,2
56,3
47,3
77-1
,000
,592
,021
1,52
9,98
8,29
9-2
98,7
27,4
94-2
,425
,892
,580
-635
,371
,685
-4,2
53,2
84,0
65
Fue
l cos
t effe
ct
23,7
27,2
16-2
96,7
49,2
05-8
,277
,005
-320
,690
,710
43,9
72,3
99-3
20,7
43,6
9662
,554
,603
-818
,195
,494
Flig
ht-r
elat
ed c
ost e
ffect
4,
982,
349
-1,5
64,3
86,9
633,
961,
889
-2,7
43,7
83,8
95-4
71,6
16,5
18-5
06,7
49,1
11-2
91,0
09,4
23-5
,452
,683
,518
Pas
seng
er-r
elat
ed e
ffect
-1
0,51
8,69
376
2,69
4,65
812
4,37
7,85
4-3
09,5
39,1
66-3
2,65
8,77
330
0,23
0,29
6-8
,588
,462
636,
226,
823
TOTA
L-9
3,06
4,22
0-2
,354
,788
,887
-880
,529
,282
-1,8
44,0
25,4
73-7
59,0
30,3
86-2
,953
,155
,090
-872
,414
,966
-9,8
87,9
36,2
54
PRO
DU
CT
IVIT
Y C
OM
PON
EN
T 20
01-2
003
Fue
l cos
t effe
ct
24,1
92,1
2114
0,26
1,78
311
2,54
8,76
016
7,28
0,63
756
,584
,736
176,
437,
081
87,0
11,7
4575
0,16
6,83
4
Fue
l (A
SM) c
ost e
ffect
2,
991,
035
13,8
22,8
4920
,359
,221
23,0
41,2
5613
,371
,442
109,
350,
508
29,4
19,0
7121
0,57
7,88
0
Pas
seng
er-r
elat
ed e
ffect
56
,810
,491
5,31
1,97
116
0,67
0,32
714
2,73
4,27
0-6
3,95
7,51
718
8,40
2,88
730
3,73
6,76
495
0,62
3,75
7
TOTA
L83
,993
,646
159,
396,
602
293,
578,
308
333,
056,
163
5,99
8,66
147
4,19
0,47
642
0,16
7,58
01,
911,
368,
472
CA
PAC
ITY
UN
DE
RU
TIL
IZAT
ION
CO
MPO
NE
NT
2001
-200
3
Unu
sed
capa
citie
s 2,
139,
670
-583
,709
,853
1,25
9,40
3-9
46,5
83,5
80-1
38,5
64,3
55-1
56,1
83,3
86-1
06,0
42,8
48-1
,841
,908
,757
Ava
ilabl
e ca
paci
ties
-190
,069
,839
-224
,132
,872
480,
053,
707
1,46
0,49
7,16
371
1,27
5,20
42,
435,
963,
858
1,23
8,99
6,27
05,
710,
889,
146
Use
d ca
paci
ties
139,
500,
579
202,
026,
324
-298
,061
,677
-1,0
02,0
67,7
84-5
13,3
24,5
75-1
,418
,489
,068
-750
,982
,716
-3,5
47,4
36,8
03
TOTA
L-4
8,42
9,59
0-6
05,8
16,4
0118
3,25
1,43
4-4
88,1
54,2
0159
,386
,273
861,
291,
403
381,
970,
707
321,
543,
586

Alaska Airlines
32
Tabl
e 6b
: Str
ateg
ic V
aria
nce A
naly
sis 2
004-
2006
Ala
ska
Am
eric
anC
ontin
enta
lD
elta
Nor
thw
est
Uni
ted
US
Air
way
sC
ompo
site
GR
OW
TH
CO
MPO
NE
NT
200
4-20
06
Rev
enue
effe
ct
453,
691,
878
2,81
1,77
5,91
52,
496,
491,
053
1,53
1,73
5,62
755
3,88
8,04
81,
727,
294,
826
-66,
291,
108
9,85
5,63
0,11
7
Fue
l cos
t effe
ct
-66,
403,
583
-388
,327
,209
-358
,212
,552
-171
,911
,836
-84,
464,
216
-248
,461
,285
7,09
4,39
4-1
,317
,325
,858
Flig
ht-r
elat
ed c
ost e
ffect
-1
75,1
51,5
40-1
,375
,345
,063
-1,0
61,9
55,9
29-8
13,1
47,8
17-2
27,5
98,0
43-8
90,3
24,6
0233
,377
,004
-4,7
80,1
85,9
49
Pas
seng
er-r
elat
ed e
ffect
-1
39,2
94,4
99-7
68,2
32,9
01-7
28,6
49,8
36-3
90,9
41,7
19-1
91,6
34,6
32-5
14,4
21,3
1417
,788
,048
-2,8
20,9
43,5
81
TOTA
L72
,842
,256
279,
870,
742
347,
672,
736
155,
734,
255
50,1
91,1
5874
,087
,625
-8,0
31,6
6393
7,17
4,72
9
PR
ICE
-RE
CO
VE
RY
CO
MPO
NE
NT
2004
-200
6
Rev
enue
effe
ct
211,
439,
122
2,27
8,24
7,08
53,
180,
486,
947
1,60
4,37
0,37
32,
817,
239,
952
4,20
8,83
5,17
41,
380,
200,
108
15,3
33,7
74,8
83
Fue
l cos
t effe
ct
-471
,710
,024
-3,8
28,4
38,1
85-1
,853
,965
,777
-2,9
20,8
95,5
35-2
,246
,447
,729
-2,8
41,0
63,8
47-1
,007
,233
,236
-15,
222,
020,
603
Flig
ht-r
elat
ed c
ost e
ffect
-1
33,2
42,9
2586
5,32
0,87
9-1
,671
,102
,977
503,
537,
331
-700
,464
,092
-1,0
29,3
14,3
59-1
58,5
19,8
29-2
,032
,146
,563
Pas
seng
er-r
elat
ed e
ffect
59
,044
,396
436,
067,
853
25,4
00,9
70-1
60,7
08,6
2435
3,83
3,64
368
7,41
8,91
521
7,98
3,66
51,
493,
693,
325
TOTA
L-3
34,4
69,4
32-2
48,8
02,3
68-3
19,1
80,8
37-9
73,6
96,4
5522
4,16
1,77
41,
025,
875,
882
432,
430,
708
-426
,698
,958
PR
OD
UC
TIV
ITY
CO
MPO
NE
NT
2004
-200
6
Fue
l cos
t effe
ct
50,0
35,5
3248
1,70
9,09
320
4,17
4,23
136
5,69
8,50
619
4,44
5,73
687
,427
,468
56,8
14,4
111,
508,
342,
435
Fue
l (A
SM) c
ost e
ffect
67
,859
,727
560,
049,
736
212,
520,
098
251,
902,
660
313,
814,
762
340,
760,
327
105,
158,
016
1,84
2,93
3,70
7
Pas
seng
er-r
elat
ed e
ffect
48
,306
,103
246,
734,
048
268,
723,
866
879,
725,
343
8,55
4,98
926
9,62
8,39
916
8,60
8,28
72,
121,
185,
256
TOTA
L16
6,20
1,36
31,
288,
492,
877
685,
418,
195
1,49
7,32
6,50
951
6,81
5,48
769
7,81
6,19
333
0,58
0,71
55,
472,
461,
399
CA
PAC
ITY
UN
DE
RU
TIL
IZAT
ION
CO
MPO
NE
NT
2004
-200
6
Unu
sed
capa
citie
s -4
0,75
2,43
021
4,46
7,76
4-3
78,2
68,9
3513
4,23
5,78
7-1
25,3
92,9
98-2
24,1
54,2
81-4
4,11
9,99
4-4
81,3
62,3
97
Ava
ilabl
e ca
paci
ties
-131
,982
,297
-649
,794
,077
-1,0
16,8
42,0
88-4
38,7
42,9
1216
4,85
5,53
7-4
59,6
79,0
2133
5,69
2,23
8-2
,470
,754
,722
Use
d ca
paci
ties
175,
151,
540
1,37
5,34
5,06
31,
061,
955,
929
813,
147,
817
227,
598,
043
890,
324,
602
-33,
377,
004
4,78
0,18
5,94
9
TOTA
L2,
416,
813
940,
018,
750
-333
,155
,094
508,
640,
691
267,
060,
581
206,
491,
299
258,
195,
240
1,82
8,06
8,83
0
33
JTRF Volume 52 No. 1, Spring 2013
Tabl
e 6c
: Str
ateg
ic V
aria
nce A
naly
sis 2
007-
2009
A
lask
aA
mer
ican
Con
tinen
tal
Del
taN
orth
wes
tU
nite
dC
ompo
site
GR
OW
TH
CO
MPO
NE
NT
2
007-
2009
Rev
enue
effe
ct76
,392
,142
-2,7
46,1
17,1
7324
7,72
1,12
432
2,06
9,17
5-1
,788
,986
,906
-2,7
92,0
13,9
81-6
,782
,251
,227
Fue
l cos
t effe
ct-2
0,34
1,41
268
1,05
9,67
6-5
4,22
1,48
2-7
5,58
5,26
645
9,27
1,13
166
2,63
1,24
11,
631,
023,
084
Flig
ht-r
elat
ed c
ost e
ffect
-30,
956,
254
1,10
1,53
6,11
6-1
11,4
33,8
74-1
45,8
02,6
2566
9,96
9,29
21,
274,
484,
766
2,89
8,03
0,95
9
Pass
enge
r-re
late
d ef
fect
-18,
566,
661
590,
939,
477
-49,
027,
225
-61,
239,
564
428,
428,
256
512,
292,
668
1,39
0,26
8,95
8
TOTA
L6,
527,
814
-372
,581
,904
33,0
38,5
4439
,441
,720
-231
,318
,227
-342
,605
,306
-862
,928
,226
PRIC
E-R
EC
OV
ER
Y C
OM
PON
EN
T 20
07-2
009
Rev
enue
effe
ct23
7,09
9,85
815
1,01
5,17
3-8
96,7
25,1
2438
5,37
2,82
597
,349
,906
-182
,607
,019
-107
,178
,773
Fue
l cos
t effe
ct10
3,40
8,13
85,
602,
930
114,
270,
960
-600
,032
,058
595,
433,
020
522,
238,
504
669,
748,
078
Flig
ht-r
elat
ed c
ost e
ffect
-202
,025
,261
-1,4
40,7
66,1
52-3
9,06
2,18
9-7
19,9
63,5
90-8
68,5
15,0
32-3
63,1
59,1
89-3
,749
,230
,763
Pass
enge
r-re
late
d ef
fect
-9,1
09,3
01-3
77,7
11,0
18-2
72,7
18,6
65-4
05,0
34,2
17-3
73,8
95,9
22-2
27,8
71,3
10-1
,598
,991
,366
TOTA
L12
9,37
3,43
3-1
,661
,859
,067
-1,0
94,2
35,0
18-1
,339
,657
,040
-549
,628
,027
-251
,399
,014
-4,7
85,6
52,8
25
PRO
DU
CT
IVIT
Y C
OM
PON
EN
T 20
07-2
009
Fue
l cos
t effe
ct85
,057
,117
8,30
8,06
814
1,67
7,75
9-1
18,6
79,2
5722
7,21
1,75
350
,184
,026
544,
457,
269
Fue
l (A
SM) c
ost e
ffect
19,4
40,8
0631
,884
,475
28,8
10,7
6320
0,30
5,71
7-2
4,84
3,79
2-9
,110
,740
188,
753,
647
Pass
enge
r-re
late
d ef
fect
81,6
61,9
6323
,640
,541
223,
950,
890
359,
075,
781
386,
617,
666
178,
274,
642
1,19
8,43
0,40
8
TOTA
L18
6,15
9,88
663
,833
,084
394,
439,
412
440,
702,
242
588,
985,
628
219,
347,
928
1,93
1,64
1,32
3
CA
PAC
ITY
UN
DE
RU
TIL
IZAT
ION
CO
MPO
NE
NT
2007
-200
9
Unu
sed
capa
citie
s-5
2,44
4,57
4-3
45,3
52,4
46-8
,320
,470
-154
,375
,462
-168
,581
,670
-80,
286,
845
-828
,939
,806
Avai
labl
e ca
paci
ties
11,4
77,1
861,
439,
083,
450
-57,
020,
340
232,
399,
916
729,
066,
589
1,52
7,04
8,00
34,
017,
372,
492
Use
d ca
paci
ties
30,9
56,2
54-1
,101
,536
,116
111,
433,
874
145,
802,
625
-669
,969
,292
-1,2
74,4
84,7
66-2
,898
,030
,959
TOTA
L-1
0,01
1,13
4-7
,805
,112
46,0
93,0
6322
3,82
7,07
9-1
09,4
84,3
7317
2,27
6,39
229
0,40
1,72
7

Alaska Airlines
34
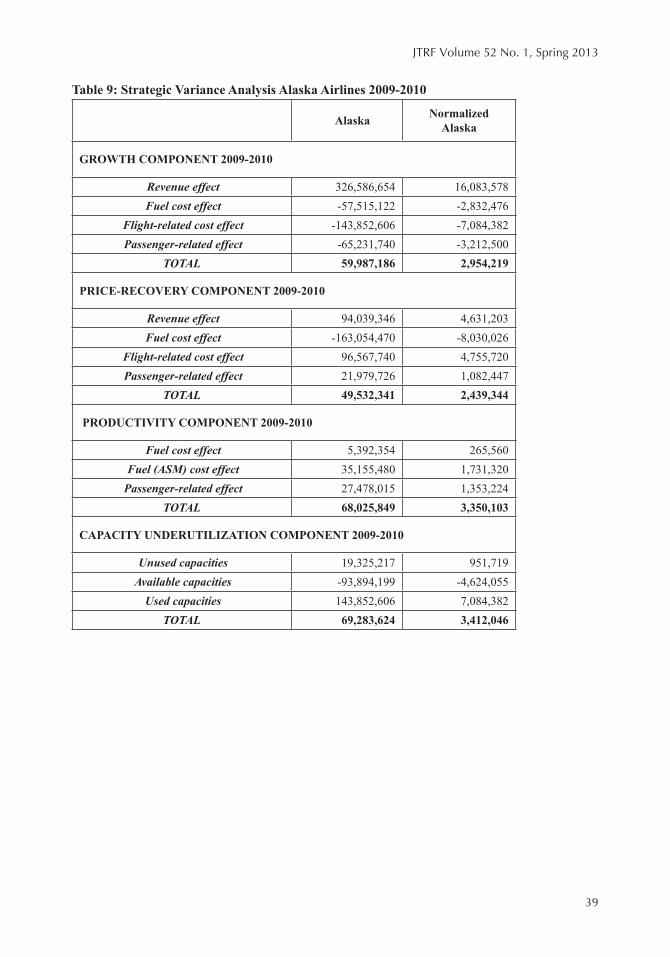
Table 9 provides the strategic variance analysis for Alaska Airlines for the last year of the long-term strategic plan. Other network carriers are not included because the group changed yet again with the merger of Northwest Airlines into Delta. The analysis shows that Alaska experienced continued and significant growth in profitability due to growth in the market. In 2007, Alaska began adding service to Hawaii, and by 2010, that market represented 15% of its total network (Ayer 2011).
The price-recovery component for 2010 shows a contribution to net operating profits of $49.5 million, achieved primarily through higher airfares. Productivity gains contributed $68 million, primarily due to fuel cost savings and passenger-related savings. In addition, Alaska Airlines made much better use of capacity, achieving a gain in profitability of $69.3 million. According to Ayer (2010), Alaska reduced its capacity on routes with low demand while increasing capacity on routes with higher demand, particularly the routes to Hawaii.
On the surface, it would appear as if the Alaska 2010 strategic plan was a huge success. However, it is not sufficient to look at the performance of Alaska Airlines in a vacuum. Benchmarking against the other network air carriers is necessary to determine just how successful the plan has been. Tables 7a, 7b, and 7c provide rankings for the network carriers, after normalizing the data for size differences by dividing by RPMs. Alaska Airlines ranked first in the growth component in the earliest period, second in the middle period, and third in the last three-year period. This analysis shows that for most of the time, Alaska Airlines was among the leaders in increased market share as air travel recovered and grew after the tragedy of 9/11.
The price-recovery component directly corresponds to Porter’s (1980) product differentiation strategy. It is interesting to note that Alaska Airlines ranked first during the three years ending December 31, 2003, and December 31, 2009. But for the three years ending December 31, 2006, it ranked last. The productivity component directly corresponds to Porter’s (1980) cost leadership strategy. Alaska ranked second in the first two, three-year periods, and improved to a first place ranking in the third, three-year period. Its consistently high ranking on this component suggests that Alaska 2010 was focused primarily on cutting costs and becoming the low-cost leader in the industry. However, it is also evident that management is using a blended strategy, since it ranked first in price-recovery for two of the three periods.
Alaska Airlines ranked fifth and sixth over the nine years in terms of capacity underutilization. This suggests that managing capacity was not a major focus of the Alaska 2010 strategic plan, or, if it was, then the competition continues to do a better job than Alaska at managing capacity. Going forward, this also suggests that management may be able to increase future profitability by improving its use of capacity.
As shown in Tables 6a, 6b, and 6c, Alaska Airlines experienced increases in annual operating profits due to growth in the market. The growth component, however, is impacted by exogenous factors as well as endogenous factors. Horngren et al. (2012) provide an adjustment to the growth component to estimate how much of the growth component is due to management’s strategic decisions (endogenous factors). The estimate is based on the overall growth in the market, in this case, the composite figures for the network carriers. For example, if the market grew by 50%, then 50% growth is assumed for Alaska Airlines. Any growth above and beyond 50% is assumed to be endogenous.
Table 8a shows that nearly 150% of Alaska’s growth is attributable to endogenous factors. Overall, the market actually decreased by more than 10% for the period, yet Alaska grew its market share by 21.42%. Similarly, management’s initiatives contributed 39.3% to Alaska’s growth in 2006, as shown in Table 8b, and 352% in 2009, as shown in Table 8c. In 2009, the overall market decreased by 7.64%, yet Alaska grew its market by 3%. Thus, in all three periods, management’s strategic decisions had a positive impact on growth in the market. This result is consistent with Alaska’s high ranking on productivity, as companies that follow a low cost strategy tend to exhibit growth in market share.

35
JTRF Volume 52 No. 1, Spring 2013
Tabl
e 7a
: Nor
mal
ized
Str
ateg
ic V
aria
nce A
naly
sis 2
001-
2003
Ala
ska
Am
eric
anC
ontin
enta
lD
elta
Nor
thw
est
Uni
ted
US
Air
way
sC
ompo
site
GR
OW
TH
CO
MPO
NE
NT
2001
-200
31
23
64
57
Rev
enue
effe
ct
26,0
25,5
654,
522,
050
-13,
983,
430
-29,
705,
485
-21,
537,
181
-33,
781,
010
-47,
303,
405
-18,
821,
496
Fue
l cos
t effe
ct
-4,2
30,5
55-5
47,9
061,
974,
653
3,43
0,86
33,
439,
571
4,03
9,61
95,
772,
118
2,40
8,20
4
Flig
ht-r
elat
ed c
ost e
ffect
-9
,585
,337
-1,6
83,8
595,
240,
754
11,2
42,0
947,
499,
887
13,6
60,9
6319
,910
,108
7,23
1,71
1
Pas
seng
er-r
elat
ed e
ffect
-8
,138
,144
-1,3
38,4
494,
069,
603
8,10
5,99
96,
997,
270
9,56
1,40
813
,490
,209
5,48
0,47
0
TOTA
L4,
071,
529
951,
837
-2,6
98,4
21-6
,926
,529
-3,6
00,4
53-6
,519
,019
-8,1
30,9
70-3
,701
,112
PR
ICE
-RE
CO
VE
RY
CO
MPO
NE
NT
2001
-200
3 1
43
52
76
Rev
enue
effe
ct
-7,6
44,5
38-1
0,47
1,46
5-1
7,59
3,19
417
,164
,779
-4,3
64,5
34-2
3,36
2,90
8-1
6,84
5,02
0-8
,670
,633
Fue
l cos
t effe
ct
1,63
0,34
0-2
,473
,360
-145
,533
-3,5
97,7
9664
2,45
5-3
,088
,968
1,65
8,45
2-1
,667
,952
Flig
ht-r
elat
ed c
ost e
ffect
34
2,34
6-1
3,03
8,92
869
,661
-30,
782,
225
-6,8
90,5
15-4
,880
,320
-7,7
15,2
63-1
1,11
5,69
7
Pas
seng
er-r
elat
ed e
ffect
-7
22,7
586,
356,
944
2,18
6,90
9-3
,472
,688
-477
,158
2,89
1,41
1-2
27,6
981,
296,
995
TOTA
L-6
,394
,611
-19,
626,
808
-15,
482,
157
-20,
687,
929
-11,
089,
751
-28,
440,
786
-23,
129,
529
-20,
157,
286
PRO
DU
CT
IVIT
Y C
OM
PON
EN
T 20
01-2
003
26
35
74
1
Fue
l cos
t effe
ct
1,66
2,28
41,
169,
061
1,97
8,92
11,
876,
704
826,
727
1,69
9,20
32,
306,
862
1,52
9,27
0
Fue
l (A
SM) c
ost e
ffect
20
5,51
911
5,21
135
7,97
225
8,49
719
5,36
21,
053,
116
779,
961
429,
279
Pas
seng
er-r
elat
ed e
ffect
3,
903,
551
44,2
742,
825,
032
1,60
1,32
1-9
34,4
461,
814,
441
8,05
2,69
11,
937,
917
TOTA
L5,
771,
355
1,32
8,54
65,
161,
924
3,73
6,52
287
,643
4,56
6,76
011
,139
,513
3,89
6,46
5
CA
PAC
ITY
UN
DE
RU
TIL
IZAT
ION
C
OM
PON
EN
T 20
01-2
003
56
37
42
1
Unu
sed
capa
citie
s 14
7,02
1-4
,865
,133
22,1
44-1
0,61
9,62
2-2
,024
,483
-1,5
04,1
47-2
,811
,416
-3,7
54,8
67
Ava
ilabl
e ca
paci
ties
-13,
060,
042
-1,8
68,1
138,
440,
681
16,3
85,1
6510
,392
,028
23,4
59,9
0132
,848
,359
11,6
42,0
68
Use
d ca
paci
ties
9,58
5,33
71,
683,
859
-5,2
40,7
54-1
1,24
2,09
4-7
,499
,887
-13,
660,
963
-19,
910,
108
-7,2
31,7
11
TOTA
L-3
,327
,685
-5,0
49,3
883,
222,
071
-5,4
76,5
5186
7,65
88,
294,
791
10,1
26,8
3565
5,49
0
Not
e: N
umbe
rs in
shad
ed a
reas
are
rank
ings
, fro
m 1
to 7
, of t
he e
ffect
of a
com
pone
nt o
n op
erat
ing
inco
me.

Alaska Airlines
36
Tabl
e 7b
: Nor
mal
ized
Str
ateg
ic V
aria
nce A
naly
sis 2
004-
2006
Ala
ska
Am
eric
anC
ontin
enta
lD
elta
Nor
thw
est
Uni
ted
US
Air
way
sC
ompo
site
GR
OW
TH
CO
MPO
NE
NT
2004
-200
62
31
45
67
Rev
enue
effe
ct
25,4
73,4
6520
,175
,983
32,7
47,2
2715
,511
,530
7,63
2,22
614
,735
,230
-1,7
74,9
1617
,621
,381
Fue
l cos
t effe
ct
-3,7
28,3
66-2
,786
,454
-4,6
98,7
82-1
,740
,911
-1,1
63,8
63-2
,119
,577
189,
949
-2,3
55,3
14
Flig
ht-r
elat
ed c
ost e
ffect
-9
,834
,244
-9,8
68,8
30-1
3,92
9,99
7-8
,234
,559
-3,1
36,1
57-7
,595
,193
893,
655
-8,5
46,7
37
Pas
seng
er-r
elat
ed e
ffect
-7
,820
,977
-5,5
12,4
78-9
,557
,920
-3,9
58,9
76-2
,640
,604
-4,3
88,4
3247
6,26
7-5
,043
,708
TOTA
L4,
089,
879
2,00
8,22
14,
560,
528
1,57
7,08
569
1,60
263
2,02
8-2
15,0
441,
675,
622
PR
ICE
-RE
CO
VE
RY
CO
MPO
NE
NT
2004
-200
6 7
45
63
21
Rev
enue
effe
ct
11,8
71,6
8516
,347
,631
41,7
19,4
0816
,247
,086
38,8
19,7
8135
,904
,788
36,9
54,2
6527
,416
,033
Fue
l cos
t effe
ct
-26,
485,
131
-27,
471,
074
-24,
319,
029
-29,
579,
230
-30,
954,
626
-24,
236,
586
-26,
968,
237
-27,
216,
222
Flig
ht-r
elat
ed c
ost e
ffect
-7
,481
,199
6,20
9,13
6-2
1,92
0,36
25,
099,
205
-9,6
51,9
51-8
,780
,889
-4,2
44,3
00-3
,633
,378
Pas
seng
er-r
elat
ed e
ffect
3,
315,
169
3,12
9,01
833
3,19
2-1
,627
,459
4,87
5,60
35,
864,
243
5,83
6,41
92,
670,
650
TOTA
L-1
8,77
9,47
5-1
,785
,289
-4,1
86,7
91-9
,860
,398
3,08
8,80
78,
751,
556
11,5
78,1
46-7
62,9
17
PRO
DU
CT
IVIT
Y C
OM
PON
EN
T 20
04-2
006
23
41
67
5
Fue
l cos
t effe
ct
2,80
9,34
83,
456,
518
2,67
8,21
53,
703,
344
2,67
9,33
974
5,82
71,
521,
181
2,69
6,84
2
Fue
l (A
SM) c
ost e
ffect
3,
810,
124
4,01
8,65
42,
787,
690
2,55
0,96
04,
324,
169
2,90
6,96
32,
815,
561
3,29
5,07
5
Pas
seng
er-r
elat
ed e
ffect
2,
712,
246
1,77
0,44
83,
524,
932
8,90
8,77
411
7,88
22,
300,
150
4,51
4,41
43,
792,
575
TOTA
L9,
331,
718
9,24
5,62
08,
990,
837
15,1
63,0
777,
121,
390
5,95
2,94
08,
851,
157
9,78
4,49
1
CA
PAC
ITY
UN
DE
RU
TIL
IZAT
ION
C
OM
PON
EN
T 20
04-2
006
62
73
45
1
Unu
sed
capa
citie
s -2
,288
,129
1,53
8,92
0-4
,961
,868
1,35
9,37
5-1
,727
,836
-1,9
12,2
18-1
,181
,294
-860
,652
Ava
ilabl
e ca
paci
ties
-7,4
10,4
18-4
,662
,617
-13,
338,
225
-4,4
43,0
472,
271,
605
-3,9
21,4
368,
988,
015
-4,4
17,5
88
Use
d ca
paci
ties
9,83
4,24
49,
868,
830
13,9
29,9
978,
234,
559
3,13
6,15
77,
595,
193
-893
,655
8,54
6,73
7
TOTA
L13
5,69
76,
745,
133
-4,3
70,0
965,
150,
886
3,67
9,92
61,
761,
539
6,91
3,06
73,
268,
497
Not
e: N
umbe
rs in
shad
ed a
reas
are
rank
ings
, fro
m 1
to 7
, of t
he e
ffect
of a
com
pone
nt o
n op
erat
ing
inco
me.

37
JTRF Volume 52 No. 1, Spring 2013
Tabl
e 7c
: Nor
mal
ized
Str
ateg
ic V
aria
nce A
naly
sis 2
007-
2009
A
lask
aA
mer
ican
Con
tinen
tal
Del
taN
orth
wes
tU
nite
dC
ompo
site
GR
OW
TH
CO
MPO
NE
NT
2007
-200
93
41
26
5
Rev
enue
effe
ct4,
170,
858
-22,
445,
070
3,18
8,71
93,
202,
043
-28,
747,
399
-27,
838,
296
-14,
086,
888
Fue
l cos
t effe
ct-1
,110
,600
5,56
6,56
2-6
97,9
50-7
51,4
767,
380,
071
6,60
6,88
83,
387,
672
Flig
ht-r
elat
ed c
ost e
ffect
-1,6
90,1
509,
003,
278
-1,4
34,4
00-1
,449
,584
10,7
65,8
0012
,707
,488
6,01
9,27
6
Pass
enge
r-re
late
d ef
fect
-1,0
13,7
034,
829,
975
-631
,089
-608
,850
6,88
4,45
45,
107,
909
2,88
7,62
0
TOTA
L35
6,40
6-3
,045
,255
425,
279
392,
133
-3,7
17,0
74-3
,416
,010
-1,7
92,3
21
PRIC
E-R
EC
OV
ER
Y C
OM
PON
EN
T 20
07-2
009
15
64
32
Rev
enue
effe
ct12
,945
,178
1,23
4,30
5-1
1,54
2,83
63,
831,
414
1,56
4,32
5-1
,820
,717
-222
,613
Fue
l cos
t effe
ct5,
645,
877
45,7
951,
470,
920
-5,9
65,5
769,
568,
069
5,20
7,07
61,
391,
082
Flig
ht-r
elat
ed c
ost e
ffect
-11,
030,
175
-11,
775,
935
-502
,817
-7,1
57,9
47-1
3,95
6,25
0-3
,620
,946
-7,7
87,2
37
Pass
enge
r-re
late
d ef
fect
-497
,350
-3,0
87,1
77-3
,510
,492
-4,0
26,8
89-6
,008
,169
-2,2
72,0
33-3
,321
,141
TOTA
L7,
063,
531
-13,
583,
012
-14,
085,
225
-13,
318,
999
-8,8
32,0
25-2
,506
,621
-9,9
39,9
09
PRO
DU
CT
IVIT
Y C
OM
PON
EN
T 20
07-2
009
16
34
25
Fue
l cos
t effe
ct4,
643,
948
67,9
051,
823,
706
-1,1
79,9
213,
651,
087
500,
369
1,13
0,85
0
Fue
l (A
SM) c
ost e
ffect
1,06
1,42
926
0,60
437
0,85
81,
991,
459
-399
,217
-90,
840
392,
046
Pass
enge
r-re
late
d ef
fect
4,45
8,58
019
3,22
32,
882,
743
3,56
9,96
66,
212,
596
1,77
7,52
12,
489,
167
TOTA
L10
,163
,957
521,
732
5,07
7,30
84,
381,
504
9,46
4,46
62,
187,
049
4,01
2,06
3
CA
PAC
ITY
UN
DE
RU
TIL
IZAT
ION
CO
MPO
NE
NT
2007
-200
95
43
16
2
Unu
sed
capa
citie
s-2
,863
,369
-2,8
22,6
98-1
07,1
03-1
,534
,816
-2,7
08,9
55-8
00,5
15-1
,721
,727
Avai
labl
e ca
paci
ties
626,
631
11,7
62,1
82-7
33,9
782,
310,
542
11,7
15,4
4015
,225
,717
8,34
4,17
3
Use
d ca
paci
ties
1,69
0,15
0-9
,003
,278
1,43
4,40
01,
449,
584
-10,
765,
800
-12,
707,
488
-6,0
19,2
76
TOTA
L-5
46,5
88-6
3,79
459
3,32
02,
225,
310
-1,7
59,3
151,
717,
714
603,
171
Not
e: N
umbe
rs in
shad
ed a
reas
are
rank
ings
, fro
m 1
to 6
, of t
he e
ffect
of a
com
pone
nt o
n op
erat
ing
inco
me.
Alaska Airlines
38
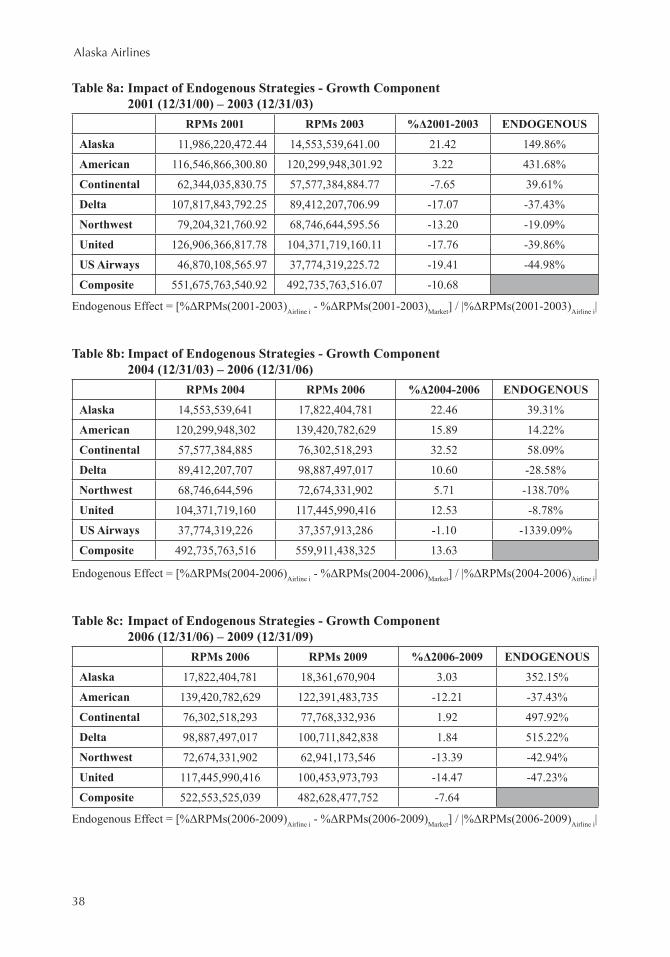
Table 8a: Impact of Endogenous Strategies - Growth Component 2001 (12/31/00) – 2003 (12/31/03)
RPMs 2001 RPMs 2003 %Δ2001-2003 ENDOGENOUS
Alaska 11,986,220,472.44 14,553,539,641.00 21.42 149.86%
American 116,546,866,300.80 120,299,948,301.92 3.22 431.68%
Continental 62,344,035,830.75 57,577,384,884.77 -7.65 39.61%
Delta 107,817,843,792.25 89,412,207,706.99 -17.07 -37.43%
Northwest 79,204,321,760.92 68,746,644,595.56 -13.20 -19.09%
United 126,906,366,817.78 104,371,719,160.11 -17.76 -39.86%
US Airways 46,870,108,565.97 37,774,319,225.72 -19.41 -44.98%
Composite 551,675,763,540.92 492,735,763,516.07 -10.68
Endogenous Effect = [%ΔRPMs(2001-2003)Airline i - %ΔRPMs(2001-2003)Market] / |%ΔRPMs(2001-2003)Airline i|
Table 8b: Impact of Endogenous Strategies - Growth Component 2004 (12/31/03) – 2006 (12/31/06)
RPMs 2004 RPMs 2006 %Δ2004-2006 ENDOGENOUS
Alaska 14,553,539,641 17,822,404,781 22.46 39.31%
American 120,299,948,302 139,420,782,629 15.89 14.22%
Continental 57,577,384,885 76,302,518,293 32.52 58.09%
Delta 89,412,207,707 98,887,497,017 10.60 -28.58%
Northwest 68,746,644,596 72,674,331,902 5.71 -138.70%
United 104,371,719,160 117,445,990,416 12.53 -8.78%
US Airways 37,774,319,226 37,357,913,286 -1.10 -1339.09%
Composite 492,735,763,516 559,911,438,325 13.63
Endogenous Effect = [%ΔRPMs(2004-2006)Airline i - %ΔRPMs(2004-2006)Market] / |%ΔRPMs(2004-2006)Airline i|
Table 8c: Impact of Endogenous Strategies - Growth Component 2006 (12/31/06) – 2009 (12/31/09)
RPMs 2006 RPMs 2009 %Δ2006-2009 ENDOGENOUS
Alaska 17,822,404,781 18,361,670,904 3.03 352.15%
American 139,420,782,629 122,391,483,735 -12.21 -37.43%
Continental 76,302,518,293 77,768,332,936 1.92 497.92%
Delta 98,887,497,017 100,711,842,838 1.84 515.22%
Northwest 72,674,331,902 62,941,173,546 -13.39 -42.94%
United 117,445,990,416 100,453,973,793 -14.47 -47.23%
Composite 522,553,525,039 482,628,477,752 -7.64
Endogenous Effect = [%ΔRPMs(2006-2009)Airline i - %ΔRPMs(2006-2009)Market] / |%ΔRPMs(2006-2009)Airline i|
39
JTRF Volume 52 No. 1, Spring 2013
Table 9: Strategic Variance Analysis Alaska Airlines 2009-2010
Alaska NormalizedAlaska
GROWTH COMPONENT 2009-2010
Revenue effect 326,586,654 16,083,578 Fuel cost effect -57,515,122 -2,832,476
Flight-related cost effect -143,852,606 -7,084,382 Passenger-related effect -65,231,740 -3,212,500
TOTAL 59,987,186 2,954,219
PRICE-RECOVERY COMPONENT 2009-2010
Revenue effect 94,039,346 4,631,203 Fuel cost effect -163,054,470 -8,030,026
Flight-related cost effect 96,567,740 4,755,720 Passenger-related effect 21,979,726 1,082,447
TOTAL 49,532,341 2,439,344
PRODUCTIVITY COMPONENT 2009-2010
Fuel cost effect 5,392,354 265,560 Fuel (ASM) cost effect 35,155,480 1,731,320
Passenger-related effect 27,478,015 1,353,224TOTAL 68,025,849 3,350,103
CAPACITY UNDERUTILIZATION COMPONENT 2009-2010
Unused capacities 19,325,217 951,719 Available capacities -93,894,199 -4,624,055
Used capacities 143,852,606 7,084,382TOTAL 69,283,624 3,412,046

Alaska Airlines
40
Tabl
e 10
a:
ASM
and
RPK
m b
y A
ircr
aft T
ype
- 200
3
(A P
refix
= A
lask
a, H
Pre
fix =
Hor
izon
, T P
refix
= T
otal
(A +
H),
ST P
refix
= S
umm
ary
Tota
l)A
irlin
eA
ircr
aft T
ype
%A
ASM
%A
RPM
%H
ASM
%H
RPM
%TA
SM%
TR
PM%
STA
SM%
STR
PM
Ala
ska
Boe
ing
737-
700/
700L
R19
.46%
20.2
1%17
.33%
18.1
6%
Ala
ska
Boe
ing
737-
400
38.5
5%37
.44%
34.3
3%33
.65%
Ala
ska
Boe
ing
737-
200C
2.91
%2.
16%
2.59
%1.
94%
Ala
ska
Boe
ing
737-
900
12.4
2%12
.97%
11.0
6%11
.66%
Ala
ska
McD
onne
ll D
ougl
as D
C9
Supe
r 80
/MD
81/8
2/83
/88
26.6
6%27
.22%
23.7
4%24
.46%
89.0
5%89
.87%
Hor
izon
De
Hav
illan
d D
HC
8-40
0 D
ash-
832
.64%
31.5
7%3.
57%
3.20
%
Hor
izon
De
Hav
illan
d D
HC
8-20
0Q D
ash-
820
.96%
20.8
1%2.
29%
2.11
%
Hor
izon
Fokk
er F
28-4
000/
6000
Fel
low
ship
0.34
%0.
38%
0.04
%0.
04%
Hor
izon
Can
adai
r R
J-70
046
.06%
47.2
3%5.
04%
4.78
%10
.94%
10.1
3%
Dat
a So
urce
: U. S
. Dep
artm
ent o
f Tra
nspo
rtatio
n, R
esea
rch
and
Inno
vativ
e Adm
inis
tratio
n, B
urea
u of
Tra
nspo
rtatio
n St
atis
tics, TranStatsD
atabase,
W
ashi
ngto
n, D
. C.,
2003
41
JTRF Volume 52 No. 1, Spring 2013
Tabl
e 10
b:
ASM
and
RPK
m b
y A
ircr
aft T
ype
- 200
6
(A P
refix
= A
lask
a, H
Pre
fix =
Hor
izon
, T P
refix
= T
otal
(A +
H),
ST P
refix
= S
umm
ary
Tota
l)A
irlin
eA
ircr
aft T
ype
%A
ASM
%A
RPM
%H
ASM
%H
RPM
%TA
SM%
TR
PM%
STA
SM%
STR
PM
Ala
ska
Boe
ing
737-
700/
700L
R19
.93%
20.2
2%17
.24%
17.5
7%
Ala
ska
Boe
ing
737-
800
11.2
4%12
.20%
9.72
%10
.60%
Ala
ska
Boe
ing
737-
400
32.0
4%30
.35%
27.7
1%26
.37%
Ala
ska
Boe
ing
737-
200C
1.13
%1.
04%
0.98
%0.
91%
Ala
ska
Boe
ing
737-
900
15.3
0%15
.73%
13.2
3%13
.66%
Ala
ska
McD
onne
ll D
ougl
as
DC
9 Su
per
80/M
D81
/82/
83/8
820
.37%
20.4
6%17
.62%
17.7
7%86
.50%
86.8
8%
Hor
izon
De
Hav
illan
d D
HC
8-40
0 D
ash-
836
.01%
35.7
8%4.
86%
4.70
%
Hor
izon
De
Hav
illan
d D
HC
8-20
0Q D
ash-
814
.67%
14.6
2%1.
98%
1.92
%
Hor
izon
Can
adai
r R
J-70
049
.32%
49.6
0%6.
66%
6.51
%13
.50%
13.1
3%
Dat
a So
urce
: U. S
. Dep
artm
ent o
f Tra
nspo
rtatio
n, R
esea
rch
and
Inno
vativ
e Adm
inis
tratio
n, B
urea
u of
Tra
nspo
rtatio
n St
atis
tics, TranStatsD
atabase,
W
ashi
ngto
n, D
. C.,
2006
Tabl
e 10
c:
ASM
and
RPK
m b
y A
ircr
aft T
ype
- 200
9
(A P
refix
= A
lask
a, H
Pre
fix =
Hor
izon
, T P
refix
= T
otal
(A +
H),
ST, P
refix
= S
umm
ary
Tota
l)A
irlin
eA
ircr
aft T
ype
%A
ASM
%A
RPM
%H
ASM
%H
RPM
%TA
SM%
TR
PM%
STA
SM%
STR
PM
Ala
ska
Boe
ing
737-
700/
700L
R11
.70%
11.4
8%10
.24%
10.1
5%
Ala
ska
Boe
ing
737-
800
55.9
0%57
.51%
48.9
3%50
.84%
Ala
ska
Boe
ing
737-
400
19.2
1%17
.49%
16.8
2%15
.46%
Ala
ska
Boe
ing
737-
900
13.1
9%13
.52%
11.5
5%11
.95%
87.5
4%88
.40%
Hor
izon
De
Hav
illan
d D
HC
8-40
0 D
ash-
859
.76%
57.3
9%7.
44%
6.65
%
Hor
izon
De
Hav
illan
d D
HC
8-20
0Q D
ash-
80.
01%
0.01
%0.
0013
%0.
0013
%
Hor
izon
Can
adai
r R
J-70
040
.23%
42.6
0%5.
01%
4.94
%12
.45%
11.5
9%
Dat
a So
urce
: U. S
. Dep
artm
ent o
f Tra
nspo
rtatio
n, R
esea
rch
and
Inno
vativ
e Adm
inis
tratio
n, B
urea
u of
Tra
nspo
rtatio
n St
atis
tics, TranStatsD
atabase,
W
ashi
ngto
n, D
. C.,
2009

Alaska Airlines
42
THE INTERACTION BETWEEM ALASKA AND HORIZON AIR INDUSTRIES AND THE IMPACT ON SVA RESULTS
Although the focus of this research is Alaska Airlines, the Alaska 2010 initiative impacted both airlines in the group, Alaska Airlines and Horizon Air Industries. During the period of this study, it is possible that Alaska Airlines shifted routes, frequencies of flights, and aircraft to its regional affiliate, Horizon Air Industries. If this occurred to a significant degree, then there might be an important impact in terms of the underlying drivers of the results of the strategic variance analysis.
ASMs and RPMs by aircraft type for both carriers were examined to try and detect route interactions between the two airlines. Conceptually, if such an interaction were of significant magnitude, then one would see a larger share of ASMs and RPMs being flown by the aircraft types of the regional affiliate airline. Table 10 shows virtually no change in ASMs and RPMs by aircraft types flown by Alaska Airlines versus those flown by Horizon Air Industries for the years ending in 2003, 2006, and 2009 (the end points of each of the periods used in the SVA analysis). Instead, Alaska Airlines phased out its usage of McDonnell Douglas aircraft in favor of more efficient ones from the single Boeing 737 family. Horizon Air Industries phased out its Fokker and De Havilland DHC8-200Q Dash-8 airplanes in favor of the more efficient De Havilland DHC8-400 Dash-8 aircraft.
In addition, the annual reports of the Alaska Air Group were examined for each year in the study. Typically, in the letter to shareholders, the CEO discusses progress made in the strategic plan for the preceding year. In only one year, 2007, was there any mention of a shift in service between the two airlines. In that year, Alaska Airlines contracted with Horizon Air Industries for the use of some 70-seat Canadair RJ-700 aircraft for certain routes for which Alaska’s Boeing 737 jets were too large to be profitable. Thus, it appears that for the entire period of the study, any interaction effects were minimal.
SUMMARY AND CONCLUSIONS
In 2003, Alaska Air Group embarked on a long-term strategic plan to transform the company. Management referred to the plan in annual reports to stockholders in 2003 and in subsequent years, marking their successes and further needs for improvement. In fact, the plan appeared to be highly successful based on the 2010 annual report to stockholders. Strategic variance analysis provides a means to assess the plan and to categorize management’s efforts in terms of Porter’s (1980) long-term strategies for business success. This paper examines Alaska Airlines’ performance in three-year time windows from 2001 to 2003, 2004 to 2006, and 2007 to 2009. In addition, we examine 2010, the last year of the strategic plan.
Strategic variance analysis shows that Alaska Airlines focused primarily on growing its share of the market and on productivity gains by cutting costs. In later years, they also followed a product differentiation strategy, raising air fares sufficiently to cover increased costs for such a strategy. Finally, they made changes in their routes to achieve greater profitability through better use of capacity.
The success of the plan may also be measured by comparison with the other network carriers. That analysis revealed that by 2009, Alaska ranked first in both productivity and price-recovery, as well as third in growth in market share. In sum, it appears that management delivered on its forecast in the 2003 annual report that 2010 would be a year where they could “look back with great pride at how we transformed ourselves” (Ayer 2004).

43
JTRF Volume 52 No. 1, Spring 2013
APPENDIXCalculation of Strategic Variances from Year i to Year j
The Growth Component1. Airline Revenues
[Revenue effect of the Growth Component (i.e., lower expected revenue due to lower RPM)]Variance = {Year i revenue/RPM} * {Year j RPMs – Year i RPMs}
2. Fuel Costs[Fuel cost effect of the Growth Component (i.e., lower expected fuel costs due to lower RPMs)]
Variance = {Year i fuel cost/gallon} * {Year i gallons used per ASM} * {Year i actual ASMs – Year j budgeted ASMs}3. Flight-related Costs
[Flight-related cost effect of the Growth Component (i.e., lower expected flight-related costs due to lower RPMs)]
Variance = {Year i cost/ASM} * {Year i passenger load factor} * {Year i actual ASMs – Year j budgeted ASMs}
4. Passenger-related Costs[Passenger-related cost effect of the Growth Component (i.e., lower expected passenger-related
costs due to lower RPMs)]Variance = {Year i cost/passenger} * {Year i revenue passengers – Year j budgeted revenue
passengers}
The Price-Recovery Component
1. Airline Revenues[Revenue effect of the Price-Recovery Component (i.e., higher revenue due to higher airfares)]
Variance = {Year j RPMs} * {Year j revenue/RPM – Year i revenue/RPM}2. Fuel Costs
[Fuel cost effect of the Price-Recovery Component (i.e., higher costs due to higher fuel prices)]Variance = {Year j budgeted ASMs} * {Year i gallons used/ASM} * {Year i fuel cost/gallon –
Year j fuel cost/gallon}
3. Flight-related Costs[Flight-related cost effect of the Price-Recovery Component (i.e., higher costs due to higher
flight-related costs per ASM)]Variance = {Year j passenger load factor} * {Year j actual ASMs} * {Year i cost/ASM – Year j
cost/ASM}4. Passenger-related Costs
[Passenger-related cost effect of the Price-Recovery Component (i.e., higher costs due to higher costs per passenger)]
Variance = {Year j budgeted revenue passengers} * {Year i cost/passenger – Year j cost/passenger}
The Productivity Component
1. Fuel Costs (a)[Fuel cost effect of the Productivity Component (i.e., lower costs due to lower fuel usage per
gallon)]Variance = {Year j fuel cost/gallon} * {Year j budgeted ASMs} * {Year i gallons used /ASM –
Year j gallons used/ASM}

Alaska Airlines
44
2. Fuel Costs (b)[Fuel (ASM) cost effect of the Productivity Component (i.e., lower costs due to higher passenger
load factor)]Variance = {Year j fuel cost/gallon} * {Year j gallons used/ASM} * {Year j budgeted ASMs –
Year j actual ASMs}3. Passenger-related costs
[Passenger-related cost effect of the Productivity Component (i.e., lower costs due to higher miles per passenger)]
Variance = {Year j cost/passenger} * {Year j budgeted revenue passengers – Year j revenue passengers}
The Capacity Underutilization Component1. Flight-related costs (a)
[Changes in flight-related costs relating to unused capacities (i.e., higher unit costs to acquire capacity that is unused)]
Variance = {Year j actual ASMs – Year j RPMs} * {Year i cost/ASM – Year j cost/ASM}
2. Flight-related costs (b)[Changes in flight-related costs of available capacities (i.e., lower underutilization due to
decrease in available capacity)]Variance = {Year i cost/ASM} * {Year i actual ASMs – Year j actual ASMs}
3. Flight-related costs (c)[Changes in flight-related costs of used capacities (i.e., higher underutilization due to decrease
in capacity used)]Variance = {Year i cost/ASM} * {Year j RPMs – Year i RPMs}

45
JTRF Volume 52 No. 1, Spring 2013
References
Ayer, William S. “Letter to Shareholders and Employees.” AlaskaAirGroupAnnualReport2003 March 10, 2004. http://library.corporate-ir.net/library/10/109/109361/Items/106136/EFF3A3BA-C9DC-4587-94FB-0CFD45A49302_2003%20Annual%20Report.pdf (Accessed May 16, 2012).
Ayer, William S. “Letter to Shareholders and Employees.” AlaskaAirGroupAnnualReport2004 April 11, 2005. http://library.corporate-ir.net/library/10/109/109361/Items/153592/17EF7CF4-7113-4391-AD01-5661E21368FB_AR2004.pdf (Accessed May 16, 2012).
Ayer, William S. “Letter to our Shareholders.” AlaskaAirGroupAnnualReport2009 April 1, 2010. http://phx.corporate-ir.net/phoenix.zhtml?c=109361&p=irol-reportsannual (Accessed May 16, 2012).
Ayer, William S. “Letter to our Shareholders.” AlaskaAirGroupAnnualReport2010 April 4, 2011. http://phx.corporate-ir.net/phoenix.zhtml?c=109361&p=irol-reportsannual (Accessed May 16, 2012).
Bailey, C., A.B. Collins, D.L. Collins, and K.R. Lambert. “An Analysis of Southwest Airlines: Applying the Horngren, Datar, and Foster (2006) Strategic Profitability Analysis Approach.” IssuesinAccountingEducation 24, no. 4 (2009): 539-551.
Banker, R.D. and H.H. Johnston. “Strategic Management Accounting and Control.” A. Wagenhofer ed. Handwörterbuch Unternehmensrechnung und Controlling. Stuttgart: Schaeffer Poeschel Publisher, 2002.
Caster, P., and C.A. Scheraga. “A Strategic Variance Analysis of the Profitability of U.S. Network Air Carriers.” JournaloftheTransportationResearchForum 50, no. 3 (2011): 113-136.
Horngren, C.T., G. Foster, and S.M. Datar. CostAccounting:AManagerialEmphasis (10thed.). Upper Saddle River, NJ: Pearson/Prentice Hall, 2000.
Horngren, C.T., S.M. Datar, and G. Foster. CostAccounting:AManagerialEmphasis (12thed.). Upper Saddle River, NJ: Pearson/Prentice Hall, 2006.
Horngren, C.T., S.M. Datar, and M. Rajan. CostAccounting:AManagerialEmphasis (12thed.). Upper Saddle River, NJ: Pearson/Prentice Hall, 2012.
International Civil Aviation Organization. Financial Data: Commercial Air Carriers, Series F. Montreal, Quebec, Canada, 2003, 2006, and 2009 .
International Civil Aviation Organization. Traffic:CommercialAirCarriers, SeriesT. Montreal, Quebec, Canada, 2003, 2006, and 2009.
Kelly, John F. “Letter to Employees and Shareholders.” AlaskaAirGroupAnnualReport 2001 March 11, 2002. http://phx.corporate-ir.net/phoenix.zhtml?c=109361&p=irol-reportsannual (accessed May 16, 2012).
Kelly, John F. “Letter to Employees and Shareholders.” AlaskaAirGroupAnnualReport 2002 April 2003. http://phx.corporate-ir.net/phoenix.zhtml?c=109361&p=irol-reportsannual (Accessed May 16, 2012).
Mudde, P.A. and P.R. Sopariwala. “Examining Southwest Airlines’ Strategic Execution: A Strategic Variance Analysis.” ManagementAccountingQuarterly 9, no.4 (2008): 20-32.
Alaska Airlines
46
Porter, M. CompetitiveStrategy:TechniquesforAnalyzingIndustriesandCompetitors. New York, NY: The Free Press, 1980.
Securities and Exchange Commission (SEC). AlaskaAirGroupForm10-KAnnualReport, 2004. http://www.sec.gov/Archives/edgar/data/766421/000095012405001049/v05863e10vk.htm.
Shank, J.K, and V. Govindarajan. Strategic Cost Management: The New Tool for CompetitiveAdvantage. New York, NY: The Free Press, 1993.
Sopariwala, P.R. “Strategic Analysis of Operating Income: An Extension of Horngren, Foster, and Datar.” JournalofAccountingEducation 21, no. 1 (2003): 25-42.
U.S. Department of Transportation, Research and Innovative Administration, Bureau of Transportation Statistics. TranStatsDatabase. Washington, D.C., 2003, 2006, and 2009.
Carl A. ScheragaisprofessorofbusinessstrategyandtechnologymanagementintheDolanSchoolof Business at Fairfield University. His fields of research and teaching include transportationand international logistics, global strategic management, cross-cultural management, and themanagementoftechnologyandinnovation.HehaspublishednumerousarticlesinTransportation Research Series A, Transportation Research E, Journal of Transportation Management, Transportation Journal, Journal of the Transportation Research Forum, Journal of Public Policy and Marketing, Technology in Society: An International Journal, Journal of Banking and Finance, Global Business and Finance Review, Journal of Investing, Management International Review, International Journal of Advertising, and International Review of Economics and Finance. Healsohaspublishedchaptersin suchvolumesasJapanese Direct Investment in the United States: Trends, Developments and Issues, International Financial Market Integration, and Neuroeconomics and the Firm.As a co-author,hehasreceivedtheTransportationResearchForumOutstandingResearchPaperAwardin1998andtheAviationResearchPaperAwardin1999.HereceivedhisPh.D.ineconomicsfromtheUniversityofConnecticut,anM.A.ineconomicsandaSc.BinmathematicsfromBrownUniversity.
Paul CasterisprofessorofaccountingintheDolanSchoolofBusinessatFairfieldUniversity.Hisprimaryresearchinterestsincludeauditevidenceandauditdecision-making,thefinancialimpactof changes in accounting principles, and analysis of business strategy using strategic varianceanalysis.Hehaspublishedarticles inAuditing: A Journal of Practice & Theory, The Journal of Accountancy, Research in Accounting Regulation, The CPA Journal, Issues in Accounting Education, The Journal of Forensic Accounting, The Journal of Accounting Literature, The Quarterly Review of Economics and Business, The EDP Auditor Journal, The Financial Analysts Journal, and Journal of the Transportation Research Forum.HereceivedhisPh.D.inAccountingfromtheUniversityofNorthTexas,anMBAfromtheUniversityofChicago,andaB.S.fromLehighUniversity.