america’s energy renaissance: top plays for income and growth
DESCRIPTION
America’s Energy Renaissance: Top Plays for Income and Growth. Elliott H. Gue January 18, 2014 Editor, Energy & Income Advisor Editor, Capitalist Times. Back to July 1988. The World’s Largest Oil and Gas Producer. US Energy Liberty Day is Approaching. - PowerPoint PPT PresentationTRANSCRIPT

America’s Energy Renaissance: Top Plays for
Income and GrowthElliott H. Gue
January 18, 2014Editor, Energy & Income Advisor
Editor, Capitalist Times

Back to July 1988

The World’s Largest Oil and Gas Producer

US Energy Liberty Day is Approaching

US Enjoys Cheap Gas and Electricity Prices
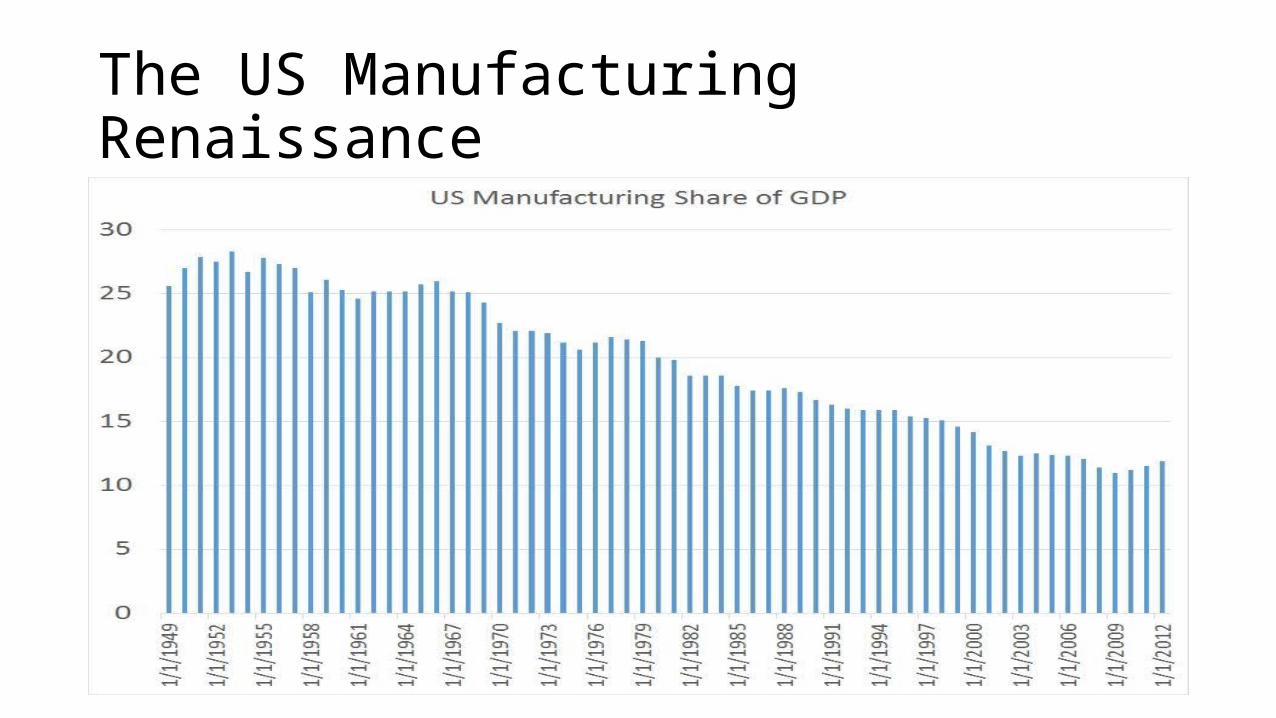
The US Manufacturing Renaissance

It’s Morning in America
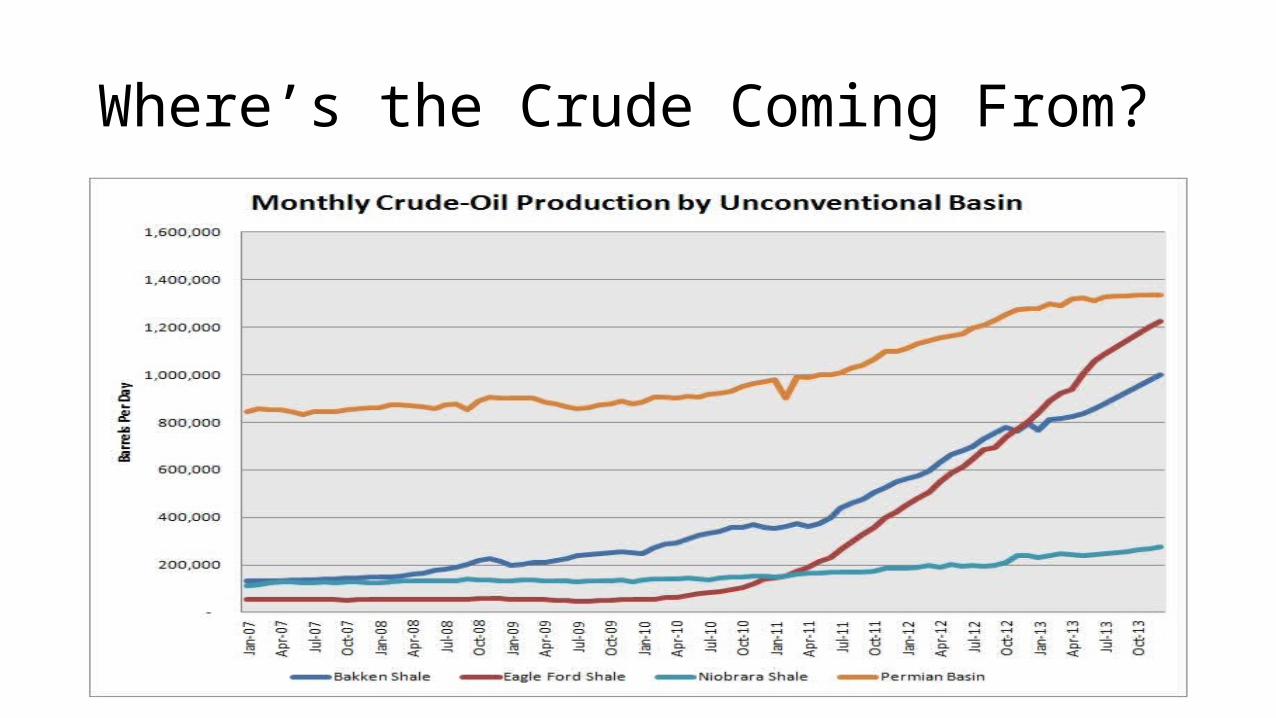
Where’s the Crude Coming From?
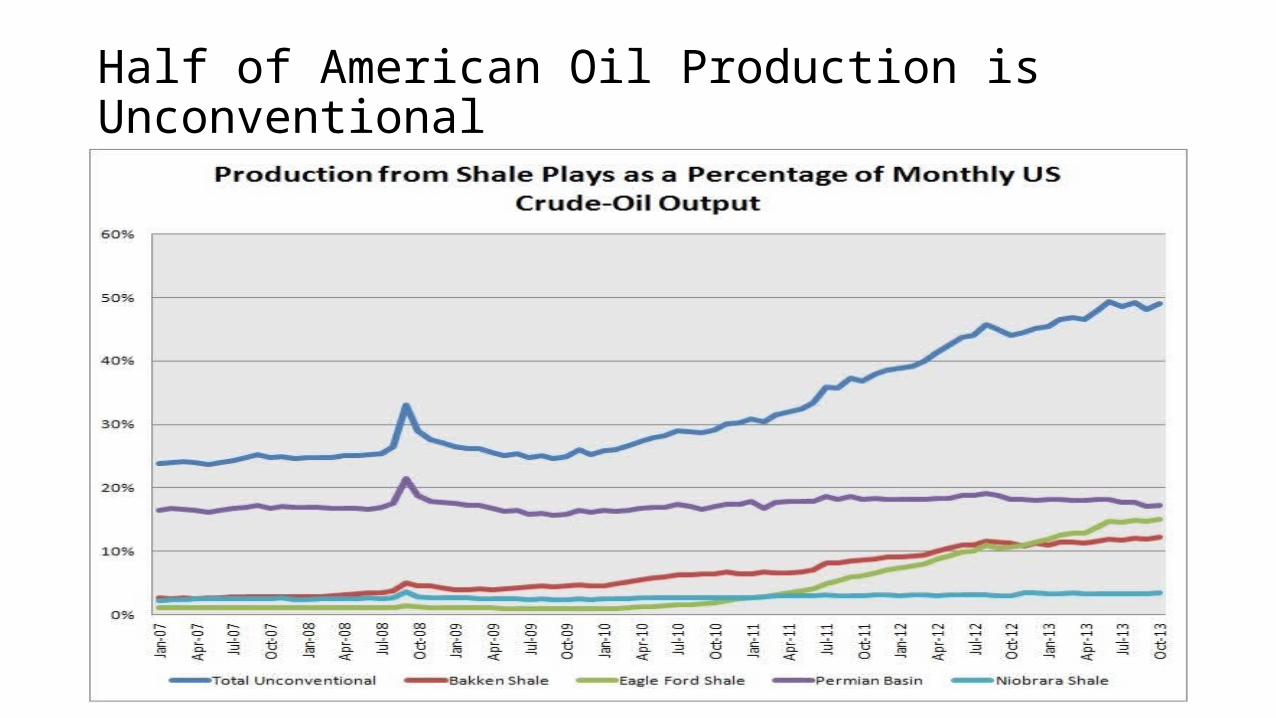
Half of American Oil Production is Unconventional

Where’s Oil Trading?
10/7/2
005
1/13/2
006
4/21/2
006
7/28/2
006
11/3/2
006
2/9/2
007
5/18/2
007
8/24/2
007
11/30/2
007
3/7/2
008
6/13/2
008
9/19/2
008
12/26/2
008
4/3/2
009
7/10/2
009
10/16/2
009
1/22/2
010
4/30/2
010
8/6/2
010
11/12/2
010
2/18/2
011
5/27/2
011
9/2/2
011
12/9/2
011
3/16/2
012
6/22/2
012
9/28/2
012
1/4/2
013
4/12/2
013
7/19/2
013
10/25/2
0130
20
40
60
80
100
120
140
160 Oil Prices
LLS WTI Brent WTI Midland Bakken

Refining: As Easy as 3-2-1
• Refiners are manufacturing firms: convert oil to gasoline, diesel, jet fuel, other products.• 3 Barrels of oil ($93.82/bbl x 3) =
$281.46• 2 Barrels of Gasoline ($2.68/ gallon x
42 x 2) = $225.12• 1 Barrel of Diesel ($3.05/gallon x 42 x
1) = $128.1• 3-2-1 Spread: $225.12 + $128.1 -
$281.46 = $70.76 divided by 3 = $23.58 per Barrel.
12/31/1
999
12/2/2
000
11/2/2
001
10/2/2
002
9/2/2
003
8/2/2
004
7/2/2
005
6/2/2
006
5/2/2
007
4/2/2
008
3/2/2
009
2/2/2
010
1/2/2
011
12/2/2
011
11/2/2
012
10/2/2
0130
5
10
15
20
25
30
35
40
45
NYMEX 3-2-1 Crack Spread
Crack Spread 1999 to 2013 AverageCr
ack
Spra
d ($
/bbl
)

Valero Energy (NYSE: VLO)

Valero Energy (NYSE: VLO)

Shale Development: Where’s the Money Coming From?
297; 55%
112; 21%
74; 14%
53; 10%
Major North American E&Ps Capital Raised Since 2007
Asset Sales Debt Equity JVs

Vanguard Natural Resources (NYSE: VNR)• Recently acquired 87,000 Gross
Acres in Pinedale and Jonah fields WY.• 80% NatGas, 16% NGLs• Historically Hedges 85% of Gas
production through 1H 2017 and 75% of Oil through 2015• Opportunity for more acquisitions
as producers need to fund shale. • Yields 8.4%, Paid Monthly 1/4
/2008
8/8/2
008
3/13/2
009
10/16/2
009
5/21/2
010
12/24/2
010
7/29/2
011
3/2/2
012
10/5/2
012
5/10/2
013
12/13/2
0130
1
2
3
4
5
6
Upstream MLPs and the Alerian
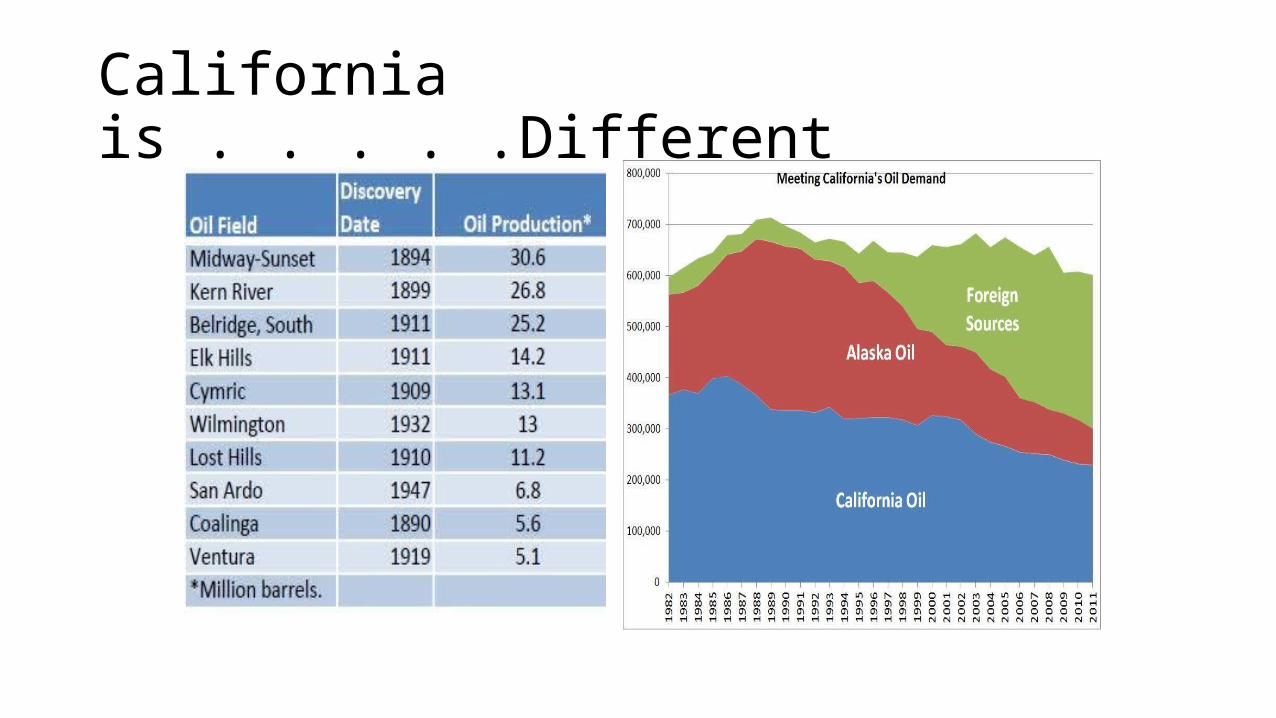
California is . . . . .Different

Pacific Coast Oil Trust (ROYT)
• Perpetual trust with an 11.7 percent yield. • Produces 98 percent crude oil. • Southern California fields are
mature and have a low decline rate, often well under 5%. • 80% interest in developed
properties.• 25% royalty interest in Diatomite
formation.• Active waterfloods and steamfloods
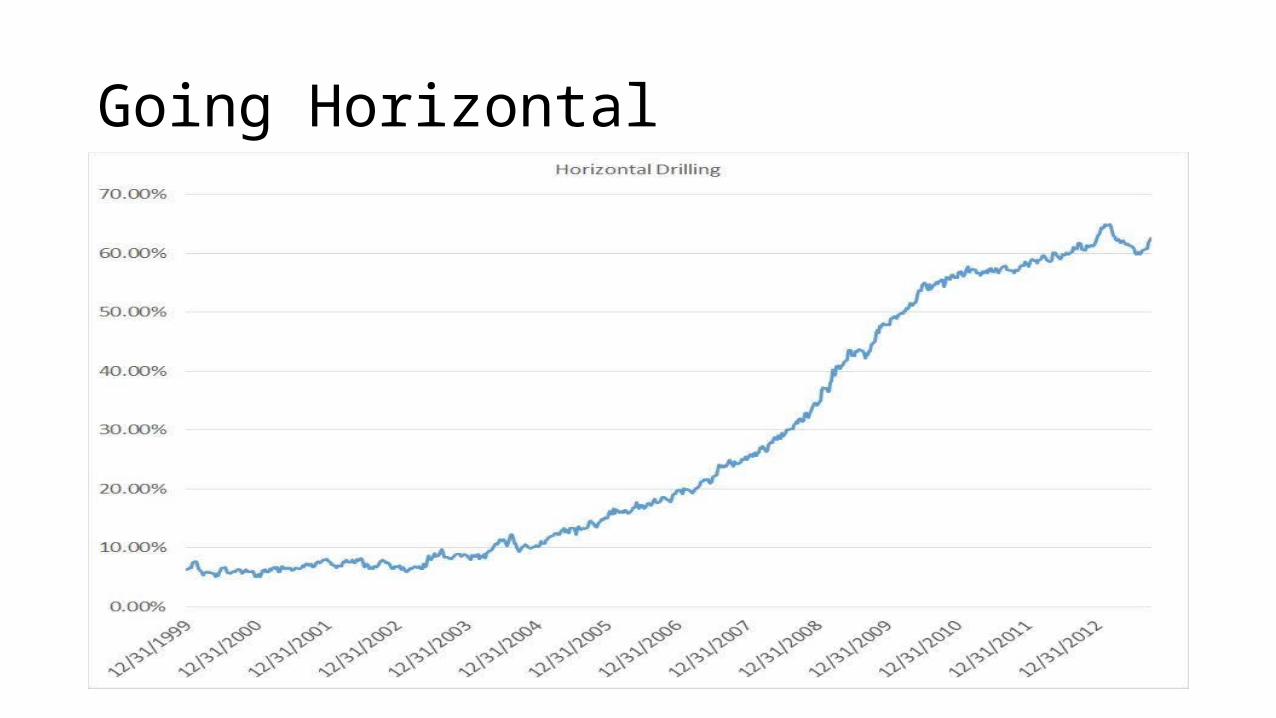
Going Horizontal

More Gas With Fewer Rigs

Drilling Efficiency Gas and Oil

Launch Pad for Growth

Patterson-UTI (NSDQ: PTEN)
• 60% of revenues from contract drilling, 40% from pressure pumping• 300 working rigs• 2009: 75% of rigs mechanical,
2013: more than 50% electric, 126 rigs APEX.• 6 New APEX Rigs (all “Walking”)
in 2H 2013, 12 in 1H 2014

The Denver-Julesburg Basin

Niobrara Offers Solid Economics

Noble Energy (NBL)
• First wells in the DJ Basin in 2010, last year drilled 195 Wattenburg, 25 in CO• By 2016 plans 500 wells/yr. in DJ
Basin• Liquids rich portion of Marcellus• Eastern Med. Tamar 9 tcf and
Leviathan 17 tcf in Israel, Cyprus-A 5 to 8 tcf

Eni (NYSE: E)
• 16.81% stake in Kashagan in Caspian Sea first oil produced middle 2013
• 100,000 boe/day in deepwater GOM• 700,000 in new projects over 4 years,
3 to 4% annualized• Mamba Complex Mozambique 30 tcf
gas• Barent’s Sea Norway and Russia• Disposing of non-core assets • PIIGS discount unwarranted.• Offers a 6.5% yield.

LyondellBasell Industries (NYSE: LYB)
• 80 percent of Companies EBITDA benefits from favorable US NGLs prices.• Ethane cracking capacity to
expand in 2014-2015, before competition.• Using NGLs imported from USA
to reduce EU costs• Near 3% yield and share
buybacks

Thank You.
Elliott H. GueJanuary 18, 2014
Editor, Energy & Income AdvisorEditor, Capitalist Times