americans’ views on domestic priorities … domestic priorities for president trump ... elect...
TRANSCRIPT
0
AMERICANS’ VIEWS ON DOMESTIC PRIORITIES FOR PRESIDENT TRUMP’S FIRST 100 DAYS
January 2017
1
INTRODUCTION
In the weeks leading up to President-Elect Trump’s inauguration, members of the general public, including many who voted for Donald Trump, were interviewed about their beliefs on a variety of domestic issues that President-Elect Trump has identified as priorities during his first 100 days in office. These issues include:
• Enthusiasm for President-Elect Trump’s Priorities • Repealing & Replacing Obamacare • The Future of Medicare • Immigration Policy • Tax Cuts & Economic Benefits • Infrastructure Investment • Creating a More Conservative Supreme Court
The results indicate wide differences in opinion between Trump voters and the general public as a whole. As he assumes office, President-Elect Trump will have to make choices about whether his policies will reflect the views of the general public as a whole, or the views of those who specifically voted for him. The differences in these views are explored in further depth in each of the following sections. This survey was conducted December 16-20, 2016, among a nationally representative sample of 1,023 U.S. adults. Further methodological information is reported at the end of the report.
2
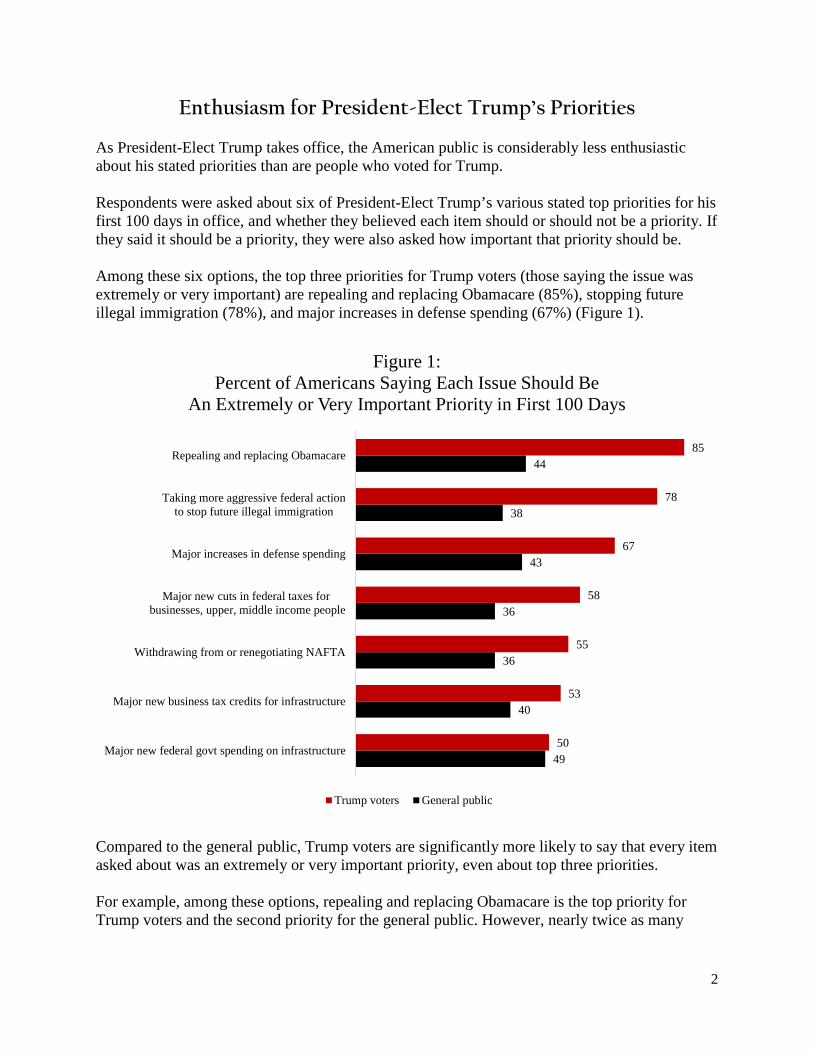
Enthusiasm for President-Elect Trump’s Priorities As President-Elect Trump takes office, the American public is considerably less enthusiastic about his stated priorities than are people who voted for Trump. Respondents were asked about six of President-Elect Trump’s various stated top priorities for his first 100 days in office, and whether they believed each item should or should not be a priority. If they said it should be a priority, they were also asked how important that priority should be. Among these six options, the top three priorities for Trump voters (those saying the issue was extremely or very important) are repealing and replacing Obamacare (85%), stopping future illegal immigration (78%), and major increases in defense spending (67%) (Figure 1).
Compared to the general public, Trump voters are significantly more likely to say that every item asked about was an extremely or very important priority, even about top three priorities. For example, among these options, repealing and replacing Obamacare is the top priority for Trump voters and the second priority for the general public. However, nearly twice as many
49
40
36
36
43
38
44
50
53
55
58
67
78
85
Major new federal govt spending on infrastructure
Major new business tax credits for infrastructure
Withdrawing from or renegotiating NAFTA
Major new cuts in federal taxes for businesses, upper, middle income people
Major increases in defense spending
Taking more aggressive federal actionto stop future illegal immigration
Repealing and replacing Obamacare
Figure 1: Percent of Americans Saying Each Issue Should Be
An Extremely or Very Important Priority in First 100 Days
Trump voters General public
3
Trump voters (85%) identify this as an extremely or very important priority than the general public (44%) (Figure 1). Similarly, major increases in defense spending ranks third for both Trump voters (67%) and Americans more generally (43%), but there remains a 24-point gap in enthusiasm for this proposal (Figure 1). In fact, the most popular priority among the general public is supported at roughly the same level as the least popular priority for Trump voters. They happen to be one and the same policy: major federal government spending on infrastructure (49% of general public, 50% of Trump voters) (Figure 1).
4
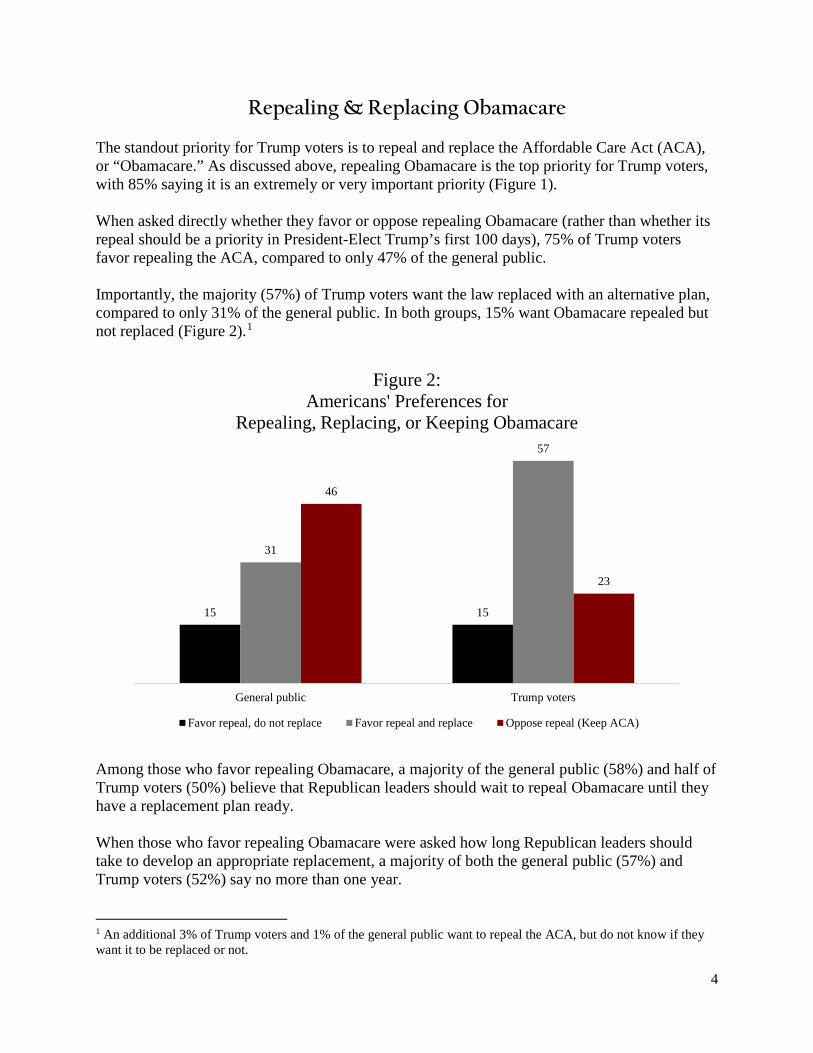
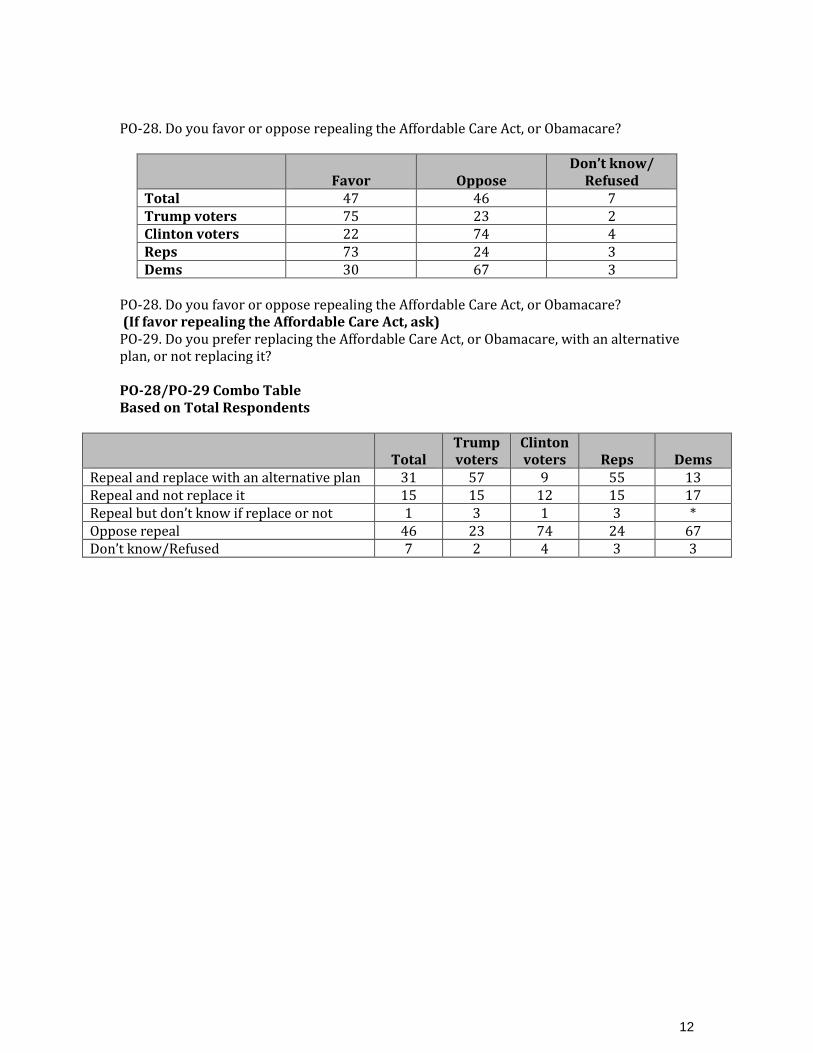
Repealing & Replacing Obamacare The standout priority for Trump voters is to repeal and replace the Affordable Care Act (ACA), or “Obamacare.” As discussed above, repealing Obamacare is the top priority for Trump voters, with 85% saying it is an extremely or very important priority (Figure 1). When asked directly whether they favor or oppose repealing Obamacare (rather than whether its repeal should be a priority in President-Elect Trump’s first 100 days), 75% of Trump voters favor repealing the ACA, compared to only 47% of the general public. Importantly, the majority (57%) of Trump voters want the law replaced with an alternative plan, compared to only 31% of the general public. In both groups, 15% want Obamacare repealed but not replaced (Figure 2).1
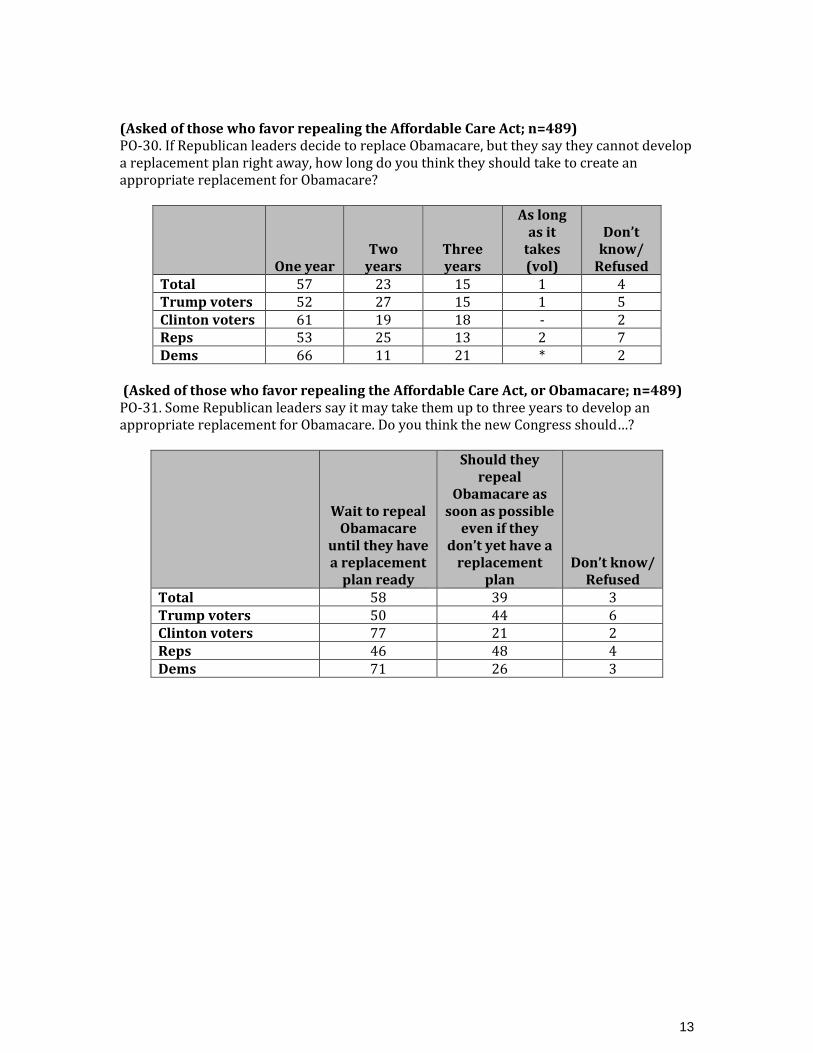
Among those who favor repealing Obamacare, a majority of the general public (58%) and half of Trump voters (50%) believe that Republican leaders should wait to repeal Obamacare until they have a replacement plan ready. When those who favor repealing Obamacare were asked how long Republican leaders should take to develop an appropriate replacement, a majority of both the general public (57%) and Trump voters (52%) say no more than one year. 1 An additional 3% of Trump voters and 1% of the general public want to repeal the ACA, but do not know if they want it to be replaced or not.
15 15
31
57
46
23
General public Trump voters
Figure 2: Americans' Preferences for
Repealing, Replacing, or Keeping Obamacare
Favor repeal, do not replace Favor repeal and replace Oppose repeal (Keep ACA)
5
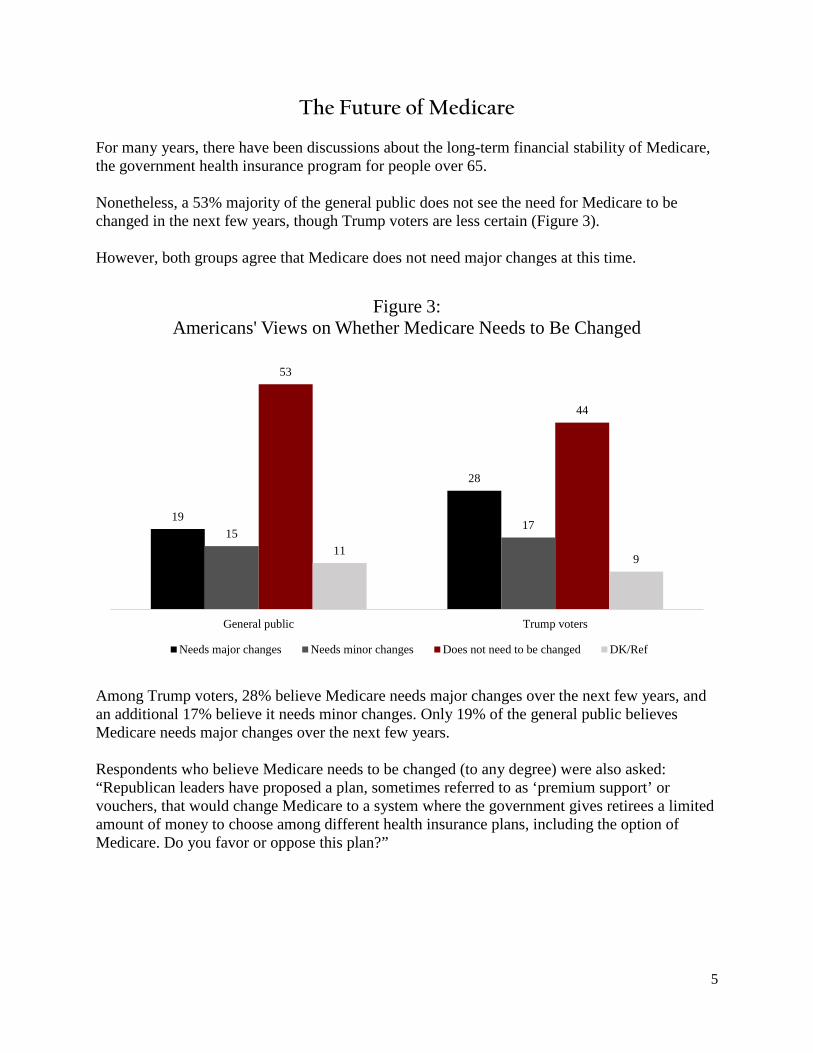
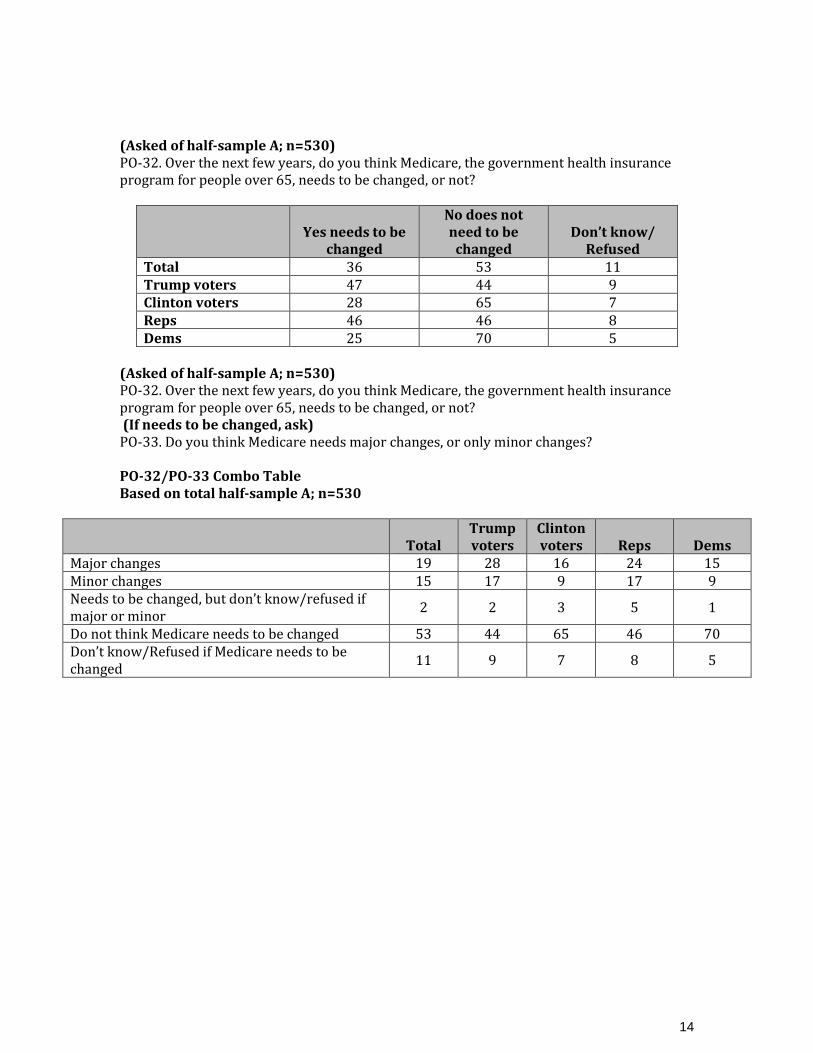
The Future of Medicare For many years, there have been discussions about the long-term financial stability of Medicare, the government health insurance program for people over 65. Nonetheless, a 53% majority of the general public does not see the need for Medicare to be changed in the next few years, though Trump voters are less certain (Figure 3). However, both groups agree that Medicare does not need major changes at this time.
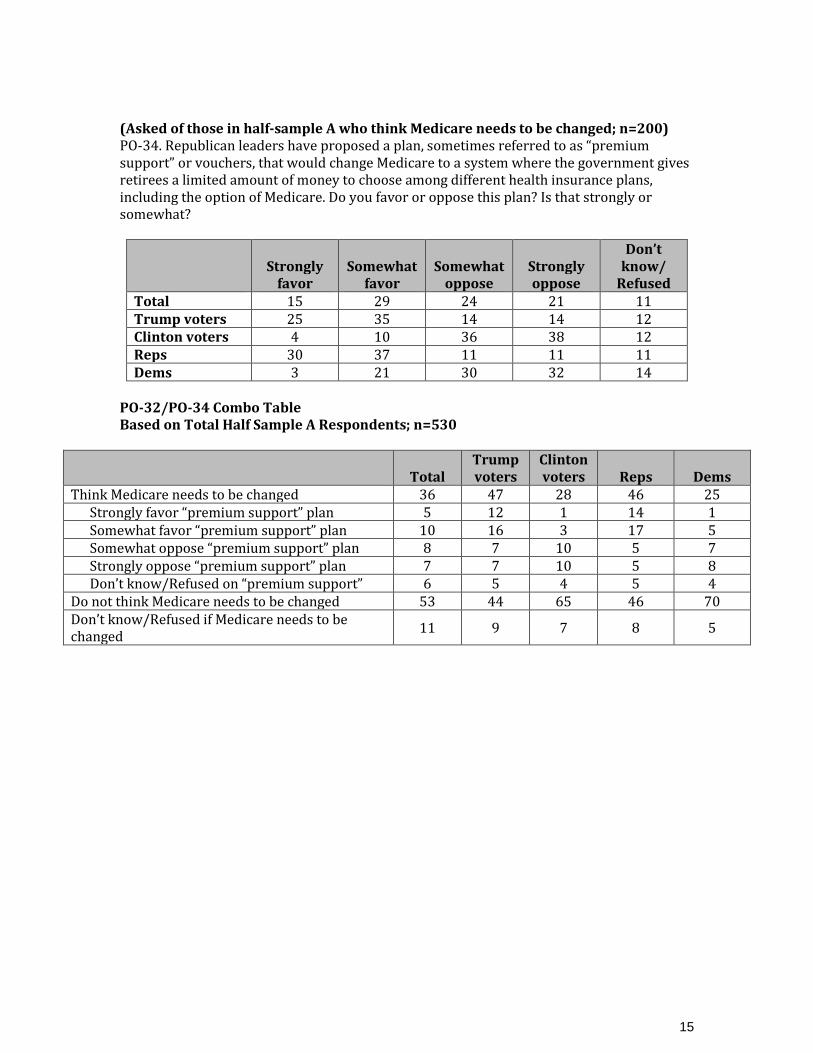
Among Trump voters, 28% believe Medicare needs major changes over the next few years, and an additional 17% believe it needs minor changes. Only 19% of the general public believes Medicare needs major changes over the next few years. Respondents who believe Medicare needs to be changed (to any degree) were also asked: “Republican leaders have proposed a plan, sometimes referred to as ‘premium support’ or vouchers, that would change Medicare to a system where the government gives retirees a limited amount of money to choose among different health insurance plans, including the option of Medicare. Do you favor or oppose this plan?”
19
28
1517
53
44
119
General public Trump voters
Figure 3:Americans' Views on Whether Medicare Needs to Be Changed
Needs major changes Needs minor changes Does not need to be changed DK/Ref
6
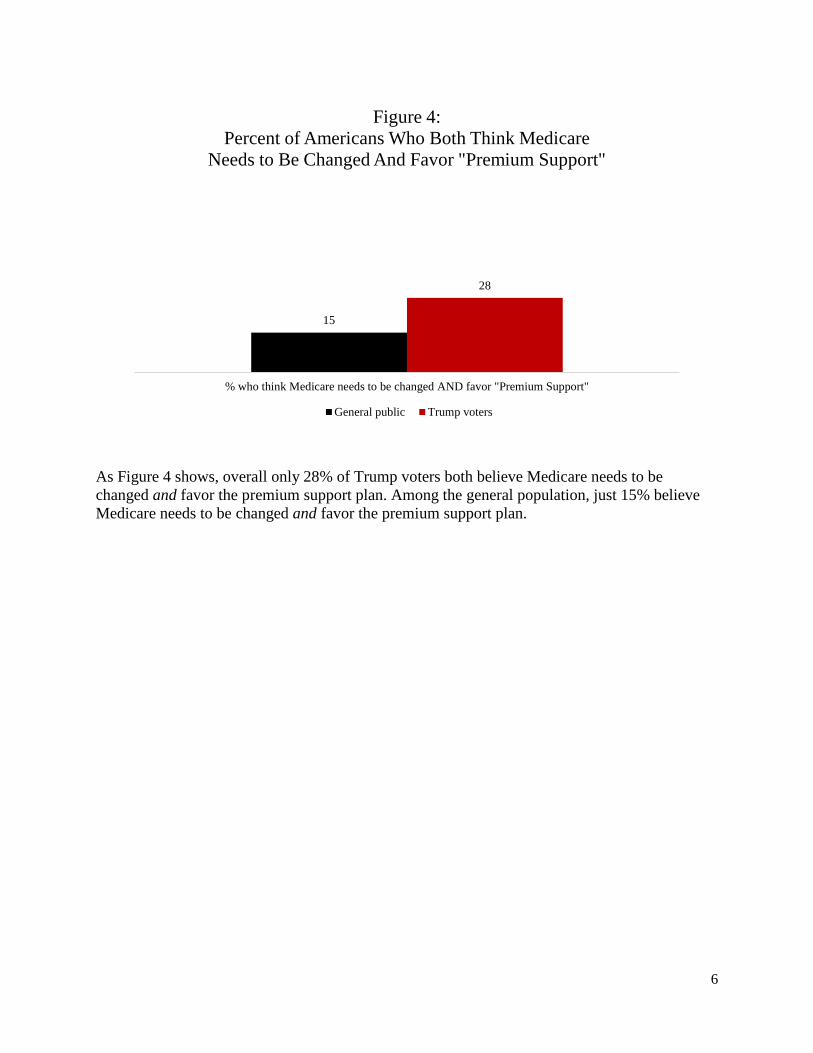
As Figure 4 shows, overall only 28% of Trump voters both believe Medicare needs to be changed and favor the premium support plan. Among the general population, just 15% believe Medicare needs to be changed and favor the premium support plan.
15
28
% who think Medicare needs to be changed AND favor "Premium Support"
Figure 4:Percent of Americans Who Both Think Medicare
Needs to Be Changed And Favor "Premium Support"
General public Trump voters
7
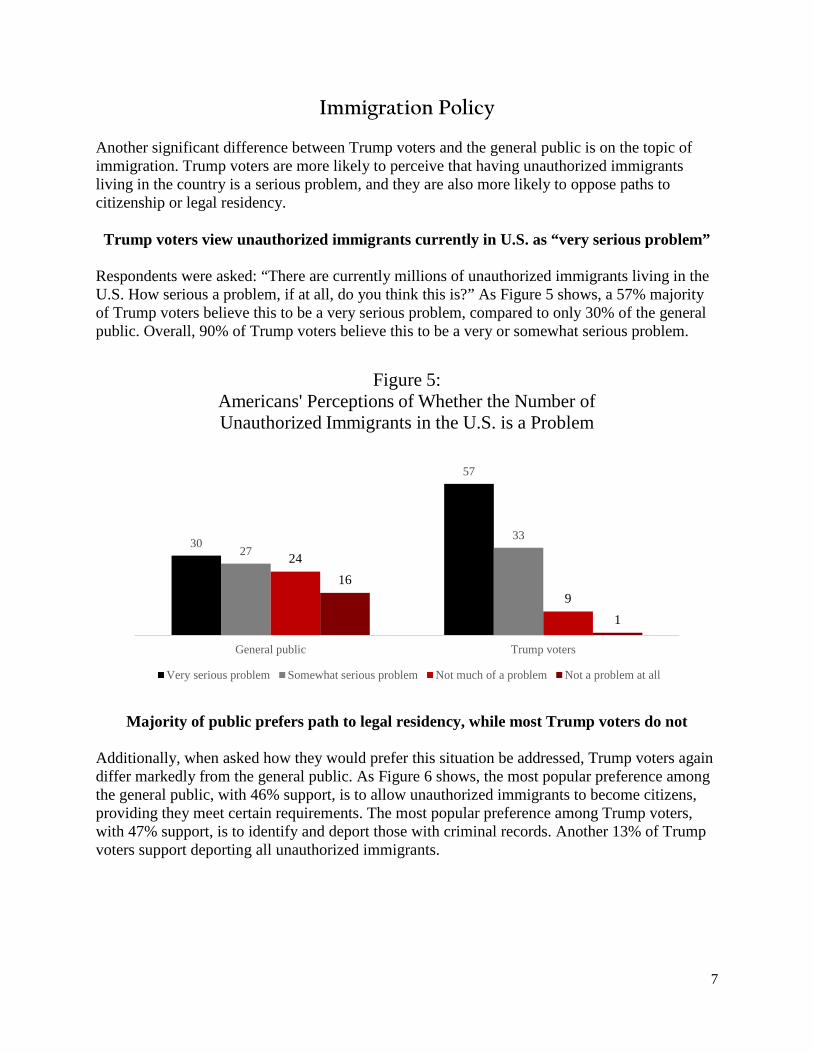
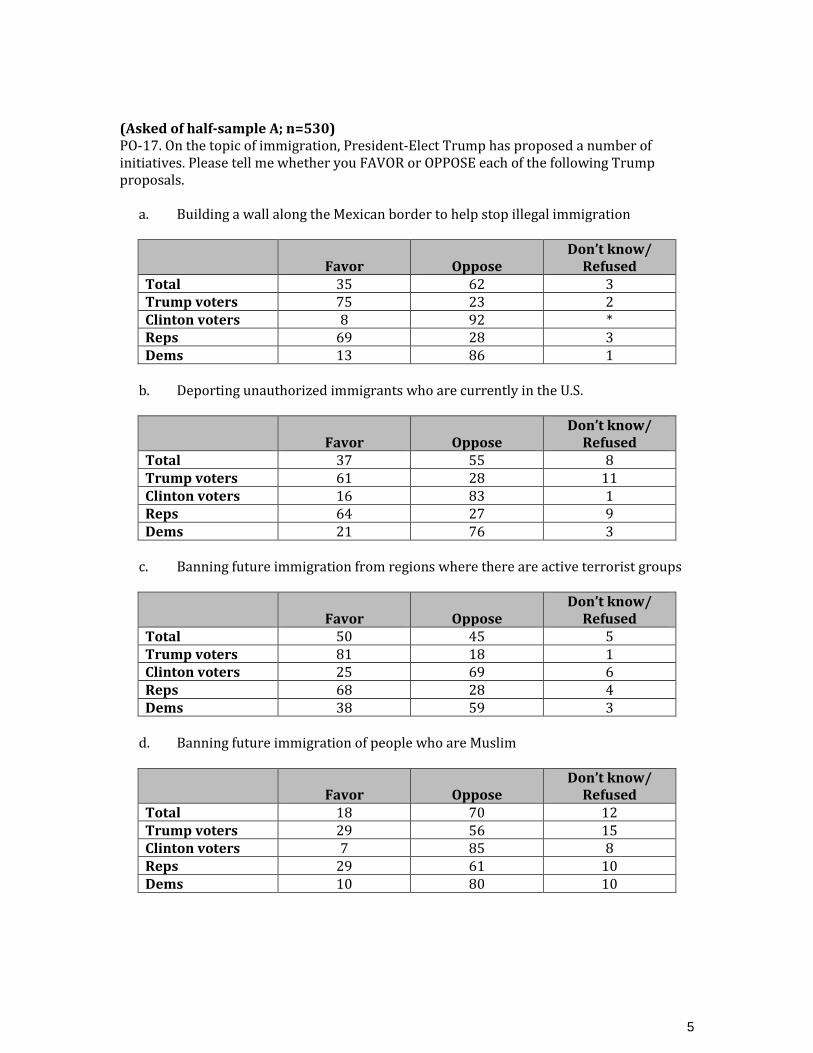
Immigration Policy Another significant difference between Trump voters and the general public is on the topic of immigration. Trump voters are more likely to perceive that having unauthorized immigrants living in the country is a serious problem, and they are also more likely to oppose paths to citizenship or legal residency. Trump voters view unauthorized immigrants currently in U.S. as “very serious problem”
Respondents were asked: “There are currently millions of unauthorized immigrants living in the U.S. How serious a problem, if at all, do you think this is?” As Figure 5 shows, a 57% majority of Trump voters believe this to be a very serious problem, compared to only 30% of the general public. Overall, 90% of Trump voters believe this to be a very or somewhat serious problem.
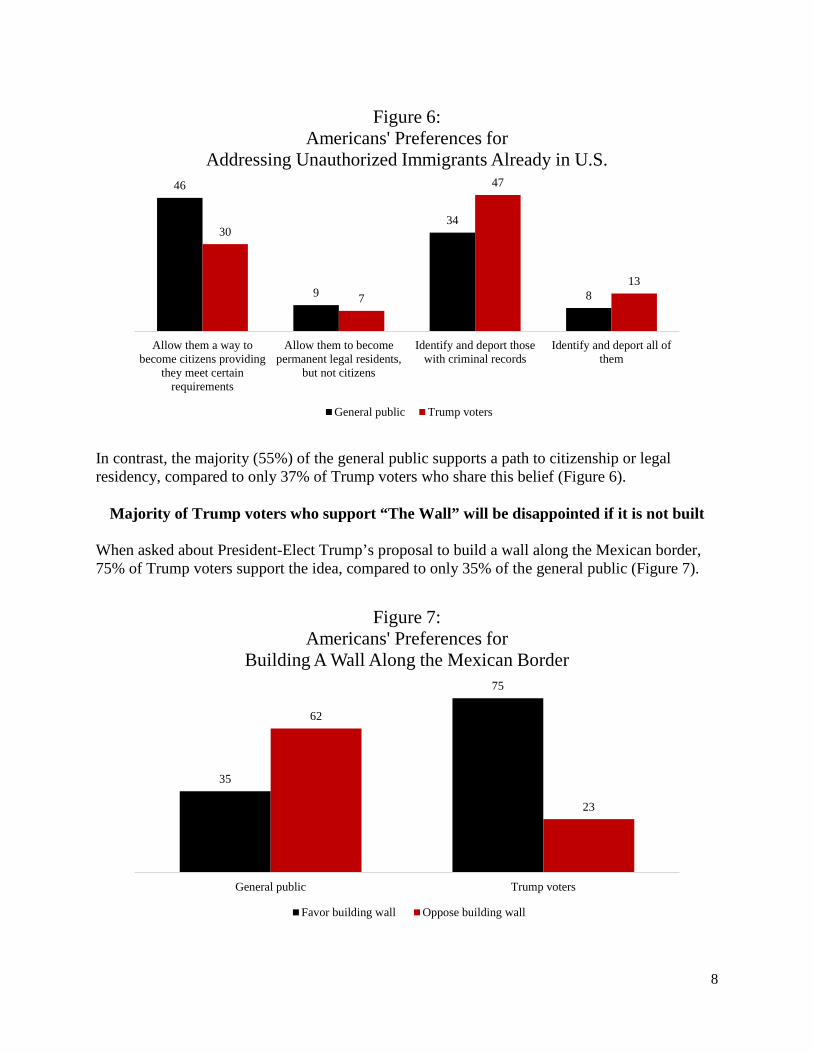
Majority of public prefers path to legal residency, while most Trump voters do not Additionally, when asked how they would prefer this situation be addressed, Trump voters again differ markedly from the general public. As Figure 6 shows, the most popular preference among the general public, with 46% support, is to allow unauthorized immigrants to become citizens, providing they meet certain requirements. The most popular preference among Trump voters, with 47% support, is to identify and deport those with criminal records. Another 13% of Trump voters support deporting all unauthorized immigrants.
30
57
2733
24
916
1
General public Trump voters
Figure 5:Americans' Perceptions of Whether the Number of Unauthorized Immigrants in the U.S. is a Problem
Very serious problem Somewhat serious problem Not much of a problem Not a problem at all
8
In contrast, the majority (55%) of the general public supports a path to citizenship or legal residency, compared to only 37% of Trump voters who share this belief (Figure 6).
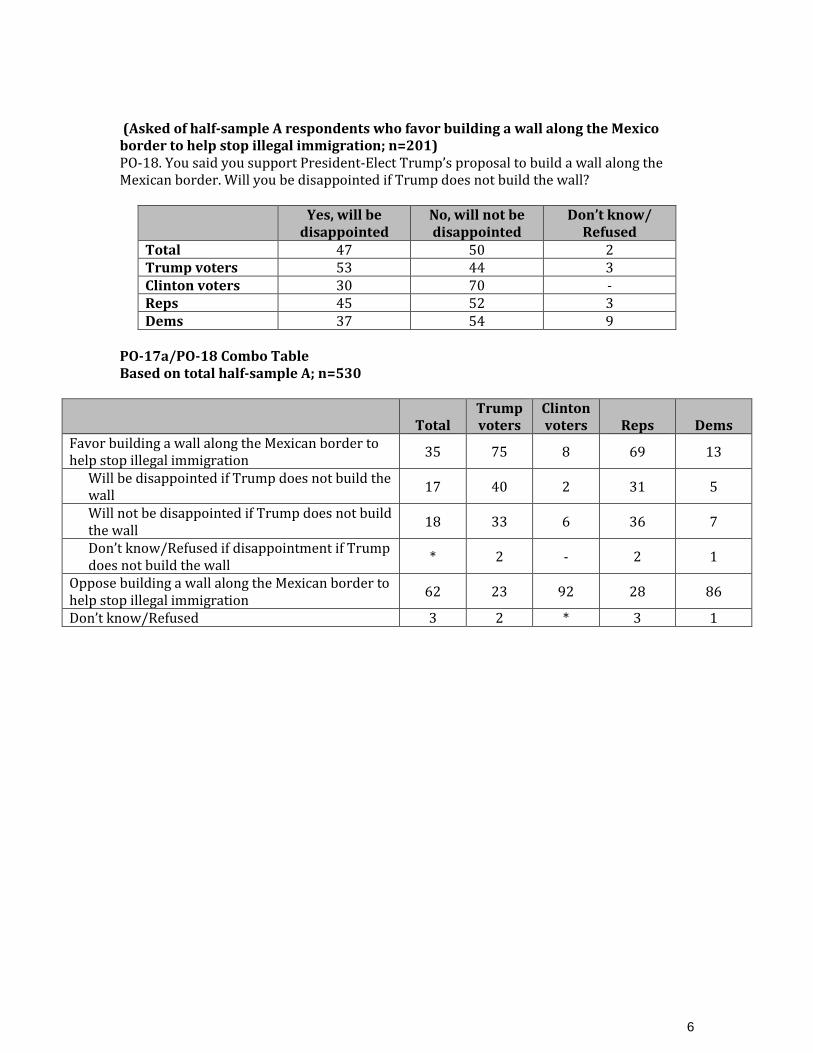
Majority of Trump voters who support “The Wall” will be disappointed if it is not built When asked about President-Elect Trump’s proposal to build a wall along the Mexican border, 75% of Trump voters support the idea, compared to only 35% of the general public (Figure 7).
46
9
34
8
30
7
47
13
Allow them a way tobecome citizens providing
they meet certainrequirements
Allow them to becomepermanent legal residents,
but not citizens
Identify and deport thosewith criminal records
Identify and deport all ofthem
Figure 6: Americans' Preferences for
Addressing Unauthorized Immigrants Already in U.S.
General public Trump voters
35
75
62
23
General public Trump voters
Figure 7: Americans' Preferences for
Building A Wall Along the Mexican Border
Favor building wall Oppose building wall
9
Among Trump voters who say they favor building this wall, a 53% majority say they will be disappointed if Trump does not build the wall.
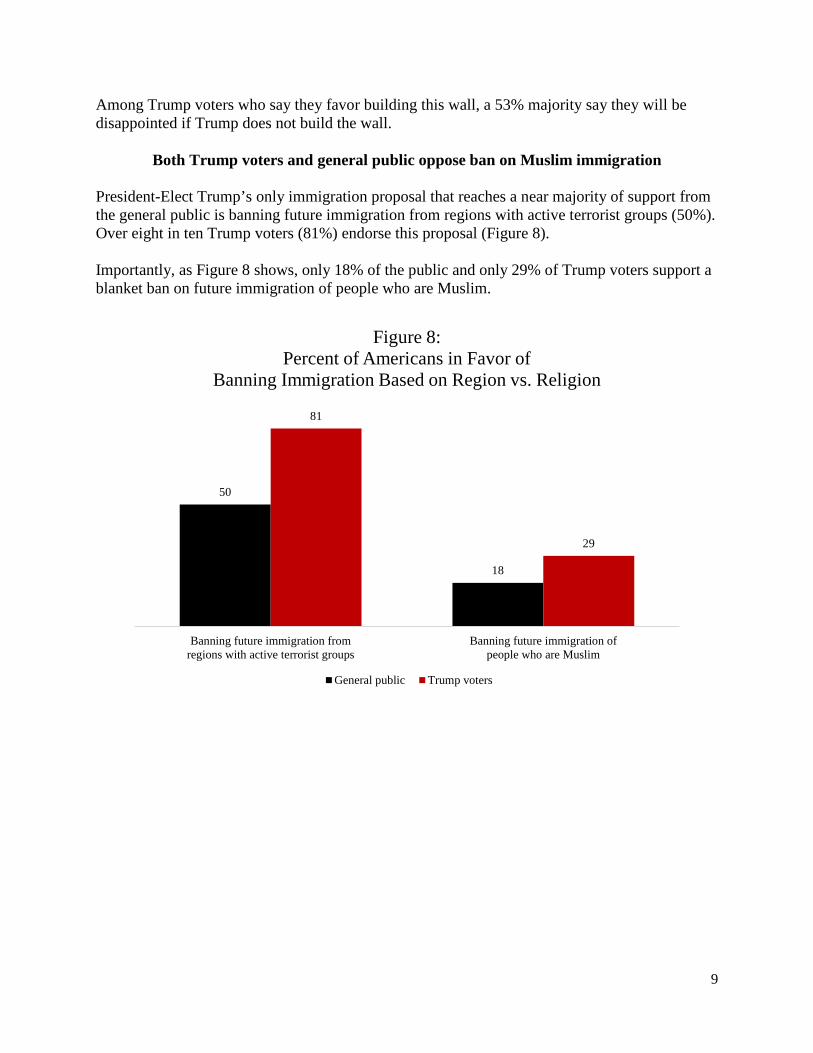
Both Trump voters and general public oppose ban on Muslim immigration President-Elect Trump’s only immigration proposal that reaches a near majority of support from the general public is banning future immigration from regions with active terrorist groups (50%). Over eight in ten Trump voters (81%) endorse this proposal (Figure 8). Importantly, as Figure 8 shows, only 18% of the public and only 29% of Trump voters support a blanket ban on future immigration of people who are Muslim.
50
18
81
29
Banning future immigration fromregions with active terrorist groups
Banning future immigration ofpeople who are Muslim
Figure 8: Percent of Americans in Favor of
Banning Immigration Based on Region vs. Religion
General public Trump voters
10
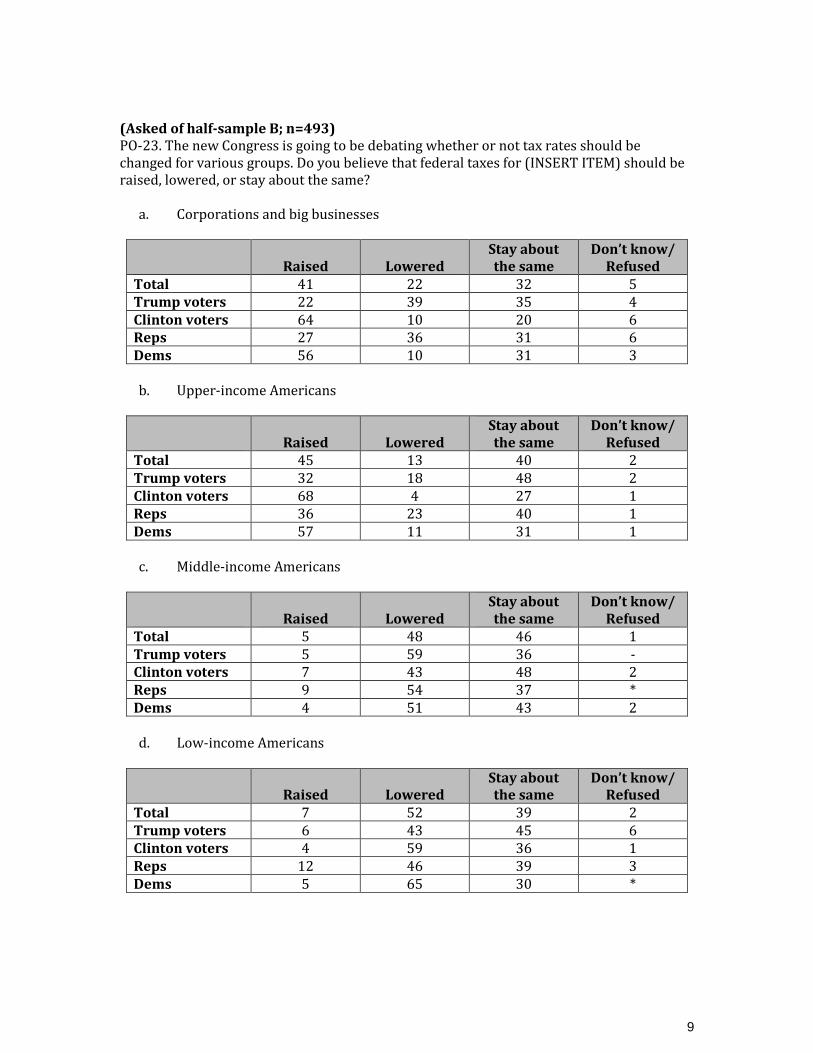
Tax Cuts & Economic Benefits One focus of President-Elect Trump’s campaign was lowering taxes on a variety of groups in America. However, a majority of both the general public and Trump voters oppose lowering taxes on big businesses and upper-income Americans. Nonetheless, Trump voters remain optimistic about the potential effects of such cuts on the American economy and job market.
Majority of both Trump voters and the public oppose lowering taxes on big businesses and upper-income Americans
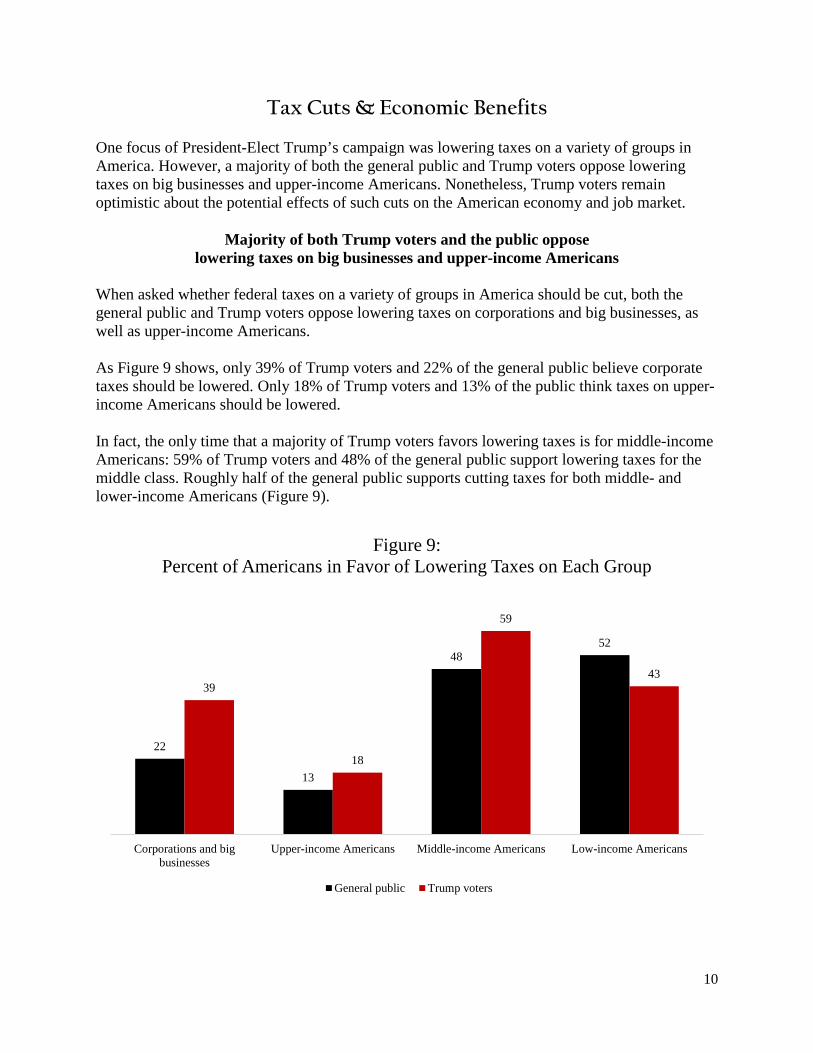
When asked whether federal taxes on a variety of groups in America should be cut, both the general public and Trump voters oppose lowering taxes on corporations and big businesses, as well as upper-income Americans. As Figure 9 shows, only 39% of Trump voters and 22% of the general public believe corporate taxes should be lowered. Only 18% of Trump voters and 13% of the public think taxes on upper-income Americans should be lowered. In fact, the only time that a majority of Trump voters favors lowering taxes is for middle-income Americans: 59% of Trump voters and 48% of the general public support lowering taxes for the middle class. Roughly half of the general public supports cutting taxes for both middle- and lower-income Americans (Figure 9).
22
13
4852
39
18
59
43
Corporations and bigbusinesses
Upper-income Americans Middle-income Americans Low-income Americans
Figure 9: Percent of Americans in Favor of Lowering Taxes on Each Group
General public Trump voters
11
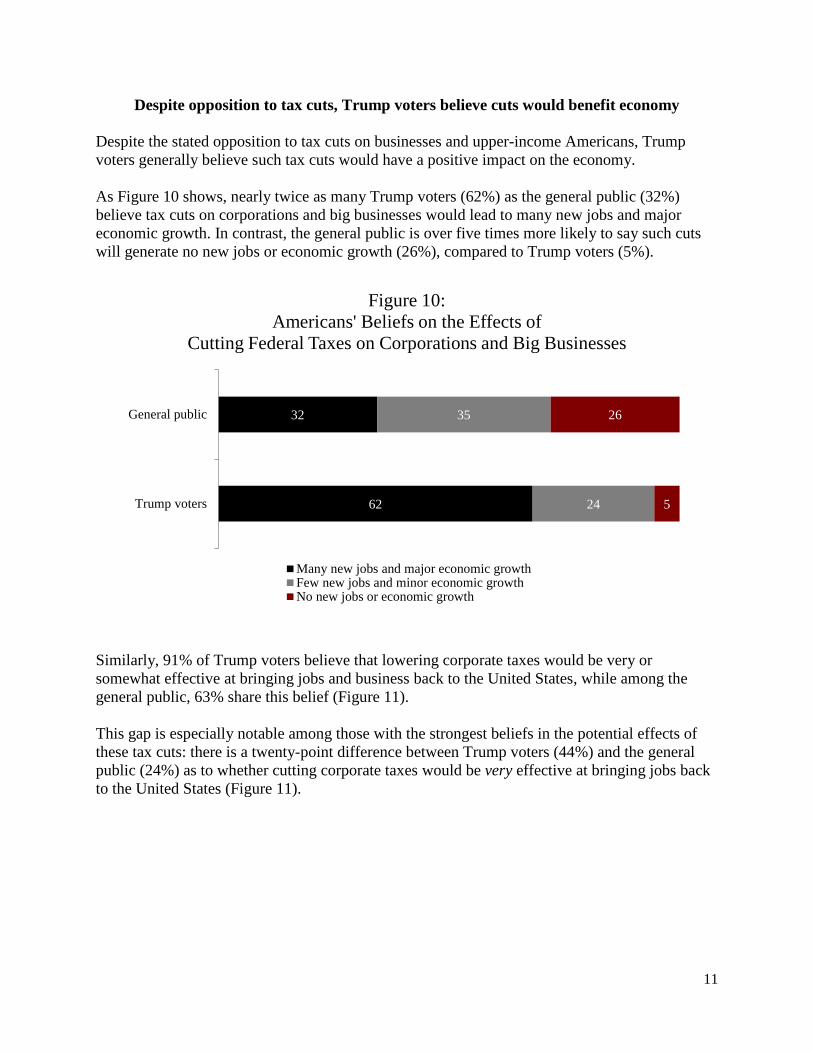
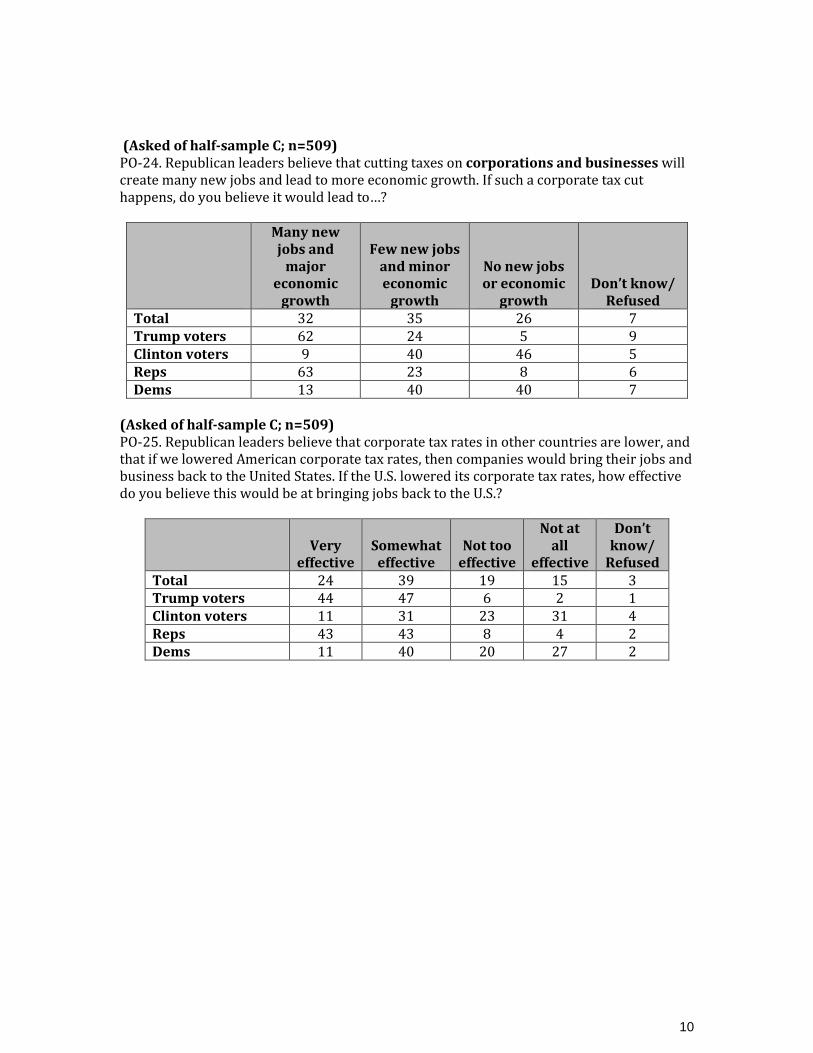
Despite opposition to tax cuts, Trump voters believe cuts would benefit economy Despite the stated opposition to tax cuts on businesses and upper-income Americans, Trump voters generally believe such tax cuts would have a positive impact on the economy. As Figure 10 shows, nearly twice as many Trump voters (62%) as the general public (32%) believe tax cuts on corporations and big businesses would lead to many new jobs and major economic growth. In contrast, the general public is over five times more likely to say such cuts will generate no new jobs or economic growth (26%), compared to Trump voters (5%).
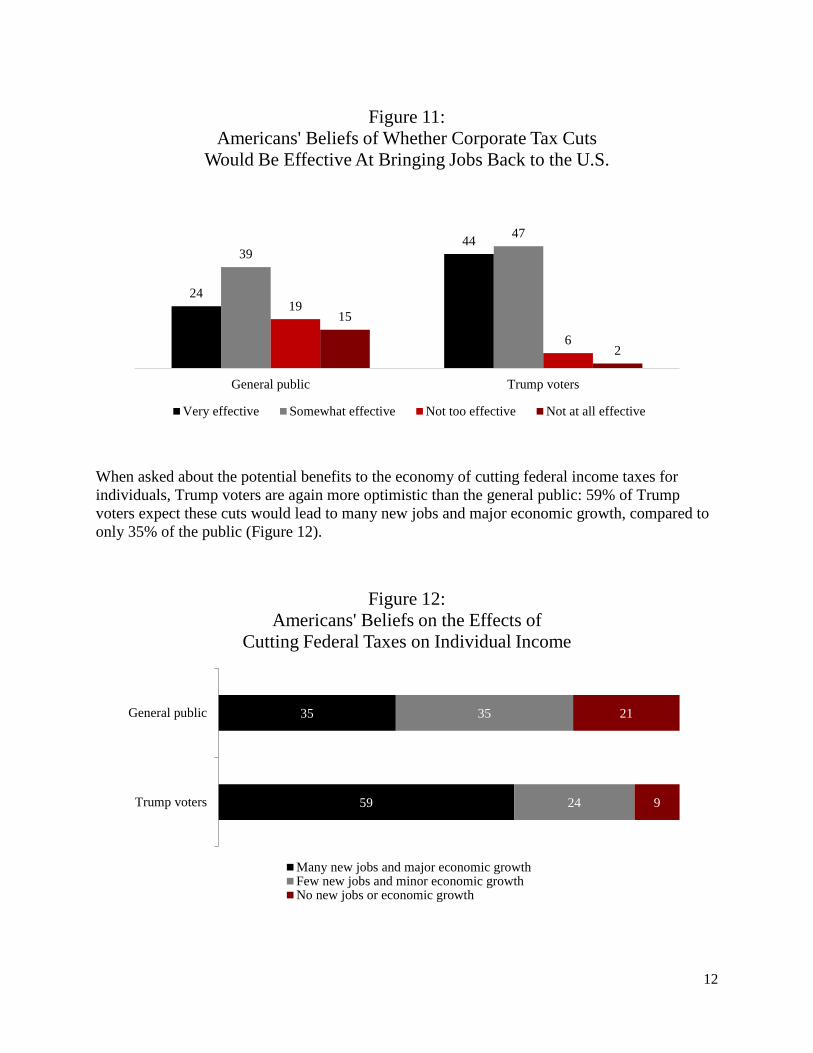
Similarly, 91% of Trump voters believe that lowering corporate taxes would be very or somewhat effective at bringing jobs and business back to the United States, while among the general public, 63% share this belief (Figure 11). This gap is especially notable among those with the strongest beliefs in the potential effects of these tax cuts: there is a twenty-point difference between Trump voters (44%) and the general public (24%) as to whether cutting corporate taxes would be very effective at bringing jobs back to the United States (Figure 11).
62
32
24
35
5
26
Trump voters
General public
Figure 10:Americans' Beliefs on the Effects of
Cutting Federal Taxes on Corporations and Big Businesses
Many new jobs and major economic growthFew new jobs and minor economic growthNo new jobs or economic growth
12
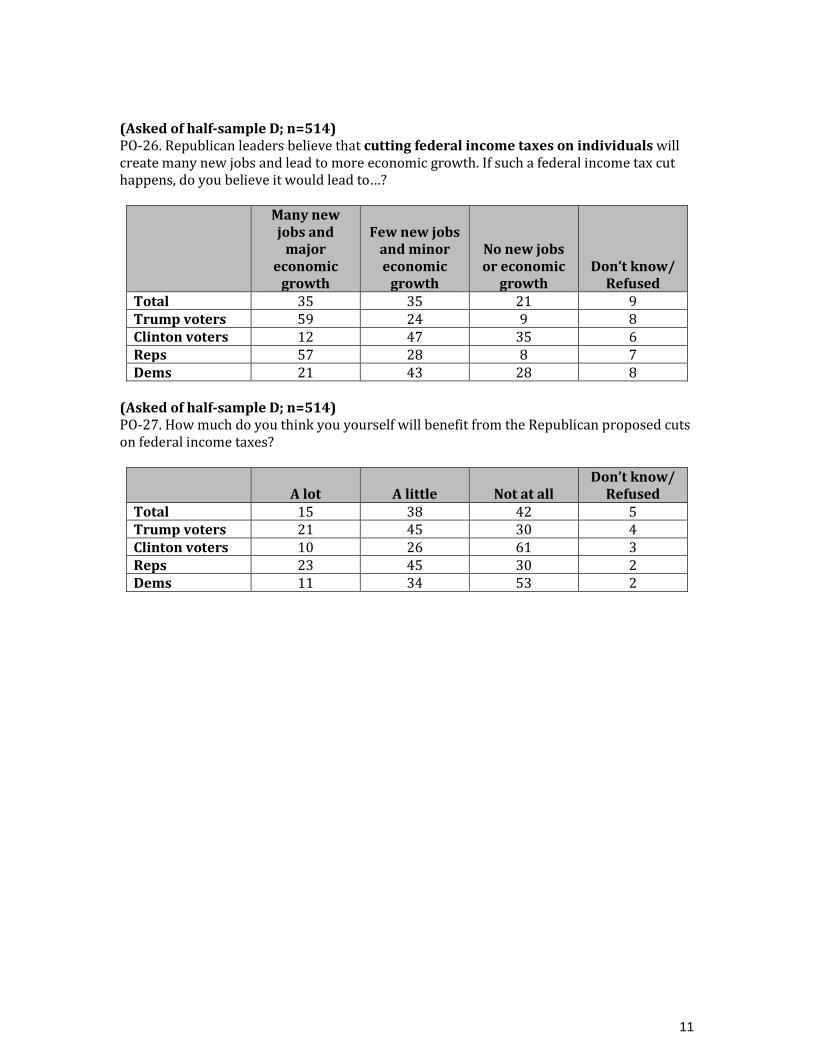
When asked about the potential benefits to the economy of cutting federal income taxes for individuals, Trump voters are again more optimistic than the general public: 59% of Trump voters expect these cuts would lead to many new jobs and major economic growth, compared to only 35% of the public (Figure 12).
24
4439
47
19
6
15
2
General public Trump voters
Figure 11:Americans' Beliefs of Whether Corporate Tax Cuts
Would Be Effective At Bringing Jobs Back to the U.S.
Very effective Somewhat effective Not too effective Not at all effective
59
35
24
35
9
21
Trump voters
General public
Figure 12:Americans' Beliefs on the Effects of
Cutting Federal Taxes on Individual Income
Many new jobs and major economic growthFew new jobs and minor economic growthNo new jobs or economic growth
13
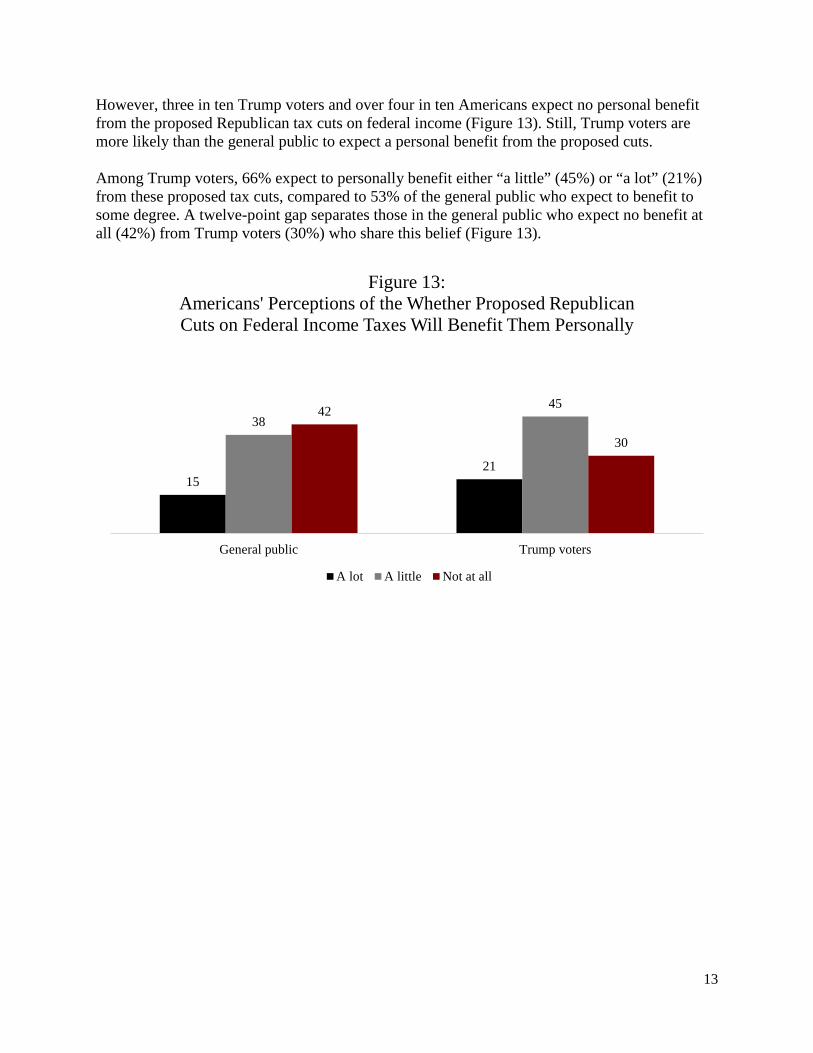
However, three in ten Trump voters and over four in ten Americans expect no personal benefit from the proposed Republican tax cuts on federal income (Figure 13). Still, Trump voters are more likely than the general public to expect a personal benefit from the proposed cuts. Among Trump voters, 66% expect to personally benefit either “a little” (45%) or “a lot” (21%) from these proposed tax cuts, compared to 53% of the general public who expect to benefit to some degree. A twelve-point gap separates those in the general public who expect no benefit at all (42%) from Trump voters (30%) who share this belief (Figure 13).
1521
384542
30
General public Trump voters
Figure 13:Americans' Perceptions of the Whether Proposed Republican Cuts on Federal Income Taxes Will Benefit Them Personally
A lot A little Not at all
14
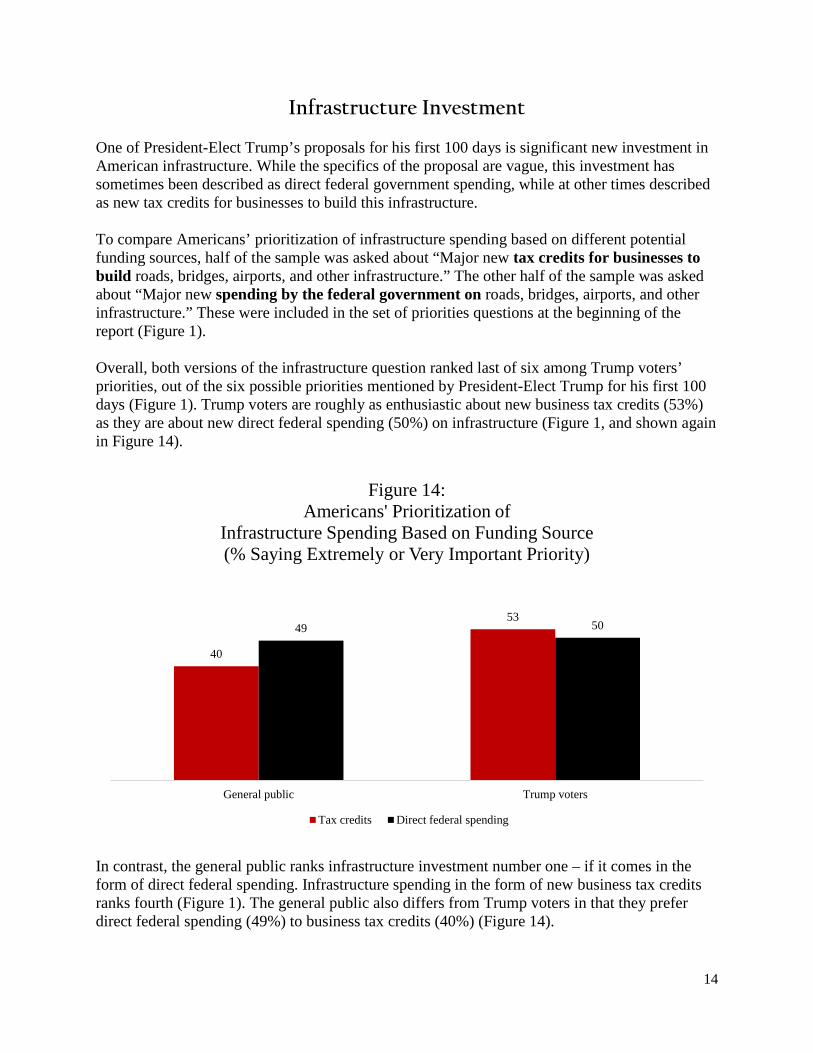
Infrastructure Investment One of President-Elect Trump’s proposals for his first 100 days is significant new investment in American infrastructure. While the specifics of the proposal are vague, this investment has sometimes been described as direct federal government spending, while at other times described as new tax credits for businesses to build this infrastructure. To compare Americans’ prioritization of infrastructure spending based on different potential funding sources, half of the sample was asked about “Major new tax credits for businesses to build roads, bridges, airports, and other infrastructure.” The other half of the sample was asked about “Major new spending by the federal government on roads, bridges, airports, and other infrastructure.” These were included in the set of priorities questions at the beginning of the report (Figure 1). Overall, both versions of the infrastructure question ranked last of six among Trump voters’ priorities, out of the six possible priorities mentioned by President-Elect Trump for his first 100 days (Figure 1). Trump voters are roughly as enthusiastic about new business tax credits (53%) as they are about new direct federal spending (50%) on infrastructure (Figure 1, and shown again in Figure 14).
In contrast, the general public ranks infrastructure investment number one – if it comes in the form of direct federal spending. Infrastructure spending in the form of new business tax credits ranks fourth (Figure 1). The general public also differs from Trump voters in that they prefer direct federal spending (49%) to business tax credits (40%) (Figure 14).
40
5349 50
General public Trump voters
Figure 14:Americans' Prioritization of
Infrastructure Spending Based on Funding Source(% Saying Extremely or Very Important Priority)
Tax credits Direct federal spending
15
Creating a More Conservative Supreme Court Finally, one of the more immediate concerns of the new president will be nominating a new member of the Supreme Court. President-Elect Trump has also stated he intends to appoint justices with the goal of creating a more conservative Court.
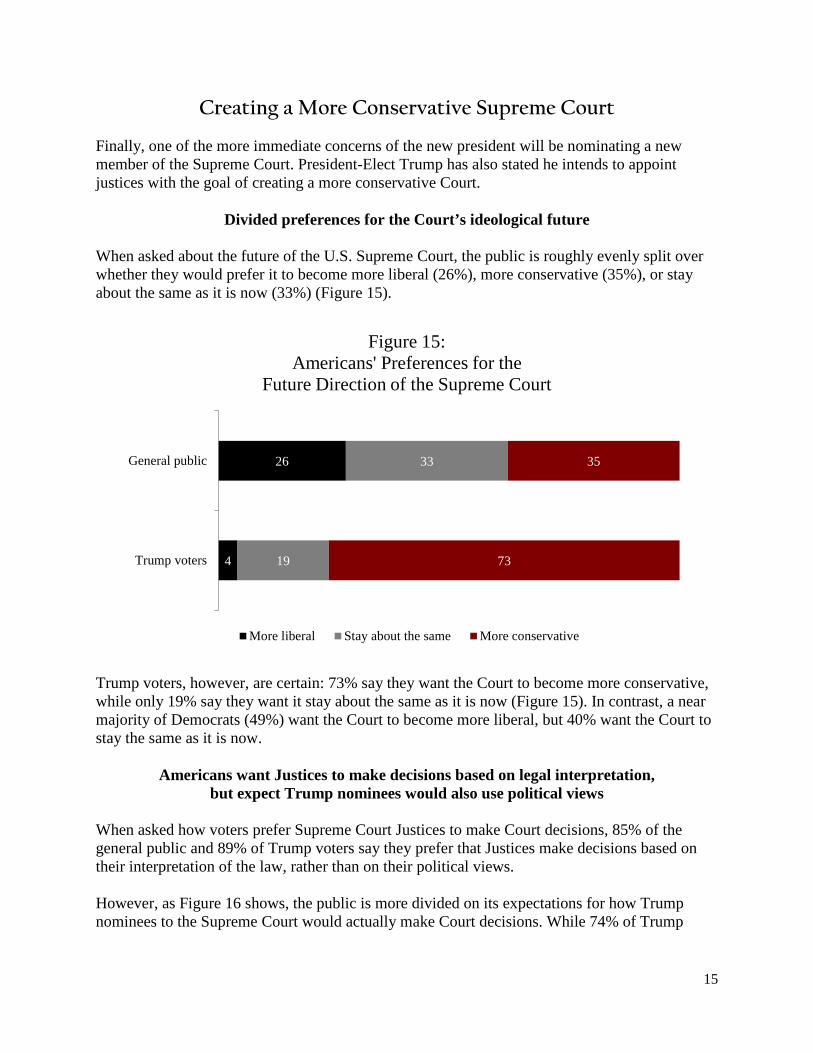
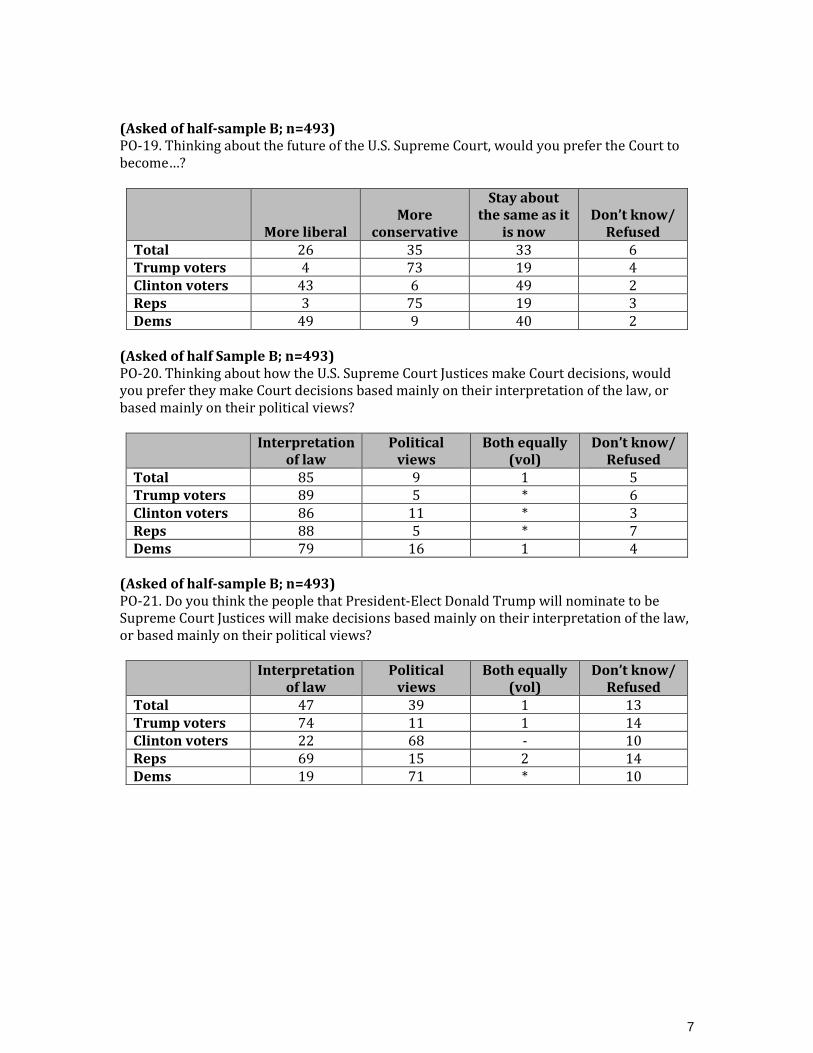
Divided preferences for the Court’s ideological future When asked about the future of the U.S. Supreme Court, the public is roughly evenly split over whether they would prefer it to become more liberal (26%), more conservative (35%), or stay about the same as it is now (33%) (Figure 15).
Trump voters, however, are certain: 73% say they want the Court to become more conservative, while only 19% say they want it stay about the same as it is now (Figure 15). In contrast, a near majority of Democrats (49%) want the Court to become more liberal, but 40% want the Court to stay the same as it is now.
Americans want Justices to make decisions based on legal interpretation, but expect Trump nominees would also use political views
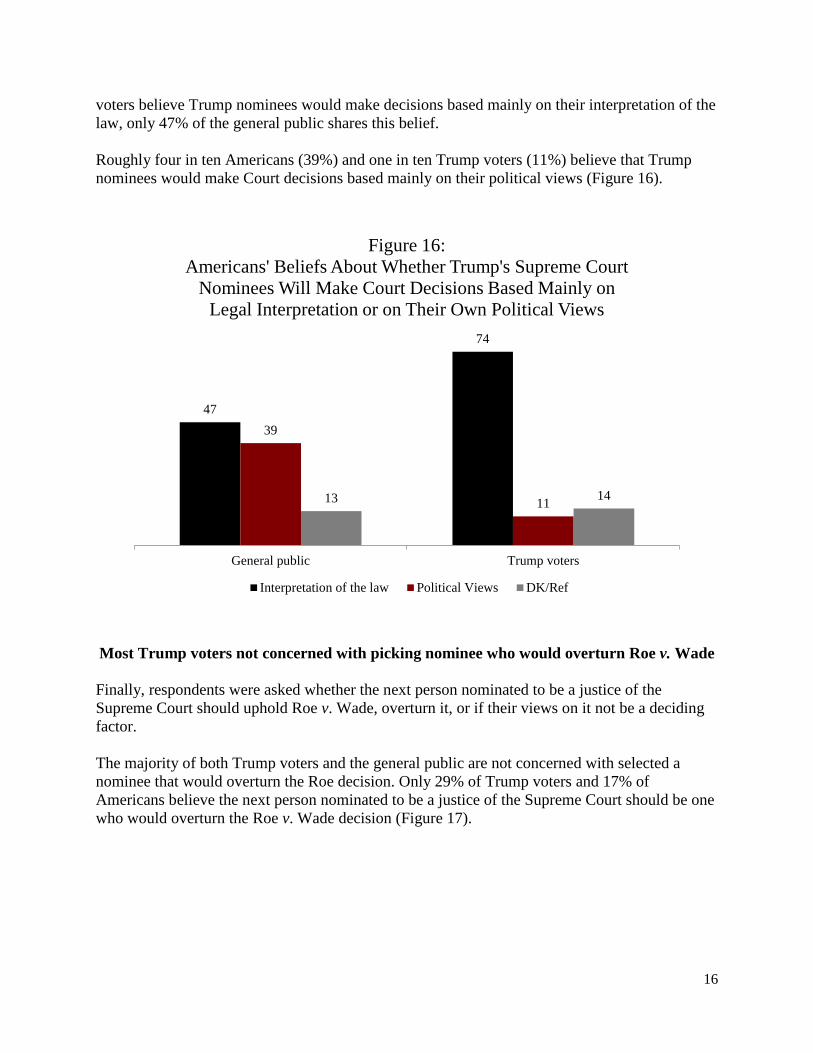
When asked how voters prefer Supreme Court Justices to make Court decisions, 85% of the general public and 89% of Trump voters say they prefer that Justices make decisions based on their interpretation of the law, rather than on their political views. However, as Figure 16 shows, the public is more divided on its expectations for how Trump nominees to the Supreme Court would actually make Court decisions. While 74% of Trump
4
26
19
33
73
35
Trump voters
General public
Figure 15:Americans' Preferences for the
Future Direction of the Supreme Court
More liberal Stay about the same More conservative
16
voters believe Trump nominees would make decisions based mainly on their interpretation of the law, only 47% of the general public shares this belief. Roughly four in ten Americans (39%) and one in ten Trump voters (11%) believe that Trump nominees would make Court decisions based mainly on their political views (Figure 16).
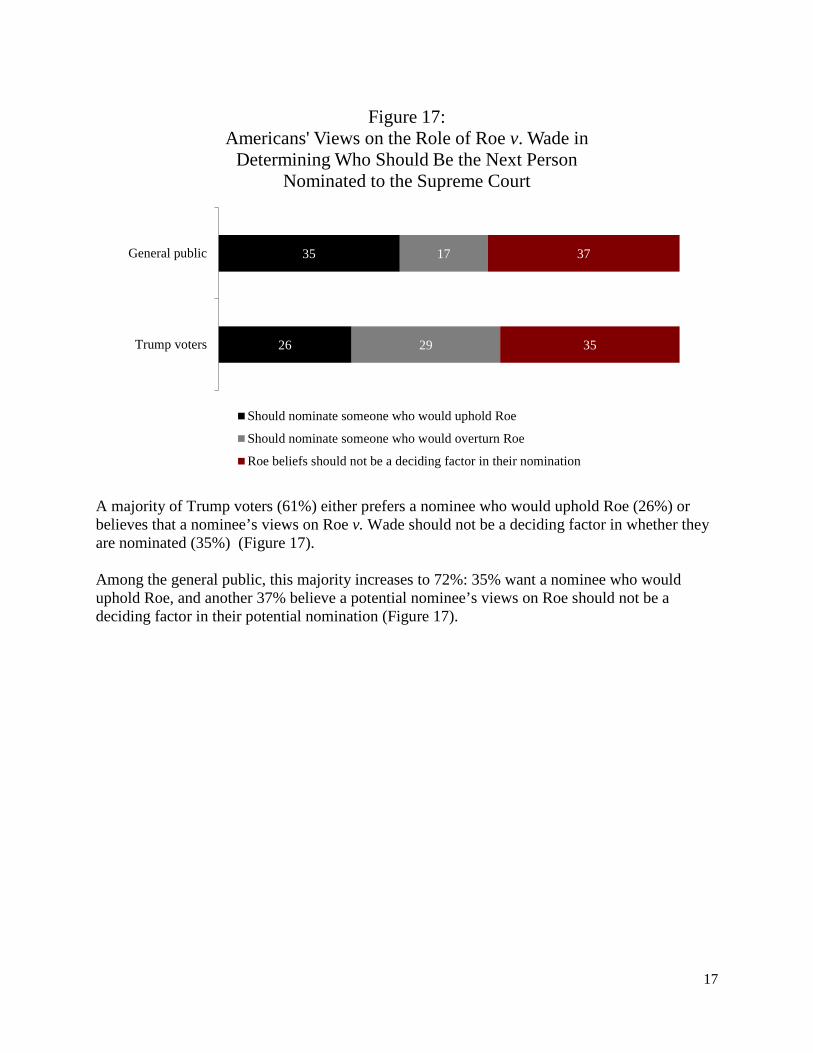
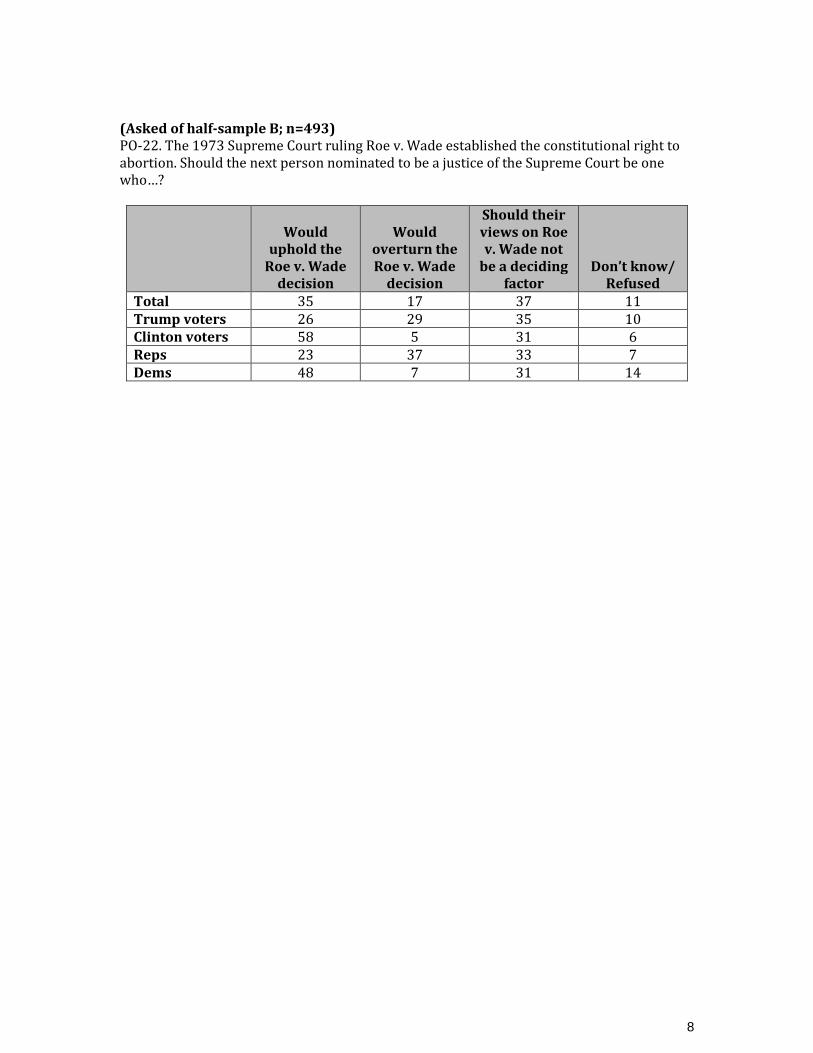
Most Trump voters not concerned with picking nominee who would overturn Roe v. Wade Finally, respondents were asked whether the next person nominated to be a justice of the Supreme Court should uphold Roe v. Wade, overturn it, or if their views on it not be a deciding factor. The majority of both Trump voters and the general public are not concerned with selected a nominee that would overturn the Roe decision. Only 29% of Trump voters and 17% of Americans believe the next person nominated to be a justice of the Supreme Court should be one who would overturn the Roe v. Wade decision (Figure 17).
47
74
39
1113 14
General public Trump voters
Figure 16:Americans' Beliefs About Whether Trump's Supreme Court
Nominees Will Make Court Decisions Based Mainly on Legal Interpretation or on Their Own Political Views
Interpretation of the law Political Views DK/Ref
17
A majority of Trump voters (61%) either prefers a nominee who would uphold Roe (26%) or believes that a nominee’s views on Roe v. Wade should not be a deciding factor in whether they are nominated (35%) (Figure 17). Among the general public, this majority increases to 72%: 35% want a nominee who would uphold Roe, and another 37% believe a potential nominee’s views on Roe should not be a deciding factor in their potential nomination (Figure 17).
26
35
29
17
35
37
Trump voters
General public
Figure 17:Americans' Views on the Role of Roe v. Wade in
Determining Who Should Be the Next PersonNominated to the Supreme Court
Should nominate someone who would uphold Roe
Should nominate someone who would overturn Roe
Roe beliefs should not be a deciding factor in their nomination
18
Conclusion As President-Elect Trump assumes office, there are many questions about future policy directions. This is important because these poll results illustrate significant differences between the general public and Trump voters on almost every issue. The President-Elect’s priorities for his first 100 days will be very different if he chooses to follow the preferences of the general public or if he chooses to pursue the wishes of the people who voted for him. For example, if he follows his own voters, Trump will prioritize the repeal – and replacement – of Obamacare. He will likely also pursue some form of aggressive federal action on illegal immigration, and nominate a conservative Justice to the Supreme Court. However, his voters are less concerned with a specifically pro-life candidate than a conservative one more generally. If he follows the general public, his path forward on Obamacare may be more oriented toward improvement or reform, rather than repeal, of the existing law. Any action on illegal immigration would be much less aggressive and potentially include a path to legal residency. A Supreme Court nominee would likely be more moderate. Whether Trump follows his own voters or the general public, he would only propose tax cuts for middle-income people, rather than for corporations or upper-income people. He would likely also pursue substantial increases in defense spending. Overall, the poll results suggest that, 100 days after Trump’s inauguration, American domestic policy will look very different if led by the views of Trump’s voters or by the views of the American public as a whole.
1
Methodology
The results are based on polling conducted by Politico and Harvard T.H. Chan School of Public Health. Representatives of the two organizations worked closely to develop the survey questionnaire and analyze the results of the poll. Politico and Harvard T.H. Chan School of Public Health paid for the survey and related expenses. The project team was led by Robert J. Blendon, Sc.D., Richard L. Menschel Professor of Health Policy and Political Analysis at Harvard T.H. Chan School of Public Health, and Joanne Kenen, Executive Editor, Health Care at Politico/Politico Pro. Harvard research team also included John M. Benson, Logan S. Casey, and Justin M. Sayde. Interviews were conducted with a nationally representative sample of 1,023 randomly selected adults, ages 18 and older, via telephone (including cell phones and landlines) by SSRS of Media, Pennsylvania. The interviewing period was December 16 – 20, 2016. The data were weighted to reflect the demographics of the national adult population as described by the U.S. Census. When interpreting these findings, one should recognize that all surveys are subject to sampling error. Results may differ from what would be obtained if the whole U.S. adult population had been interviewed. The margin of error for the full sample is ±3.6 percentage points. For questions asked of half-samples, the margin of error is approximately ±5.1 percentage points. Possible sources of non-sampling error include non-response bias, as well as question wording and ordering effects. Non-response in telephone surveys produces some known biases in survey-derived estimates because participation tends to vary for different subgroups of the population. To compensate for these known biases and for variations in probability of selection within and across households, sample data are weighted by household size, cell phone/landline use and demographics (sex, age, race/ethnicity, education, and region) to reflect the true population. Other techniques, including random-digit dialing, replicate subsamples, and systematic respondent selection within households, are used to ensure that the sample is representative.
Politico/Harvard T.H. Chan School of Public Health Poll
Americans’ Views on Domestic Priorities for President Trump’s First 100 Days
This survey was conducted for Politico and Harvard T.H. Chan School of Public
Health via telephone by SSRS, an independent research company. Interviews were conducted via telephone (cell phone and landline) December 16 – 20, 2016, among a
nationally representative sample of 1,023 U.S. adults. The margin of error for total respondents is +/- 3.6 percentage points at the 95% confidence level. More
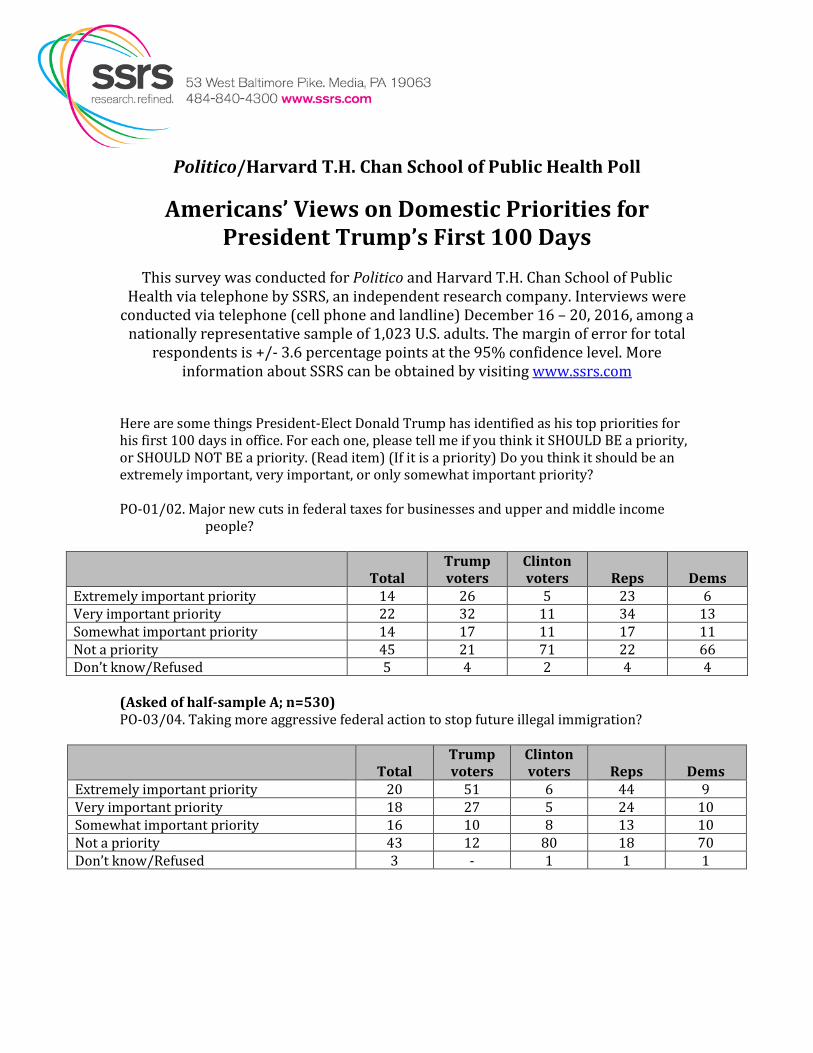
information about SSRS can be obtained by visiting www.ssrs.com Here are some things President-Elect Donald Trump has identified as his top priorities for his first 100 days in office. For each one, please tell me if you think it SHOULD BE a priority, or SHOULD NOT BE a priority. (Read item) (If it is a priority) Do you think it should be an extremely important, very important, or only somewhat important priority? PO-01/02. Major new cuts in federal taxes for businesses and upper and middle income
people?
Total Trump voters
Clinton voters Reps Dems
Extremely important priority 14 26 5 23 6 Very important priority 22 32 11 34 13 Somewhat important priority 14 17 11 17 11 Not a priority 45 21 71 22 66 Don’t know/Refused 5 4 2 4 4
(Asked of half-sample A; n=530) PO-03/04. Taking more aggressive federal action to stop future illegal immigration?
Total Trump voters
Clinton voters Reps Dems
Extremely important priority 20 51 6 44 9 Very important priority 18 27 5 24 10 Somewhat important priority 16 10 8 13 10 Not a priority 43 12 80 18 70 Don’t know/Refused 3 - 1 1 1
2
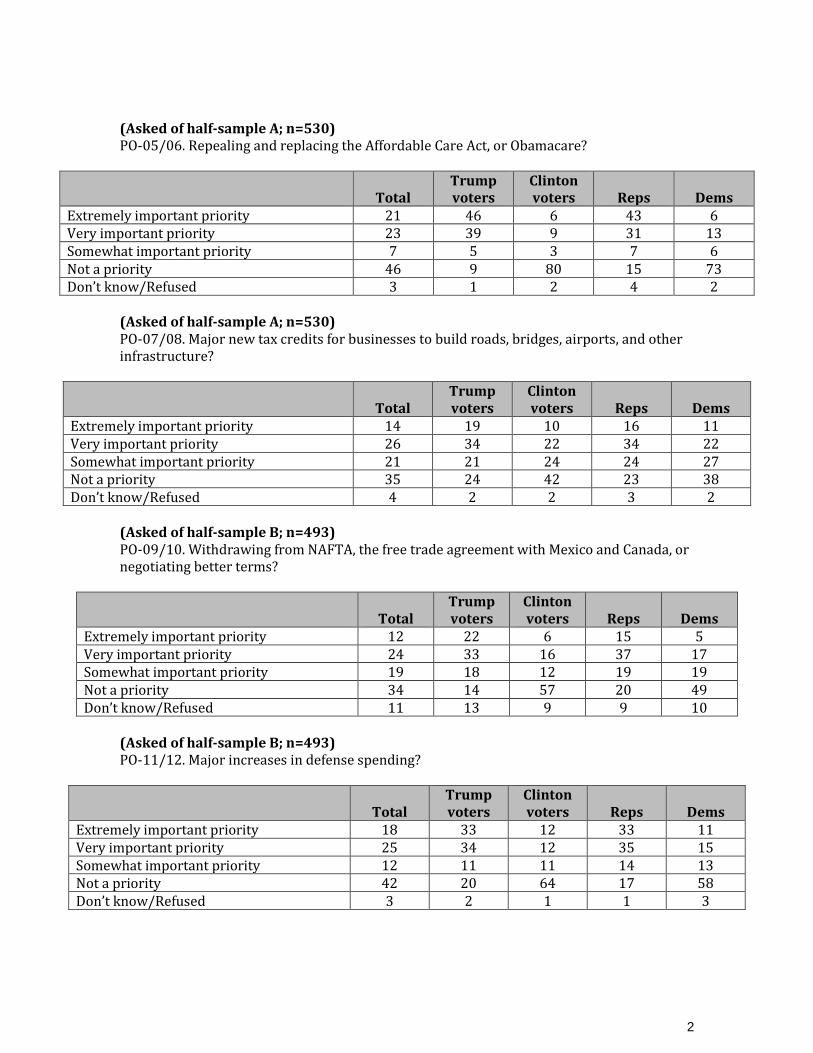
(Asked of half-sample A; n=530) PO-05/06. Repealing and replacing the Affordable Care Act, or Obamacare?
Total Trump voters
Clinton voters Reps Dems
Extremely important priority 21 46 6 43 6 Very important priority 23 39 9 31 13 Somewhat important priority 7 5 3 7 6 Not a priority 46 9 80 15 73 Don’t know/Refused 3 1 2 4 2
(Asked of half-sample A; n=530) PO-07/08. Major new tax credits for businesses to build roads, bridges, airports, and other infrastructure?
Total Trump voters
Clinton voters Reps Dems
Extremely important priority 14 19 10 16 11 Very important priority 26 34 22 34 22 Somewhat important priority 21 21 24 24 27 Not a priority 35 24 42 23 38 Don’t know/Refused 4 2 2 3 2
(Asked of half-sample B; n=493) PO-09/10. Withdrawing from NAFTA, the free trade agreement with Mexico and Canada, or negotiating better terms?
Total Trump voters
Clinton voters Reps Dems
Extremely important priority 12 22 6 15 5 Very important priority 24 33 16 37 17 Somewhat important priority 19 18 12 19 19 Not a priority 34 14 57 20 49 Don’t know/Refused 11 13 9 9 10
(Asked of half-sample B; n=493) PO-11/12. Major increases in defense spending?
Total Trump voters
Clinton voters Reps Dems
Extremely important priority 18 33 12 33 11 Very important priority 25 34 12 35 15 Somewhat important priority 12 11 11 14 13 Not a priority 42 20 64 17 58 Don’t know/Refused 3 2 1 1 3
3
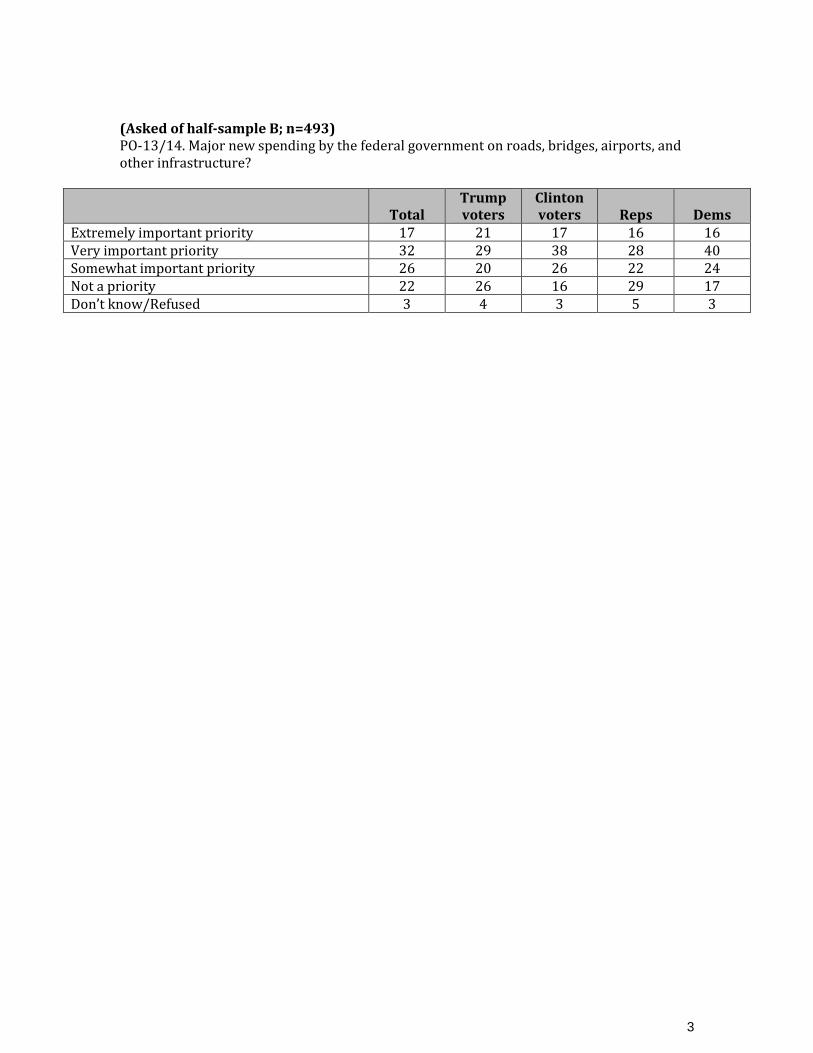
(Asked of half-sample B; n=493) PO-13/14. Major new spending by the federal government on roads, bridges, airports, and other infrastructure?
Total Trump voters
Clinton voters Reps Dems
Extremely important priority 17 21 17 16 16 Very important priority 32 29 38 28 40 Somewhat important priority 26 20 26 22 24 Not a priority 22 26 16 29 17 Don’t know/Refused 3 4 3 5 3
4
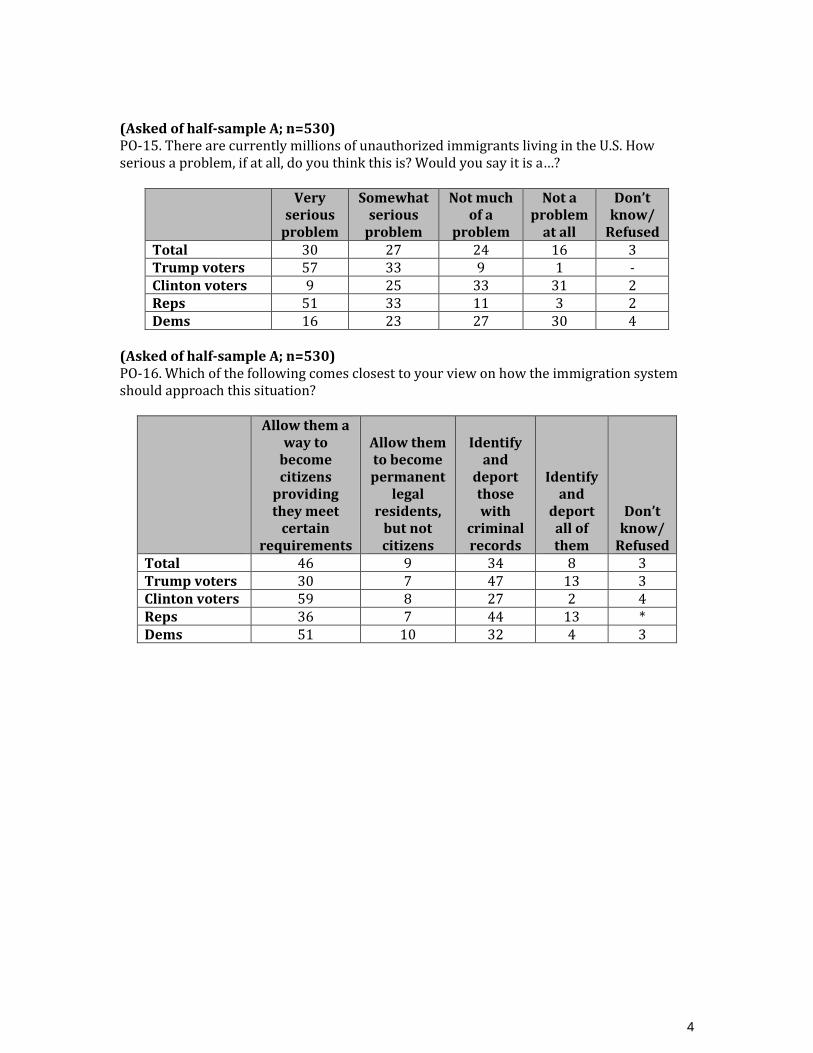
(Asked of half-sample A; n=530) PO-15. There are currently millions of unauthorized immigrants living in the U.S. How serious a problem, if at all, do you think this is? Would you say it is a…?
Very serious
problem
Somewhat serious
problem
Not much of a
problem
Not a problem
at all
Don’t know/
Refused Total 30 27 24 16 3 Trump voters 57 33 9 1 - Clinton voters 9 25 33 31 2 Reps 51 33 11 3 2 Dems 16 23 27 30 4
(Asked of half-sample A; n=530) PO-16. Which of the following comes closest to your view on how the immigration system should approach this situation?
Allow them a way to
become citizens
providing they meet
certain requirements
Allow them to become permanent
legal residents,
but not citizens
Identify and
deport those with
criminal records
Identify and
deport all of them
Don’t know/
Refused Total 46 9 34 8 3 Trump voters 30 7 47 13 3 Clinton voters 59 8 27 2 4 Reps 36 7 44 13 * Dems 51 10 32 4 3
5
(Asked of half-sample A; n=530) PO-17. On the topic of immigration, President-Elect Trump has proposed a number of initiatives. Please tell me whether you FAVOR or OPPOSE each of the following Trump proposals. a. Building a wall along the Mexican border to help stop illegal immigration
Favor Oppose Don’t know/
Refused Total 35 62 3 Trump voters 75 23 2 Clinton voters 8 92 * Reps 69 28 3 Dems 13 86 1
b. Deporting unauthorized immigrants who are currently in the U.S.
Favor Oppose Don’t know/
Refused Total 37 55 8 Trump voters 61 28 11 Clinton voters 16 83 1 Reps 64 27 9 Dems 21 76 3
c. Banning future immigration from regions where there are active terrorist groups
Favor Oppose Don’t know/
Refused Total 50 45 5 Trump voters 81 18 1 Clinton voters 25 69 6 Reps 68 28 4 Dems 38 59 3
d. Banning future immigration of people who are Muslim
Favor Oppose Don’t know/
Refused Total 18 70 12 Trump voters 29 56 15 Clinton voters 7 85 8 Reps 29 61 10 Dems 10 80 10
6
(Asked of half-sample A respondents who favor building a wall along the Mexico border to help stop illegal immigration; n=201) PO-18. You said you support President-Elect Trump’s proposal to build a wall along the Mexican border. Will you be disappointed if Trump does not build the wall?
Yes, will be
disappointed No, will not be disappointed
Don’t know/ Refused
Total 47 50 2 Trump voters 53 44 3 Clinton voters 30 70 - Reps 45 52 3 Dems 37 54 9
PO-17a/PO-18 Combo Table Based on total half-sample A; n=530
Total Trump voters
Clinton voters Reps Dems
Favor building a wall along the Mexican border to help stop illegal immigration 35 75 8 69 13
Will be disappointed if Trump does not build the wall 17 40 2 31 5
Will not be disappointed if Trump does not build the wall 18 33 6 36 7
Don’t know/Refused if disappointment if Trump does not build the wall * 2 - 2 1
Oppose building a wall along the Mexican border to help stop illegal immigration 62 23 92 28 86
Don’t know/Refused 3 2 * 3 1
7
(Asked of half-sample B; n=493) PO-19. Thinking about the future of the U.S. Supreme Court, would you prefer the Court to become…?
More liberal More
conservative
Stay about the same as it
is now Don’t know/
Refused Total 26 35 33 6 Trump voters 4 73 19 4 Clinton voters 43 6 49 2 Reps 3 75 19 3 Dems 49 9 40 2
(Asked of half Sample B; n=493) PO-20. Thinking about how the U.S. Supreme Court Justices make Court decisions, would you prefer they make Court decisions based mainly on their interpretation of the law, or based mainly on their political views?
Interpretation
of law Political
views Both equally
(vol) Don’t know/
Refused Total 85 9 1 5 Trump voters 89 5 * 6 Clinton voters 86 11 * 3 Reps 88 5 * 7 Dems 79 16 1 4
(Asked of half-sample B; n=493) PO-21. Do you think the people that President-Elect Donald Trump will nominate to be Supreme Court Justices will make decisions based mainly on their interpretation of the law, or based mainly on their political views?
Interpretation
of law Political
views Both equally
(vol) Don’t know/
Refused Total 47 39 1 13 Trump voters 74 11 1 14 Clinton voters 22 68 - 10 Reps 69 15 2 14 Dems 19 71 * 10
8
(Asked of half-sample B; n=493) PO-22. The 1973 Supreme Court ruling Roe v. Wade established the constitutional right to abortion. Should the next person nominated to be a justice of the Supreme Court be one who…?
Would uphold the
Roe v. Wade decision
Would overturn the Roe v. Wade
decision
Should their views on Roe v. Wade not
be a deciding factor
Don’t know/ Refused
Total 35 17 37 11 Trump voters 26 29 35 10 Clinton voters 58 5 31 6 Reps 23 37 33 7 Dems 48 7 31 14
9
(Asked of half-sample B; n=493) PO-23. The new Congress is going to be debating whether or not tax rates should be changed for various groups. Do you believe that federal taxes for (INSERT ITEM) should be raised, lowered, or stay about the same? a. Corporations and big businesses
Raised Lowered Stay about the same
Don’t know/ Refused
Total 41 22 32 5 Trump voters 22 39 35 4 Clinton voters 64 10 20 6 Reps 27 36 31 6 Dems 56 10 31 3
b. Upper-income Americans
Raised Lowered Stay about the same
Don’t know/ Refused
Total 45 13 40 2 Trump voters 32 18 48 2 Clinton voters 68 4 27 1 Reps 36 23 40 1 Dems 57 11 31 1
c. Middle-income Americans
Raised Lowered Stay about the same
Don’t know/ Refused
Total 5 48 46 1 Trump voters 5 59 36 - Clinton voters 7 43 48 2 Reps 9 54 37 * Dems 4 51 43 2
d. Low-income Americans
Raised Lowered Stay about the same
Don’t know/ Refused
Total 7 52 39 2 Trump voters 6 43 45 6 Clinton voters 4 59 36 1 Reps 12 46 39 3 Dems 5 65 30 *
10
(Asked of half-sample C; n=509) PO-24. Republican leaders believe that cutting taxes on corporations and businesses will create many new jobs and lead to more economic growth. If such a corporate tax cut happens, do you believe it would lead to…?
Many new jobs and
major economic
growth
Few new jobs and minor economic
growth
No new jobs or economic
growth Don’t know/
Refused Total 32 35 26 7 Trump voters 62 24 5 9 Clinton voters 9 40 46 5 Reps 63 23 8 6 Dems 13 40 40 7
(Asked of half-sample C; n=509) PO-25. Republican leaders believe that corporate tax rates in other countries are lower, and that if we lowered American corporate tax rates, then companies would bring their jobs and business back to the United States. If the U.S. lowered its corporate tax rates, how effective do you believe this would be at bringing jobs back to the U.S.?
Very
effective Somewhat effective
Not too effective
Not at all
effective
Don’t know/
Refused Total 24 39 19 15 3 Trump voters 44 47 6 2 1 Clinton voters 11 31 23 31 4 Reps 43 43 8 4 2 Dems 11 40 20 27 2
11
(Asked of half-sample D; n=514) PO-26. Republican leaders believe that cutting federal income taxes on individuals will create many new jobs and lead to more economic growth. If such a federal income tax cut happens, do you believe it would lead to…?
Many new jobs and
major economic
growth
Few new jobs and minor economic
growth
No new jobs or economic
growth Don’t know/
Refused Total 35 35 21 9 Trump voters 59 24 9 8 Clinton voters 12 47 35 6 Reps 57 28 8 7 Dems 21 43 28 8
(Asked of half-sample D; n=514) PO-27. How much do you think you yourself will benefit from the Republican proposed cuts on federal income taxes?
A lot A little Not at all Don’t know/
Refused Total 15 38 42 5 Trump voters 21 45 30 4 Clinton voters 10 26 61 3 Reps 23 45 30 2 Dems 11 34 53 2
12
PO-28. Do you favor or oppose repealing the Affordable Care Act, or Obamacare?
Favor Oppose Don’t know/
Refused Total 47 46 7 Trump voters 75 23 2 Clinton voters 22 74 4 Reps 73 24 3 Dems 30 67 3
PO-28. Do you favor or oppose repealing the Affordable Care Act, or Obamacare? (If favor repealing the Affordable Care Act, ask) PO-29. Do you prefer replacing the Affordable Care Act, or Obamacare, with an alternative plan, or not replacing it? PO-28/PO-29 Combo Table Based on Total Respondents
Total Trump voters
Clinton voters Reps Dems
Repeal and replace with an alternative plan 31 57 9 55 13 Repeal and not replace it 15 15 12 15 17 Repeal but don’t know if replace or not 1 3 1 3 * Oppose repeal 46 23 74 24 67 Don’t know/Refused 7 2 4 3 3
13
(Asked of those who favor repealing the Affordable Care Act; n=489) PO-30. If Republican leaders decide to replace Obamacare, but they say they cannot develop a replacement plan right away, how long do you think they should take to create an appropriate replacement for Obamacare?
One year Two
years Three years
As long as it
takes (vol)
Don’t know/
Refused Total 57 23 15 1 4 Trump voters 52 27 15 1 5 Clinton voters 61 19 18 - 2 Reps 53 25 13 2 7 Dems 66 11 21 * 2
(Asked of those who favor repealing the Affordable Care Act, or Obamacare; n=489) PO-31. Some Republican leaders say it may take them up to three years to develop an appropriate replacement for Obamacare. Do you think the new Congress should…?
Wait to repeal Obamacare
until they have a replacement
plan ready
Should they repeal
Obamacare as soon as possible
even if they don’t yet have a
replacement plan
Don’t know/ Refused
Total 58 39 3 Trump voters 50 44 6 Clinton voters 77 21 2 Reps 46 48 4 Dems 71 26 3
14
(Asked of half-sample A; n=530) PO-32. Over the next few years, do you think Medicare, the government health insurance program for people over 65, needs to be changed, or not?
Yes needs to be
changed
No does not need to be
changed Don’t know/
Refused Total 36 53 11 Trump voters 47 44 9 Clinton voters 28 65 7 Reps 46 46 8 Dems 25 70 5
(Asked of half-sample A; n=530) PO-32. Over the next few years, do you think Medicare, the government health insurance program for people over 65, needs to be changed, or not? (If needs to be changed, ask) PO-33. Do you think Medicare needs major changes, or only minor changes? PO-32/PO-33 Combo Table Based on total half-sample A; n=530
Total Trump voters
Clinton voters Reps Dems
Major changes 19 28 16 24 15 Minor changes 15 17 9 17 9 Needs to be changed, but don’t know/refused if major or minor 2 2 3 5 1
Do not think Medicare needs to be changed 53 44 65 46 70 Don’t know/Refused if Medicare needs to be changed 11 9 7 8 5
15
(Asked of those in half-sample A who think Medicare needs to be changed; n=200) PO-34. Republican leaders have proposed a plan, sometimes referred to as “premium support” or vouchers, that would change Medicare to a system where the government gives retirees a limited amount of money to choose among different health insurance plans, including the option of Medicare. Do you favor or oppose this plan? Is that strongly or somewhat?
Strongly
favor Somewhat
favor Somewhat
oppose Strongly oppose
Don’t know/
Refused Total 15 29 24 21 11 Trump voters 25 35 14 14 12 Clinton voters 4 10 36 38 12 Reps 30 37 11 11 11 Dems 3 21 30 32 14
PO-32/PO-34 Combo Table Based on Total Half Sample A Respondents; n=530
Total Trump voters
Clinton voters Reps Dems
Think Medicare needs to be changed 36 47 28 46 25 Strongly favor “premium support” plan 5 12 1 14 1 Somewhat favor “premium support” plan 10 16 3 17 5 Somewhat oppose “premium support” plan 8 7 10 5 7 Strongly oppose “premium support” plan 7 7 10 5 8 Don’t know/Refused on “premium support” 6 5 4 5 4
Do not think Medicare needs to be changed 53 44 65 46 70 Don’t know/Refused if Medicare needs to be changed 11 9 7 8 5
16
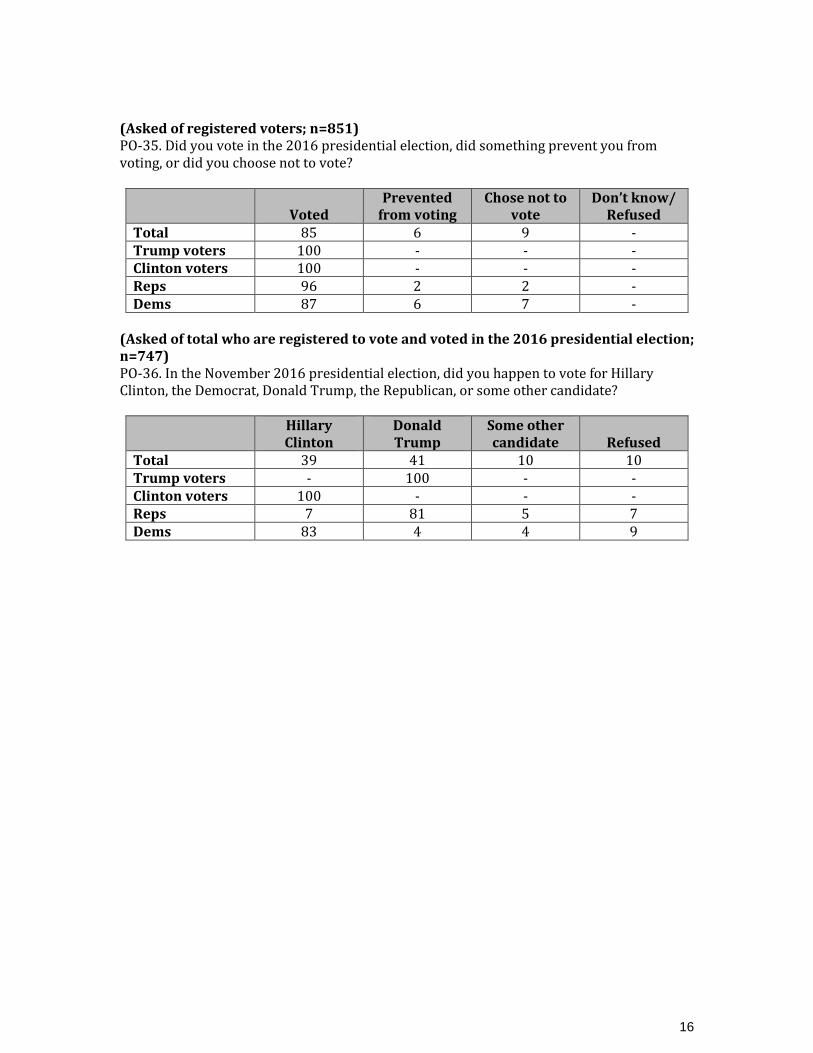
(Asked of registered voters; n=851) PO-35. Did you vote in the 2016 presidential election, did something prevent you from voting, or did you choose not to vote?
Voted Prevented
from voting Chose not to
vote Don’t know/
Refused Total 85 6 9 - Trump voters 100 - - - Clinton voters 100 - - - Reps 96 2 2 - Dems 87 6 7 -
(Asked of total who are registered to vote and voted in the 2016 presidential election; n=747) PO-36. In the November 2016 presidential election, did you happen to vote for Hillary Clinton, the Democrat, Donald Trump, the Republican, or some other candidate?
Hillary Clinton
Donald Trump
Some other candidate Refused
Total 39 41 10 10 Trump voters - 100 - - Clinton voters 100 - - - Reps 7 81 5 7 Dems 83 4 4 9