american finance association -...
TRANSCRIPT

American Finance Association
An Empirical Analysis of the Dynamic Relation between Investment-Grade Bonds and CreditDefault SwapsAuthor(s): Roberto Blanco, Simon Brennan and Ian W. MarshSource: The Journal of Finance, Vol. 60, No. 5 (Oct., 2005), pp. 2255-2281Published by: Wiley for the American Finance AssociationStable URL: http://www.jstor.org/stable/3694748 .
Accessed: 21/11/2013 10:20
Your use of the JSTOR archive indicates your acceptance of the Terms & Conditions of Use, available at .http://www.jstor.org/page/info/about/policies/terms.jsp
.JSTOR is a not-for-profit service that helps scholars, researchers, and students discover, use, and build upon a wide range ofcontent in a trusted digital archive. We use information technology and tools to increase productivity and facilitate new formsof scholarship. For more information about JSTOR, please contact [email protected].
.
Wiley and American Finance Association are collaborating with JSTOR to digitize, preserve and extend accessto The Journal of Finance.
http://www.jstor.org
This content downloaded from 193.204.46.27 on Thu, 21 Nov 2013 10:20:35 AMAll use subject to JSTOR Terms and Conditions

THE JOURNAL OF FINANCE * VOL. LX, NO. 5 0 OCTOBER 2005
An Empirical Analysis of the Dynamic Relation between Investment-Grade Bonds and Credit
Default Swaps
ROBERTO BLANCO, SIMON BRENNAN, and IAN W. MARSH*
ABSTRACT
We test the theoretical equivalence of credit default swap (CDS) prices and credit spreads derived by Duffle (1999), finding support for the parity relation as an equi- librium condition. We also find two forms of deviation from parity. First, for three firms, CDS prices are substantially higher than credit spreads for long periods of time, arising from combinations of imperfections in the contract specification of CDSs and measurement errors in computing the credit spread. Second, we find short-lived deviations from parity for all other companies due to a lead for CDS prices over credit spreads in the price discovery process.
RISKY CORPORATE AND SOVEREIGN BONDS are among the most recent securities to benefit from the trading of associated derivative contracts. This development has even drawn praise from Federal Reserve Chairman, Alan Greenspan, in a November 19, 2002, speech before the Council on Foreign Relations. Despite only coming into existence in 1992, the British Bankers' Association (BBA) estimates the total gross notional value of outstanding credit derivatives (ex- cluding asset swaps) to be U.S. $1.9 trillion at the end of 2002. The Office of the Comptroller of the Currency reports a 51.7% annual growth rate in the use of credit derivatives by U.S. banks till September 2003 and the BBA predicts that the total notional amount of credit derivatives will reach $4.8 trillion by the end of 2004 (BBA (2002)). To put this in perspective, the total notional amount
*Blanco is at the Banco de Espafia and was on secondment to the Bank of England while this
paper was being written, Brennan is at the Bank of England, and Marsh is at Cass Business School, and the Cambridge Endowment for Research in Finance. He was on leave of absence at the Bank of England when this paper was being written. We would like to thank Bill Allen, Eva Catarineu, Gordon Gemmill, Charles Goodhart, Andrew Haldane, Simon Hayes, Kevin James, David Rule, Hyun Shin, Michela Vecchi, Geoffrey Wood, seminar participants at the Bank of England, Banco de Espafia, Western Finance Association 2003, Foro de Finanzas 2003, a referee, and the editor for useful comments. Karen Goff and Andrew Paterson provided very able research assistance. CreditTrade and J.P. Morgan Securities kindly allowed us to use their credit default swap data. Numerous people at Banc of America Securities, Bloomberg, BNP Paribas, CreditTrade, Deutsche Bank, and J.P. Morgan answered our questions and corrected our misunderstandings. They know whom they are and that we are very grateful. This paper represents the views and analysis of the authors and should not be thought to represent those of the Bank of England, Monetary Policy Committee members, or the Banco de Espafia. Any errors and omissions are our own.
2255
This content downloaded from 193.204.46.27 on Thu, 21 Nov 2013 10:20:35 AMAll use subject to JSTOR Terms and Conditions

2256 The Journal of Finance
of outstanding nonfinancial corporate debt securities was $5.5 trillion at the end of 2002.
Single-name credit default swaps (CDS) account for around half of the credit derivatives market. They are the most liquid of the several credit derivatives currently traded and they form the basic building blocks for more complex structured credit products.1 A single-name CDS is a contract that provides protection against the risk of a credit event by a particular company or country. The buyer of protection makes periodic payments to the protection seller until the occurrence of a credit event or the maturity date of the contract, whichever is first. If a credit event occurs, the buyer is compensated for the loss incurred as a result of the credit event, which is equal to the difference between the par value of the bond or loan and its market value after default.2
CDSs provide a very easy way to trade credit risk. Many corporate bonds are bought by investors who simply hold them to maturity (Alexander, Edwards, and Ferri (1998)). Secondary market liquidity is therefore often poor, thereby making the purchase of large amounts of credit risk in the secondary cash market difficult and costly (Schultz (1998)). Shorting credit risk is even more difficult in the cash market. The repurchase agreement (repo) market for risky bonds is often illiquid, and even if a bond can be shorted on repo, the tenor of the agreement is usually very short. Credit derivatives, especially CDS, allow investors to short credit risk over a longer period of time at a known cost by buying protection.
This paper tests the validity of a theoretical arbitrage relation equating CDS prices to credit spreads for a sample of 33 U.S. and European investment-grade firms for which high-quality time-series data are available. We find that this parity relation holds on average over time for most companies, suggesting that the bond and CDS markets price credit risk equally. However, we also note two forms of deviation from parity. First, for three European firms, we find that CDS prices are substantially higher than credit spreads for long periods of time. We attribute these cases to a combination of both imperfections in the contract specification of CDSs and measurement errors in computing the credit spread. Second, we find short-lived deviations from parity for all the other companies in the sample. We show that these are due to a clear lead for CDS prices over credit spreads in the price discovery process.
These results have implications for the information content of credit risk indicators. Although credit spreads have been the traditional indicator, they have drawbacks. Our results suggest that CDSs contain useful information: (i) They are an upper bound on the price of credit risk (while credit spreads form a lower bound) and (ii) CDS prices lead in the price discovery process. Combined
1 Other basic credit derivatives include total return swaps, where the return from one asset or
group of assets is swapped for the return on another, and credit spread options, which are options on the spread between the yield earned on two assets.
2 The economic effect of a CDS is similar to that of an insurance contract. The legal distinction comes from the fact that it is not necessary to hold an insured asset (e.g., the underlying bond or loan) in order to claim "compensation" under a CDS. Speculators can take long (short) positions in credit risk by selling (buying) protection without needing to trade the cash instrument.
This content downloaded from 193.204.46.27 on Thu, 21 Nov 2013 10:20:35 AMAll use subject to JSTOR Terms and Conditions

Investment-Grade Bonds and Credit Default Swaps 2257
with the fact that CDSs are a cleaner indicator than bond spreads, our findings suggest that CDS prices are useful indicators for analysts interested in mea- suring credit risk.3
The paper is organized as follows. The following section describes the CDS market and the relation between CDS prices and credit spreads. Section II describes the data. Section III investigates empirically the short- and long- term relations between CDS prices and spreads. Section IV contains concluding comments.
I. Credit Default Swaps and Credit Spreads A. The Credit Default Swap Market
In a CDS, the protection seller agrees to compensate the protection buyer if a default event occurs before maturity of the contract. If there is no default event before maturity, the protection seller pays nothing. The protection seller charges a fee for the protection. This is typically a constant quarterly fee paid until default or maturity, whichever is first. Should a default event happen, the accrued fee is also paid. We refer to the annualized fee as the CDS price. The payment on default is either repayment at par against physical delivery of a reference asset (physical settlement) or the notional amount minus the post- default market value of the reference asset (cash settlement). Physical delivery is the dominant form of settlement in the market. A broad set of debt obligations is deliverable as long as they rank pari passu with the reference asset. Default events for CDSs might include some or all of the following:
A. Bankruptcy B. Failure to pay C. Obligation default or acceleration D. Repudiation or moratorium (for sovereign entities) E. Restructuring.
The first four are not particularly contentious, although the evolving Interna- tional Swaps and Derivatives Association (ISDA) documentation has dropped events C and D in some jurisdictions since they have been deemed subsumed by events A and B for nonsovereign credits. Restructuring, however, has been and remains a source of controversy in the CDS market. The 1999 ISDA documen- tation defines restructuring to constitute a default event if either the interest rate or the principal paid at maturity are reduced or delayed, if an obligation's ranking in payment priority is lowered, or if there is a change in currency or composition of any payment (excluding adoption of the euro by a member state of the European Union). The key problem is that not all deliverable as- sets necessarily become due and payable should restructuring occur, and it is conceivable that some deliverable obligations will be cheaper than others. This
3 Unlike bonds, CDSs have a constant maturity, the underlying instrument is always par valued, and they concentrate liquidity in one instrument.
This content downloaded from 193.204.46.27 on Thu, 21 Nov 2013 10:20:35 AMAll use subject to JSTOR Terms and Conditions

2258 The Journal of Finance
is likely to be particularly acute in cases in which deliverable assets include very long-dated or convertible bonds that often trade at a discount to shorter dated straight bonds. This means that where there is a nonnegligible proba- bility of a restructuring that falls short of making all debt due and payable, and, where some obligations trade at a substantial discount to others, then a physically settled CDS price also contains a cheapest-to-deliver (CTD) option and is not a pure measure of credit risk. European CDSs traded on the basis of this definition throughout our data sample. U.S. CDSs have been subject to a Modified Restructuring definition since May 11, 2001, that, among other aspects, restricts the scope of deliverable assets and specifically prevents the delivery of very long-dated bonds. This reduces the value of the delivery option in U.S. default swaps.
B. Pricing of Credit Risk
There is a large and growing literature on the pricing of credit risk, within which two approaches dominate. Structural models are based on the value of the firm and are usually derived from Merton (1974). In this class of models, default occurs when the process describing the value of the firm hits a given bound- ary. Black and Cox (1976), Geske (1977), and Longstaff and Schwartz (1995) are three of many important references. Das (1995) and Pierides (1997) apply structural models to the pricing of credit derivatives. The second approach, usu- ally termed reduced-form or intensity-based models, instead assumes that the timing of default is specified in terms of a hazard rate. Leading reduced-form frameworks include Jarrow and Turnbull (1995), Jarrow, Lando, and Turnbull (1997), and Duffie and Singleton (1999). Das and Sundaram (1998), Duffle (1999), Houweling and Vorst (2002), and Hull and White (2000a, 2000b) ap- ply reduced-form models to credit derivatives. Both structural and reduced- form approaches are very comprehensively surveyed by Lando (1997) and Schonbucher (2000).
This paper does not contribute to the literature on credit risk pricing. Instead, it makes use of the approximate arbitrage relation that exists between CDS prices and credit spreads for a given reference entity, as discussed in Duffle (1999) and Hull and White (2000a). Begin with a loose approximate arbitrage relation. Suppose an investor buys a T-year par bond with yield to maturity of y issued by the reference entity, and buys credit protection on that entity for T years in the CDS market at a cost of PCDS. The investor has eliminated most of the default risk associated with the bond. If PCDS is expressed annually as a percentage of the notional principal, then the investor's net annual return is y - PCDS. By arbitrage, this net return should approximately equal the T- year risk-free rate, denoted by x. Ify - PCDS is less than x, then shorting the risky bond, writing protection in the CDS market, and buying the risk-free instrument would be a profitable arbitrage opportunity. Similarly, ify - PCDS exceeds x, buying the risky bond, buying protection, and shorting the risk-free bond would be profitable. This suggests that the price of the CDS, pCDS, should equal the credit spread, y - x.
This content downloaded from 193.204.46.27 on Thu, 21 Nov 2013 10:20:35 AMAll use subject to JSTOR Terms and Conditions
Investment-Grade Bonds and Credit Default Swaps 2259
This is the relation used in the empirical analysis that follows, although we recognize that the arbitrage is only perfect in some instances. Duffie (1999) shows that the spread on a par risky floating-rate note over a risk-free floating- rate note exactly equals the CDS price. Unfortunately, floating-rate notes are rare. The spread on a par fixed-coupon risky bond over the par fixed- coupon risk-free bond exactly equals the CDS price if the payment dates on the CDS and bond coincide, and recovery on default is a constant fraction of face value (Houweling and Vorst (2002)). Alternatively, with a flat risk- free curve and constant interest rates, the arbitrage is perfect if the payout from a CDS on default is the sum of the principal amount plus accrued in- terest on a risky par yield bond times one minus the recovery rate (Hull and White (2000a)). As noted above, however, the payout from a CDS usu- ally equals the principal amount minus the recovery rate times the sum of principal and accrued interest on the reference obligation. Nevertheless, the referenced papers show that the arbitrage is reasonably accurate (within 5- 10 basis points) for assets trading close to par when interest rates are not high and yield curves are relatively flat, as was the case in our sample period.
Three other considerations are relevant. First, as noted above, physically settled CDS prices, especially for European entities, may contain CTD op- tions. Other things equal, this will lead to CDS prices being greater than the credit spread. Unfortunately, it is impossible to value this option analyti- cally since there is no benchmark for the post-default behavior of deliverable bonds, so we cannot simply subtract its value from the CDS price. Second, the arbitrage relation that should keep the two prices together may rely on short selling the cash bond. This is not always costless and indeed is some- times not even possible in illiquid corporate bond markets. If the repo cost of shorting the cash bond is significant, then the credit spread we have com- puted (bond yield minus risk-free rate) underestimates the true credit spread (bond yield minus risk-free rate plus repo cost). Again, the CDS price will tend to be greater than the measured credit spread (Duffle (1999)). Quanti- fying these two factors is difficult in the absence of reliable repo cost data or a valuation model for the option. However, since both the repo cost and the option value are bounded at zero, we can say that the CDS price is an up- per limit on the price of credit risk while the credit spread provides a lower limit.
Third, liquidity premia exist in both the cash bond and CDS markets. The cash bond market is often described as relatively illiquid, particularly outside the United States. Movements in liquidity premia may explain a large proportion of the total variation in credit spreads (Collin-Dufresne, Goldstein, and Martin (2001)). The CDS market is still relatively small despite its rapid recent growth and so demand/supply imbalances can of- ten cause short-term price movements unrelated to default expectations. We make strenuous efforts to reduce the importance of liquidity premia for the reference entities that we examine, as detailed in the following section.
This content downloaded from 193.204.46.27 on Thu, 21 Nov 2013 10:20:35 AMAll use subject to JSTOR Terms and Conditions

2260 The Journal of Finance
II. Data Description
A. Credit Default Swap Data
CDSs are over-the-counter derivatives traded mainly in London and New York. We use daily indicative bid and ask prices from CreditTrade, a CDS broker, for single-name CDSs that they deem to be liquid. The data run from January 2, 2001, through June 20, 2002. The prices are for a notional value of $10 million and are based on the standard ISDA contract for physical settlement. All prices are for 5 years, which is by far the most liquid maturity in the CDS market. The prices hold at "close of business" (approximately 5 p.m. local time) in London for European reference entities, or New York for U.S. names. Some time-series have missing or, very occasionally, suspicious values. We use mid-market data supplied by J.P. Morgan, one of the leading players in the CDS market, to fill in missing values, check suspicious entries, and for general confirmation of the CreditTrade data.4 J.P. Morgan's mid-market prices are only rarely outside the bid-ask quotes from CreditTrade. We can compute a consistent series of mid-market quotes for 119 companies over at least 250 days by combining data sources.
B. Risky Bond Yield Data
In order to match the constant 5-year maturity of the CDS contracts, we need 5-year bond yields. For each reference entity with suitable CDS data, we search Bloomberg for a bond with between 3 and 5 years left to maturity at the start of our sample period, and another bond with more than 6.5 years to maturity at the start of the sample. By linearly interpolating these yields, we are able to estimate a 5-year yield to maturity for the full sample without extrapolating. We exclude floating-rate securities and all bonds that have embedded options, step-up coupons, sinking funds, or any special feature that would result in dif- ferential pricing. We also seek to minimize the possible impact of illiquidity that appears problematic in previous studies using corporate bonds and therefore only use yields calculated from so-called "generic" Bloomberg mid-market bond prices. These are a weighted average of firm and indicative quotes submitted by at least five brokers or dealers. The exact weighting method is proprietary, but firm quotes receive a higher weight than merely indicative quotes. The risky bond data are also at close of business but this tends to be slightly later than the close in the CDS market (e.g., 5:50 p.m. Eastern Standard Time for U.S. corporate bonds).
Where a choice of liquid bond yields is available, we use bonds trading rela- tively close to par, and, if a choice remains, bonds whose maturity more closely corresponds with our needs: We prefer par bonds due to the imperfect arbi- trage considerations mentioned above, and we prefer close maturities in order to reduce the errors caused by our choice of linear interpolation.
4 J.P. Morgan was the most active trader in the Cossin et al. (2002) CDS transactions database.
This content downloaded from 193.204.46.27 on Thu, 21 Nov 2013 10:20:35 AMAll use subject to JSTOR Terms and Conditions

Investment-Grade Bonds and Credit Default Swaps 2261
C. Reference Rate Yield Data
The reference rate is used to proxy the risk-free interest rate when credit spreads are calculated. Government bond yields are the obvious choice, and we use 5-year government bond mid-market yields. The curves are constructed using Treasuries for U.S. reference entities and German government bonds for European entities. However, it is well-known that government bonds are no longer an ideal proxy for the unobservable risk-free rate. Taxation treatment, repo specials, scarcity premia, and benchmark status may each have an impact. As an alternative proxy, we also collect 5-year swap rates for dollars and euros. Swaps, being synthetic, are available in virtually unlimited quantities so that liquidity is not an issue, and they have the further advantage of being quoted on a constant maturity basis. McCauley (2002) contains a discussion of the swap rate's role as a benchmark. However, swaps contain credit premia because (i) the floating leg is indexed to LIBOR, which is itself a default-risky interest rate (Sundaresan (1991)), and (ii) there is some counterparty risk (although Duffie and Huang (1996) show that this accounts for just 1-2 basis points). Collin-Dufresne and Solnik (2001) note that the n-year swap rate should be thought of as the rate of interest on an n-year loan that is structured such that the obligor is certain to have an acceptable credit rating at the beginning of each accrual period. This accrual period is 6 months for plain vanilla swaps in the United States but may be as high as 12 months in other markets. Since 1-year default probabilities of AA-rated institutions are very low, it is clear that swap rates are almost (but not quite) risk-free rates.5 Duffie (1999) and Houweling and Vorst (2002) recommend using general collateral or repo rates in preference to swaps, arguing that these are liquid and virtually risk-free. Accordingly, such rates lie below maturity-matched swap rates. Unfortunately, general collateral rates are available only for maturities up to 1 year, and since the term structure is typically upward sloping during our data period, we prefer to use swap rates.
The 33 reference entities for which we can find both CDS and interpolated bond yields are listed in Table I. This is a small cross section of the 157 U.S. and European reference entities in the CreditTrade CDS database of liquid credits. Of these, 38 are dropped due to insufficient CDS data and 86 due to lack of bond data. In many cases, matrix bond prices are available but we are reluctant to use these due to problems relating to the accuracy, reliability, and timeliness of such data. The data we use are not ideal. For example, we would have preferred to use transactions prices rather than quotes. Cossin et al. (2002) consider CDS transactions data but do not have enough observations on particular reference entities to perform time-series analysis. Month-end corporate bond transactions data are available from Capital Access International (used by Blume, Lim, and MacKinlay (1998), Schultz (1998), and Hong and Warga (2000)), but we need a daily frequency to match the CDS data. The data we use are thus the best currently available for our purpose.
5 See also Hull, Predescu, and White (2003) and He (2002) for further elaboration on this point.
This content downloaded from 193.204.46.27 on Thu, 21 Nov 2013 10:20:35 AMAll use subject to JSTOR Terms and Conditions

2262 The Journal of Finance
Table I
Descriptive Statistics This table lists the reference entities in our sample, together with basic descriptive information and the number of observations in the CDS and credit spread series. See Section II of the paper for details on the criteria for inclusion in the sample.
Observations
Country Sector Rating CDS Bond Yield
AOL United States Internet BBB 370 381 Bank of America United States Banking A 378 381 Bank One United States Banking A 378 376 Bear Steams United States Banking A 371 376
Citigroup United States Banking AA 378 383 FleetBoston United States Banking A 353 329 Ford Motor United States Automobile/finance BBB 378 359
Credit Corp GE Capital Corp United States Finance AAA 365 382 General Motors United States Automobile/finance BBB 350 374
Credit Corp Goldman Sachs United States Banking A 378 381 J.P. Morgan Chase United States Banking AA 350 369 Lehman Brothers United States Banking A 378 377 Merrill Lynch United States Banking AA 378 378
Morgan Stanley United States Banking AA 378 375 Wal-Mart United States Retail AA 378 371 Wells Fargo United States Banking A 367 350
Barclays United Kingdom Banking AA 367 271 British Telecom United Kingdom Telecommunications A 378 377 Commerzbank Germany Banking A 367 258
DaimlerChrysler Germany Automobile BBB 360 376 Deutsche Telecom Germany Telecommunications BBB 378 382 Dresdner Bank Germany Banking AA 367 382 Endesa Spain Utilities A 367 349 Fiat Italy Automobile A 367 383 France Telecom France Telecommunications BBB 378 380 Iberdrola Spain Utilities A 367 379 Metro Germany Retail BBB 287 337 Siemens Germany Telecommunications AA 367 265 Telefonica Spain Telecommunications A 378 382 Total Fina Elf France Oil AA 367 374 United Utilities United Kingdom Utilities A 365 365 Vodafone United Kingdom Telecommunications A 378 379 Volvo Sweden Automobile A 367 382
III. The Empirical Relation between Credit Default Swaps and Credit Spreads
A. Average Pricing of Credit Risk
If both CDS and cash bonds price default risk equally, then subject to the ar- bitrage imperfections noted above, the spread on the risky bond over a risk-free
This content downloaded from 193.204.46.27 on Thu, 21 Nov 2013 10:20:35 AMAll use subject to JSTOR Terms and Conditions

Investment-Grade Bonds and Credit Default Swaps 2263
350
300
250
c
S200
150
100
50 02/01/01 02/03/01 02/05/01 02/07/01 02/09/01 02/11/01 02/01/02 02/03/02 02/05/02
CDS - Credit spread
Figure 1. CDS price and credit spread over swaps for Ford.
reference rate should equal the CDS price of the same maturity. Define the ba- sis to be the difference between the time t CDS price, PCDS,t, and the credit spread, pcs,t:
basiSswaps swaps swaps basistwaps - PCDS,t - Pcs,t = PCDSt
--Y--Xt
basisovt sPCDS,t -=PS = PCDS,t -
(Yt
- Xgovt),
where 9 denotes the interpolated 5-year yield on the risky bond, xswaps denotes the 5-year swap rate, and xgovt is the 5-year government bond yield. Figure 1 gives a representative plot of daily CDS prices and credit spreads over swaps for Ford Motor Credit Corp. The difference is small and not always of the same sign.
In the first panel of Table II, we give the average basis and the average absolute basis for each of our 33 reference entities, using both swap rates and government bond yields as candidate reference rates. The mean basis across all companies and time periods is -41 basis points using 5-year government bond yields and +6 basis points if 5-year swap rates are used. Similarly, the mean average absolute basis falls from 46 basis points over government bonds to 15 basis points over swaps.6 Using median values does not alter the story. These results are consistent with Houweling and Vorst (2002) who find an average absolute pricing error of around 11 basis points when using swap rates
6To put these numbers in perspective, we find that the average bid-ask spread in the CDS (indicative) quotes across all reference entities and over the full sample period was 12 basis points, and the average spread in the cash bond market was around 9.5 basis points.
This content downloaded from 193.204.46.27 on Thu, 21 Nov 2013 10:20:35 AMAll use subject to JSTOR Terms and Conditions

2264 The Journal of Finance
Table II
Discrepancies in the Average Pricing of Credit Risk in CDS and Cash Bond Markets
Panel A provides descriptive statistics of the basis, defined to be the difference between the CDS price and the credit spread, for each reference entity and expressed in basis points. The credit spread is calculated as the difference between the interpolated 5-year yield on the risky bonds and either the 5-year Treasury bond rate or the 5-year swap rate. Panel B provides summary statistics for groups of bonds according to rating and nationality.
Panel A
Treasury Rates Swap Rates
Average Average Absolute Average Average Absolute Basis Basis Basis Basis
AOL -49.4 51.1 13.0 16.6 Bank of America -66.1 66.1 -3.6 10.0 Bank One -68.0 68.0 -5.6 8.9 Bear Stearns -67.6 67.6 -9.6 12.7
Citigroup -56.8 56.8 5.7 7.6 FleetBoston -60.6 60.6 7.1 8.5 Ford Motor Credit Corp -59.5 59.8 2.6 11.1 GE Capital Corp -38.7 38.9 23.2 23.2 General Motors Credit Corp -51.8 51.8 10.7 12.1 Goldman Sachs -66.3 66.3 -3.8 7.7 J.P. Morgan Chase -65.0 65.0 0.9 11.5 Lehman Brothers -70.2 70.2 -7.8 10.4 Merrill Lynch -57.5 57.5 6.3 10.2
Morgan Stanley -63.0 63.0 -0.4 9.4 Wal-Mart -42.0 42.0 20.6 20.8 Wells Fargo -66.8 66.8 -3.8 7.0
Barclays -17.8 17.8 5.9 6.1 British Telecom -73.3 73.3 -10.1 15.0 Commerzbank -11.6 12.0 12.8 12.9 DaimlerChrysler -54.9 54.9 7.9 11.3 Deutsche Telecom -5.2 22.5 23.2 24.1 Dresdner Bank -22.2 22.2 5.0 6.8 Endesa -37.1 37.1 -9.9 9.9 Fiat 15.6 51.8 44.0 45.3 France Telecom 35.8 42.0 64.2 64.2 Iberdrola -45.2 45.2 -16.7 16.7 Metro -30.6 30.6 -17.3 17.9 Siemens -13.4 14.5 10.9 11.0 Telefonica -16.1 17.8 12.3 12.5 Total Fina Elf -37.2 37.2 -9.2 9.9 United Utilities -33.0 33.0 -4.6 5.7 Vodafone -14.1 16.6 14.4 14.4 Volvo -35.8 35.8 -7.3 10.1
Mean -40.8 45.9 5.5 14.6 Median -45.2 51.1 5.0 11.1
(continued)
This content downloaded from 193.204.46.27 on Thu, 21 Nov 2013 10:20:35 AMAll use subject to JSTOR Terms and Conditions

Investment-Grade Bonds and Credit Default Swaps 2265
Table II-Continued
Panel B
Treasury Rates Swap Rates
Average Average Absolute Average Average Absolute Means Basis Basis Basis Basis
AAA-AA -41.4 41.5 6.9 11.6 A -44.8 49.3 0.5 13.0 BBB -30.8 44.7 14.9 22.5 United States -59.3 59.5 3.0 11.7 Europe -23.3 33.2 7.5 17.9
and 33 basis points when using Treasury yields for bonds rated A and AA. Panel B of Table II gives mean average basis and mean average absolute basis with the data split by credit rating and location. The mean average absolute basis over swaps rises as credit quality (proxied by rating) declines, a finding also emphasized by Houweling and Vorst (2002). Similarly, the basis over swaps is higher for European corporates than U.S. corporates (partly because the av- erage rating of the European corporates is lower). We compute credit spreads using swap rates rather than government bonds as the proxy for default-free interest rates in our subsequent analysis.
The previous results suggest that the theoretical relation linking credit spreads over the risk-free rate to CDS prices holds reasonably well on average for most reference entities (and especially for U.S. firms). However, for some reference entities, the average basis over swaps is meaningfully greater than zero. The two extreme cases are France Telecom (64 basis points) and Fiat (45 basis points), with the former plotted in Figure 2. Traders indicate that large and persistent positive bases such as these are due to the presence of the two imperfections noted above-nonzero repo costs in the bond market leading to an underestimated true credit spread, and the CTD option that inflates the CDS price. J. P. Morgan (2002) illustrates the importance of including repo costs for 19 bonds with a large basis on August 16, 2002 (unfortunately just after our sample ends). In their sample, a France Telecom 8-year bond had the highest basis on that day (186 basis points), but it was impossible to borrow this bond on repo, making the true credit spread impossible to calculate.
The average basis for the remaining 18 bonds in J.P. Morgan's sample was 103 basis points, but once the repo cost was added to the credit spread over swaps, the average repo-adjusted basis fell to 13 basis points. High basis levels remain for some bonds even after including repo costs. For example, the eight European reference entities on the J.P. Morgan list had an average basis of 96 basis points and an average repo-adjusted basis of 29 basis points.7 This rather
7 The U.S. entities had an average basis of 109 basis points and an average repo-adjusted basis of -0.5 basis points, consistent with the hypothesis that CTD options are less important in this jurisdiction.
This content downloaded from 193.204.46.27 on Thu, 21 Nov 2013 10:20:35 AMAll use subject to JSTOR Terms and Conditions

2266 The Journal of Finance
500
450
400
350
300
C. 250
200
150
100
50
0
02/01/01 02/03/01 02/05/01 02/07/01 02/09/01 02/11/01 02/01/02 02/03/02 02/05/02
- CDS - Credit spread
Figure 2. CDS price and credit spread over swaps for France Telecom.
large residual is likely to be due to the CTD option. A natural experiment il- lustrates this point. The average basis for Fiat from the start of our sample to December 10, 2001, is just 8.8 basis points, suggesting no large repo costs or valuable CTD option. On December 11, 2001, Fiat issued a bond convertible into the stock of General Motors that traded at a substantial discount to ex- isting straight Fiat bonds. If restructuring was thought possible for Fiat (and press reports around the time suggest it was), this would increase the value of the CTD option since this was a deliverable bond under prevailing ISDA documentation. Immediately following the issue, the basis jumped to 50 basis points, due almost entirely to the increase in the CDS price. Since we have no evidence that Fiat's extant straight bonds went special after the issue, we as- cribe this jump in the basis to the newly emerged CTD option value.8 Figure 3 illustrates the behavior of the CDS price, credit spread, and basis around this time.
A more formal test of the equivalence of the price of credit risk across the two markets over time can be specified in terms of transitory and permanent price movements. Suppose that the unobservable efficient price of credit risk, mt, follows a random walk,
mt = mt-1 + ut, (2)
I The basis also jumped in subsequent months when Fiat was affected by rating agency actions and equity issuance likely to have altered the valuation of the option.
This content downloaded from 193.204.46.27 on Thu, 21 Nov 2013 10:20:35 AMAll use subject to JSTOR Terms and Conditions

Investment-Grade Bonds and Credit Default Swaps 2267
200 80
190
60 180
170 40
160
.SE
01 20 140 -2
,L
130
120 -20
110
100 _ -40
F 0o oa
a C CaS a Cedi a Ba si 0H CS
-OD Crdi scpread -Bas cO
--CDS Credit spread ------ Basis (RHS}
Figure 3. Fiat's convertible bond issue and the value of the CTD option.
where ut is independently and identically distributed with zero mean and con- stant variance. The observed price in each marketj at time t, pj,t, is equal to this efficient price plus a component containing microstructural noise, sj,t, assumed to be transient, plus a component reflecting other possibly nontransient factors included in the observed price, dj,t,
Pj,t = mt + sj,t + dj,t, j = CDS, CS. (3)
If the two markets price credit risk equally in the long run, then their prices should be cointegrated with cointegrating vector [1, -1, c], suggesting a sta- tionary basis. The constant in the cointegrating space, c, should equal zero, but since we know that our proxy for the risk-free rate is imperfect, we do not im- pose this condition. If the prices do not cointegrate with the [1, -1, c] restriction imposed, then (i) the two markets price risk differently (in excess of a constant amount), (ii) at least one market price contains time-varying nontransient fac- tors that reflect something other than credit risk, or (iii) at least one market price contains time-varying nontransient measurement error. From our discus- sion of CDS contract specifications in Section IA, we suspect a priori that some CDS prices may contain a CTD option related to restructuring, which is likely to result in a case (ii) failure of the cointegration tests. Further, from Section II.B, we know that the credit spread as measured ignores the repo cost of the bond. If this cost is significant and not purely a short-term phenomenon, we might expect a case (iii) failure of the cointegration tests.
The use of cointegration techniques (and terms such as "the long run") might appear inappropriate with a data set covering only 18 months. However, since
This content downloaded from 193.204.46.27 on Thu, 21 Nov 2013 10:20:35 AMAll use subject to JSTOR Terms and Conditions

2268 The Journal of Finance
we are examining an arbitrage relation, we expect relatively rapid reversion to equilibrium-indeed, we find below that the average half-life of deviations across our panel is around 6 days. Hakkio and Rush (1991) argue that in coin- tegration analysis, the ratio of the length of the data set to the half-life is more relevant than the length of the data set alone. Our data suggest a ratio of around 65. Studies of foreign exchange purchasing power parity, which routinely deploy cointegration techniques, would need 200 years of data to match this ratio.
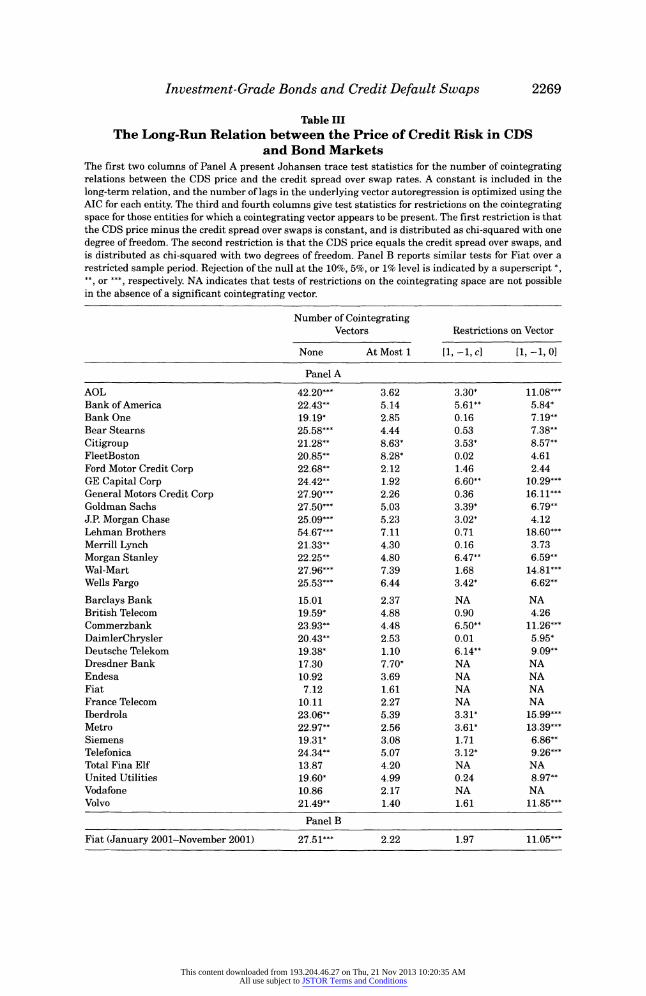
We report Johansen cointegration test results for each reference entity in Table III. There is evidence of cointegration under the imposed restriction of a stationary basis for each U.S. reference entity examined.9 For these firms, the CDS and bond markets appear to price risk equally on average, at least up to a constant term that possibly reflects mismeasurement of the risk-free rate. Further, we cannot reject the additional restriction that the constant is zero in the cointegrating vector for 11 of the 16 U.S. entities at the 1% level, suggesting for these names that the credit spread over swaps equals the CDS price over the long run.
We find support for cointegration for only 10 of the 17 European entities. Of these 10, a stationary basis can be rejected in two cases and a zero long- run basis is rejected in 8 cases at the 5% level. The "usual suspects"-France Telecom and Fiat-are included in the list of firms that reject cointegration, together with Vodafone, another firm with a large average basis over swaps from Table II. As we have noted, Fiat clearly suffers from the sudden emergence of a CTD option and we cannot reject the null of a stationary basis using data up to the emergence of the delivery option (see Panel B). Surprisingly, four entities with small average bases also reject cointegration. We suspect that this is because bid-ask spreads are proportionately so wide that the CDS price and credit spread have moved in seemingly unrelated ways without arbitrage forces coming into effect during our relatively short sample period.
B. Price Discovery
The analysis in the previous section concentrates on the long-run equilibrium behavior of the series. In the rest of the paper, we analyze the dynamic behavior of CDS prices and credit spreads with a focus on lead-lag relations. One of the objectives of the paper is to evaluate the information content of indicators of the price of credit risk, so it is important to know which market provides more timely information.
One of the key functions of financial markets is price discovery, defined by Lehmann (2002) to be the efficient and timely incorporation of the information implicit in investor trading into market prices. When there is only one location for trading an asset, by definition all price discovery takes place in that market place. When closely related assets trade in different locations, order flow is fragmented and price discovery is split among markets. We have demonstrated
9 The presence of a cointegrating vector is suggested for all 16 U.S. companies. Of these, three reject the restriction of a stationary basis at the 5% level but none reject at the 1% level.
This content downloaded from 193.204.46.27 on Thu, 21 Nov 2013 10:20:35 AMAll use subject to JSTOR Terms and Conditions
Investment-Grade Bonds and Credit Default Swaps 2269
Table III The Long-Run Relation between the Price of Credit Risk in CDS
and Bond Markets The first two columns of Panel A present Johansen trace test statistics for the number of cointegrating relations between the CDS price and the credit spread over swap rates. A constant is included in the long-term relation, and the number of lags in the underlying vector autoregression is optimized using the AIC for each entity. The third and fourth columns give test statistics for restrictions on the cointegrating space for those entities for which a cointegrating vector appears to be present. The first restriction is that the CDS price minus the credit spread over swaps is constant, and is distributed as chi-squared with one degree of freedom. The second restriction is that the CDS price equals the credit spread over swaps, and is distributed as chi-squared with two degrees of freedom. Panel B reports similar tests for Fiat over a restricted sample period. Rejection of the null at the 10%, 5%, or 1% level is indicated by a superscript *, **, or ***, respectively. NA indicates that tests of restrictions on the cointegrating space are not possible in the absence of a significant cointegrating vector.
Number of Cointegrating Vectors Restrictions on Vector
None At Most 1 [1, -1, c] [1, -1, 0]
Panel A
AOL 42.20*** 3.62 3.30* 11.08*** Bank of America 22.43** 5.14 5.61** 5.84* Bank One 19.19* 2.85 0.16 7.19** Bear Stearns 25.58*** 4.44 0.53 7.38** Citigroup 21.28** 8.63* 3.53* 8.57** FleetBoston 20.85** 8.28* 0.02 4.61 Ford Motor Credit Corp 22.68** 2.12 1.46 2.44 GE Capital Corp 24.42** 1.92 6.60** 10.29*** General Motors Credit Corp 27.90*** 2.26 0.36 16.11*** Goldman Sachs 27.50*** 5.03 3.39* 6.79** J.P. Morgan Chase 25.09*** 5.23 3.02* 4.12 Lehman Brothers 54.67*** 7.11 0.71 18.60*** Merrill Lynch 21.33** 4.30 0.16 3.73 Morgan Stanley 22.25** 4.80 6.47** 6.59** Wal-Mart 27.96*** 7.39 1.68 14.81*** Wells Fargo 25.53*** 6.44 3.42* 6.62**
Barclays Bank 15.01 2.37 NA NA British Telecom 19.59* 4.88 0.90 4.26 Commerzbank 23.93** 4.48 6.50** 11.26*** DaimlerChrysler 20.43** 2.53 0.01 5.95* Deutsche Telekom 19.38* 1.10 6.14** 9.09** Dresdner Bank 17.30 7.70* NA NA Endesa 10.92 3.69 NA NA Fiat 7.12 1.61 NA NA France Telecom 10.11 2.27 NA NA Iberdrola 23.06** 5.39 3.31* 15.99*** Metro 22.97** 2.56 3.61* 13.39*** Siemens 19.31* 3.08 1.71 6.86** Telefonica 24.34** 5.07 3.12* 9.26*** Total Fina Elf 13.87 4.20 NA NA United Utilities 19.60* 4.99 0.24 8.97** Vodafone 10.86 2.17 NA NA Volvo 21.49** 1.40 1.61 11.85***
Panel B
Fiat (January 2001-November 2001) 27.51*** 2.22 1.97 11.05***
This content downloaded from 193.204.46.27 on Thu, 21 Nov 2013 10:20:35 AMAll use subject to JSTOR Terms and Conditions

2270 The Journal of Finance
that both the cash bond and CDS markets usually appear to price credit risk equally on average. CDS prices and credit spreads are cointegrated I(1) vari- ables for most of our sample of companies and the common factor can be viewed as the implicit efficient price of credit risk. In this section, we examine which of the two markets is more important for price discovery of credit risk.
The appropriate method to investigate the mechanics of price discovery is not clear. The two popular common factor models due to Hasbrouck (1995) and Gonzalo and Granger (1995) both rely on vector error-correction models (VECM) of market prices. Hasbrouck's model of "information shares" assumes that price volatility reflects new information, and thus the market that con- tributes most to the variance of the innovations to the common factor is also presumed to contribute most to price discovery. Gonzalo and Granger's approach decomposes the common factor itself, and, ignoring the correlation between the markets, attributes superior price discovery to the market that adjusts least to price movements in the other market. When price-change innovations are correlated, Hasbrouck's approach can only provide upper and lower bounds on the information shares of each market. However, Baillie et al. (2002) argue that the average of these bounds provides a sensible estimate of the markets' roles in the discovery of the efficient price. Since neither method is considered universally superior, we report both.
To compute the measures of the contributions to price discovery, it is neces- sary first to estimate the following VECM:
APCDS,t = )1 (PCDS,t-1 - 00
- a'lPCS,t_1)
P P
+ jl APCDS,t-j J+ lApcstr j +
,t-j it (4a) j=1 j=1
and
APcs,t = X2 (PCDS,t-1 - '0 a- O1lPCS,t-1)
P P +
2j APCDS,t-j •62j Apcs,t-j + 82t (4b)
j=1 j=1
where sit and 82t are i.i.d. shocks. If the cash bond market is contributing significantly to the discovery of the price of credit risk, then i- will be nega- tive and statistically significant as the CDS market adjusts to incorporate this information. Similarly, if the CDS market is an important venue for price dis- covery, then -2 will be positive and statistically significant. If both coefficients are significant, then both markets contribute to price discovery. The existence of cointegration means that at least one market has to adjust by the Granger representation theorem (Engle and Granger (1987)). That market is inefficient since the price reacts to publicly available information.
Manipulations of the relative magnitudes of the - coefficients reveal which of the two markets leads in terms of price discovery. The contributions of market 1 (the CDS market) to price discovery are defined by the following expressions:
This content downloaded from 193.204.46.27 on Thu, 21 Nov 2013 10:20:35 AMAll use subject to JSTOR Terms and Conditions
Investment-Grade Bonds and Credit Default Swaps 2271
(22 HAS 1 2 HAS2 2 HAS1
-2oI2+2•12 -2l 2- 1X20212 +- ?102' X2 1 -2X120r12 - 2X1 a12 ?Xa
and
GG = (5) X2 - X1
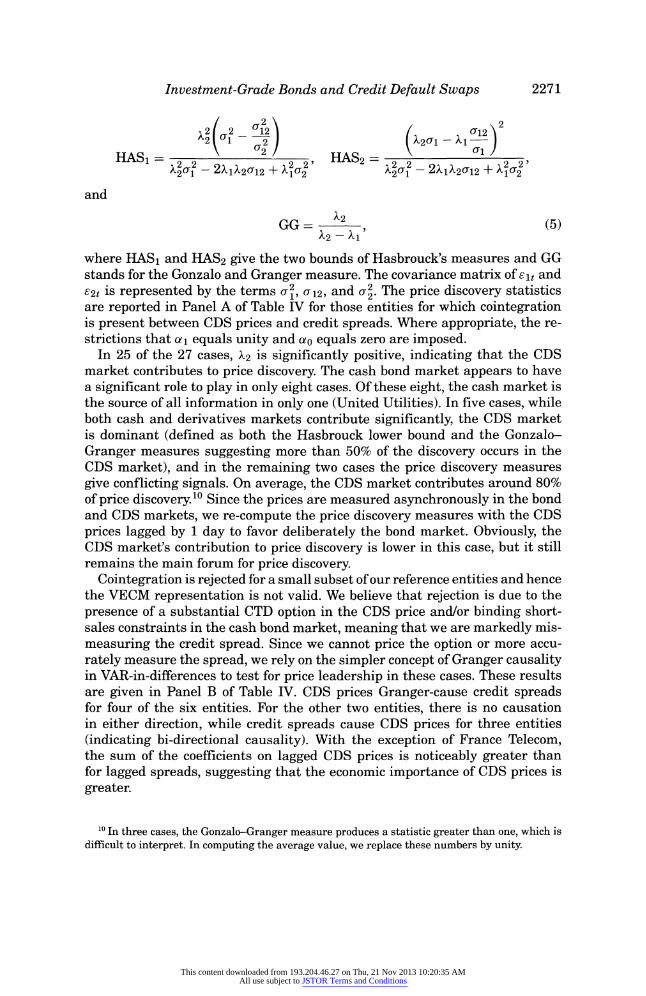
where HAS1 and HAS2 give the two bounds of Hasbrouck's measures and GG stands for the Gonzalo and Granger measure. The covariance matrix of sit and 82t is represented by the terms a1, 12, and a2. The price discovery statistics are reported in Panel A of Table IV for those entities for which cointegration is present between CDS prices and credit spreads. Where appropriate, the re- strictions that a, equals unity and ao equals zero are imposed.
In 25 of the 27 cases, X2 is significantly positive, indicating that the CDS market contributes to price discovery. The cash bond market appears to have a significant role to play in only eight cases. Of these eight, the cash market is the source of all information in only one (United Utilities). In five cases, while both cash and derivatives markets contribute significantly, the CDS market is dominant (defined as both the Hasbrouck lower bound and the Gonzalo- Granger measures suggesting more than 50% of the discovery occurs in the CDS market), and in the remaining two cases the price discovery measures give conflicting signals. On average, the CDS market contributes around 80% of price discovery.10 Since the prices are measured asynchronously in the bond and CDS markets, we re-compute the price discovery measures with the CDS prices lagged by 1 day to favor deliberately the bond market. Obviously, the CDS market's contribution to price discovery is lower in this case, but it still remains the main forum for price discovery.
Cointegration is rejected for a small subset of our reference entities and hence the VECM representation is not valid. We believe that rejection is due to the presence of a substantial CTD option in the CDS price and/or binding short- sales constraints in the cash bond market, meaning that we are markedly mis- measuring the credit spread. Since we cannot price the option or more accu- rately measure the spread, we rely on the simpler concept of Granger causality in VAR-in-differences to test for price leadership in these cases. These results are given in Panel B of Table IV. CDS prices Granger-cause credit spreads for four of the six entities. For the other two entities, there is no causation in either direction, while credit spreads cause CDS prices for three entities (indicating bi-directional causality). With the exception of France Telecom, the sum of the coefficients on lagged CDS prices is noticeably greater than for lagged spreads, suggesting that the economic importance of CDS prices is greater.
10 In three cases, the Gonzalo-Granger measure produces a statistic greater than one, which is difficult to interpret. In computing the average value, we replace these numbers by unity.
This content downloaded from 193.204.46.27 on Thu, 21 Nov 2013 10:20:35 AMAll use subject to JSTOR Terms and Conditions

2272 The Journal of Finance
Table IV
Contributions to Price Discovery Panel A reports various measures of the contribution to the credit price discovery process made by CDS prices for those reference entities for which the results in Table III indicate a long-run relation between CDS prices and credit spreads exists. The measures are based on the two regressions:
p p
ApCDS,t = 1(PCDS,t-1 - a0
-- 1PCS,t-1)
-+ j lAPCDS,t-ij
+ Lij APCS,t-j
+ 81t
j=1 j=1
and p p
APcs,t = 12(PCDS,t -1 -
O0 -
lPCS,t-1) + 2j APCDS,t - j + 622j Apcs,t- +j 2t
j=1 j=1
Where appropriate, according to the results in Table III, the restriction that ao equals zero and/or
a• equals unity are imposed. The Hasbrouck measure provides upper and lower bounds to the price
discovery contribution made in the CDS market. The table also reports the midpoint of this range. The final column reports the Granger-Gonzalo measure. Panel B reports Granger causality test results for those reference entities for which the results in Table III suggest no long-term relation between CDS prices and credit spreads.
Panel A
Hasbrouck
X1 t-Statistic X2 t-Statistic Lower Upper Mid GG
AOL 0.00 0.1 0.12 5.9 1.00 1.00 1.00 1.01 Bank of America 0.00 0.1 0.05 2.8 0.99 1.00 1.00 1.02 Bank One -0.06 -3.2 0.08 2.3 0.32 0.38 0.35 0.59 Bear Stearns -0.03 -1.2 0.14 4.4 0.93 0.93 0.93 0.84 Citigroup -0.02 -1.1 0.10 2.6 0.76 0.86 0.81 0.80 FleetBoston 0.00 -0.3 0.12 3.3 0.87 1.00 0.93 0.97 Ford Motor Credit Corp -0.05 -2.0 0.07 3.1 0.51 0.79 0.65 0.57 GE Capital Corp 0.00 -0.2 0.08 2.8 0.97 0.99 0.98 0.96 General Motors Credit Co -0.05 -1.6 0.15 4.4 0.74 0.91 0.82 0.75 Goldman Sachs -0.04 -1.8 0.13 3.9 0.81 0.83 0.82 0.78 J.P. Morgan Chase 0.00 -0.1 0.06 4.0 0.99 1.00 1.00 0.98 Lehman Brothers -0.05 -2.8 0.21 6.5 0.84 0.86 0.85 0.80 Merrill Lynch 0.00 -0.2 0.09 3.6 1.00 1.00 1.00 0.97 Morgan Stanley -0.02 -1.4 0.09 4.3 0.91 0.91 0.91 0.83 Wal-Mart -0.01 -2.6 0.08 3.2 0.55 0.63 0.59 0.85 Wells Fargo -0.04 -2.0 0.14 3.5 0.74 0.77 0.76 0.78
British Telecom -0.01 -0.6 0.05 2.6 0.79 0.96 0.88 0.84 Commerzbank -0.03 -2.2 0.04 1.3 0.22 0.29 0.26 0.64 DaimlerChrysler -0.03 -1.4 0.07 2.8 0.60 0.86 0.73 0.71 Deutsche Telecom 0.02 0.9 0.04 3.0 0.92 0.94 0.93 2.06 Fiat (January 2001- -0.06 -1.4 0.12 4.0 0.67 0.92 0.79 0.65
November 2001) Iberdrola -0.02 -2.3 0.08 2.9 0.59 0.64 0.62 0.77 Metro -0.01 -0.7 0.09 3.8 0.95 0.97 0.96 0.90 Siemens -0.01 -0.2 0.13 3.4 0.95 1.00 0.97 0.95 Telefonica -0.03 -1.5 0.04 3.0 0.63 0.84 0.73 0.55 United Utilities -0.06 -3.6 0.01 0.7 0.03 0.07 0.05 0.19 Volvo -0.05 -1.9 0.06 3.4 0.61 0.80 0.71 0.55
Mean 0.74 0.82 0.78 0.79 Median 0.79 0.91 0.82 0.80
(continued)
This content downloaded from 193.204.46.27 on Thu, 21 Nov 2013 10:20:35 AMAll use subject to JSTOR Terms and Conditions

Investment-Grade Bonds and Credit Default Swaps 2273
Table IV-Continued
Panel B
Ho: CDS Causes CS Ho: CS Causes CDS
Sum of Significant Sum of Significant Coefficients F-statistic p-Value Coefficients F-statistic p-Value
Barclays 0.41 3.45 0.01 0.07 4.87 0.00 Dresdner 0.84 3.14 0.01 0.06 1.19 0.32 Endesa 0.00 2.07 0.13 0.00 0.52 0.60 France Telecom 0.28 14.17 0.00 0.28 3.08 0.03 Total Fina Elf 0.00 1.49 0.23 0.00 0.62 0.54 Vodafone 0.26 5.16 0.01 0.11 2.69 0.07
C. The Determinants of Changes in Credit Default Swap Prices and Credit Spreads
In the previous section, we rely on VARs to model changes in CDS prices and credit spreads. In this section, we complement this analysis by using variables suggested by finance theory to model the dynamics of the two measures of credit risk. We find different short-run responses of CDS prices and credit spreads to these variables, which gives some insight into why these two measures of the price of credit risk deviate in the short run. We then augment the regressions with the lagged basis and show that this error-correction term is the mechanism through which the two measures price credit risk equally in the long run.
From the contingent-claims approach, credit spreads on corporate bonds oc- cur for two reasons: First, there is the possibility of default; second, should de- fault occur, the bondholder receives only a proportion of contracted payments. Variables related to changes in the probability of a bond defaulting or changes in the likely amount recovered should help explain changes in credit spreads and CDS prices. In this section, we follow Collin-Dufresne et al. (2001), and consider the following variables as factors driving default probability:
1. Changes in the spot interest rate. The static effect of a higher spot interest rate increases the risk-neutral drift of the firm's valuation process, which in turn reduces the risk-neutral (but not necessarily actual) probability of default (Longstaff and Schwartz (1995)). We use changes in the 10-year bond yield on the relevant national Treasury bond.
2. Changes in the slope of the yield curve. While only the spot rate matters in the basic structural models, the process that determines the spot rate may depend upon other factors such as the slope of the term structure. For example, if the short-rate mean reverts around the long rate, an increase in the term structure slope should signal rising future short-term rates and lower default probabilities. We use changes in the spread on 10- and 2-year Treasury bonds from the relevant countries to capture slope effects.
3. Changes in the equity price. Leverage enters the determination of the de- fault barrier in structural models. However, at a weekly frequency and over a
This content downloaded from 193.204.46.27 on Thu, 21 Nov 2013 10:20:35 AMAll use subject to JSTOR Terms and Conditions

2274 The Journal of Finance
relatively short horizon, it is not practical to include a clean measure of firm leverage. Instead, we proxy changes in the firm's health with the firm's equity return.
4. Changes in implied equity volatility. An increase in the volatility of the pro- cess driving firm value increases the probability of hitting the default boundary, and thereby raises the probability of default. Traded options markets exist for all but one of our panel, so we use changes in the implied volatilities from near- the-money put options. We also consider changes in the implied volatilities of the S&P 500 and European Stoxx indices.
We proxy changes in the expected recovery rate with two proxies for changes in the overall business climate. First, we use changes in the slope of the relevant yield curve (defined as above). Second, we also consider changes in the S&P 500 or Stoxx index, as appropriate. Additionally, though we try to minimize the effects of illiquidity in both markets, some liquidity premia may remain. Changes in liquidity will also affect changes in our spreads and CDS prices. Liquidity is proxied by the on-the-run/off-the-run spread of long-dated U.S. Treasury yields. An increase in the liquidity proxy suggests that liquidity is more valuable.
To reduce noise, we measure all changes over a weekly horizon (using Thursday-Thursday changes). We run a series of OLS regressions with results summarized in Table V. Columns (1), (2), (5), and (6) are estimated individually for each reference entity. Average coefficients and goodness-of-fit measures are given and t-statistics are from cross-section regressions of the individual coef- ficient estimates on a constant term. The results in columns (3), (4), (7), and (8) are from pooled panel estimates, where each variable enters independently and interacts with the lagged level of the CDS price (a proxy for firm credit qual- ity). Further discussion of these (and other) regressions is available in Blanco, Brennan, and Marsh (2004).
Several findings emerge. First, the lagged basis or error-correction term is highly significant and correctly signed in each equation for both CDS and credit spreads. The absolute magnitudes of the coefficients are much greater for the credit-spread equations, confirming the price discovery findings of the previ- ous section. For example, the Gonzalo-Granger type average price discovery measure is 0.83 in the pooled regression with interaction terms (columns (4) and (8)), not far from the value 0.79 reported in Table IV. The inclusion of the lagged basis substantially increases the explanatory power of the regressions for credit spreads, but negligibly so for the CDS regressions.
Second, macro-variables (interest rates, term structure, equity market re- turns, and equity market implied volatilities) have a larger immediate impact on credit spreads than on CDS prices, both in terms of absolute magnitude and level of significance. Conversely, firm-specific variables (equity returns and im- plied volatilities) have a greater effect on CDS prices than on spreads.11 For example, the coefficient estimates from columns (4) and (8) suggest that a 10%
11 Significant CTD options due to the existence of convertible bonds would increase the sensitivity of CDS prices to firm-specific factors. The value of the option to convert would increase as the
This content downloaded from 193.204.46.27 on Thu, 21 Nov 2013 10:20:35 AMAll use subject to JSTOR Terms and Conditions

Table V
The Sensitivity of CDS Prices and Credit Spreads to Proxies for Default Risk, the Recovery Rate, and Liquidity
Columns (1), (2), (5), and (6) report results estimated by ordinary least squares individually for each reference entity. Average coefficients and goodness-of-fit measures are given while t-statistics (in parentheses) are from cross-sectional regressions of the individual coefficient estimates on a constant term. Columns (3), (4), (7), and (8) report the results of pooled estimates, where all coefficients except the unreported intercept terms are restricted to be equal across reference entities. Estimates significant at the 5% level are in bold.
CDS Price Credit Spread
(1) (2) (3) (4) (5) (6) (7) (8)
Change in long-term interest rate -6.38 -7.14 -3.38 -3.88 -13.19 -13.24 -8.49 -7.65 (2.42) (2.77) (0.95) (1.09) (5.76) (5.92) (2.71) (2.64)
Change in slope of yield curve 8.11 7.05 7.11 6.81 13.27 13.22 9.90 9.37 (2.75) (2.14) (1.16) (1.16) (4.54) (4.49) (2.23) (2.19)
Equity market returns 2.68 -8.27 -19.80 -27.53 -21.77 -13.08 -41.47 -33.22 (0.34) (0.91) (0.60) (0.84) (1.83) (1.25) (1.79) (1.45)
Firm-specific equity returns -32.55 -30.82 35.15 34.77 -14.04 -14.66 22.89 21.43 (2.60) (2.57) (2.62) (2.62) (1.66) (1.80) (2.33) (2.22)
Change in market volatility 0.14 0.01 0.15 0.02 -0.23 -0.17 -0.37 -0.31 (1.74) (0.14) (0.62) (0.10) (1.48) (1.24) (1.94) (1.61)
Change in firm-specific volatility 0.29 0.28 -0.08 -0.09 0.10 0.10 -0.10 -0.13 (3.74) (3.47) (0.66) (0.76) (1.58) (1.75) (1.25) (1.56)
(continued)
C4
!
co
cn
b•
t,Z Ol
This content downloaded from 193.204.46.27 on Thu, 21 Nov 2013 10:20:35 AMAll use subject to JSTOR Terms and Conditions

Table V--Continued
CDS Price Credit Spread
(1) (2) (3) (4) (5) (6) (7) (8)
Change in liquidity 0.17 0.17 0.02 0.05 (5.49) (1.91) (0.91) (0.76)
CDSt_1 x change in long-term interest rate -0.08 -0.07 -0.12 -0.12 (1.17) (1.11) (2.07) (2.34)
CDSt_1 x change in slope of yield curve 0.10 0.10 0.16 0.17 (0.87) (0.87) (1.79) (1.99)
CDSt_1 x equity market returns 0.37 0.37 0.30 0.33 (0.70) (0.71) (0.82) (0.92)
CDSt_1 x firm-specific equity returns -0.93 -0.92 -0.44 -0.45 (4.59) (4.59) (3.09) (3.23)
CDSt_1 x change in market volatility/100 0.08 0.12 0.28 0.28 (0.20) (0.29) (0.89) (0.90)
CDSt_1 x change in firm-specific volatility/100 0.49 0.48 0.15 0.19 (2.64) (2.60) (1.14) (1.49)
CDSt_1 x change in liquidity 0.00 -0.00 (0.03) (0.69)
Lagged basis -0.07 -0.05 0.19 0.25 (5.54) (2.23) (10.47) (11.77)
Adjusted R2 0.20 0.23 0.26 0.26 0.17 0.25 0.16 0.25
0
0
b•
This content downloaded from 193.204.46.27 on Thu, 21 Nov 2013 10:20:35 AMAll use subject to JSTOR Terms and Conditions

Investment-Grade Bonds and Credit Default Swaps 2277
decrease in the equity price of a firm with a CDS price of 250 basis points (the price quoted for Ford in early 2002) is associated with a 20-basis point jump in CDS prices but just an additional 9 basis points on the credit spread. However, the arbitrage-based equivalence of CDS prices and credit spreads im- plies that both are equally sensitive to firm-specific factors in the long run. This is brought about through the lagged adjustment of the credit spread to the CDS price, captured in the regressions by the large and significant lagged basis term. Collin-Dufresne et al. (2001) note the sensitivity of credit spreads to macro-variables, and question the validity of structural models of default that focus on firm-specific variables. Our findings suggest that CDS prices react more to firm-specific variables and that credit spreads react to lagged changes in CDS prices; thus, our results lend some support to the structural models.
Third, the maximum explanatory power that we are able to generate still leaves three-quarters of the variance in both CDS prices and credit spreads un- explained. This corresponds closely to the proportions found by Collin-Dufresne et al. (2001) in their analysis of monthly changes in credit spreads. They find that the residual terms from their regressions are highly cross-correlated, sug- gesting the existence of an unidentified common systematic factor, and they suggest that credit spreads may be largely driven by market-wide demand and supply shocks. Principal components analysis of portfolios of the residuals of the regressions presented in Table V supports similar conclusions. Irrespective of the formation of the portfolios, the first principal component explains a large and essentially identical proportion of the variation of the residuals in both CDS and credit spread equations, with approximately equal weighting on each portfolio. As with Collin-Dufresne et al. (2001), the regressions appear to be missing a common factor. This factor is common across reference entities and across both cash and credit derivative markets.12
IV. Discussion
Why do we find such strong evidence that CDS prices lead credit spreads?13 Price discovery will occur in the market in which informed traders transact
firm-specific stock price and volatility increased. This increase in the value of convertibility would raise the price of the bond and thereby reduce the value of the delivery option in the CDS price. However, the coefficient on firm volatility should then be negative, as opposed to the positive coefficient that we find. Further, we obtain quantitatively similar results when we only consider U.S. entities for which the CTD option is less valuable.
12 Residuals of the regressions reported in Table G, panel C, are collected. The 32 reference entities are repeatedly arbitrarily grouped into eight portfolios, taking simple averages of the residuals for both CDS and credit-spread regressions. Principal components analysis is performed on both sets of portfolios for the various groupings. The first principal component explains between 46% and 61% of the variation in the portfolio residuals, depending on the grouping of the reference entities. Detailed results are available on request.
13 Longstaff, Mithal, and Neis (2003) also find that CDS prices lead credit spreads using simple differenced VARs. Hull et al. (2003) find that CDS prices lead credit ratings.
This content downloaded from 193.204.46.27 on Thu, 21 Nov 2013 10:20:35 AMAll use subject to JSTOR Terms and Conditions

2278 The Journal of Finance
most. The CDS market, as we noted above, benefits from being the easiest place in which to trade credit risk. Its synthetic nature means that it does not suffer from the short-sales constraints observed in the cash bond market, and buying (or selling) relatively large quantities of credit risk is possible. The standard CDS contract size is $10 million, while Schultz (1998) reports the average cash market trade size is $1.5 million. Additionally, the participants in the cash and credit derivatives markets are likely to be different. There is no counterparty risk (beyond settlement risk) when trading a cash bond. CDS trading, on the other hand, does entail taking on counterparty risk and for this reason is usually restricted to institutions of relatively high credit rating. Perhaps more importantly, the CDS market is the forum for trading credit risk, whereas the cash market trades bond credit risk. Participants hedging loan and counterparty exposures are able to do so in the CDS market. According to some market participants, it is this concentration of liquidity from different pools that means the CDS market leads the bond market.
Given CDS prices and credit spreads are linked by an arbitrage relation, how can the markets persist in pricing credit risk differently? Our answer is in several parts. First, in the absence of data on transactions costs, we cannot be sure that the discrepancies are large enough to be profitable to arbitrageurs. Second, the arbitrage relation is only approximate as noted above and we are using a synthetic 5-year bond spread that is not traded in the market. Third, we do not measure the repo costs of shorting the bond. It is possible that when the credit quality of an entity declines, the repo market price increases such that the arbitrage gap is closed. It could be argued that we have only partially captured the price contribution from the cash market by ignoring the repo cost. However, since repos are not traded for terms in excess of 1 year, let alone the 5 years necessary in our construct, the repo market cannot contribute toward the discovery of the price of 5-year credit risk. Furthermore, even if the holder of a bond sees mispricing in the CDS market, there are two reasons why he cannot arbitrage the discrepancy-fund managers are often not permitted to trade CDS contracts either by national law or mandate, and the notional size of the CDS contract is so large that the cash bond holding is unlikely to be large enough (see Dhillon, 2002).
V. Concluding Comments
This paper is a contribution to the relatively small empirical literature on credit derivatives and, to our knowledge, is the first to examine CDS prices in a time-series framework. It reports two major findings.
First, the theoretical relation equating CDS prices to credit spreads forms a valid equilibrium relation for all of the U.S. and some of the European firms examined. In the three cases in which this relation most clearly fails, CDS prices are substantially greater than credit spreads. Two factors are at work: (a) contract specifications, particularly in Europe, mean that a CDS price also contains a CTD option, and so is an upper bound on the true price of credit risk;
This content downloaded from 193.204.46.27 on Thu, 21 Nov 2013 10:20:35 AMAll use subject to JSTOR Terms and Conditions

Investment-Grade Bonds and Credit Default Swaps 2279
and, (b) the credit spread used in this paper (bond yield minus risk-free rate proxied by the swap rate) understates the true credit spread in the presence of repo costs, and so forms a lower bound on the true price of credit risk.
Second, the CDS market leads the bond market in determining the price of credit risk. For the 27 firms for which the equilibrium relation holds, the CDS market contributes on average around 80% of price discovery. In four of the remaining six cases, CDS prices Granger-cause credit spreads, suggesting price leadership. When examining the determinants of changes in the pricing of credit risk in the two markets, we find that macro-variables (interest rates, term structure, equity market returns, and equity market implied volatilities) have a larger immediate impact on credit spreads than on CDS prices. Conversely, firm-specific equity returns and implied volatilities have a greater immediate effect on CDS prices than on credit spreads. However, the equilibrium equiva- lence of CDS prices and credit spreads implies that both are equally sensitive to these variables in the long run, and we find that this is achieved through the lagged adjustment of the credit spreads to the CDS prices, confirming the price discovery results. We argue that price discovery occurs in the CDS market because of (micro)structural factors that make it the most convenient location for the trading of credit risk, and because there are different participants in the cash and derivative markets who trade for different reasons.
This study leaves several avenues open to further analysis. Most obviously, since the credit derivatives market is still small and developing, these results are not necessarily representative of the period before or after our relatively short span of data. Second, we have only analyzed investment-grade corporate reference entities, although there are several sovereigns with very liquid CDS and bond markets. Similarly, we have not considered speculative-grade cor- porate entities, primarily because their bonds typically trade well below par, particularly in the case of fallen angels, which weakens the arbitrage rela- tion that underpins much of our analysis. Finally, a microstructural analysis of price discovery across credit-risk-sensitive information releases would further illuminate the price discovery process.
REFERENCES
Alexander, Gordon, Amy K. Edwards, and Michael G. Ferri, 1998, Trading volume and liquid- ity in Nasdaq's high-yield bond market, Unpublished manuscript, Securities and Exchange Commission, Washington, DC.
Baillie, Richard T., G. Geoffrey Booth, Yiuman Tse, and Tatyana Zabotina, 2002, Price discovery and common factor models, Journal of Financial Markets 5, 309-321.
Black, Fischer, and John C. Cox, 1976, Valuing corporate securities: Some effects of bond indentures provisions, Journal of Finance 31, 351-367.
Blanco, Roberto, Simon Brennan, and Ian W. Marsh, 2004, An empirical analysis of the dynamic relationship between investment-grade bonds and credit default swaps, Working paper, Bank of England.
Blume, Marshall, Felix Lim, and A. Craig MacKinlay, 1998, The declining credit quality of U.S.
corporate debt, Journal of Finance 53, 1389-1413. British Bankers Association, 2002, BBA Credit Derivatives Report 2001/2002.
This content downloaded from 193.204.46.27 on Thu, 21 Nov 2013 10:20:35 AMAll use subject to JSTOR Terms and Conditions

2280 The Journal of Finance
Collin-Dufresne, Pierre, Robert S. Goldstein, and J. Spencer Martin, 2001, The determinants of credit spread changes, Journal of Finance 56, 2177-2207.
Collin-Dufresne, Pierre, and Bruno Solnik, 2001, On the term structure of default premia in the
swap and LIBOR markets, Journal of Finance 56, 1095-1115. Cossin, Didier, Tomas Hricko, Daniel Aunon-Nerin, and Zhijiang Huang, 2002, Exploring for the
determinants of credit risk in credit default swap transaction data: Is fixed-income markets in- formation sufficient to evaluate credit risk?, Unpublished manuscript, University of Lausanne.
Das, S. R., 1995, Credit risk derivatives, Journal of Derivatives 2, 7-23. Das, S. R., and R. K. Sundaram, 1998, A direct approach to arbitrage-free pricing of credit deriva-
tives, NBER Working paper no. 6635. Dhillon, Haldeep, 2002, From small beginings ..., Credit 3, 24-26. Duffie, Darrell, 1999, Credit swap valuation, Financial Analysts Journal 55, 73-87. Duffie, Darrell, and Ming Huang, 1996, Swap rates and credit quality, Journal of Finance 51,
921-949. Duffie, Darrell, and Ken Singleton, 1999, Modeling term structures of defaultable bonds, Review
of Financial Studies 12, 687-720. Engle, Robert F., and Clive W. J. Granger, 1987, Cointegration and error-correction representation,
estimation and testing, Econometrica 55, 251-276. Geske, Robert, 1977, The valuation of corporate liabilities as compound options, Journal of Finan-
cial and Quantitative Analysis 12, 541-552. Gonzalo, Jesus, and Clive W. J. Granger, 1995, Estimation of common long-memory components in
cointegrated systems, Journal of Business and Economic Statistics 13, 27-35. Hakkio, Craig, and Mark Rush, 1991, Cointegration: How short is the long-run? Journal of Inter-
national Money and Finance 10, 571-581. Hasbrouck, Joel, 1995, One security, many markets: Determining the contributions to price discov-
ery, Journal of Finance 50, 1175-1199. He, Hua, 2002, Modeling term structure of swap spreads, Unpublished manuscript, Yale University. Hong, Gwangheon, and Arthur Warga, 2000, An empirical study of bond market transactions,
Financial Analysts Journal 56, 32-46. Houweling, Patrick, and Ton Vorst, 2002, An empirical comparison of default swap pricing models,
Unpublished manuscript, Erasmus University Rotterdam. Hull, John C., Mirela Predescu, and Alan White, 2003, The relationship between credit default swap
spreads, bond yields, and credit rating announcements, Unpublished manuscript, University of Toronto.
Hull, John C., and Alan White, 2000a, Valuing credit default swaps I: No counterparty default risk, Journal of Derivatives 8, 29-40.
Hull, John C., and Alan White, 2000b, Valuing credit default swaps II: Modeling default correla- tions, Journal of Derivatives 8, 12-22.
Jarrow, Robert A., David Lando, and Stuart Turnbull, 1997, A Markov model for the term structure of credit spreads, Review of Financial Studies 10, 481-523.
Jarrow, Robert A., and Stuart Turnbull, 1995, Pricing derivatives on financial securities subject to credit risk, Journal of Finance 50, 53-86.
Lando, David, 1997, Modelling bonds and derivatives with default risk, in M. Dempster, and S. Pliska, eds.: Mathematics of Derivative Securities (Cambridge University Press, Cambridge).
Lehmann, Bruce N., 2002, Some desiderata for the measurement of price discovery across markets, Journal of Financial Markets 5, 259-276.
Longstaff, Francis A., Sanjay Mithal, and Eric Neis, 2003, The credit-default swap market: Is credit
protection priced correctly? Unpublished manuscript, UCLA. Longstaff, Francis A., and Eduardo Schwartz, 1995, A simple approach to valuing risky fixed and
floating rate debt, Journal of Finance 50, 789-821. McCauley, Robert N., 2002, International market implications of declining treasury debt, Journal
of Money, Credit, and Banking 34, 952-966. Merton, Robert C., 1974, On the pricing of corporate debt: The risk structure of interest rates,
Journal of Finance 29, 449-470.
This content downloaded from 193.204.46.27 on Thu, 21 Nov 2013 10:20:35 AMAll use subject to JSTOR Terms and Conditions

Investment-Grade Bonds and Credit Default Swaps 2281
Morgan, J. P., 2002, CDS Basis Report, August 19, 2002. Pierides, Y. A., 1997, The pricing of credit risk derivatives, Journal of Economic Dynamics and
Control 21, 1579-1611. Schonbucher, Philipp J., 2000, The pricing of credit risk and credit derivatives, Unpublished
manuscript, University of Bonn. Schultz, Paul, 1998, Corporate bond trading costs and practices: A peek behind the curtain, Un-
published manuscript, University of Notre Dame. Sundaresan, Suresh, 1991, Valuation of swaps, in S. Khoury, ed.: Recent Developments in Interna-
tional Banking and Finance (North Holland, Amsterdam).
This content downloaded from 193.204.46.27 on Thu, 21 Nov 2013 10:20:35 AMAll use subject to JSTOR Terms and Conditions