american college of surgeons children’s surgery ...includes general hospital, children’s...
TRANSCRIPT

American College of Surgeons Children’s Surgery Verification and
Quality Improvement Program
Jayant K. Deshpande, MD MPH SVP/Chief Medical Officer, Arkansas Children’s Hospital Harvey and Bernice Jones Endowed Chair in Pediatrics
Jonathan Bates, MD Endowed Chair for Improving Children’s Health Director, Jonathan Bates, MD Center for Improving Children’s
Health Professor of Pediatrics and Anesthesiology, UAMS
SPA Representative,
ACS Children’s Surgery Center Verification Committee
1

Objectives
2
Discuss current status of the verification program

No conflicts of interest
3

Anesthesiology representatives to ACS task force and committee Jayant K. Deshpande, MD, MPH, FAAP Constance S. Houck, MD, FAAP Randall P. Flick, MD, MPH, FAAP Lynn Martin, MD, FAAP

Quality improvement focus and Collaboration Four other ACS quality improvement programs
Bariatric Surgery Breast Disease Cancer Surgery Trauma
Optimal Resources in Children’s Surgery Task Force from the beginning, has included American Academy of Pediatrics (AAP), Section on Anesthesiology
and Pain Medicine Society for Pediatric Anesthesia (SPA) Committee on Pediatric Anesthesia (COPA) of the American
Society of Anesthesiologists (ASA) Endorsed by Children’s Hospital Association (CHA) and AAP.
5

The purpose The ACS Children’s Surgery Verification Committee was established with the goal of improving the care of children with surgical needs. This process includes defining optimal resource standards and matching them prospectively to an individual child’s needs. Achievement of this goal requires an appropriately designed system of care and includes verification that these standards are met in individual children’s surgical centers. We intend to continuously review and improve this document as new information and more data are developed that can be applied to its content. Our intent is to use evidence-based scientific methods to support recommendations. We have used existing data, where possible, combined with expert opinion to establish consensus and formulate these current standards. Multiple research efforts are under way to strengthen the evidence base as well. 6
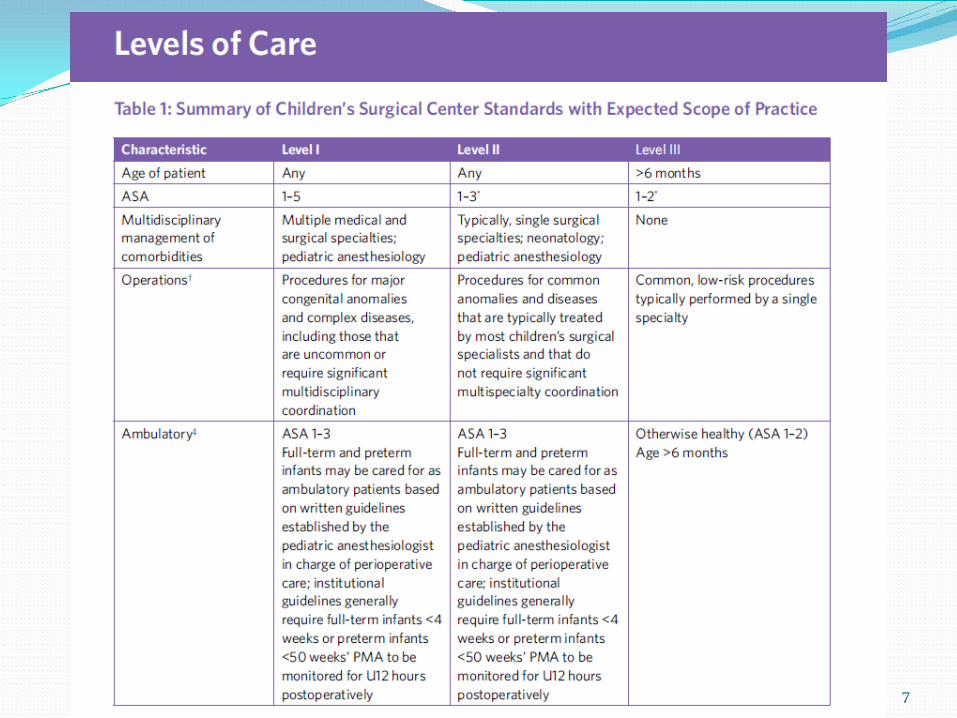
7

A pediatric anesthesiologist individual certified or eligible for certification in
pediatric anesthesiology by the American Board of Anesthesiology (ABA) or equivalent body,
Or, similarly qualified by demonstrable experience, training via Pediatric Anesthesia Alternative Pathway (see below)
An anesthesiologist with pediatric expertise (see below) Alternative Pathway for Pediatric Anesthesiologists (see
below)
8

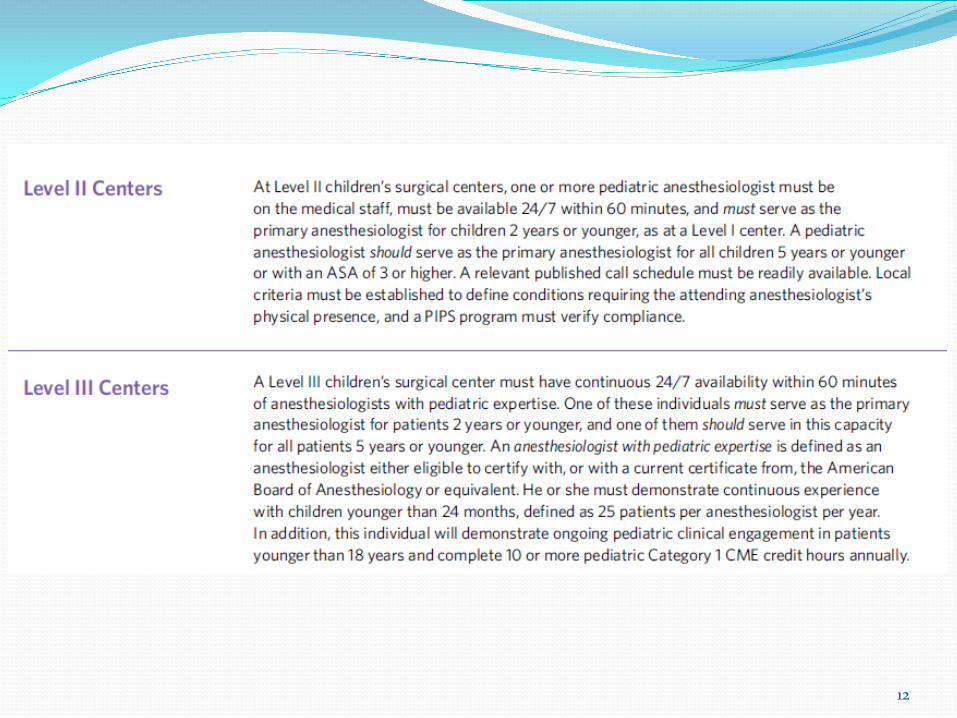
A pediatric anesthesiologist An anesthesiologist with pediatric expertise
either eligible to certify or with a current certificate from the ABA or equivalent
must demonstrate continuous experience with children < 24 months of age (25 patients per anesthesiologist per year)
will demonstrate ongoing pediatric clinical engagement with patients ≤ 18 years of age
Will complete 10 or more relevant Category 1 CME credit hours annually.
Alternative Pathway for Pediatric Anesthesiologists (see below)
9

A pediatric anesthesiologist An anesthesiologist with pediatric expertise Alternative Pathway for Pediatric Anesthesiologists
Successfully completed residency in anesthesiology, certified by a letter from program director detailing pediatric component
> 30% practice devoted to pediatric cases; including neonates and children < 2 years, and procedures considered high risk
Current provider or instructor, Pediatric Advanced Life Support (PALS) 48 hours of children's anesthesia-related CME in last 3 years Documentation of membership or attendance at children's anesthesia meetings List of patients < 2 years of age and related procedures during the reporting year Licensed to practice medicine; documentation of privileges to care for children <
2 years by hospital’s credentials committee Anesthesiologist’s care will be evaluated by on-site reviewer, with oversight by
other anesthesiologists who are members of CSV Committee
10

11
12

13

14

The ACS Children’s Surgery Verification Program
1. Pre-review questionnaire (PRQ) 2. On-site review (2 days) by multidisciplinary peer review
team composed of individuals experienced in the field of children’s surgical and anesthetic care. Assesses commitment, readiness, resources, policies, patient care, performance improvement, and other relevant features
3. Process results in report outlining findings and, if successful,
4. Certificate valid for 3 years

Why do all of this?
16

17

2009 US (KID) Data
87,110/189,977 children’s general and thoracic inpatient procedures done in general hospitals…45.9%
Ziegler et al, Pediatrics 2013; 132(6):1466-1472
18

Where are surgical neonates definitively treated in U.S.? (KIDS 2009 Data) Free Standing
Children’s Hospital Children’s Unit
within a Hospital General Hospital
n (%) 20.57% 34.33% 45.10%
20.57%
34.33%
45.1%
Free Standing Children's Hospital Children's Unit within a Hospital
General Hospital
Preliminary data/unpublished
19

Table 2. Complex neonatal procedures by hospital type for 2009
Procedures
All Hospital Types*
Children’s Hospital & Children’s unit†
General Hospital†
Fold Change
Weighted Frequency
Weighted Frequency
Per 10,000‡ (95% CI)
Weighted Frequency
Per 10,000‡ (95% CI)
Operation for malrotation 1,176 760 9 (7.3-10.8) 278 1.3 (1.1-1.6) 6.8
Repair esophageal atresia 1,077 816 9.7 (7.6-11.8) 156 0.7 (0.5-1.0) 13.1
Lung biopsy 899 612 7.3 (5.6-8.9) 141 0.7 (0.4-0.9) 10.8
Pull through for Hirschsprung 675 503 6 (4.7-7.3) 77 0.4 (0.2-0.5) 16.4
Repair diaphragmatic hernia 475 340 4 (3.1-4.9) 66 0.3 (0.2-0.4) 12.8 *Includes general hospital, children’s hospital, children’s unit in a general hospital, and children’s specialty hospital.
†Rao Scott χ2 test for difference in surgical volume rates between hospital types were all p<.0001 following Bonferroni adjustment for multiple test.
‡Procedural volume per 10,000 surgical admissions excluding circumcision.
Sømme S, Morrato E, Ziegler M; Frequency and Variety of Inpatient Surgical Procedures in the US; Pediatrics. Pediatrics 2013 Dec; 132(6):e1466-72.
20

McAteer JP. Lariviere CA. Oldham KT. Goldin AB. Shifts towards pediatric specialists in the treatment of appendicitis and pyloric stenosis: Trends and outcomes. Journal of Pediatric Surgery 2014 Jan. 49(1):123-8.
21

Study Conclusion 2015- Substantial volumes of children’s surgery, including
relatively simple procedures, but also neonates and other high risk patients with complex procedures, are performed in nonspecialized environments.
22

Chang RK, Klitzner TS. Can Regionalization Decrease the Number of Deaths for Children Who Undergo Cardiac Surgery? A Theoretical Analysis. Pediatrics. 2002; 109 (2):173-181
23

0
1
2
Obs
erve
d to
exp
ecte
d m
orta
lity
rat
io
Annual number of pediatric discharges
O/E Mortality for Surgical Neonates with Intrinsic Risk of Mortality >5%
KID 2009
General hospitals Children’s units in general
hospitals
Children’s general
hospitals
Low High
O/E ratio for hospital category
Preliminary data/unpublished 24

Study Conclusion Specialized environment is associated with better
outcomes for some procedures. This is most readily demonstrable for complex procedures in high risk patients.
25

26

Keenan RL, Boyan CP. Cardiac Arrest due to Anesthesia: A Study of Incidence and Causes. JAMA 1985; 253 (16): 2373-2377
27

Pediatric Anesthesia 2015 Neonates…risk of cardiac arrest ~ 10x adults
Infants …. risk of cardiac arrest ~ 5x adults
Risk of death 25-30% if perioperative cardiac arrest
Morray JP, Anesthesiology 2000:93:6-14
28
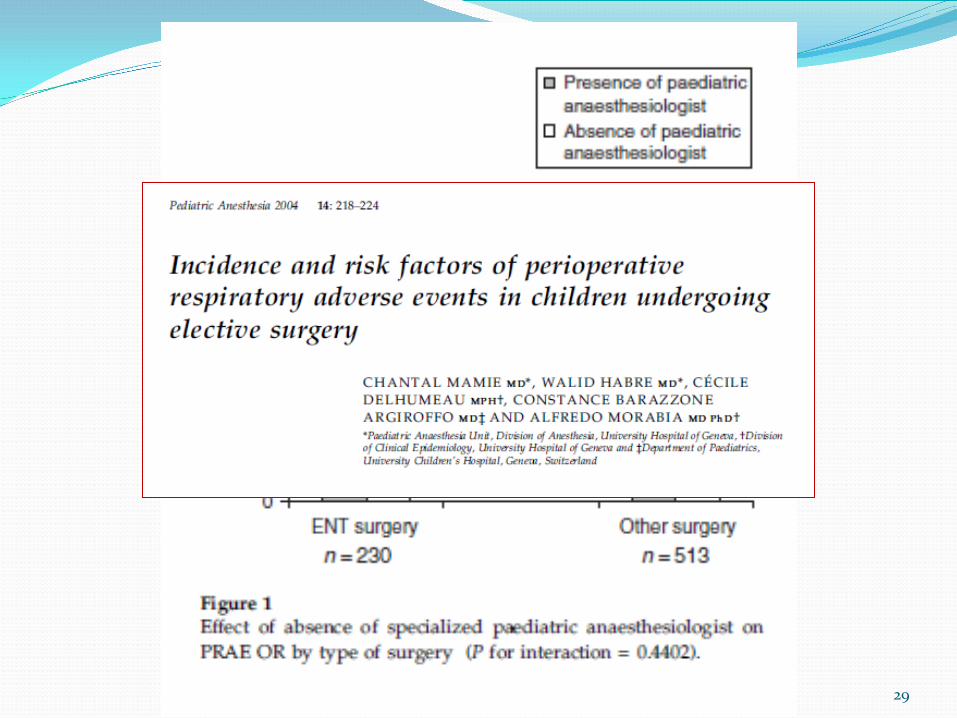
29

Anaesthesia services for children require specially trained clinical staff together with equipment, facilities and environment.
The service should be led at all times by
consultants who regularly anaesthetise children.
Surgeons and anesthesiologists should not undertake occasional paediatric practice
The 1989 Report of the National Confidential Enquiry into Perioperative Deaths (NHS)
30

Relationship between Complications of Pediatric Anesthesia and Volume of Pediatric Anesthetics
Annual number of anesthetics Number of complications per 1000 anesthetics
1-100 100-200
>200
Auroy Y, Ecoffey C, Messiah A, et al. Anesth Analg, 84: 228-36, 1997
A significant inverse correlation was shown between volume and complication rate in pediatric anesthesia.
31

Relationship between Complications of Pediatric Anesthesia and Volume of Pediatric Anesthetics
“…we recommend that a minimum case load of 200 pediatric anesthetics per year is necessary to reduce the incidence of complications and improve the level of safety in pediatric practice.”
32 Auroy Y, Ecoffey C, Messiah A, et al. Anesth Analg, 84: 228-36, 1997

JAMA 2010;304[9]:992-1000
Survival for Very Low Birth Weight Infants
33 Laswell et al. JAMA. 2010;304(9):992-1000

34

Should paediatric intensive care be centralised? Trent Versus Victoria
Interpretation If Trent is representative of the whole country,
there are 453 (200-720) excess deaths a year in the UK that are probably due to suboptimal results from paediatric intensive care.
The Lancet, Vol 349: 1213-17, April 1997
35

Consensus report for regionalization of services for critically ill or injured children. Council of the Society of Critical Care Medicine. Crit Care Med 2000, 28:236-239. American Academy of Pediatrics, Committee on Pediatric Emergency Medicine, American College of Critical Care Medicine, Society of Critical Care Medicine. Consensus report for regionalization of services for critically ill or injured children. Pediatrics 2000, 105:152-155
36

Specialized environment is likely important for (relatively) simple
pediatric surgical problems.
37

Intussusception Washington State, 1999-2009, n=327 operations Pediatric Hospitals; more severe disease Non-Pediatric vs Pediatric Hospitals
Bowel resection more common, 59% vs 33%; Postop complications more common (OR 2.83,p<0.001)
Bowel resection age 0-4 Pediatric vs Non-Pediatric (OR 0.20, p<0.001)
(McAteer JP,J Am Coll Surgeons. 2013 Aug 217(2))
38

Differential Outcomes Rural vs Urban Hospitals
Pyloromyotomy …fewer surgical & fewer anesthesia related complications(Urban H)
Appendectomy …fewer postop complications & fewer anesthesia related complications, especially age<5(Urban H)
Conclusion: There has been a shift towards pediatric hospitals
for certain procedures, with a widening disparity in outcomes for younger children. These results suggest that procedures in younger patients may best be performed by providers familiar with these patient populations.
McAteer et al. J Peds Surgery. 2014. 49:123–128
39

Influence of hospital and patient location on early postoperative outcomes after appendectomy and pyloromyotomy
McAteer et al. J Peds Surgery.2015. 50:1549–1555

Background
Hospital / surgeon characteristics health outcomes Center / practitioner volume health outcomes
Similar associations in children Pediatric procedures various hospital types Rural pediatric patients adverse outcomes

Purpose
How has regionalized care affected patient outcomes? Determine association between anesthesia and pulmonary
complications and: Children’s versus non-children’s Urban versus rural hospital Urban versus rural patient

43

Results Appendicitis OR 95% CI p-value
Children’s vs. non-children’s hospital 0.63 0.51-0.78 <0.001*
Urban vs. rural hospital type 0.52 0.38-0.71 <0.001*
Hospital Type & Location
Urban non-children’s vs. rural 0.67 0.54-0.83 <0.001*
Urban children’s vs. rural 0.38 0.26-0.55 <0.001*
Urban vs. rural patient 0.74 0.61-0.89 0.002*
Covariables: gender, race, insurance, comorbidities

Results Pyloric Stenosis OR 95% CI p-value
Children’s vs. non-children’s hospital 0.18 0.07-0.46 <0.001*
Urban vs. rural hospital type 0.55 0.27-1.15 0.1
Hospital Type & Location
Urban non-children’s vs. rural 0.20 0.08-0.54 0.001*
Urban children’s vs. rural 0.12 0.04-0.39 <0.001*
Urban vs. rural patient 0.78 0.35-1.77 0.6
Covariables: gender, race, insurance, comorbidities

Study Conclusions
Lower risk of anesthesia complication associated with: Urban hospitals Urban non-children’s & children’s hospital Urban patients
Appendicitis, Pyloric Stenosis Lower risk at children’s hospitals
Additional diagnoses no significant differences

Thank you very much. 47