ambient air quality management - kitakyushu initiative … · form ambient air quality management....
TRANSCRIPT
AMBIENT AIR QUALITY MANAGEMENT IN SURABAYA1
Prepared for the Seminar on:
KITAKYUSU INITIATIVE SEMINAR on URBAN AIR QUALITY MANAGEMENT
20 – 21 February 2003, Bangkok, Thailand
SURABAYA - INDONESIA 2003
1 Ms. Chamidha Sigit Purwanto, Head of Air Laboratory, Environmental Department, Surabaya City
ABSTRACT
One of the important environmental problems as the consequence of the
development growth is the air pollution. Air is required as a resource for life, so that the
quality of air have to be managed wisely to be always better.
With the growing activities, the emission of pollution into air. However,
experiencing the economic crisis, Indonesia now could face the environmental problem
because of the lack of attention in controlling the pollution sources including from in
industrial sectors. This matter also affects to the environment quality.
Ambient air quality in Surabaya day by day is decrease which is caused by air
pollution from mobile source and non mobile source, so that should be hold air quality
management in Surabaya. Air quality management in Surabaya with several activity
improving its urban air quality by integrated ambient air quality monitoring system,
improving transportation system, guidance for industrial polluter potency in order to used
air pollution protection, air pollution controlling and environmental awareness.
The problem of air pollution in Surabaya is caused by the imbalance ratio between
the increasing capacity of the joint roads as compared to the addition of the amount of
vehicles every year, not every vehicle pass test gas emission , there was no enough
urban forest/green belt area as compared to the city area and its population, there was no
community development program in the ambient air quality management including reward
and punishment program.
Surabaya is being prepare the role about ambient air quality in Surabaya : Every
public transport must past test emission and is being prepared regulation about
Inspection and Maintenance for private transportation. Surabaya undertook a test
emission from vehicle in some road side and 70 % emission from transportation.
We have already done all activities to improve air quality in Surabaya but from
data ambient air quality monitoring in 2001 compared with 2002 degradation of ambient
air quality, because in the night more pollution from another city (closed Surabaya : Gresik,
Sidoarjo) influence ambient air quality (PM10 , SO2 ) high.
We need more information from another country and technical know how and
application/implementation of the monitoring data for reducing the ambient air pollution
concentration in Surabaya.
AMBIENT AIR QUALITY MANAGEMENT IN SURABAYA
I. BACKGROUND
Surabaya is the second largest city in Indonesia. The area is about 326
square kilometer in a coastal and lowland area. The altitude varies from 3 to 10 m
above the sea level. Surabaya is a tropical city. The temperature is almost
constant throughout the year, from 25 °C during the night to 34°C during the day.
The average humidity varies from 65% to 85 %. Rainy season starts from October
to April, and dry season from May to September.
Surabaya has about 2,8 million inhabitants during the night, and in addition
about 300 thousands people commute every day to Surabaya from surrounding
areas. Transportation is mainly dominated by private vehicles. According to a
study few years ago, the composition of transportation scheme in Surabaya was
35% public transport and 65% private transport. Nowadays, the percentage of
private cars is even higher due to the increase on vehicles. Average velocity in the
center of the city is about 15-20 km/h due to the high volume of the traffic.
The city of Surabaya is trying to improve the transport service within the city,
so air pollution due to vehicle emissions can be reduced. To improve the transport
condition, the city is promoting the air quality and transportation improvements by
involving its citizens.
One of the important environmental problems as the consequence of the
development growth is the air pollution. Air is required as a resource for life, so
that the quality of air have to be managed wisely to be always better.
With the growing activities, the emission of pollution into air hence is more
severe. However, experiencing the economic crisis, Indonesia now could face the
environmental problem because of the lack of attention in controlling the pollution
sources including from in industrial sectors. This matter also affects to the
environment quality.
During the normal condition, every pollution that is emitted into the air will be
neutralized by nature itself (Self Purification). But on the other side, the
environment has different carrying capacity, so that if the pollution exceeds the
carrying capacity of the environment, it will result in the contamination of air.
There are many factors that influence the level of air contamination, such as
the condition of topographic area, the condition of meteorology, the source of
emission, the amount of population, the used energy and others.
The source of air pollution in Surabaya comes from various sources, namely:
1) Air pollution from non mobile source :
a) Pollutant from refining industry (fuel consumption) : food, beverage,
wood refining, chemical, mineral non metal industry, textile, metal
refining.
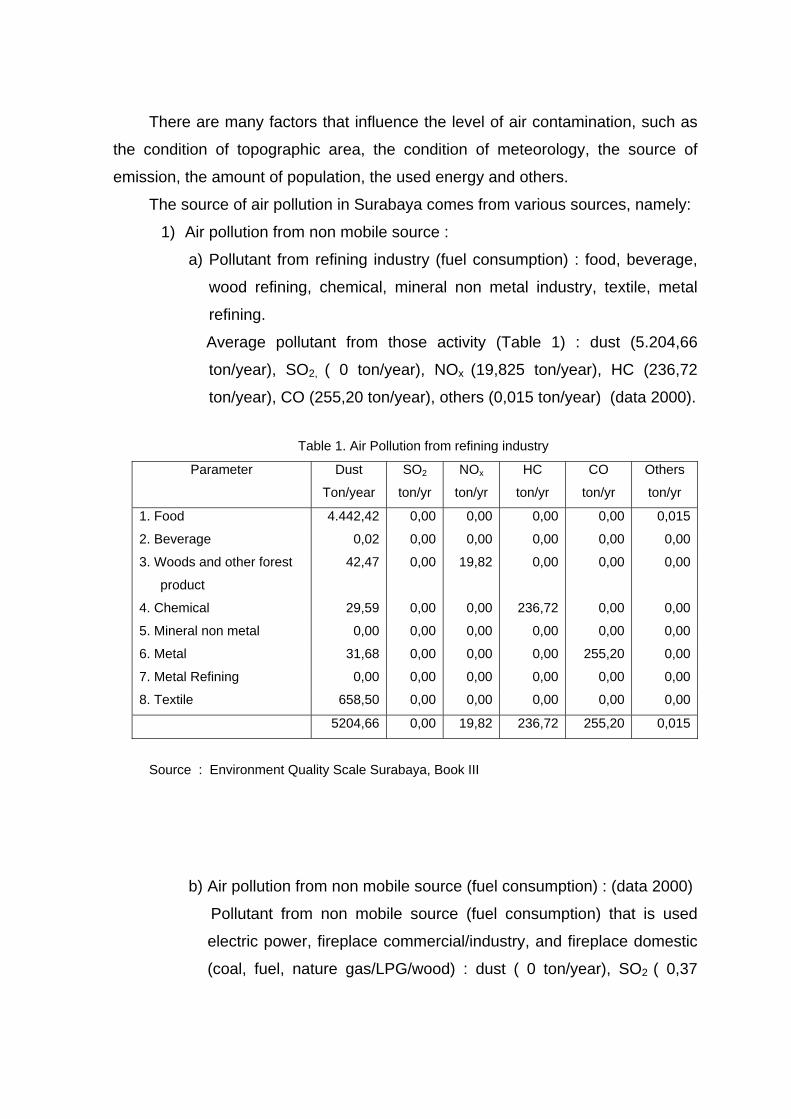
Average pollutant from those activity (Table 1) : dust (5.204,66
ton/year), SO2, ( 0 ton/year), NOx (19,825 ton/year), HC (236,72
ton/year), CO (255,20 ton/year), others (0,015 ton/year) (data 2000).
Table 1. Air Pollution from refining industry
Parameter Dust
Ton/year
SO2
ton/yr
NOx
ton/yr
HC
ton/yr
CO
ton/yr
Others
ton/yr
1. Food 4.442,42 0,00 0,00 0,00 0,00 0,015
2. Beverage 0,02 0,00 0,00 0,00 0,00 0,00
3. Woods and other forest
product
42,47 0,00 19,82 0,00 0,00 0,00
4. Chemical 29,59 0,00 0,00 236,72 0,00 0,00
5. Mineral non metal 0,00 0,00 0,00 0,00 0,00 0,00
6. Metal 31,68 0,00 0,00 0,00 255,20 0,00
7. Metal Refining 0,00 0,00 0,00 0,00 0,00 0,00
8. Textile 658,50 0,00 0,00 0,00 0,00 0,00
5204,66 0,00 19,82 236,72 255,20 0,015
Source : Environment Quality Scale Surabaya, Book III
b) Air pollution from non mobile source (fuel consumption) : (data 2000)
Pollutant from non mobile source (fuel consumption) that is used
electric power, fireplace commercial/industry, and fireplace domestic
(coal, fuel, nature gas/LPG/wood) : dust ( 0 ton/year), SO2 ( 0,37
ton/year), NO2 ( 4,9 ton/year), HC (0,17 ton/year), CO ( 0,79 ton/year),
others ( 121,1 ton/year).
2) Air pollution from mobile source (fuel consumption) : (data 2000)
Dust (3,35 ton/year), SO2 (0,26 ton/year), NOx (46,2 ton/year),
HC ( 28,45 ton/year), CO (9,5 ton/year), others ( 0,8 ton/year).
Starting from the last year, the growth of Surabaya is very fast either
from physical and also non physical aspects, because of the multi
dimensional functions of the city. The growth of industrial sectors is enough
to bring the implication and impacts to all environment sectors in Surabaya.
Besides the positive impact of the city growth that drives the increase in
the mobility of residents and goods, it causes a progressive traffic jam,
where the traffic density is relatively high enough (current ratio of flow :
capacities is 0,8 - 1,6). The total length of road in the city of Surabaya is
approximately 2,035.95 km (in 2000), and the amount of passenger
vehicles, wagon car, motorbike have reached approx. 909.131 (2000) that
tends to increase every year. As the implication, it results in the increase of
the air contamination from both mobile sources as well as from non-mobile
sources (industry).
According to the previous study, the dominant air pollution source in
metropolis - including the city of Surabaya - is from the activity of
transportation (mobile source) that contributes to 65 – 75 %.
To identify and control the quality of ambient air, it hence needs a
regular measurement and the application of the ambient air quality standard.
The ambient air quality standard is specified as the maximum concentration
of ambient air quality that could prevent the occurrence of air pollution, and
it will be revised every 5 years. The ambient air quality standard of
Surabaya is set exclusively for the ambient air in Surabaya City, while the
ambient air quality standard for the East Java Province is set by the
Governor with the consideration of the national ambient air quality standard.
The ambient air quality is set based on the research on the data base of
the potency source to air pollution, the condition of meteorology and
geographical position. If during the set up the ambient air quality of
Surabaya is greater than the National ambient air quality standard, hence
the Governor will state that the ambient air quality of the city is polluted.
II. PROBLEM
From the description above, the problem of air pollution faced by the city of
Surabaya is :
1. The imbalance ratio between the increasing capacity of the joint roads
as compared to the addition of the amount of vehicles every year.
2. The gas emission measurement of every vehicle to 100 vehicles which
use gasoline and diesel fuel in the year of 2002, showed that the amount
of vehicle with the emission rate above the emission quality standard is
as follows :
a. Personal vehicle with gasoline fuel : 19 % ( CO), 11 % ( HC.
b. Public Vehicle with gasoline fuel : 16,5 % ( CO), 214 % ( HC).
c. Personal Vehicle with diesel fuel : 49,5 % smoke.
d. Public Vehicle with diesel fuel : 44 % smoke
3. There was no enough urban forest/green belt area as compared to the
city area and its population.
4. There was no community development program in the ambient air quality
management including reward and punishment program.
III. IMPROVEMENT CAPACITY BUILDING OF SURABAYA GOVERNMENT IN URBAN AIR QUALITY MANAGEMENT
Activity of Urban, like sector housing of resident, transportation, commerce,
industrial, solid waste management and related other activity have potency to

alter air quality at urban areas. Transmitted air pollution from existing sources
distributed to atmosphere, passing spreading process according to wind direction.
To overcome air pollution in urban area, hence needed by real step which in the
form ambient air quality management.
The air quality management of the Surabaya Government is conducted by
the cooperation between several departments, institutions, community and NGO.
The Blue Sky Program was created as the response to the increasing of
population, transportation and industrial growth in urban area, also to the
deterioration of air quality and the community health, especially in Surabaya.
A. The Execution of Blue Sky Program a. Blue Sky Program (PLB) is the air pollution control program from
the non-mobile and mobile sources.
b. The goals of Blue Sky Program are :
− The creation of mechanism to control the air pollution effectively.
− The control of air pollution under ambient standard.
− The creation of ambient air quality needed for the health of
human being and others.
− The creation environmental awareness of the resident.
c. Targets of the Blue Sky Program target (PLB) in Surabaya:
− The decreasing of air pollution from non-mobile and mobile
sources.
− The establishment of the operation system of ISPU/PSI
monitoring (Air Pollution Standard Index) in Surabaya and
integrated in AQMS ( Air Quality Monitoring System).
− The development of coordination and partnerships in creating the
ambient air quality in Surabaya.
− The increasing of environmental awareness among the
community and their role in the air pollution control in Surabaya
d. Regulation Base: State Constitution, Governmental Regulation,
Environment Ministry Regulation, Government Decree.
e. Implementation activities of Blue Sky Program in Surabaya:
1. Year 1996 – 2000.
− Ambient air quality monitoring along the high density road,
with the dominant result of measurement: dust.
− Existence of Taxi with gas fuel (BBG) since 1997, and own its
fill station.
− Conducting guidance and monitoring program to potential
industries.
− Founding the KPPLH Team (the Commission for Operation
and Controlling the Environment Pollution) in 1999 to monitor
the industry with potency for air pollution.
2. Year 2001
− Measurement of Hb and Pb concentration in blood,, specially
society which close to the source of pollution (enclosed).
− Measurement of ambient air quality and noise from
transportation and industry sector.
− Measurement of emission air quality from industrial sectors.
− Monitoring of ambient air quality using automatic instrument
and integrated continuously with the Monitoring Center in the
Minister Office of Environment - Jakarta executed every day.
− Car Free Day (CFD) in several streets in the heart of the city
to promote optimization of public transport and environmental
awareness of the people. For a long day from 06.00 am to
06.00 pm all vehicles were abandoned to enter the car free
day zone. During the day, a lot of activities were carried out to
support the car free day. Citizens got together for the activities
such as aerobic exercise, fun bike, fun rickshaw (becak) race,
skateboard race, photo and poster exhibition/display, food
bazaar, live music show, drawing contest for children. All
events dedicated to environmental awareness improvement.
Each activity promoted messages of environmental awareness
to the audience and to the participants. The car free day was
successfully implemented. As part of the system to improve
the environmental quality, car free day is not a stand-alone
activity, it needs follow-up action plans in order to achieve its
objectives. Action programs in urban transportation and
environmental protection are being carried out by the city.
Surabaya is going to do all necessary actions to achieve good
environmental quality.
3. Year 2002
− Measurement test gas emission from motor vehicles.
− The effective regulation for the feasibility of public vehicle test;
(Regulation for the Emission Test of Public and Private
Transports).
− Execution Blue Sky Program Campaign with activity
distribution of masker to motorcyclist, public transport (bus),
plantation work along with Tunas Hijau NGO that involving
elementary school.
− Car Free Day at several street in the heart of the city.
− Data application of Ambient air Quality in Surabaya by
research students with the following results:
a. Study influence of SO2 and NOX to the rainwater in
Surabaya, showed that the southern part of the city is the
most risk area from the acid rain.
b. Stipulating of Priority for Program Activity of the Ambient Air
Quality in Surabaya using the Analytical Hierarchy Process
(AHP) approach.
c. Information System for Monitoring Air Pollution in Surabaya.
d. Study on the COHb concentration of the Traffic Police
blood in the Metropolis of Surabaya 2002.
e. Evaluating the Data Record-Keeping and Reporting System
for Air Pollution Standard Index in Surabaya.
f. Literature Study on the Air Quality Monitoring System.
4. Year 2003
− Mathematical Model of Air Quality Distribution Pattern in
Surabaya.

− Compilation of Inspection Role and Treatment of Personal Car
Passenger.
− Campaign for using CNG fuel for motor vehicles (100
Government Vehicles) executed by the Government of
Surabaya since year 2002/2003.
− Car Free Day at several street in the heart of the city.
To achieve the target in the Blue Sky Program above, it is then needed to
monitor ambient air quality to identify the condition of ambient air quality
continuously. The result will be used to decide the control regulation by the
municipal government in order to create the condition that is suitable for the quality
to public health. The implementation of this program was aided by the soft loan of
the installation of equipment of network monitoring ambient air quality from the
Government Austria through BAPEDAL together with another 10 big cities in
Indonesia.
The monitoring equipments are installed in 5 different places in Surabaya,
and 1 RAQMC Room (Regional Air Quality Monitoring Center) including 1 Room
for Operation Maintenance. The ambient air quality parameters which are
measured in Surabaya are 5 key parameter, that is: PM10 , SO2, O3, NO2, CO and
also the condition of meteorology (temperature, dampness , global radiation, wind
direction and wind speed). The information of air quality index (ISPU/PSI) is
publicized everyday by the public data display at 3.00 pm, internet
(http://www.surabaya.go.id), radio and also newspapers. The scoring system and
the interpretation of the ISPU/PSI could be seen in Table 2, and the actions
required is in Table 3
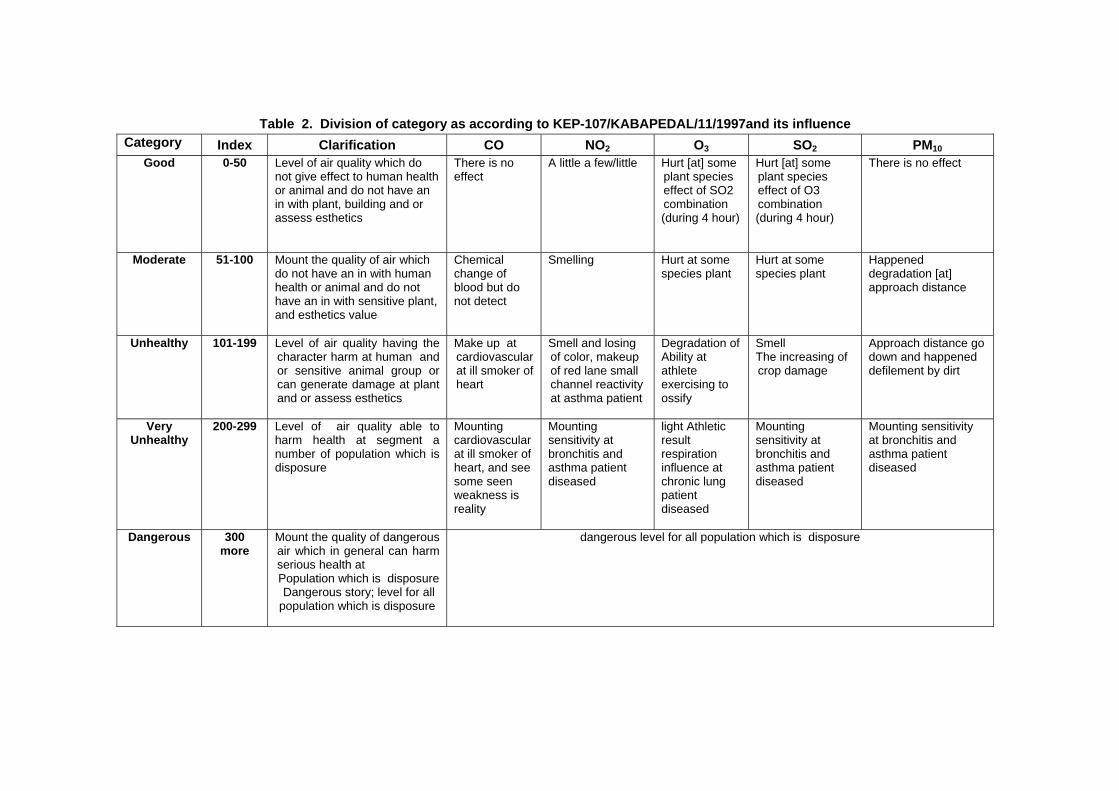
Table 2. Division of category as according to KEP-107/KABAPEDAL/11/1997and its influence Category Index Clarification CO NO2 O3 SO2 PM10
Good 0-50 Level of air quality which do not give effect to human health or animal and do not have an in with plant, building and or assess esthetics
There is no effect
A little a few/little Hurt [at] some plant species effect of SO2 combination (during 4 hour)
Hurt [at] some plant species effect of O3 combination (during 4 hour)
There is no effect
Moderate 51-100 Mount the quality of air which do not have an in with human health or animal and do not have an in with sensitive plant, and esthetics value
Chemical change of blood but do not detect
Smelling
Hurt at some species plant
Hurt at some species plant
Happened degradation [at] approach distance
Unhealthy 101-199 Level of air quality having the character harm at human and or sensitive animal group or can generate damage at plant and or assess esthetics
Make up at cardiovascular at ill smoker of heart
Smell and losing of color, makeup of red lane small channel reactivity at asthma patient
Degradation of Ability at athlete exercising to ossify
Smell The increasing of crop damage
Approach distance go down and happened defilement by dirt
Very Unhealthy
200-299 Level of air quality able to harm health at segment a number of population which is disposure
Mounting cardiovascular at ill smoker of heart, and see some seen weakness is reality
Mounting sensitivity at bronchitis and asthma patient diseased
light Athletic result respiration influence at chronic lung patient diseased
Mounting sensitivity at bronchitis and asthma patient diseased
Mounting sensitivity at bronchitis and asthma patient diseased
Dangerous 300 more
Mount the quality of dangerous air which in general can harm serious health at Population which is disposure Dangerous story; level for all population which is disposure
dangerous level for all population which is disposure
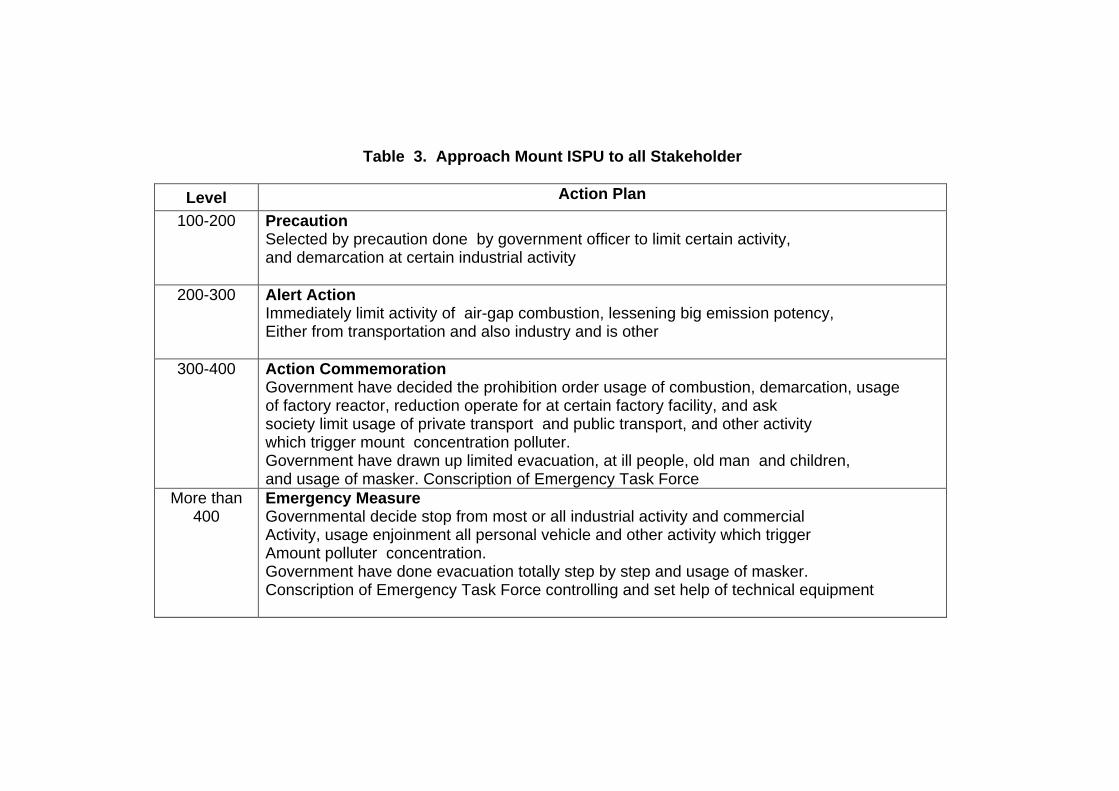
Table 3. Approach Mount ISPU to all Stakeholder
Level Action Plan 100-200 Precaution
Selected by precaution done by government officer to limit certain activity, and demarcation at certain industrial activity
200-300 Alert Action Immediately limit activity of air-gap combustion, lessening big emission potency, Either from transportation and also industry and is other
300-400 Action Commemoration Government have decided the prohibition order usage of combustion, demarcation, usage of factory reactor, reduction operate for at certain factory facility, and ask society limit usage of private transport and public transport, and other activity which trigger mount concentration polluter. Government have drawn up limited evacuation, at ill people, old man and children, and usage of masker. Conscription of Emergency Task Force
More than 400
Emergency Measure Governmental decide stop from most or all industrial activity and commercial Activity, usage enjoinment all personal vehicle and other activity which trigger Amount polluter concentration. Government have done evacuation totally step by step and usage of masker. Conscription of Emergency Task Force controlling and set help of technical equipment
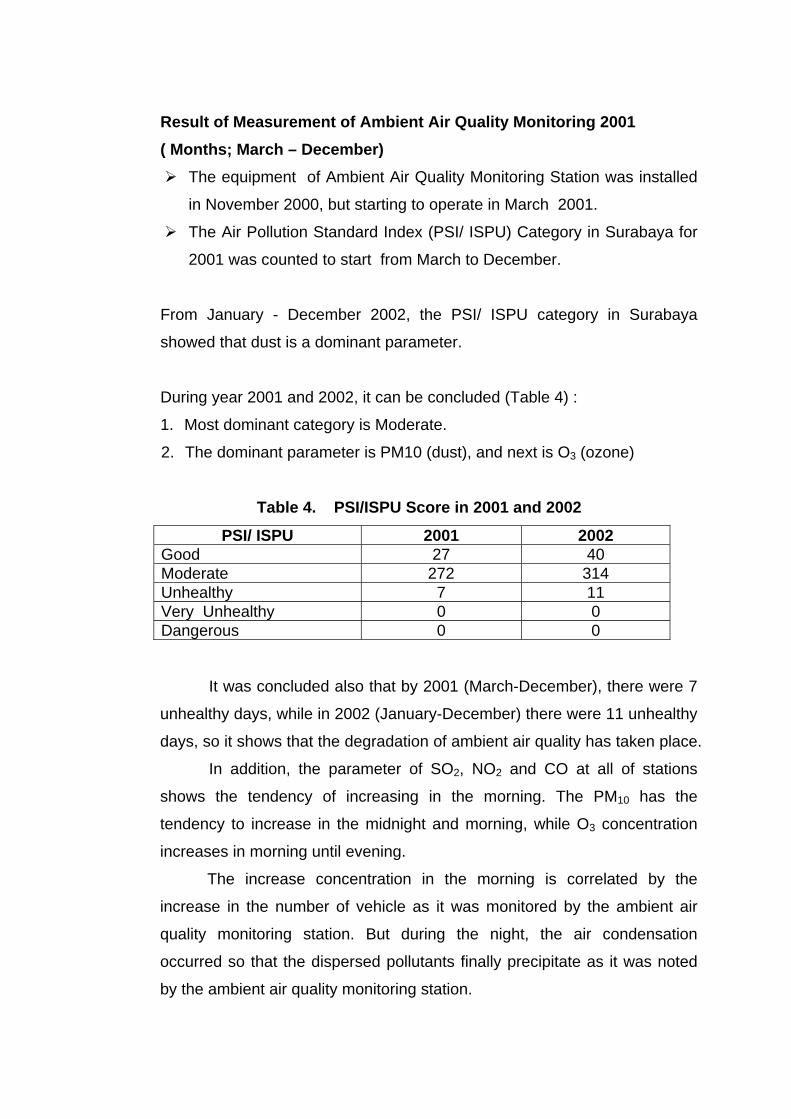
Result of Measurement of Ambient Air Quality Monitoring 2001 ( Months; March – December)
The equipment of Ambient Air Quality Monitoring Station was installed
in November 2000, but starting to operate in March 2001.
The Air Pollution Standard Index (PSI/ ISPU) Category in Surabaya for
2001 was counted to start from March to December.
From January - December 2002, the PSI/ ISPU category in Surabaya
showed that dust is a dominant parameter.
During year 2001 and 2002, it can be concluded (Table 4) :
1. Most dominant category is Moderate.
2. The dominant parameter is PM10 (dust), and next is O3 (ozone)
Table 4. PSI/ISPU Score in 2001 and 2002
PSI/ ISPU 2001 2002 Good 27 40 Moderate 272 314 Unhealthy 7 11 Very Unhealthy 0 0 Dangerous 0 0
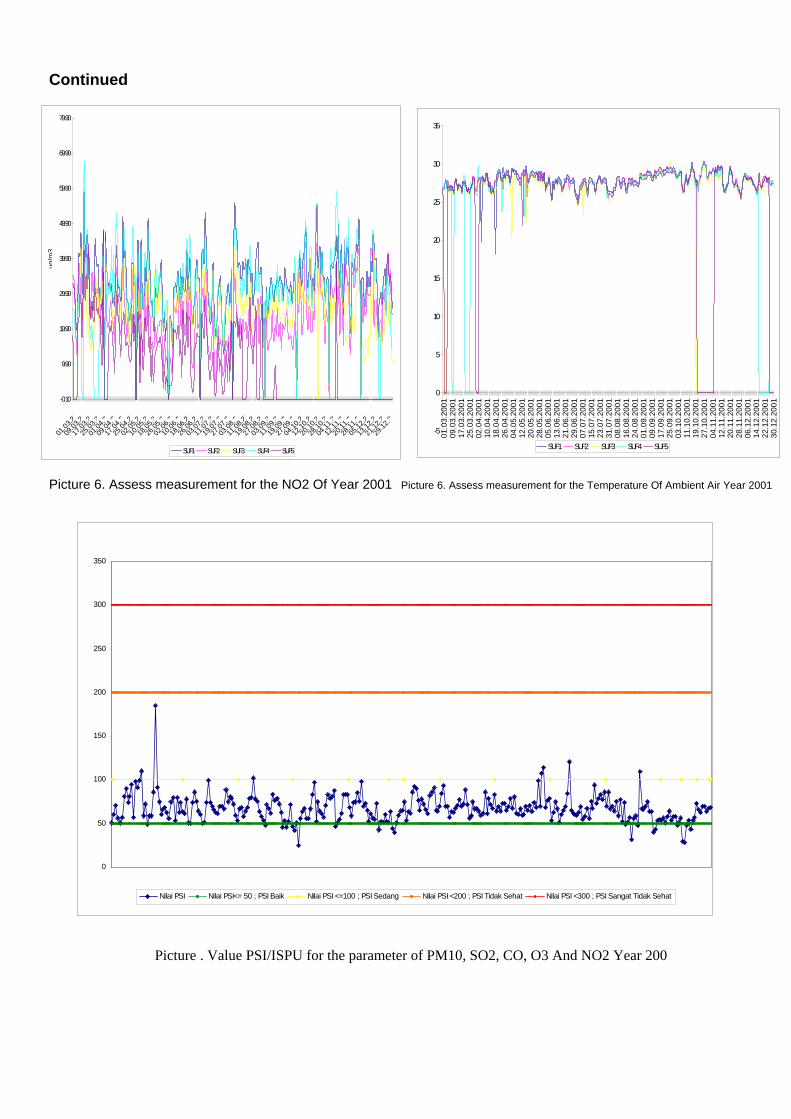
It was concluded also that by 2001 (March-December), there were 7
unhealthy days, while in 2002 (January-December) there were 11 unhealthy
days, so it shows that the degradation of ambient air quality has taken place.
In addition, the parameter of SO2, NO2 and CO at all of stations
shows the tendency of increasing in the morning. The PM10 has the
tendency to increase in the midnight and morning, while O3 concentration
increases in morning until evening.
The increase concentration in the morning is correlated by the
increase in the number of vehicle as it was monitored by the ambient air
quality monitoring station. But during the night, the air condensation
occurred so that the dispersed pollutants finally precipitate as it was noted
by the ambient air quality monitoring station.
From the data, it shows that the air quality Surabaya tends to
decrease gradually so that it requires conduct air pollution control.
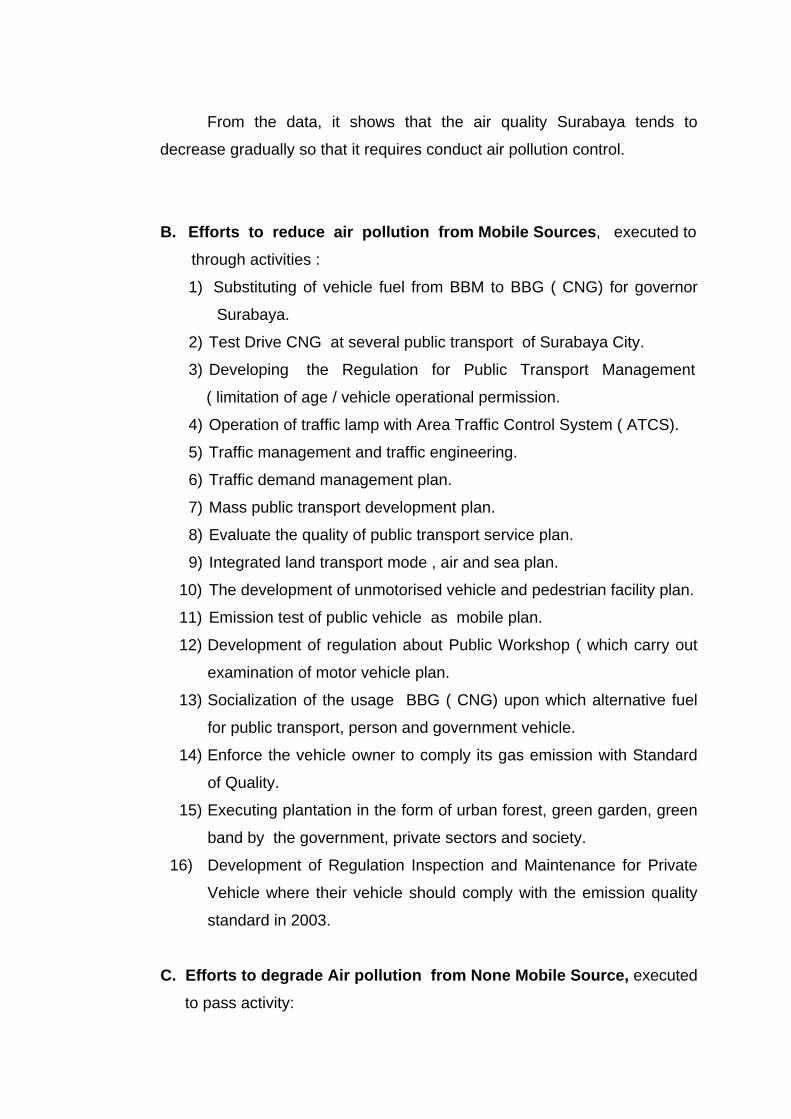
B. Efforts to reduce air pollution from Mobile Sources, executed to
through activities :
1) Substituting of vehicle fuel from BBM to BBG ( CNG) for governor
Surabaya.
2) Test Drive CNG at several public transport of Surabaya City.
3) Developing the Regulation for Public Transport Management
( limitation of age / vehicle operational permission.
4) Operation of traffic lamp with Area Traffic Control System ( ATCS).
5) Traffic management and traffic engineering.
6) Traffic demand management plan.
7) Mass public transport development plan.
8) Evaluate the quality of public transport service plan.
9) Integrated land transport mode , air and sea plan.
10) The development of unmotorised vehicle and pedestrian facility plan.
11) Emission test of public vehicle as mobile plan.
12) Development of regulation about Public Workshop ( which carry out
examination of motor vehicle plan.
13) Socialization of the usage BBG ( CNG) upon which alternative fuel
for public transport, person and government vehicle.
14) Enforce the vehicle owner to comply its gas emission with Standard
of Quality.
15) Executing plantation in the form of urban forest, green garden, green
band by the government, private sectors and society.
16) Development of Regulation Inspection and Maintenance for Private
Vehicle where their vehicle should comply with the emission quality
standard in 2003.
C. Efforts to degrade Air pollution from None Mobile Source, executed
to pass activity:
1) Administering of the most potential air polluter.
2) Determinating the Goals monitoring program.
3) Initial monitoring.
4) SUPER (Letter of Statement Signing).
5) The structure of air quality control and operation :
The supporting is adequate.
The supporting is not adequate.
6) The structure is adequate, than is continue by air quality monitoring :
The air quality monitoring is adequate.
Otherwise the air quality monitoring is not adequate it should be
followed by guidance and routine monitoring and applying of law
enforcement.
7) If the structure is not adequate it should be continued by the air
quality monitoring :
The air quality monitoring is adequate.
Otherwise the air quality monitoring is not adequate it should be
followed by guidance and routine monitoring and applying of law
enforcement.
V. CONCLUSION
Finally Ambient air quality management of good ambient air and supported
by all participant in Surabaya (Governmental : Coordinating in every institution,
implementation regulation; Private sector ; Society : more used public transport ;
plantation, etc) will yield the make-up of the air quality continuity of better life in
period to come, because this country only grandchild children's looking after we
let us take care of its.
VI. BIBLIOGRAPHY 1. Code Number 23 Year 1997 about Environment Management.
2. BAPEDAL, 1999, Regulation of Republic Indonesia Government,
Number 41 Year 1999 about Air Pollution Control.
3. De Nevers, Noel, 1995, Water Pollution Control Engineering, Mc Graw
Hill, Inc, Singapore
4. Jerry A. Nathanson, Basic Environmental Technology " Water Supply,
Waste Management Pollution Control and", Third Edition, 2000
5. Peavy,Hs,Rowe,D.R, Tchobanoglous,G.,1985, Environmental
Engineering, Mc Graw Hill , Inc, Singapore
VII. ENCLOSURE

AIR QUALITY SURABAYA JUNE – OCTOBER 1999
NO. Date Location SO2 CO Nox PKP Dust Pb H2S NH3 HC Temp Noise Adv.
1 16.06.1999 Air Quality at cross section Demak- Dupak 0,0167 6,40 0,0107 0,0025 0,460 0,0024 0,0000 0,0025 0,21 32 77,9-81,3 Air Quality standard 2 16.06.1999 Air Quality in front of Plasa Jembatan Merah 0,0142 1,32 0,0145 0,0014 0,173 0,0018 0,0000 0,0014 0,06 32 73,3-84,2 Which is allowed 3 16.06.1999 Air Quality at cross section Tunjungan-Gentengkali 0,0268 2,33 0,0188 0,0003 0,253 0,0022 0,0000 0,0003 0,16 34 71,7-74,0 Regional Law Governor 4 16.06.1999 Air Quality at cross sect.Prof Mostopo-Dharmawgs 0,0161 1,60 0,0128 0,0014 0,360 0,0012 0,0000 0,0014 0,04 32 74,9-77,0 129/1996 5 16.06.1999 Air Quality at cross section Gubeng-Pemuda 0,0174 1,42 0,0015 0,0012 0,293 0,0011 0,0000 0,0137 0,08 30 70,4-76,2 6 16.06.1999 Air Quality at Bratang Terminal 0,0161 5,80 0,0143 0,0009 0,473 0,0017 0,0000 0,0009 0,30 34 72,3-75,4 SO2 = 0,1 ppm 7 16.06.1999 Air Quality at cross section SIER Rungkut 0,0268 2,55 0,0161 0,0013 0,160 0,0014 0,0000 0,0003 0,33 33,5 71,6-75,6 CO = 20,0 ppm 8 16.06.1999 Air Quality at Purabaya Terminal 0,0104 4,67 0,0176 0,0100 0,453 0,0025 0,0000 0,0005 0,56 32 68,7-75,3 Nox = 0,05 ppm 9 16.06.1999 Air Quality at Mayangkara fly over 0,0155 7,15 0,0104 0,0006 0,627 0,0031 0,0000 0,0066 0,44 30 77,3-81,4 PKP = 0,10 ppm
10 16.06.1999 Air Quality at Joyoboyo Terminal 0,0167 2,06 0,0071 0,0015 0,373 0,0028 0,0000 0,0066 0,11 33 77,5-80,6 Dust = 0,260 mg/m3 Pb = 0,06 mg/m3
1 26.07.1999 Air Quality at cross section Demak- Dupak 0,0186 7,41 0,0123 0,0027 1,000 0,0028 0,0001 0,0028 0,13 30 76,9-79,8 H2S = 0,03 ppm 2 26.07.1999 Air Quality in front of Plasa Jembatan Merah 0,0157 2,80 0,0135 0,0018 0,247 0,0019 0,0000 0,0015 0,06 31 68,3-72,1 NH3 = 2,0 ppm 3 26.07.1999 Air Quality at cross section Tunjungan-Gentengkali 0,0136 1,66 0,0147 0,0022 0,293 0,0024 0,0000 0,0014 0,02 33 72,3-77,0 HC = 0,24 ppm 4 26.07.1999 Air Quality at cross sect.Prof Mostopo-Dharmawgs 0,0159 3,38 0,0168 0,0051 0,240 0,0024 0,0000 0,0012 0,04 32 72,5-76,8 5 26.07.1999 Air Quality at cross section Gubeng-Pemuda 0,0193 1,27 0,0123 0,0042 0,307 0,0015 0,0000 0,0083 0,03 32 72,7-77,6 6 26.07.1999 Air Quality at Bratang Terminal 0,0172 3,22 0,0153 0,0011 0,320 0,0019 0,0000 0,0012 0,06 32 67,6-72,9 Law Health Minister 7 26.07.1999 Air Quality at cross section SIER Rungkut 0,0271 4,01 0,0183 0,0098 0,133 0,0016 0,0000 0,0010 0,08 31 69,4-74,0 718/1987 8 26.07.1999 Air Quality at Purabaya Terminal 0,0162 6,84 0,0192 0,0000 0,320 0,0028 0,0000 0,0012 0,11 31 72,2-77,7 Zona D = 60-70 dBA 9 26.07.1999 Air Quality at Mayangkara fly Over 0,0178 9,30 0,0123 0,0012 0,227 0,0034 0,0000 0,0015 0,20 29 74,1-79,5
10 26.07.1999 Air Quality at Joyoboyo Teminal 0,0183 2,47 0,0105 0,0012 0,207 0,0031 0,0000 0,0068 0,08 30 67,4-72,3
1 11.08.1999 Air Quality at cross section Demak- Dupak 0,0236 8,90 0,0122 0,0029 0,960 0,0031 0,0009 0,0036 0,16 31 75,6-83,7 2 11.08.1999 Air Quality in front of Jembatan Merah Plaza 0,0162 3,42 0,0134 0,0018 0,313 0,0019 0,0000 0,0023 0,08 33 70,2-75,8 3 11.08.1999 Air Quality at cross section Tunjungan-Gentengkali 0,0165 3,63 0,0175 0,0041 0,293 0,0028 0,0000 0,0023 0,06 35 75,8-81,3 4 11.08.1999 Air Quality at cross sect.Prof Mostopo-Dharmawgs 0,0142 1,72 0,0158 0,0025 0,273 0,0017 0,0001 0,0018 0,07 32 73,2-76,7 5 11.08.1999 Air Quality at cross section Gubeng-Pemuda 0,0178 1,93 0,0196 0,0006 0,320 0,0018 0,0000 0,0007 0,17 34 70,5-74,7 6 11.08.1999 Air Quality at Bratang Terminal 0,0185 3,28 0,0163 0,0010 0,827 0,0019 0,0000 0,0015 0,07 34,5 70,1-74,6 7 11.08.1999 Air Quality at cross section Rungkut SIER 0,0286 4,12 0,0193 0,0048 0,287 0,0019 0,0004 0,0025 0,05 34 70,6-75,7 8 11.08.1999 Air Quality at Purabaya Terminal 0,0184 6,88 0,0120 0,0012 0,707 0,0029 0,0004 0,0015 0,11 34 80,0-80,6 9 11.08.1999 Air Quality at Mayangkara fly over 0,0199 10,32 0,0186 0,0013 0,500 0,0036 0,0001 0,0018 0,25 30 74,6-79,4
10 11.08.1999 Air Quality at Joyoboyo Teminal 0,0189 2,58 0,0125 0,0009 0,300 0,0032 0,0005 0,0070 0,08 30 78,9-81,8
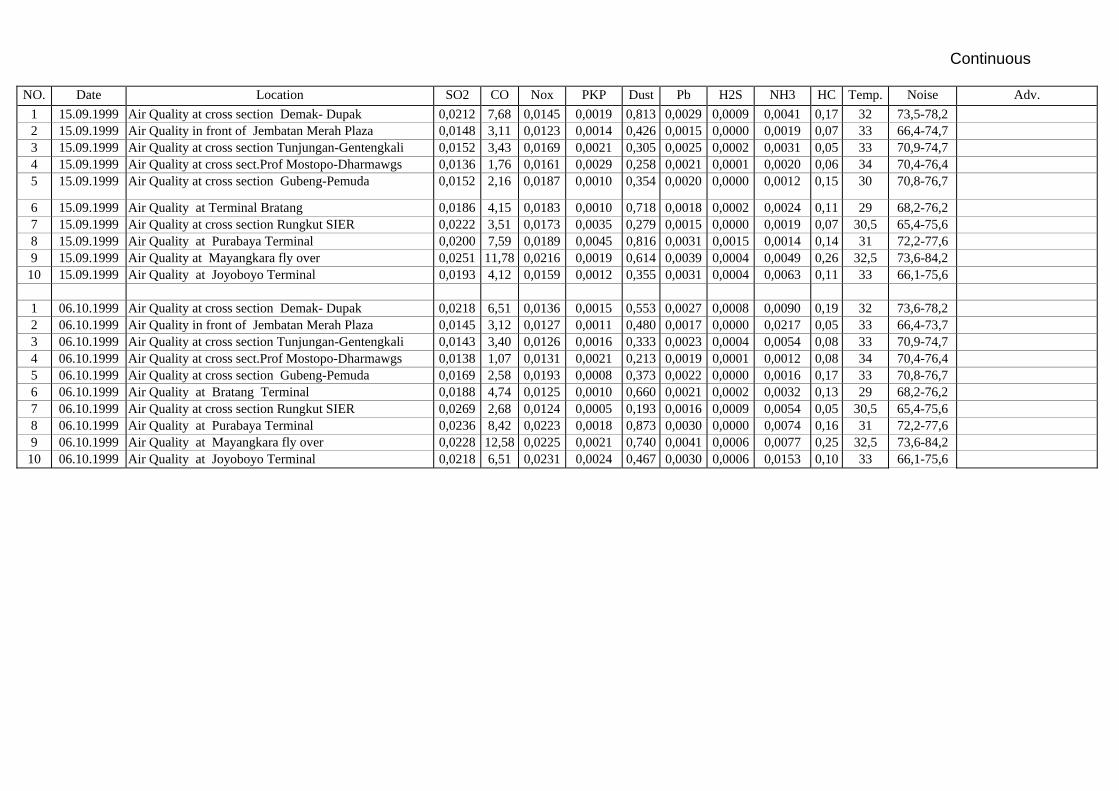
Continuous
NO. Date Location SO2 CO Nox PKP Dust Pb H2S NH3 HC Temp. Noise Adv. 1 15.09.1999 Air Quality at cross section Demak- Dupak 0,0212 7,68 0,0145 0,0019 0,813 0,0029 0,0009 0,0041 0,17 32 73,5-78,2 2 15.09.1999 Air Quality in front of Jembatan Merah Plaza 0,0148 3,11 0,0123 0,0014 0,426 0,0015 0,0000 0,0019 0,07 33 66,4-74,7 3 15.09.1999 Air Quality at cross section Tunjungan-Gentengkali 0,0152 3,43 0,0169 0,0021 0,305 0,0025 0,0002 0,0031 0,05 33 70,9-74,7 4 15.09.1999 Air Quality at cross sect.Prof Mostopo-Dharmawgs 0,0136 1,76 0,0161 0,0029 0,258 0,0021 0,0001 0,0020 0,06 34 70,4-76,4 5 15.09.1999 Air Quality at cross section Gubeng-Pemuda 0,0152 2,16 0,0187 0,0010 0,354 0,0020 0,0000 0,0012 0,15 30 70,8-76,7
6 15.09.1999 Air Quality at Terminal Bratang 0,0186 4,15 0,0183 0,0010 0,718 0,0018 0,0002 0,0024 0,11 29 68,2-76,2 7 15.09.1999 Air Quality at cross section Rungkut SIER 0,0222 3,51 0,0173 0,0035 0,279 0,0015 0,0000 0,0019 0,07 30,5 65,4-75,6 8 15.09.1999 Air Quality at Purabaya Terminal 0,0200 7,59 0,0189 0,0045 0,816 0,0031 0,0015 0,0014 0,14 31 72,2-77,6 9 15.09.1999 Air Quality at Mayangkara fly over 0,0251 11,78 0,0216 0,0019 0,614 0,0039 0,0004 0,0049 0,26 32,5 73,6-84,2
10 15.09.1999 Air Quality at Joyoboyo Terminal 0,0193 4,12 0,0159 0,0012 0,355 0,0031 0,0004 0,0063 0,11 33 66,1-75,6
1 06.10.1999 Air Quality at cross section Demak- Dupak 0,0218 6,51 0,0136 0,0015 0,553 0,0027 0,0008 0,0090 0,19 32 73,6-78,2 2 06.10.1999 Air Quality in front of Jembatan Merah Plaza 0,0145 3,12 0,0127 0,0011 0,480 0,0017 0,0000 0,0217 0,05 33 66,4-73,7 3 06.10.1999 Air Quality at cross section Tunjungan-Gentengkali 0,0143 3,40 0,0126 0,0016 0,333 0,0023 0,0004 0,0054 0,08 33 70,9-74,7 4 06.10.1999 Air Quality at cross sect.Prof Mostopo-Dharmawgs 0,0138 1,07 0,0131 0,0021 0,213 0,0019 0,0001 0,0012 0,08 34 70,4-76,4 5 06.10.1999 Air Quality at cross section Gubeng-Pemuda 0,0169 2,58 0,0193 0,0008 0,373 0,0022 0,0000 0,0016 0,17 33 70,8-76,7 6 06.10.1999 Air Quality at Bratang Terminal 0,0188 4,74 0,0125 0,0010 0,660 0,0021 0,0002 0,0032 0,13 29 68,2-76,2 7 06.10.1999 Air Quality at cross section Rungkut SIER 0,0269 2,68 0,0124 0,0005 0,193 0,0016 0,0009 0,0054 0,05 30,5 65,4-75,6 8 06.10.1999 Air Quality at Purabaya Terminal 0,0236 8,42 0,0223 0,0018 0,873 0,0030 0,0000 0,0074 0,16 31 72,2-77,6 9 06.10.1999 Air Quality at Mayangkara fly over 0,0228 12,58 0,0225 0,0021 0,740 0,0041 0,0006 0,0077 0,25 32,5 73,6-84,2
10 06.10.1999 Air Quality at Joyoboyo Terminal 0,0218 6,51 0,0231 0,0024 0,467 0,0030 0,0006 0,0153 0,10 33 66,1-75,6
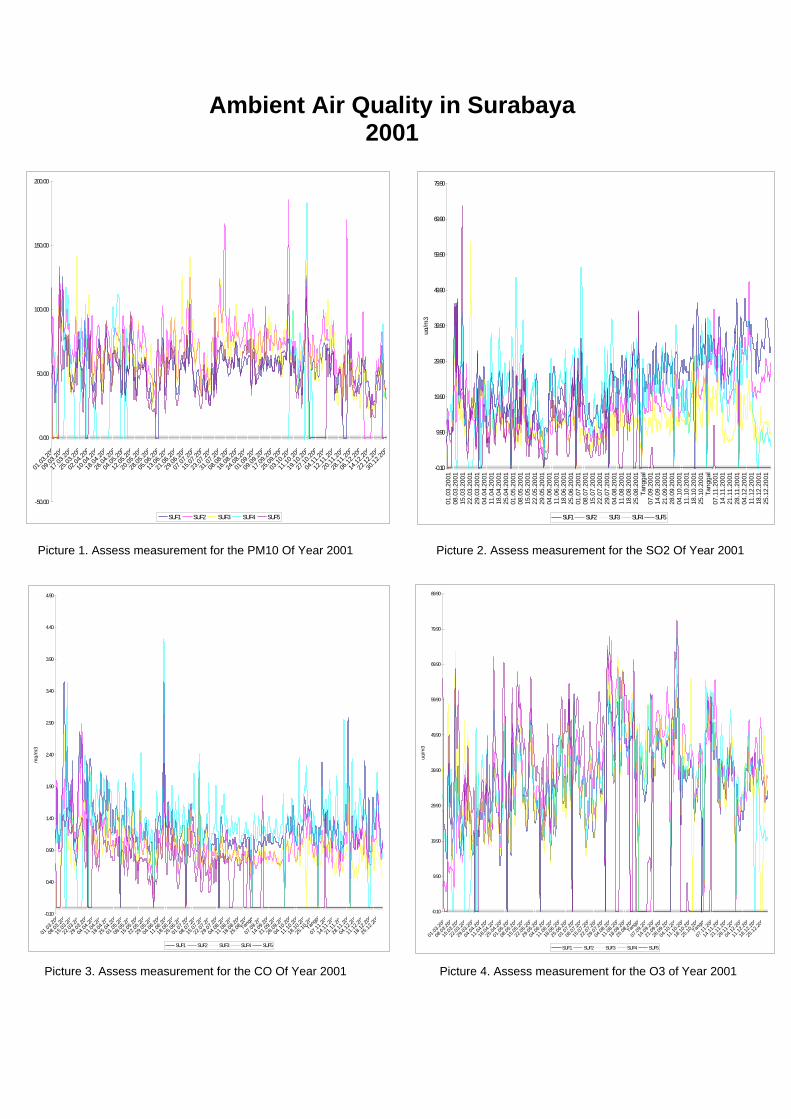
Ambient Air Quality in Surabaya
2001
Picture 1. Assess measurement for the PM10 Of Year 2001 Picture 2. Assess measurement for the SO2 Of Year 2001
Picture 3. Assess measurement for the CO Of Year 2001 Picture 4. Assess measurement for the O3 of Year 2001
-50.00
0.00
50.00
100.00
150.00
200.00
01.03
.200
09.03
.200
17.03
.200
25.03
.200
02.04
.200
10.04
.200
18.04
.200
26.04
.200
04.05
.200
12.05
.200
20.05
.200
28.05
.200
05.06
.200
13.06
.200
21.06
.200
29.06
.200
07.07
.200
15.07
.200
23.07
.200
31.07
.200
08.08
.200
16.08
.200
24.08
.200
01.09
.200
09.09
.200
17.09
.200
25.09
.200
03.10
.200
11.10
.200
19.10
.200
27.10
.200
04.11
.200
12.11
.200
20.11
.200
28.11
.200
06.12
.200
14.12
.200
22.12
.200
30.12
.200
SUF1 SUF2 SUF3 SUF4 SUF5
-0.10
9.90
19.90
29.90
39.90
49.90
59.90
69.90
79.90
01.0
3.20
0108
.03.
2001
15.0
3.20
0122
.03.
2001
29.0
3.20
0104
.04.
2001
11.0
4.20
0118
.04.
2001
25.0
4.20
0101
.05.
2001
08.0
5.20
0115
.05.
2001
22.0
5.20
0129
.05.
2001
04.0
6.20
0111
.06.
2001
18.0
6.20
0125
.06.
2001
01.0
7.20
0108
.07.
2001
15.0
7.20
0122
.07.
2001
29.0
7.20
0104
.08.
2001
11.0
8.20
0118
.08.
2001
25.0
8.20
01Ta
ngga
l07
.09.
2001
14.0
9.20
0121
.09.
2001
28.0
9.20
0104
.10.
2001
11.1
0.20
0118
.10.
2001
25.1
0.20
01Ta
ngga
l07
.11.
2001
14.1
1.20
0121
.11.
2001
28.1
1.20
0104
.12.
2001
11.1
2.20
0118
.12.
2001
25.1
2.20
01
ug/m
3
SUF1 SUF2 SUF3 SUF4 SUF5
-0.10
0.40
0.90
1.40
1.90
2.40
2.90
3.40
3.90
4.40
4.90
01.03
.200
08.03
.200
15.03
.200
22.03
.200
29.03
.200
04.04
.200
11.04
.200
18.04
.200
25.04
.200
01.05
.200
08.05
.200
15.05
.200
22.05
.200
29.05
.200
04.06
.200
11.06
.200
18.06
.200
25.06
.200
01.07
.200
08.07
.200
15.07
.200
22.07
.200
29.07
.200
04.08
.200
11.08
.200
18.08
.200
25.08
.200
Tangg
a
07.09
.200
14.09
.200
21.09
.200
28.09
.200
04.10
.200
11.10
.200
18.10
.200
25.10
.200
Tangg
a
07.11
.200
14.11
.200
21.11
.200
28.11
.200
04.12
.200
11.12
.200
18.12
.200
25.12
.200
mg/
m3
SUF1 SUF2 SUF3 SUF4 SUF5
-0.10
9.90
19.90
29.90
39.90
49.90
59.90
69.90
79.90
89.90
01.03
.200
08.03
.200
15.03
.200
22.03
.200
29.03
.200
04.04
.200
11.04
.200
18.04
.200
25.04
.200
01.05
.200
08.05
.200
15.05
.200
22.05
.200
29.05
.200
04.06
.200
11.06
.200
18.06
.200
25.06
.200
01.07
.200
08.07
.200
15.07
.200
22.07
.200
29.07
.200
04.08
.200
11.08
.200
18.08
.200
25.08
.200
Tangg
a
07.09
.200
14.09
.200
21.09
.200
28.09
.200
04.10
.200
11.10
.200
18.10
.200
25.10
.200
Tangg
a
07.11
.200
14.11
.200
21.11
.200
28.11
.200
04.12
.200
11.12
.200
18.12
.200
25.12
.200
ug/m
3
SUF1 SUF2 SUF3 SUF4 SUF5
Continued
Picture 6. Assess measurement for the NO2 Of Year 2001 Picture 6. Assess measurement for the Temperature Of Ambient Air Year 2001
Picture . Value PSI/ISPU for the parameter of PM10, SO2, CO, O3 And NO2 Year 200
-0.10
9.90
19.90
29.90
39.90
49.90
59.90
69.90
79.90
01.03
.20
09.03
.20
17.03
.20
25.03
.20
01.04
.20
09.04
.20
17.04
.20
25.04
.20
02.05
.20
10.05
.20
18.05
.20
26.05
.20
02.06
.20
10.06
.20
18.06
.20
26.06
.20
03.07
.20
11.07
.20
19.07
.20
27.07
.20
03.08
.20
11.08
.20
19.08
.20
27.08
.20
03.09
.20
11.09
.20
19.09
.20
27.09
.20
04.10
.20
12.10
.20
20.10
.20
28.10
.20
04.11
.20
12.11
.20
20.11
.20
28.11
.20
05.12
.20
13.12
.20
21.12
.20
29.12
.20
ug/m
3
SUF1 SUF2 SUF3 SUF4 SUF5
-5
0
5
10
15
20
25
30
35
01.0
3.20
0109
.03.
2001
17.0
3.20
0125
.03.
2001
02.0
4.20
0110
.04.
2001
18.0
4.20
0126
.04.
2001
04.0
5.20
0112
.05.
2001
20.0
5.20
0128
.05.
2001
05.0
6.20
0113
.06.
2001
21.0
6.20
0129
.06.
2001
07.0
7.20
0115
.07.
2001
23.0
7.20
0131
.07.
2001
08.0
8.20
0116
.08.
2001
24.0
8.20
0101
.09.
2001
09.0
9.20
0117
.09.
2001
25.0
9.20
0103
.10.
2001
11.1
0.20
0119
.10.
2001
27.1
0.20
0104
.11.
2001
12.1
1.20
0120
.11.
2001
28.1
1.20
0106
.12.
2001
14.1
2.20
0122
.12.
2001
30.1
2.20
01
SUF1 SUF2 SUF3 SUF4 SUF5
0
50
100
150
200
250
300
350
Nilai PSI Nilai PSI<= 50 ; PSI Baik Nilai PSI <=100 ; PSI Sedang Nilai PSI <200 ; PSI Tidak Sehat Nilai PSI <300 ; PSI Sangat Tidak Sehat
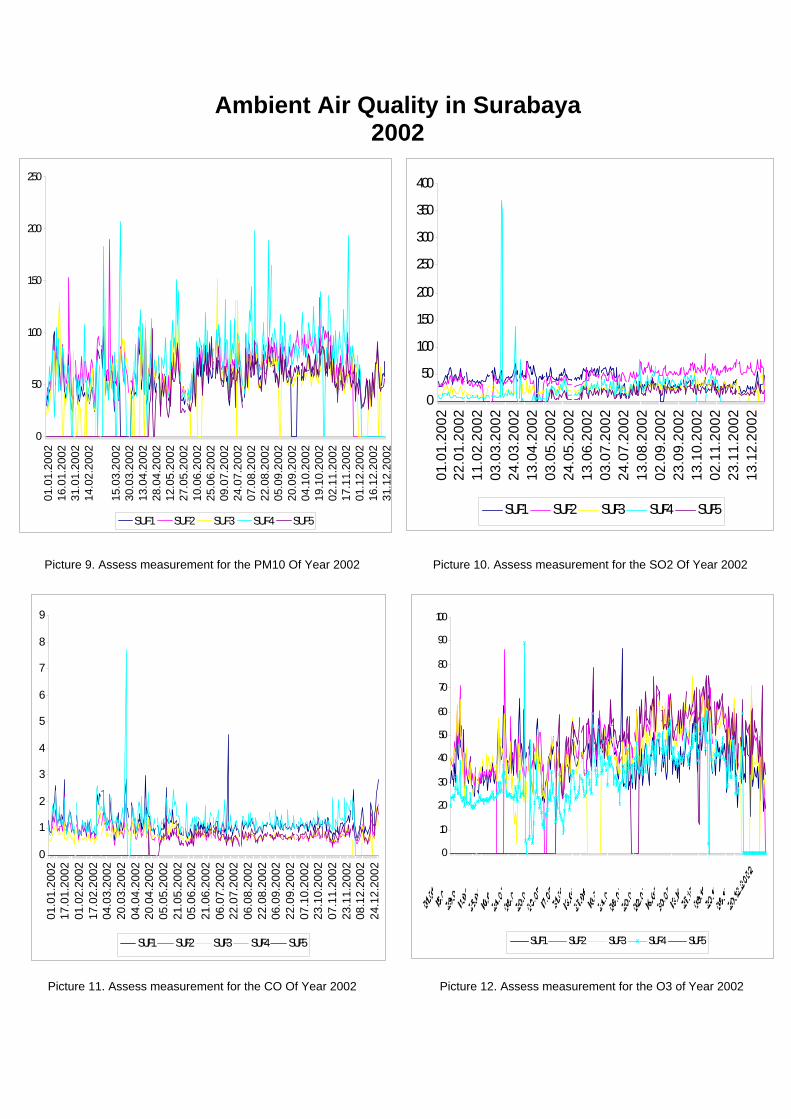
Ambient Air Quality in Surabaya
2002
Picture 9. Assess measurement for the PM10 Of Year 2002 Picture 10. Assess measurement for the SO2 Of Year 2002
Picture 11. Assess measurement for the CO Of Year 2002 Picture 12. Assess measurement for the O3 of Year 2002
0
50
100
150
200
250
300
350
400
01.0
1.20
0222
.01.
2002
11.0
2.20
0203
.03.
2002
24.0
3.20
0213
.04.
2002
03.0
5.20
0224
.05.
2002
13.0
6.20
0203
.07.
2002
24.0
7.20
0213
.08.
2002
02.0
9.20
0223
.09.
2002
13.1
0.20
0202
.11.
2002
23.1
1.20
0213
.12.
2002
SUF1 SUF2 SUF3 SUF4 SUF5
0
50
100
150
200
250
01.0
1.20
0216
.01.
2002
31.0
1.20
0214
.02.
2002
15.0
3.20
0230
.03.
2002
13.0
4.20
0228
.04.
2002
12.0
5.20
0227
.05.
2002
10.0
6.20
0225
.06.
2002
09.0
7.20
0224
.07.
2002
07.0
8.20
0222
.08.
2002
05.0
9.20
0220
.09.
2002
04.1
0.20
0219
.10.
2002
02.1
1.20
0217
.11.
2002
01.1
2.20
0216
.12.
2002
31.1
2.20
02
SUF1 SUF2 SUF3 SUF4 SUF5
0
1
2
3
4
5
6
7
8
9
01.0
1.20
0217
.01.
2002
01.0
2.20
0217
.02.
2002
04.0
3.20
0220
.03.
2002
04.0
4.20
0220
.04.
2002
05.0
5.20
0221
.05.
2002
05.0
6.20
0221
.06.
2002
06.0
7.20
0222
.07.
2002
06.0
8.20
0222
.08.
2002
06.0
9.20
0222
.09.
2002
07.1
0.20
0223
.10.
2002
07.1
1.20
0223
.11.
2002
08.1
2.20
0224
.12.
2002
SUF1 SUF2 SUF3 SUF4 SUF5
0
10
20
30
40
50
60
70
80
90
100
SUF1 SUF2 SUF3 SUF4 SUF5
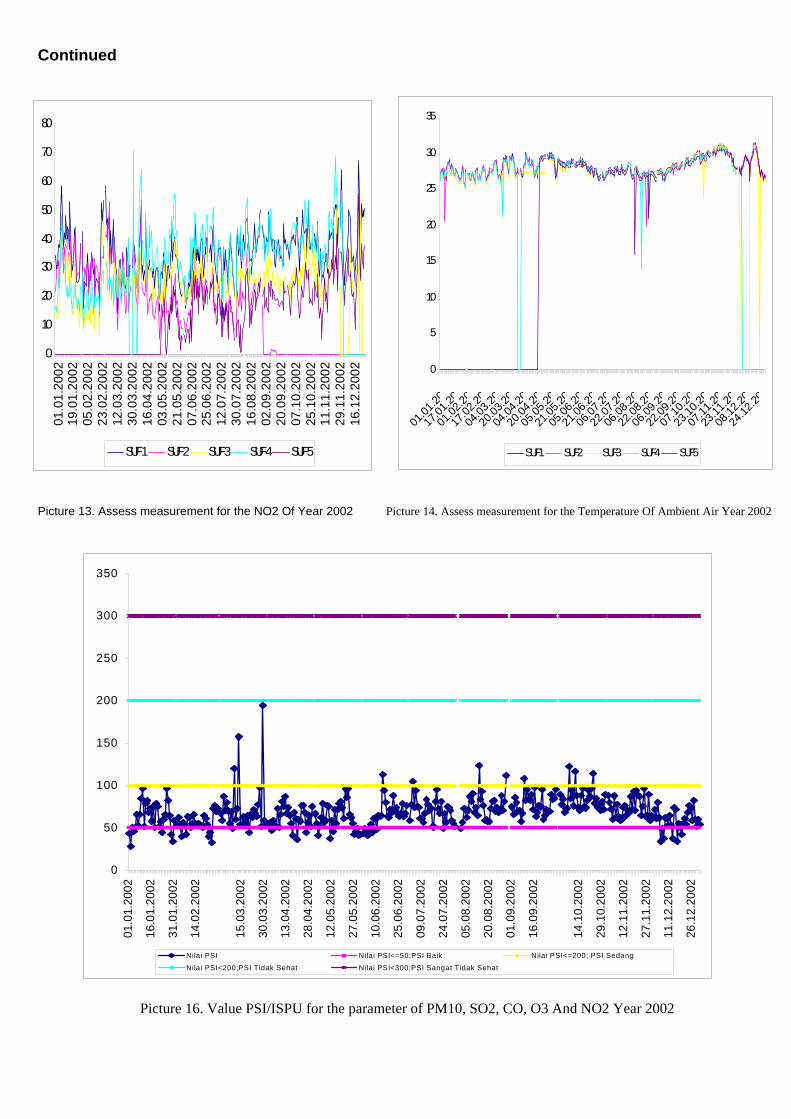
Continued
Picture 13. Assess measurement for the NO2 Of Year 2002 Picture 14. Assess measurement for the Temperature Of Ambient Air Year 2002
Picture 16. Value PSI/ISPU for the parameter of PM10, SO2, CO, O3 And NO2 Year 2002
0
10
20
30
40
50
60
70
80
01.0
1.20
0219
.01.
2002
05.0
2.20
0223
.02.
2002
12.0
3.20
0230
.03.
2002
16.0
4.20
0203
.05.
2002
21.0
5.20
0207
.06.
2002
25.0
6.20
0212
.07.
2002
30.0
7.20
0216
.08.
2002
02.0
9.20
0220
.09.
2002
07.1
0.20
0225
.10.
2002
11.1
1.20
0229
.11.
2002
16.1
2.20
02
SUF 1 SUF 2 SUF 3 SUF 4 SUF 5
0
5
10
15
20
25
30
35
01.01
.200
17.01
.200
01.02
.200
17.02
.200
04.03
.200
20.03
.200
04.04
.200
20.04
.200
05.05
.200
21.05
.200
05.06
.200
21.06
.200
06.07
.200
22.07
.200
06.08
.200
22.08
.200
06.09
.200
22.09
.200
07.10
.200
23.10
.200
07.11
.200
23.11
.200
08.12
.200
24.12
.200
SUF1 SUF2 SUF3 SUF4 SUF5
0
50
100
150
200
250
300
350
01.0
1.20
02
16.0
1.20
02
31.0
1.20
02
14.0
2.20
02
15.0
3.20
02
30.0
3.20
02
13.0
4.20
02
28.0
4.20
02
12.0
5.20
02
27.0
5.20
02
10.0
6.20
02
25.0
6.20
02
09.0
7.20
02
24.0
7.20
02
05.0
8.20
02
20.0
8.20
02
01.0
9.20
02
16.0
9.20
02
14.1
0.20
02
29.1
0.20
02
12.1
1.20
02
27.1
1.20
02
11.1
2.20
02
26.1
2.20
02
Nilai PSI Nilai PSI<=50;PSI Baik Nilai PSI<=200; PSI Sedang
Nilai PSI<200;PSI Tidak Sehat Nilai PSI<300;PSI Sangat Tidak Sehat
