2016 annual air quality report - new york state … york state ambient air quality report for 2016...
TRANSCRIPT

www.dec.ny.gov
NEW YORK STATE AMBIENT AIR QUALITY REPORT FOR 2016
New York State Ambient Air Monitoring Program
BUREAU OF AIR QUALITY SURVEILLANCE DIVISION OF AIR RESOURCES
NEW YORK STATE DEPARTMENT OF ENVIRONMENTAL CONSERVATION
625 Broadway Albany, NY 12233-3256 P: (518) 402-8508 | [email protected]

56
8 7 49
3
120 30 60 90 12015
Miles
±New York State Department of Environmental ConservationAdministrative Regions

!. !.
!.
!.
Babylon
Riverhead
Holtsville
Eisenhower Pk
0 9.5 19 28.5 384.75Miles
±Region 1
(Annual Means in parentheses are based on less than 75% available data) [Date of Occurrence, Hour] *Federal Ambient Air Quality Standard + Denotes a contravention of Federal AAQS
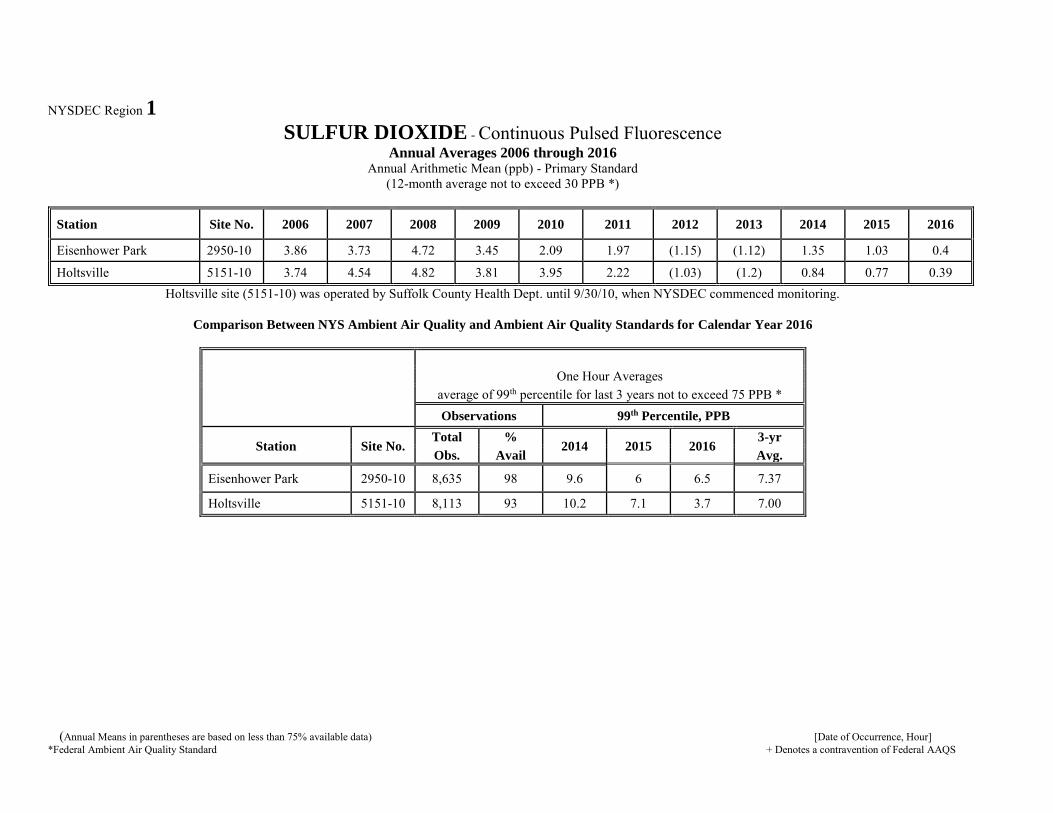
NYSDEC Region 1
SULFUR DIOXIDE - Continuous Pulsed FluorescenceAnnual Averages 2006 through 2016
Annual Arithmetic Mean (ppb) - Primary Standard (12-month average not to exceed 30 PPB *)
Station Site No. 2006 2007 2008 2009 2010 2011 2012 2013 2014 2015 2016
Eisenhower Park 2950-10 3.86 3.73 4.72 3.45 2.09 1.97 (1.15) (1.12) 1.35 1.03 0.4
Holtsville 5151-10 3.74 4.54 4.82 3.81 3.95 2.22 (1.03) (1.2) 0.84 0.77 0.39 Holtsville site (5151-10) was operated by Suffolk County Health Dept. until 9/30/10, when NYSDEC commenced monitoring.
Comparison Between NYS Ambient Air Quality and Ambient Air Quality Standards for Calendar Year 2016
One Hour Averages average of 99th percentile for last 3 years not to exceed 75 PPB * Observations 99th Percentile, PPB
Station Site No. Total %
2014 2015 2016 3-yr
Obs. Avail Avg.
Eisenhower Park 2950-10 8,635 98 9.6 6 6.5 7.37
Holtsville 5151-10 8,113 93 10.2 7.1 3.7 7.00

(Annual Means in parentheses are based on less than 75% available data) [Date of Occurrence, Hour] *Federal Ambient Air Quality Standard + Denotes a contravention of Federal AAQS
NYSDEC Region 1
INHALABLE PARTICULATES (PM2.5) - Rupprecht & Patashnick Sampler
Comparison Between NYS Ambient Air Quality and Ambient Air Quality Standards for Calendar Year 2016(Average of last 3 years’ annual means not to exceed 12 µg/m3 *;
and average of 98th percentile for last 3 years not to exceed 35 µg/m3 *)
Station Site No. Total
Obs.
Maximum Values, µg/m3 98th Percentile, µg/m3 Quarterly Averages,
2016 Annual Mean, µg/m3
1st 2nd 3rd 2014 2015 2016
3-yr
Avg. 1st 2nd 3rd 4th 2014 2015 2016
3-yr
Avg.
Eisenhower Park (C) 2950-10 355 19.2 17.8 17.6 19.2 17.8 16 17.5 8.6 5 5.1 7.0 7.9 7.3 6.4 7.2 [05/26] [03/10] [05/25]
Babylon (F) 5150-02 104 19.0 16.7 14.9 20.0 21.5 15 18.8 6.1 5.8 6.8 7.2 7.5 7.4 6.5 7.1 [01/07] [03/07] [03/10]
Holtsville (C) 5151-10 353 19.2 16.9 15.2
18.6 18.3 14 17.1 8.3 4.8 4.9 6.4 7.1 7.7 6.1 7.0 [05/26] [03/10] [06/23]
(F) = Federal Reference Method(C) = Continuous, used for Air Quality Index (AQI) calculations

(Annual Means in parentheses are based on less than 75% available data) [Date of Occurrence, Hour] *Federal Ambient Air Quality Standard + Denotes a contravention of Federal AAQS
NYSDEC Region 1
OZONE - Continuous UV Light Absorption
Comparison Between NYS Ambient Air Quality and Ambient Air Quality Standards for Calendar Year 2016
8-hr Running Average Begin Hour 4th Highest Daily Maximum 8-Hour
Average-
Observations Daily Highest Values, PPM
Not to exceed an avg of 0.075 ppm during the last 3 years, changed to 0.070 ppm beginning
1/1/2016*
Total %
Days
>.070
Station Site No. Obs. Avail PPM 1st 2nd 3rd 4th 2014 2015 2016 Avg.
Babylon 5150-02 5,935 93 4 0.085 0.076 0.073 0.073 0.066 0.079 0.073 0.073 [05/25] [07/15] [05/26] [06/21] [08/27] [07/20] [06/21]
Holtsville 5151-10 6,040 96 5 0.081 0.076 0.075 0.073 0.062 0.063 0.073 0.066 [05/25] [05/26] [07/15] [06/21] [08/05] [09/18] [06/21]Riverhead (Seasonal) 5155-01 3,823 96 7
0.085 0.079 0.079 0.078 0.064 0.076 0.078 0.073
[05/25] [05/26] [06/16] [07/15] [05/26] [08/15] [07/15]

!.
!.
!. !.
!.
!.
!.
!.
!.
!.
!.!.
!.
!.!.!.
!.
!.
!.
CCNY
PS #19
PS 314
IS #74IS #52
IS #143
JHS #45
PS #274JHS #126
Pfizer Lab
S. Wagner HS
Port Richmond
Maspeth LibraryDivision Street Queens College 2
Fresh Kills West 2
Queens College Near-Road
0 3.5 7 10.5 141.75Miles
±Region 2

(Annual Means in parentheses are based on less than 75% available data) [Date of Occurrence, Hour] *Federal Ambient Air Quality Standard + Denotes a contravention of Federal AAQS
NYSDEC Region 2
SULFUR DIOXIDE - Continuous Pulsed Fluorescence
Annual Averages 2006 through 2016Annual Arithmetic Mean (ppb) - Primary Standard
(12-month average not to exceed 30 PPB *)
Station Site No. 2006 2007 2008 2009 2010 2011 2012 2013 2014 2015 2016
PS 59 7093-10 9.65 9.75 (10.81) xx xx xx xx xx xx xx xx
Botanical Garden (Harding Lab/Pfizer Lab)
7094-06 / 7094-10 6.65 6.67 5.96 5.32 4.83 4.65 3.28 2.44 1.9 1.29 0.84
IS 52 7094-07 8.83 7.86 6.58 6.33 (6.22) xx (2.1) 1.22 1.36 1.83 0.67
Queens College 2 7096-15 5.24 4.89 4.02 3.41 2.83 2.65 1.79 1.22 1.11 0.75 0.57 Sampling was suspended at 7094-07 on 06/24/10 due to building construction, and resumed on 08/10/13.
Sampling was suspended at 7093-10 in 2009
Comparison Between NYS Ambient Air Quality and Ambient Air Quality Standards for Calendar Year 2016
One Hour Averages average of 99th percentile for last 3 years not to exceed 75 PPB *
Observations 99th Percentile, PPB
Station Site No. Total %
2014 2015 2016 3-yr
Obs. Avail Avg.
Botanical Garden (Harding Lab/Pfizer Lab) 7094-10 8,636 98 15.2 10.5 7.3 11.00
IS 52 7094-07 8,621 98 13.1 12.6 6.5 10.73
Queens College 2 7096-15 8,629 98 12.2 9.3 6.9 9.47

(Annual Means in parentheses are based on less than 75% available data) [Date of Occurrence, Hour] *Federal Ambient Air Quality Standard + Denotes a contravention of Federal AAQS
NYSDEC Region 2
INHALABLE PARTICULATES (PM10) - R&P Model 2025 Sampler
Comparison Between NYS Ambient Air Quality and Ambient Air Quality Standards for Calendar Year 2016
24-Hour Concentrations - µg/m3# of Days > 150 µg/m3 -
Not to exceed an expected avg of one per year during the last 3 years *
Maximum 2nd Max. 3rd Max. 2014 2015 2016
Total Exp.
Station Site No. Obs. Value Date Value Date Value Date Mea Est Mea Est Mea Est Avg.
Division Street 7093-24 58 48 7-Jan 34 23-Jun 32 12-May 0 0 0 0 0 0 0
IS 52 7094-07 57 37 7-Jan 32 7-May 30 7-Mar 0 0 0 0 0 0 0
Queens College 2 7096-15 57 44 7-Jan 31 25-May 27 25-Mar 0 0 0 0 0 0 0

(Annual Means in parentheses are based on less than 75% available data) [Date of Occurrence, Hour] *Federal Ambient Air Quality Standard + Denotes a contravention of Federal AAQS
NYSDEC Region 2
INHALABLE PARTICULATES (PM2.5) - Rupprecht & Patashnick Sampler(Manhattan Sites)
Comparison Between NYS Ambient Air Quality and Ambient Air Quality Standards for Calendar Year 2016
(Average of last 3 years’ annual means not to exceed 12 µg/m3 *; and average of 98th percentile for last 3 years not to exceed 35 µg/m3 *)
Station Site No. Total
Obs.
Maximum Values, µg/m3 98th Percentile, µg/m3 Quarterly Averages,
2016 Annual Mean, µg/m3
1st 2nd 3rd 2014 2015 2016 3-yr
Avg.1st 2nd 3rd 4th 2014 2015 2016
3-yr
Avg.
JHS 45 (F) 7093-08 113 23.2 19.2 16.2
25.5 25.5 16 22.4 7.3 6.8 7.0 7.7 8.8 9.1 7.2 8.4 [01/07] [05/27] [10/18]
IS 143 (C) 7093-15 346 26.3 24.4 22.8
22.1 22.4 22 22.2 11.0 7.0 6.4 8.4 9.3 10.1 8.4 9.3 [01/26] [05/27] [03/09]
PS 19 (F) 7093-21 352 20.5 20.5 20.3
25.6 26.7 19 23.9 9.9 8.2 8.0 9.5 (10.6) 11 8.9 xx [01/08] [03/09] [05/27]
PS 19 (C) 7093-21 352 20.5 20.5 20.3
20.8 20.3 18 19.8 10.0 6.8 6.8 8.4 9.0 9.1 8 8.7 [01/08] [03/09] [05/27]
Division St (F) 7093-24 119 26.8 19.4 18
20.5 26.2 18 21.6 9.4 8.6 8.2 9.1 (9.8) 10.3 8.8 xx [01/07] [05/27] [03/10]
Division St (C) 7093-24 352 21.1 21 20.7 20.6 19.4 19 19.6 9.3 7.1 7.2 7.5 8.7 8.8 7.8 8.4 [05/25] [03/09] [05/26]
CCNY (C) 7093-25 359 23.2 22.3 20.4
18.8 21.3 17 19.0 9.6 6.9 7.3 8.8 7.6 8.3 8.1 8.0 [03/09] [05/27] [05/26] (F) = Federal Reference Method(C) = Continuous, used for Air Quality Index (AQI) calculations

(Annual Means in parentheses are based on less than 75% available data) [Date of Occurrence, Hour] *Federal Ambient Air Quality Standard + Denotes a contravention of Federal AAQS
NYSDEC Region 2
INHALABLE PARTICULATES (PM2.5) - Rupprecht & Patashnick Sampler(Bronx & Brooklyn Sites)
Comparison Between NYS Ambient Air Quality and Ambient Air Quality Standards for Calendar Year 2016(Average of last 3 years’ annual means not to exceed 12 µg/m3 *;
and average of 98th percentile for last 3 years not to exceed 35 µg/m3 *)
Sampling was suspended at 7094-07 from 06/24/10 to 08/30/12 due to building construction (F) = Federal Reference Method(C) = Continuous, used for Air Quality Index (AQI) calculations
Station Site No. Total
Obs.
Maximum Values, µg/m3 98th Percentile, µg/m3 Quarterly
Averages, 2016 Annual Mean, µg/m3
1st 2nd 3rd 2014 2015 2016
3-yr
1st 2nd 3rd 4th 2014 2015 2016
3-yr
Avg. Avg.
Morrisania (C) 7094-05 358 22.5 21.3 19.9
24.9 23.2 17.3 21.8 8.9 5.8 5.6 7.3 9.5 8.7 6.9 8.4 [05/27] [03/09] [04/22]
IS 52 (F) 7094-07 117 22.2 19.3 16.9 23.2 25.7 16.9 21.9 8.2 7.1 7.2 8.0 8.7 9.1 7.6 8.5 [19.3] [05/27] [03/07]
IS 52 (C) 7094-07 356 26.5 21.5 20.6 16.2 24.1 16.1 18.8 5.8 5.8 6.2 6.1 7 8 6 7.0 [03/09] [01/07] [11/25]
IS 74 (C) 7094-08 353 28.7 23 20.9 19.6 20.5 17.5 19.2 9.4 6.4 6.2 7.2 7.8 8.5 7.3 7.9 [04/22] [03/08] [05/27]Botanical Garden (Harding Lab /Pfizer Lab)
7094-10 122 23.5 20.7 19.4
27.2 25.5 19.4 24.0 8.0 7.3 8.3 9.0 9.3 9.6 8.1 9.0 [01/07] [05/27] [11/02]
PS 314 (C) 7095-07 366 18.9 18 17.7 16.5 18.8 14.9 16.7 8.1 5.8 5.6 6.7 7.2 7.6 6.5 7.1 [05/26] [03/08] [03/09]
JHS 126 (F) 7095-43 119 26.1 18.7 16.4 20 25.2 16.4 20.5 8.6 7.2 7.2 8.2 8.8 9.2 7.8 8.6 [01/07] [05/27] [03/07]
PS 274 (C) 7095-98 365 18.6 18.6 18.4
16.2 18 16.5 16.9 8.1 5.7 5.6 7.2 7.1 7.4 6.6 7.0 [05/26] [05/27] [03/08]

(Annual Means in parentheses are based on less than 75% available data) [Date of Occurrence, Hour] *Federal Ambient Air Quality Standard + Denotes a contravention of Federal AAQS
NYSDEC Region 2
INHALABLE PARTICULATES (PM2.5) - Rupprecht & Patashnick Sampler(Queens, and Staten Island Sites)
Comparison Between NYS Ambient Air Quality and Ambient Air Quality Standards for Calendar Year
2016 (Average of last 3 years’ annual means not to exceed 12 µg/m3 *; and average of 98th percentile for last 3 years not to exceed 35 µg/m3 *, changed from 65 µg/m3 on 12/17/06)
Station Site No.
Total
Obs.
Maximum Values, µg/m3 98th Percentile, µg/m3 Quarterly Averages,
2016 Annual Mean, µg/m3
1st 2nd 3rd 2014 2015 2016
3-yr
1st 2nd 3rd 4th 2014 2015 2016
3-yr
Avg. Avg.
Maspeth Library (C) 7096-13 366 21.3 19.0 17.9
18.3 18.4 17 17.9 8.4 5.8 5.4 7.2 7.7 8.0 6.7 7.5 [05/26] [05/25] [01/07]
Queens College 2 (F) 7096-15 350 27 20.7 19.3 19.7 22.7 17 19.7 6.8 6.3 7.1 6.6 7.8 8.1 6.7 7.5 [01/07] [11/25] [03/09]
Queens College 2 (C) 7096-15 361 28.1 23.0 21.3 20 21.6 17 19.4 6.9 6.4 6.8 6.1 7.6 7.7 6.5 7.3 [01/07] [03/09] [03/08]
Port Richmond (F) 7097-03 116 22.4 17.0 15.7 17.9 24.7 16 19.4 7.7 6.7 7.0 7.2 8.6 8.6 7.2 8.1 [01/07] [05/27] [02/15]
Port Richmond (C) 7097-03 335 16.3 16.1 15.7 (20.7) 20.2 14 xx 7.9 5.5 5.7 7.4 (9.3) 9.3 6.6 xx [09/03] [03/09] [03/08]
Freshkills West (C) 7097-17 362 20.5 19.7 18.5
(16.6) 21 17 xx 8.8 6.4 6.4 7.6 (7.)9 7.3 8.2 xx [07/22] [05/27] [09/10] (F) = Federal Reference Method(C) = Continuous, used for Air Quality Index (AQI) calculations

(Annual Means in parentheses are based on less than 75% available data) [Date of Occurrence, Hour] *Federal Ambient Air Quality Standard + Denotes a contravention of Federal AAQS
NYSDEC Region 2
CARBON MONOXIDE - Continuous Gas Filter Correlation
Comparison Between NYS Ambient Air Quality and Ambient Air Quality Standards for Calendar Year 2016
One-Hour Average Running 8-Hour Average (Non-Overlapping)
Maximum not to exceed 35 PPM more than once per calendar year *
Maximum not to exceed 9 PPM more than once per calendar year *
Observations Highest Values, PPM Observations Highest Values, PPM
Total % >35
1st 2nd 3rd
>9 Days>
Station Site No. Obs. Avail PPM Total PPM 1st 2nd 9PPM
CCNY 7093-25 8,227 94 0 1.73 1.68 1.54 8,263 0 1.5 1.2 0 [01/06, 08] [01/06, 07] [01/06, 06] [01/06, 09] [01/06, 13] Botanical Garden (Harding Lab/Pfizer Lab) 7094-10 8,706 94 0 1.86 1.76 1.73 8,754 0 1.1 1 0 [05/26, 08] [03/16, 07] [10/13 ,07] [01/07, 22] [03/09, 13]
Queens College 2 7096-15 8,423 96 0 1.59 1.53 1.46
8,343 0 1.2 1.4
0 [01/07, 20] [01/07, 08] [01/07, 19] [03/10, 08] [11/03, 07]

(Annual Means in parentheses are based on less than 75% available data) [Date of Occurrence, Hour] *Federal Ambient Air Quality Standard + Denotes a contravention of Federal AAQS
NYSDEC Region 2
OZONE - Continuous UV Light Absorption(Bronx, Brooklyn, and Staten Island Sites)
Comparison Between NYS Ambient Air Quality and Ambient Air Quality Standards for Calendar Year 2016
8-hr Running Average Begin Hour 4th Highest Daily Maximum 8-Hour Average-
Observations Daily Highest Values, PPM
Not to exceed an avg of 0.075 ppm during the last 3 years, changed to 0.070 ppm beginning
1/1/2016*
Total % Days
>.070
Station Site No. Obs. Avail PPM 1st 2nd 3rd 4th 2014 2015 2016 Avg.
Botanical Garden (Harding Lab/Pfizer Lab) 7094-10 6,179 99 3 0.079 0.072 0.071 0.07 0.070 0.072 0.070 0.070
[05/25] [07/22] [05/26] [07/06] [06/17] [08/17] [07/06]
IS 52 7094-07 6,122 99 3 0.082 0.073 0.071 0.069 0.071 0.063 0.069
0.068 [05/25] [07/17] [07/17] [05/26] [08/05] [07/29] [05/26]
Susan Wagner (Seasonal) 7097-01 4,458 97 10
0.086 0.081 0.078 0.077 0.072 0.079 0.077 0.076
[05/25] [07/22] [05/26] [07/21] [06/02] [07/28] [07/21]

(Annual Means in parentheses are based on less than 75% available data) *Federal Ambient Air Quality Standard
NYSDEC Region 2
OZONE - Continuous UV Light Absorption(Manhattan and Queens Sites)
Comparison Between NYS Ambient Air Quality and Ambient Air Quality Standards for Calendar Year 2016
8-hr Running Average Begin Hour 4th Highest Daily Maximum 8-Hour Average-
Observations Daily Highest Values, PPM Not to exceed an avg of 0.075 ppm during the last 3 years, changed to 0.070 ppm beginning 1/1/2016*
Total % Days
>.070
Station Site No. Obs. Avail PPM 1st 2nd 3rd 4th 2014 2015 2016 Avg.
CCNY 7093-25 6,080 99 4 0.078 0.072 0.071 0.071 0.065 0.071 0.071
0.069 [05/2] [07/22] [05/26] [07/06] [07/08] [07/29] [07/06]
Queens College 2 7096-15 6,080 98 6 0.083 0.082 0.075 0.071 0.063 0.073 0.071
0.069 [05/25] [07/22] [07/15] [05/26] [07/08] [08/16] [05/26]

(Annual Means in parentheses are based on less than 75% available data) *Federal Ambient Air Quality Standard
NYSDEC Region 2
NITROGEN DIOXIDE - Continuous Chemiluminescence
Annual Averages 2006 through 2016 Annual Arithmetic Mean (PPB) - Primary Standard
(12 month average not to exceed 53 PPB *)
Station Site No. 2006 2007 2008 2009 2010 2011 2012 2013 2014 2015 2016
Botanical Garden 7094-10/ 24.82 24.55 22.91 21.85 20.1 20.86 18.6 18.37 17.2 17.16 15.59 (Harding Lab/Pfizer Lab) 7094-06 IS 52 7094-07 26.46 25.65 25.18 24.57 (24.94) xx (20.8) 20.67 19.88 20.13 18.27
Queens College 2 7096-15 23.46 22.94 22.51 20.91 19.28 (21.62) 17.5 17.5 16.75 17.16 15.81
Sampling was terminated at 7093-10 on 06/30/08. Sampling was suspended at 7094-07 on 06/24/10 due to building construction, and resumed on 08/10/13.
Comparison Between NYS Ambient Air Quality and Ambient Air Quality Standards for Calendar Year 2016
One-Hour Averages - average of 98th percentile for last 3 years not to exceed 75 PPB *
Observations 98th Percentile, PPB Highest Values, PPB
%
2014 2015 2016
3-yr
avg. 1st 2nd 3rd Station Site No. Total Avail
Botanical Garden (Harding Lab/Pfizer Lab)
7094-10/ 7094-06 8,643 98 56.2 60.7 55.8 57.6
89.4 80.2 79.5 [03/09, 12] [03/09, 19] [03/09, 20]
IS 52 7094-07 8,593 98 64.9 67.6 60.1 64.3
75.9 73.5 71.5 [03/09, 19] [03/09, 20] [03/09, 10]
Queens College 2 7096-15 8,320 95 58.5 63.4 57.1 64.3
69.8 68.5 66.0 [03/10, 19] [01/07, 20] [01/07, 19]

(Annual Means in parentheses are based on less than 75% available data) *Federal Ambient Air Quality Standard
NYSDEC Region 2
LEAD –PM10 Samplers
Comparison Between NYS Ambient Air Quality and Ambient Air Quality Standards for Calendar Year 2016
24-Hour Concentrations - µg/m3
THREE MONTH ROLLING
AVERAGES
Maximum not to exceed 0.15 µg/m3, effective beginning 1/1/13*
Maximum 2nd Max. 3rd Max. Highest Values, µg/m3
Total %
Station Site No. Obs. Avail Value Date Value Date Value Date 2014 2015 2016
IS 52 7094-07 56 92 0.0161 25-Jan 0.0134 7-Jan 0.0082 23-Jun 0.004 0.0061 0.0047

!.
!.
!.
!.!.
!.!. !.Newburgh
Millbrook
Mt. NinhamBallard Road
White Plains
Valley Central
Rockland County
Wakefern Food (President Container)
0 10 20 30 405Miles
±Region 3

(Annual Means in parentheses are based on less than 75% available data) *Federal Ambient Air Quality Standard
NYSDEC Region 3
SULFUR DIOXIDE - Continuous Pulsed Fluorescence
Annual Averages 2006 through 2016Annual Arithmetic Mean (ppb) - Primary Standard
(12 month average not to exceed 30 PPB *)
Station Site No. 2006 2007 2008 2009 2010 2011 2012 2013 2014 2015 2016
Mt. Ninham 3951-01 1.67 1.53 1.33 1.14 0.8 0.86 0.73 0.72 0.63 0.59 0.23
Millbrook 1328-01 xx xx xx xx xx (0.97) 1.42 2.45 0.65 0.81 0.18
Belleayre Mtn. 5565-03 1.25 1.19 0.9 0.71 0.5 0.52 0.31 xx xx xx xx
Sampling was suspended at 5565-03 in 2013
Comparison Between NYS Ambient Air Quality and Ambient Air Quality Standards for Calendar Year 2016
One Hour Averages average of 99th percentile for last 3 years not to
exceed 75 PPB *
Observations 99th Percentile, PPB
Station Site No. Total %
2014 2015 2016 3-yr
Obs. Avail Avg.
Mt. Ninham 3951-01 8,263 94 5.9 5.8 2.4 4.70
Millbrook 1328-01 8,552 97 (13.7) 4.5 2.5 xx

(Annual Means in parentheses are based on less than 75% available data) *Federal Ambient Air Quality Standard
NYSDEC Region 3
INHALABLE PARTICULATES (PM2.5) - Rupprecht & Patashnick Sampler
Comparison Between NYS Ambient Air Quality and Ambient Air Quality Standards for Calendar Year 2016 (Average of last 3 years= annual means not to exceed 12 µg/m3 *;
and average of 98th percentile for last 3 years not to exceed 35 µg/m3 *, changed from 65 m3g/m3 on 12/17/06)
Site No.
Maximum Values, µg/m3 98th Percentile, µg/m3 Quarterly Averages,
2016 Annual Mean, µg/m3
Total 1st 2nd 3rd 2014 2015 2016
3-yr1st 2nd 3rd 4th 2014 2015 2016
3-yr
Station Obs. Avg. Avg.
Newburgh (F) 3502-04 121 18.9 13.3 13.1 19.3 20 13 17.5 5.3 5.9 6.5 6.6 7.2 7.4 6.1 6.9 [05/27] [10/18] [12/14]
Newburgh (C) 3502-04 364 22.5 20.1 19 15.1 17 15 15.8 6.9 5 4.7 5.5 6.5 6.9 5.5 6.3 [07/22] [05/27] [04/22]
Rockland Co. (C) 4353-02 346 21.6 20.5 19.6
16.4 19.5 15 17.1 7.6 5.6 4.9 5.7 6.6 7.3 6 6.6 [05/27] [04/22] [05/26]
White Plains (C) 5902-04 359 20.1 19.6 19.3
16.2 18.3 16 16.8 8.1 5.5 5.4 6.1 7.4 7.7 6.3 7.1 [05/27] [04/22] [05/26] (F) = Federal Reference Method(C) = Continuous, used for Air Quality Index (AQI) calculations

(Annual Means in parentheses are based on less than 75% available data) *Federal Ambient Air Quality Standard
NYSDEC Region 3
OZONE - Continuous UV Light Absorption
Comparison Between NYS Ambient Air Quality and Ambient Air Quality Standards for Calendar Year 2016
8-hr Running Average Begin Hour 4th Highest Daily Maximum 8-Hour Average-
Observations Daily Highest Values, PPM Not to exceed an avg of 0.075 ppm during the last 3 years, changed to 0.070 ppm beginning 1/1/2016*
Total % Days
>.070
Station Site No. Obs. Avail PPM 1st 2nd 3rd 4th 2014 2015 2016 Avg.
Valley Central 3527-01 6,030 98 1 0.074 0.068 0.066 0.064 0.06 0.072 0.064 0.065 [05/25] [05/26] [09/10] [06/02] [07/12] [09/18] [06/02]
Rockland County 4353-02 6,156 99 4 0.081 0.078 0.076 0.073 0.068 0.077 0.073 0.073 [05/26] [05/25] [06/20] [08/09] [08/27] [09/18] [08/09]
White Plains 5902-04 6,216 99 6 0.082 0.08 0.076 0.075 0.074 0.073 0.075 0.074 [05/25] [05/26] [07/22] [06/26] [05/27] [09/02] [06/26]
Millbrook 1328-01 5,980 96 5 0.077 0.076 0.073 0.071 0.068 0.067 0.071 0.069 [05/27] [05/26] [06/20] [05/25] [08/20] [06/20] [05/25]
Mt. Ninham 3951-01 6,070 99 5 0.088 0.079 0.078 0.071 0.066 0.069 0.071
0.069 [05/26] [05/25] [06/26] [06/20] [08/20] [06/26] [06/20]

(Annual Means in parentheses are based on less than 75% available data) *Federal Ambient Air Quality Standard
NYSDEC Region 3
LEAD - High Volume Air Samplers (Glass Fiber Filters)
Comparison Between NYS Ambient Air Quality and Ambient Air Quality Standards for Calendar Year 2016
24-Hour Concentrations - µg/m3
THREE MONTH ROLLING
AVERAGES
Maximum not to exceed 0.15 µg/m3, effective beginning 1/1/13*
Maximum 2nd Max. 3rd Max. Highest Values, µg/m3
Total %
Station Site No. Obs. Avail Value Date Value Date Value Date 2014 2015 2016
Wallkill 3566-02 58 95 0.103 6-May 0.051 7-Jan 0.035 12-May 0.02 0.01 0.022
Wallkill 3566-02 57 93 0.106 6-May 0.061 7-Jan 0.038 12-May 0.02 0.02 0.022
Scotchtown 3566-09 59 97 0.117 19-Jan 0.113 12-Apr 0.093 18-Feb 0.003 0.003 0.032

!.!.!.
AlbanyLoudonville
South Albany
0 10 20 30 405Miles
±Region 4

(Annual Means in parentheses are based on less than 75% available data) *Federal Ambient Air Quality Standard
NYSDEC Region 4
SULFUR DIOXIDE - Continuous Pulsed FluorescenceAnnual Averages 2006 through 2016
Annual Arithmetic Mean (ppb) - Primary Standard (12 month average not to exceed 30 PPB *)
Station Site No. 2006 2007 2008 2009 2010 2011 2012 2013 2014 2015 2016
Loudonville 0101-33 5.07 2.97 3.61 3.85 2.33 1.92 0.97 2.03 1.6 1.3 0.36
Schenectady 4601-05 5.35 2.33 3.42 2.63 1.92 (2.18) xx xx xx xx xx
Grafton State Park 4153-04 1.37 1.58 1.77 1.52 1.12 1.13 (0.76) xx xx xx xx
Sampling at 4601-05 and 4153-04 was terminated on 06/30/11 and 12/31/12, respectively.
Comparison Between NYS Ambient Air Quality and Ambient Air Quality Standards for Calendar Year 2016
One Hour Averages
average of 99th percentile for last 3 years not to exceed 75 PPB *
Observations 99th Percentile, PPB
Station Site No. Total %
2014 2015 2016 3-yr
Obs. Avail Avg.
Loudonville 0101-33 8,577 98 7.7 7 4.2 6.30

(Annual Means in parentheses are based on less than 75% available data) *Federal Ambient Air Quality Standard
NYSDEC Region 4
INHALABLE PARTICULATES (PM2.5) - Rupprecht & Patashnick Sampler
Comparison Between NYS Ambient Air Quality and Ambient Air Quality Standards for Calendar Year
2016 (Average of last 3 years annual means not to exceed 12 µg/m3 * and average of 98th percentile for last 3 years not to exceed 35 µg/m3 *, changed from 65 m3g/m3 on 12/17/06)
Site No.
Maximum Values, µg/m3 98th Percentile, µg/m3 Quarterly Averages,
2016 Annual Mean, µg/m3
Total 1st 2nd 3rd 2014 2015 2016
3-yr1st 2nd 3rd 4th 2014 2015 2016
3-yr
Station Obs. Avg. Avg.
Albany Co. HD (F) 0101-13 121 22.6 18.1 17.9 19.4 20.1 18 19.1 6.2 5.6 6.7 6.4 7.3 7.8 6.2 7.1 [01/07] [03/07] [07/08]
Albany Co. HD (C) 0101-13 354 21.1 20.4 19.7 15.6 18.1 17 16.9 7.1 5.7 5.6 6.4 6.8 7 6.2 6.7 [05/26] [01/07] [05/27]
Loudonville (F) 0101-33 115 20.0 17.5 16.2
15.8 18 16 16.7 5.5 5.5 5.9 5.7 (6.5) 6.9 5.6 2.0 [01/07] [05/27] [06/20]
(F) = Federal Reference Method(C) = Continuous, used for Air Quality Index (AQI) calculations

(Annual Means in parentheses are based on less than 75% available data) *Federal Ambient Air Quality Standard
NYSDEC Region 4
CARBON MONOXIDE - Continuous Gas Filter Correlation
Comparison Between NYS Ambient Air Quality and Ambient Air Quality Standards for Calendar Year 2016
One-Hour Average Running 8-Hour Average (Non-Overlapping)
Maximum not to exceed 35 PPM more than once per calendar year * Maximum not to exceed 9 PPM more than once per calendar year *
Observations Highest Values, PPM Observations Highest Values, PPM
Total % >35
1st 2nd 3rd
>9 Days>
Station Site No. Obs. Avail PPM Total PPM 1st 2nd 9PPM
Loudonville 0101-33 8,408 96 0 1.4 1.4 1.2
8,406 0 1.1 0.8
0 [01/07, 05] [01/07, 06] [01/07, 07] [01/07, 09] [01/07, 06]

(Annual Means in parentheses are based on less than 75% available data) *Federal Ambient Air Quality Standard
NYSDEC Region 4
OZONE - Continuous UV Light Absorption
Comparison Between NYS Ambient Air Quality and Ambient Air Quality Standards for Calendar Year 2016
8-hr Running Average Begin Hour 4th Highest Daily Maximum 8-Hour Average-
Observations Daily Highest Values, PPM Not to exceed an avg of 0.075 ppm during the last 3 years, changed to 0.070 ppm beginning 1/1/2016*
Total % Days
>.070
Station Site No. Obs. Avail PPM 1st 2nd 3rd 4th 2014 2015 2016 Avg.
Loudonville 0101-33 6,119 99 2 0.076 0.075 0.069 0.068 0.061 0.063 0.068
0.065 [05/25] [06/25] [05/12] [05/27] [05/26] [05/25] [05/27]

(Annual Means in parentheses are based on less than 75% available data) *Federal Ambient Air Quality Standard
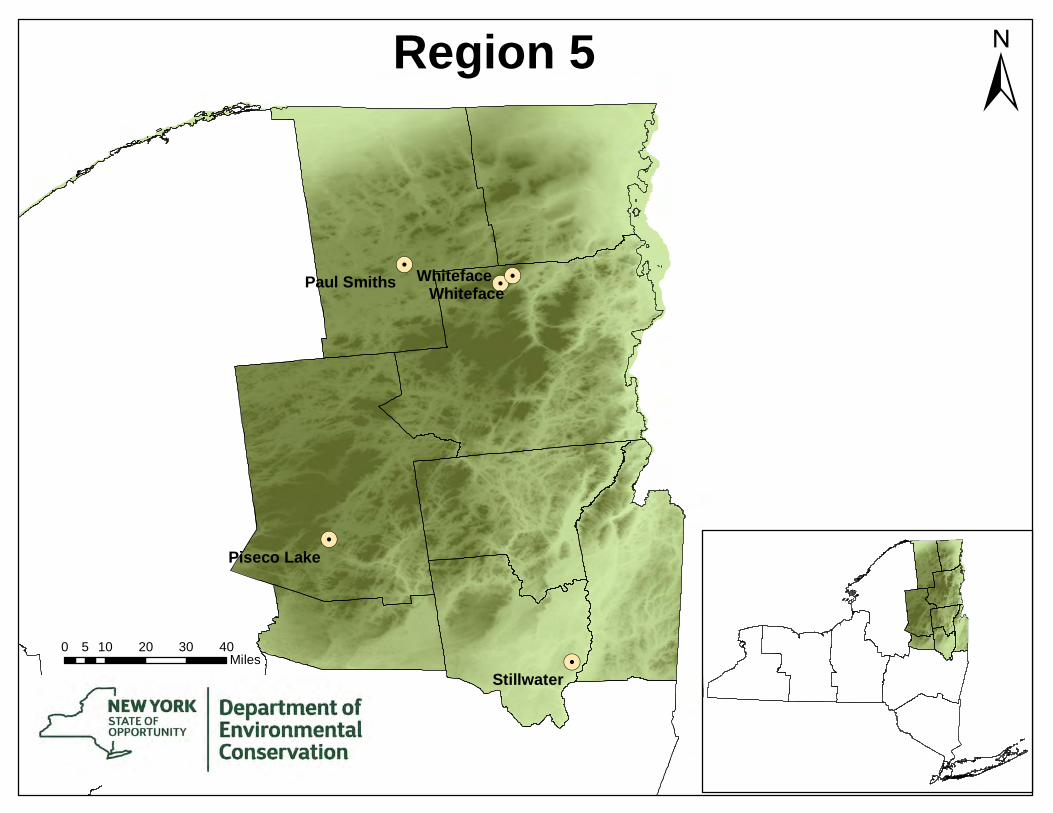
NYSDEC Region 5
SULFUR DIOXIDE - Continuous Pulsed Fluorescence
Annual Averages 2006 through 2016Annual Arithmetic Mean (ppb) - Primary Standard
(12 month average not to exceed 30 PPB *)
Station Site No. 2006 2007 2008 2009 2010 2011 2012 2013 2014 2015 2016
Whiteface Mtn. - Lodge 1567-04 0.98 0.91 0.82 0.64 0.72 0.73 0.61 0.36 0.38 0.47 0.26
Paul Smiths College 1655-01 0.89 0.96 0.75 0.6 0.57 0.67 0.5 (0.52) 0.6 0.32 0.20
Piseco Lake 2050-01 0.62 0.65 0.56 0.44 0.34 0.32 0.14 0.17 0.21 0.16 0.05
Comparison Between NYS Ambient Air Quality and Ambient Air Quality Standards for Calendar Year 2016
One Hour Averages
average of 99th percentile for last 3 years not to exceed 75 PPB *
Observations 99th Percentile, PPB
Station Site No. Total %
2014 2015 2016 3-yr
Obs. Avail Avg.
Whiteface Mtn. - Lodge 1567-04 8,297 94 3.9 3.6 3.1 3.53
Paul Smiths College 1655-01 8,624 97 3.7 3.2 1.9 2.93
Piseco Lake 2050-01 8,043 92 4.7 3.2 1.5 3.13
!.!.
!.
!.
!.
WhitefaceWhiteface
Stillwater
Paul Smiths
Piseco Lake
0 10 20 30 405Miles
±Region 5

(Annual Means in parentheses are based on less than 75% available data) *Federal Ambient Air Quality Standard
NYSDEC Region 5
INHALABLE PARTICULATES (PM2.5) - Rupprecht & Patashnick Sampler
Comparison Between NYS Ambient Air Quality and Ambient Air Quality Standards for Calendar Year 2016 (Average of last 3 years= annual means not to exceed 12 µg/m3 *;
and average of 98th percentile for last 3 years not to exceed 35 µg/m3 *, changed from 65 µg/m3 on 12/17/06)
Site No.
Maximum Values, µg/m3 98th Percentile, µg/m3 Quarterly Averages,
2016 Annual Mean, µg/m3
Total
1st 2nd 3rd 2014 2015 2016
3-yr
1st 2nd 3rd 4th 2014 2015 2016
3-yr
Station Obs. Avg. Avg.
Whiteface Base (F) 1567-04 59 10.8 10 9.7
10.5 11.7 10 10.7 3.1 3.5 4.5 3 3.5 4.4 3.5 3.8 [11/02] [08/28] [05/24]
Whiteface Base (C) 1567-04 341 12.3 12 11.6
16.3 9.7 10.0 12.0 -- 4.9 3.8 2.9 (4.3) 4.1 3.3 xx [11/02] [08/11] [07/13]
(F) = Federal Reference Method(C) = Continuous, used for Air Quality Index (AQI) calculations

(Annual Means in parentheses are based on less than 75% available data) *Federal Ambient Air Quality Standard
NYSDEC Region 6
SULFUR DIOXIDE - Continuous Pulsed Fluorescence
Annual Averages 2006 through 2016Annual Arithmetic Mean (ppb) - Primary Standard
(12-month average not to exceed 30 PPB *)
Station Site No. 2006 2007 2008 2009 2010 2011 2012 2013 2014 2015 2016
Nick’s Lake 2167-03 0.89 0.9 0.63 0.52 0.54 0.48 0.65 0.6 0.67 0.52 0.2
Comparison Between NYS Ambient Air Quality and Ambient Air Quality Standards for Calendar Year 2016
One Hour Averages average of 99th percentile for last 3 years not to exceed 75 PPB *
Observations 99th Percentile, PPB
Station Site No. Total %
2014 2015 2016 3-yr
Obs. Avail Avg.
Nick’s Lake 2167-03 8,248 94 4.6 3.9 2.5 3.67

(Annual Means in parentheses are based on less than 75% available data) *Federal Ambient Air Quality Standard
NYSDEC Region 5
OZONE - Continuous UV Light Absorption
Comparison Between NYS Ambient Air Quality and Ambient Air Quality Standards for Calendar Year 2016
8-hr Running Average Begin Hour 4th Highest Daily Maximum 8-Hour Average-
Observations Daily Highest Values, PPM Not to exceed an avg of 0.075 ppm during the last 3 years, changed to 0.070 ppm beginning 1/1/2016*
Total % Days
>.070
Station Site No. Obs. Avail PPM 1st 2nd 3rd 4th 2014 2015 2016 Avg.
Stillwater 4567-01 5,507 98 0 0.070 0.070 0.070 0.067 0.061 0.061 0.067 0.063 [05/24] [05/25] [05/26] [06/20] [05/27] [09/18] [06/20]
Whiteface Mtn. Summit 1567-03 5,507 93 0 0.070 0.07 0.070 0.067 0.061 0.061 0.067 0.063 [05/26] [05/27] [08/10] [05/23] [05/12] [05/31] [05/23]
Whiteface Mtn. Base 1567-04 5,901 97 2 0.074 0.071 0.069 0.068 0.06 0.067 0.068 0.065 [05/25] [08/10] [05/24] [06/19] [04/13] [05/24] [06/19]
Piseco Lake 2050-01 5,519 93 2 0.074 0.071 0.063 0.061 0.058 0.062 0.061 0.060 [05/25] [05/26] [04/21] [04/18] [04/10] [05/24] [04/18]

!.
!.
!.
!.!.
Utica
Alcoa EastAlcoa West
Perch River
Nick's Lake
0 10 20 30 405Miles
±Region 6

(Annual Means in parentheses are based on less than 75% available data) *Federal Ambient Air Quality Standard
NYSDEC Region 6
INHALABLE PARTICULATES (PM2.5) - Rupprecht & Patashnick Sampler
Comparison Between NYS Ambient Air Quality and Ambient Air Quality Standards for Calendar Year 2016 (Average of last 3 years= annual means not to exceed 12 µg/m3 *;
and average of 98th percentile for last 3 years not to exceed 35 µg/m3 *, changed from 65 µg/m3 on 12/17/06)
Maximum Values, µg/m3 98th Percentile, µg/m3 Quarterly Averages, 2016 Annual Mean, µg/m3
Total
1st 2nd 3rd 2014 2015 2016
3-yr
1st 2nd 3rd 4th 2014 2015 2016
3-yr
Station Site No. Obs. Avg. Avg.
Utica (C) 3202-01 362 17.2 17.1 16.0
19 17.8 17 18.2 8.1 5 4.4 6.1 6.7 7.1 5.9 6.5 [03/08] [06/28] [05/25]
(F) = Federal Reference Method(C) = Continuous, used for Air Quality Index (AQI) calculations

(Annual Means in parentheses are based on less than 75% available data) *Federal Ambient Air Quality Standard
NYSDEC Region 6
OZONE - Continuous UV Light Absorption
Comparison Between NYS Ambient Air Quality and Ambient Air Quality Standards for Calendar Year 2016
8-hr Running Average Begin Hour 4th Highest Daily Maximum 8-Hour Average-
Observations Daily Highest Values, PPM Not to exceed an avg of 0.075 ppm during the last 3 years, changed to 0.070 ppm beginning 1/1/2016*
Total % Days
>.070
Station Site No. Obs. Avail PPM 1st 2nd 3rd 4th 2014 2015 2016 Avg.
Nick’s Lake 2167-03 6,009 98 4 0.073 0.073 0.071 0.071 0.057 0.061 0.071 0.063 [04/25] [05/25] [04/26] [05/26] [04/10] [05/09] [05/26]
Perch River 2223-01 5,460 92 2 0.077 0.071 0.07 0.067 0.059 0.065 0.067
0.064 [05/25] [05/24] [05/26] [06/20] [07/22] [05/09] [06/20]

!.
!.
!.Fulton
Cayuga East
E. Syracuse
0 10 20 30 405Miles
±Region 7

(Annual Means in parentheses are based on less than 75% available data) *Federal Ambient Air Quality Standard
NYSDEC Region 7
SULFUR DIOXIDE - Continuous Pulsed Fluorescence
Annual Averages 2006 through 2016Annual Arithmetic Mean (ppb) - Primary Standard
(12 month average not to exceed 30 PPB *)
Station Site No. 2006 2007 2008 2009 2010 2011 2012 2013 2014 2015 2016
Camp Georgetown 2655-01 2.06 1.85 1.79 1.17 1.09 0.52 xx xx xx xx xx
East Syracuse 3353-09 2.23 2.11 2.06 1.23 0.92 0.88 0.88 0.61 0.70 0.60 0.40 Sampling at 2655-01 was suspended on 04/02/2012
Comparison Between NYS Ambient Air Quality and Ambient Air Quality Standards for Calendar Year 2016
One Hour Averages
average of 99th percentile for last 3 years not to exceed 75 PPB *
Observations 99th Percentile, PPB
Station Site No. Total %
2014 2015 2016 3-yr
Obs. Avail Avg.
East Syracuse 3353-09 8,640 98 5.1 4.4 2.9 4.13

(Annual Means in parentheses are based on less than 75% available data) *Federal Ambient Air Quality Standard
NYSDEC Region 7
INHALABLE PARTICULATES (PM2.5) - Rupprecht & Patashnick Sampler
Comparison Between NYS Ambient Air Quality and Ambient Air Quality Standards for Calendar Year 2016 (Average of last 3 years= annual means not to exceed 12 µg/m3*;
and average of 98th percentile for last 3 years not to exceed 35 µg/m3*, changed from 65 µg/m3 on 12/17/06)
Maximum Values, µg/m3 98th Percentile, µg/m3 Quarterly Averages,
2016 Annual Mean, µg/m3
Total 1st 2nd 3rd 2014 2015 2016
3-yr1st 2nd 3rd 4th 2014 2015 2016
3-yr
Station Site No. Obs. Avg. Avg.
East Syracuse (C) 3353-09 345 15.3 15.0 14.8
16 17.5 13 15.4 4.5 5.5 5.5 5 6.6 6.8 5.1 6.0 [11/16] [05/26] [12/22]
East Syracuse (F) 3353-09 116 12.0 11.3 10.8
16.2 16 11 14.3 4.7 5.4 6 5.1 6.4 6.4 5.3 6.1 [05/27] [06/20] [06/26]
(F) = Federal Reference Method(C) = Continuous, used for Air Quality Index (AQI) calculations

(Annual Means in parentheses are based on less than 75% available data) *Federal Ambient Air Quality Standard
NYSDEC Region 7
OZONE - Continuous UV Light Absorption
Comparison Between NYS Ambient Air Quality and Ambient Air Quality Standards for Calendar Year 2016
8-hr Running Average Begin Hour 4th Highest Daily Maximum 8-Hour Average-
Observations Daily Highest Values, PPM
Not to exceed an avg of 0.075 ppm during the last 3 years, changed to 0.070 ppm beginning
1/1/2016*
Total % Days
>.070
Station Site No. Obs. Avail PPM 1st 2nd 3rd 4th 2014 2015 2016 Avg.
East Syracuse 3353-09 6,085 98 2 0.077 0.072 0.067 0.067 0.063 0.063 0.067
0.064 [05/25] [05/26] [05/24] [08/11] [05/12] [05/03] [08/11]
Fulton/Granby 3754-01 4,683 97 1 0.071 0.070 0.069 0.061 0.058 0.063 0.061
0.061 [05/25] [05/26] [05/24] [06/20] [06/02] [05/24] [06/20]

!.
!.!.
!.
!.
!.
Williamson
Cayuga West
Rochester Pri 2
Pinnacle State Park
Rochester Near-Road
0 10 20 30 405Miles
±Region 8

(Annual Means in parentheses are based on less than 75% available data) *Federal Ambient Air Quality Standard
NYSDEC Region 8
SULFUR DIOXIDE - Continuous Pulsed Fluorescence
Annual Averages 2006 through 2016Annual Arithmetic Mean (ppb) - Primary Standard
(12 month average not to exceed 30 PPB *)
Station Site No. 2006 2007 2008 2009 2010 2011 2012 2013 2014 2015 2016
Elmira 0701-05 3.12 3.29 2.8 2.01 2.08 1.65 1.48 xx xx xx xx
Rochester 2701-22 4.18 4.06 2.91 2.54 2.19 (1.15) 0.99 0.91 0.96 0.79 0.68
Pinnacle 5001-04 -- 1.73 1.67 1.04 0.63 0.71 0.39 0.39 0.45 0.33 0.21 Sampling was suspended at 0701-05 in 2013
Comparison Between NYS Ambient Air Quality and Ambient Air Quality Standards for Calendar Year 2016
One Hour Averages average of 99th percentile for last 3 years not to exceed 75 PPB *
Observations 99th Percentile, PPB
Station Site No. Total %
2014 2015 2016 3-yr
Obs. Avail Avg.
Rochester 2701-22 8,429 96 20.5 17.6 27 21.7
Pinnacle 5001-04 8,459 96 10.1 9.3 4.7 8.03

(Annual Means in parentheses are based on less than 75% available data) *Federal Ambient Air Quality Standard
NYSDEC Region 8
INHALABLE PARTICULATES (PM10) - R&P Model 2025 Sampler
Comparison Between NYS Ambient Air Quality and Ambient Air Quality Standards for Calendar Year 2016
24-Hour Concentrations - µg/m3# of Days > 150 µg/m3 -
Not to exceed an expected avg of one per year during the last 3 years *
Maximum 2nd Max. 3rd Max. 2014 2015 2016
Total Exp.
Station Site No. Obs. Value Date Value Date Value Date Mea Est Mea Est Mea Est Avg.
Rochester (R&P) 2701-22 55 33 7-Jan 28 24-May 25 7-Mar 0 0 0 0 0 0 0

(Annual Means in parentheses are based on less than 75% available data) *Federal Ambient Air Quality Standard
NYSDEC Region 8
INHALABLE PARTICULATES (PM2.5) - Rupprecht & Patashnick Sampler
Comparison Between NYS Ambient Air Quality and Ambient Air Quality Standards for Calendar Year 2016 (Average of last 3 years= annual means not to exceed 12 µg/m3 *;
and average of 98th percentile for last 3 years not to exceed 35 µg/m3 *, changed from 65 µg/m3 on 12/17/06)
Maximum Values, µg/m3 98th Percentile, µg/m3 Quarterly Averages,
2016 Annual Mean, µg/m3
Total 1st 2nd 3rd 2014 2015 2016
3-yr1st 2nd 3rd 4th 2014 2015 2016
3-yr
Station Site No. Obs. Avg Avg.
Rochester 2 (F) 2701-22 113 15.4 13.5 13.1
18 16.8 13.1 16.0 5.8 6 6.6 5.6 7.3 7.3 6 6.8 [05/27] [03/07] [01/07]
Rochester 2 (C) 2701-22 332 19.7 19.4 16.8
19.4 13.9 15.1 16.1 7.0 5.9 5.9 5.5 (7) (7) 6.1 7.0 [01/08] [01/15] [01/07]
Rochester Near Road (C) 2701-23 116 20.2 19.2 19.2
xx (10.3) 16 xx 8.1 6 6.7 9.1 (6.4) (6.4) 7.5 xx [01/07] [10/16] [01/08]
Rochester Near Road (F) 2701-23 116 15.1 14.5 14.5
xx 21.1 14.5 xx 6.5 6 6.5 5.8 xx 8 6.3 xx [01/07] [03/07] [05/27]
Pinnacle (F) 5001-04 116 13.7 12.5 11.3
14.8 14.6 11.3 13.6 4.5 5.4 5.3 4.5 (5.7) 7.5 4.9 6.2 [03/07] [06/20] [06/26]
Pinnacle (C) 5001-04 182 11.0 10.6 10.1
14.6 14.9 9.8 13.1 -- 4.9 3.9 2.9 7.5 5.7 3.9 5.7 [11/02] [08/11] [07/31]
(F) = Federal Reference Method(C) = Continuous, used for Air Quality Index (AQI) calculations

(Annual Means in parentheses are based on less than 75% available data) *Federal Ambient Air Quality Standard
NYSDEC Region 8
CARBON MONOXIDE - Continuous Gas Filter Correlation
Comparison Between NYS Ambient Air Quality and Ambient Air Quality Standards for Calendar Year 2016
One-Hour Average Running 8-Hour Average (Non-Overlapping)
Maximum not to exceed 35 PPM more than once per calendar year * Maximum not to exceed 9 PPM more than once per calendar year *
Observations Highest Values, PPM Observations Highest Values, PPM
Total % >35 >9 Days>
Station Site No. Obs. Avail PPM 1st 2nd 3rd Total PPM 1st 2nd 9PPM
Rochester 2 2701-22 8,589 98 0 1.25 1.05 1.04 8,553 0 0.9 0.7 0 [01/06,08] [01/06,07] [01/08,07] [01/06,23] [01/07,05]
Rochester Near-Road 2701-23 8,571 98 0 1.5 1.5 1.1
8548 0 0.7 0.7
0 [07/13,10] [07/13,11] [11/14,18] [01/06,22] [11/14,19]
Pinnacle 5001-04 7,927 90 0 0.32 0.28 0.27
7,894 0 0.3 0.3
0 [04/01,10] [02/19,07] [02/19,19] [02/19,12] [02/19,20]

(Annual Means in parentheses are based on less than 75% available data) *Federal Ambient Air Quality Standard
NYSDEC Region 8
OZONE - Continuous UV Light Absorption
Comparison Between NYS Ambient Air Quality and Ambient Air Quality Standards for Calendar Year 2016
8-hr Running Average Begin Hour 4th Highest Daily Maximum 8-Hour Average-
Observations Daily Highest Values, PPM Not to exceed an avg of 0.075 ppm during the last 3 years, changed to 0.070 ppm beginning 1/1/2016*
Total % Days
>.070
Station Site No. Obs. Avail PPM 1st 2nd 3rd 4th 2014 2015 2016 Avg.
Rochester 2 2701-22 6,126 99 2 0.077 0.074 0.069 0.067 0.058 0.065 0.067
0.063 [05/25] [05/24] [06/19] [06/11] [07/12] [09/16] [06/11]
Pinnacle 5001-04 5,935 99 4 0.085 0.076 0.073 0.073 0.058 0.059 0.073
0.063 [05/25] [07/15] [05/26] [06/21] [05/09] [04/13] [06/21]
Williamson (Seasonal) 5863-01 5,940 99 2
0.081 0.076 0.067 0.067 0.064 0.061 0.067 0.064
[05/25] [05/24] [07/05] [07/06] [05/27] [05/08] [07/06]

(Annual Means in parentheses are based on less than 75% available data) *Federal Ambient Air Quality Standard
NYSDEC Region 8
NITROGEN DIOXIDE - Continuous ChemiluminescenceAnnual Averages 2006 through 2016
Annual Arithmetic Mean (PPB) - Primary Standard (12 month average not to exceed 53 PPB *)
Station Site No. 2006 2007 2008 2009 2010 2011 2012 2013 2014 2015 2016
Rochester Near-Road 2701-23 xx xx xx xx xx xx xx xx (9.95) 10.09 9.72
Comparison Between NYS Ambient Air Quality and Ambient Air Quality Standards for Calendar Year 2016
One-Hour Averages - average of 98th percentile for last 3 years not to exceed 75 PPB *
Observations 98th Percentile, PPB Highest Values, PPB
% 2014 2015 2016
3-yr
avg.1st 2nd 3rd
Station Site No. Total Avail
Rochester Near-Road 2701-23 8,305 95 (40.1) 45.1 40.6 xx 45.2 44.6 43.1
[11/14:17] [11/14:18] [11/14:19]

(Annual Means in parentheses are based on less than 75% available data) *Federal Ambient Air Quality Standard
NYSDEC Region 8
LEAD –PM10 Samplers
Comparison Between NYS Ambient Air Quality and Ambient Air Quality Standards for Calendar Year 2016
24-Hour Concentrations - µg/m3
THREE MONTH ROLLING AVERAGES
Maximum not to exceed 0.15 µg/m3, effective beginning 1/1/13 * (the old standard of 1.5 µg/m3
will remain in force until that date) Maximum 2nd Max. 3rd Max. Highest Values, µg/m3
Total %
Station Site No. Obs. Avail Value Date Value Date Value Date 2014 2015 2016
Rochester (PM10) 2701-22 62 100 0.009 24-May 0.005 7-Jan 0.005 3-Sep 0.003 0.002 0.0052

!.!.
!.
!.
!.
!.!.
!.!.
Buffalo
Dunkirk
AmherstTonawanda
MiddleportNiagara Falls
Brookside Ter WBuffalo Near-Road
0 10 20 30 405Miles
±Region 9

(Annual Means in parentheses are based on less than 75% available data) *Federal Ambient Air Quality Standard
NYSDEC Region 9
SULFUR DIOXIDE - Continuous Pulsed Fluorescence
Annual Averages 2006 through 2016Annual Arithmetic Mean (ppb) - Primary Standard
(12 month average not to exceed 30 PPB *)
Station Site No. 2006 2007 2008 2009 2010 2011 2012 2013 2014 2015 2016
Buffalo 1401-18 2.78 2.7 2.34 1.74 1.5 2.01 2.72 (2.4) 1.49 1.02 0.49
Tonawanda 1472-04 3.93 4.29 xx xx xx xx xx xx xx xx xx
Brookside Terrace 1472-14 xx (2.8) 2.83 2.1 1.83 3.43 2.11 2.82 (1.52) 1.04 0.77
Dunkirk 0601-04 3.13 3.27 2.68 2.55 1.54 1.72 1.3 1.03 1.5 1.28 0.41
Westfield 0675-01 2.70 2.74 2.51 1.73 1.32 1.22 0.98 xx xx xx xx
Niagara Falls 3102-25 2.48 2.79 2.13 1.58 1.53 2.74 3.47 xx xx xx xx
Sampling was suspended at 1472-04 in 2007, and at 0675-01 and 3102-25 in 2013
Comparison Between NYS Ambient Air Quality and Ambient Air Quality Standards for Calendar Year 2016
One Hour Averages average of 99th percentile for last 3 years not to exceed 75 PPB *
Observations 99th Percentile, PPB
Station Site No. Total %
2014 2015 2016 3-yr
Obs. Avail Avg.
Buffalo 1401-18 7,822 89 8.3 11.1 6.7 8.70
Brookside Terrace 1472-14 8,717 99 25.5 17.1 18.2 20.27
Dunkirk 0601-04 8,682 99 13.7 20.5 5.1 13.10

(Annual Means in parentheses are based on less than 75% available data) *Federal Ambient Air Quality Standard
NYSDEC Region 9
INHALABLE PARTICULATES (PM10) - R&P Model 2025 Sampler
Comparison Between NYS Ambient Air Quality and Ambient Air Quality Standards for Calendar Year 2016
24-Hour Concentrations - µg/m3# of Days > 150 µg/m3 -
Not to exceed an expected avg of one per year during the last 3 years *
Maximum 2nd Max. 3rd Max. 2014 2015 2016
Total Exp.
Station Site No. Obs. Value Date Value Date Value Date Mea Est Mea Est Mea Est Avg.
Buffalo (R&P) 1401-18 57 93 7-Jan 66 18-Apr 45 2-Nov 0 0 0 0 0 0 0

(Annual Means in parentheses are based on less than 75% available data) *Federal Ambient Air Quality Standard
NYSDEC Region 9
INHALABLE PARTICULATES (PM2.5) - Rupprecht & Patashnick Sampler
Comparison Between NYS Ambient Air Quality and Ambient Air Quality Standards for Calendar Year 2016(Average of last 3 years= annual means not to exceed 15 µg/m3 *;
and average of 98th percentile for last 3 years not to exceed 35 µg/m3 *, changed from 65 µg/m3 on 12/17/06)
Site No.
Maximum Values, µg/m3 98th Percentile, µg/m3 Quarterly
Averages, 2016 Annual Mean, µg/m3
Total 1st 2nd 3rd 2014 2015 2016
3-yr1st 2nd 3rd 4th 2014 2015 2016
3-yr
Station Obs. Avg. Avg.
Buffalo (F) 1401-18 120 17.5 15.3 15.0 20.4 22.9 15 18.3 6.2 6.8 7.4 6.8 (8) 8.8 6.8 2.3 [01/07] [11/02] [07/20]
Buffalo (C) 1401-18 354 19.8 19 18.5 21.2 19.6 15.5 18.1 8 7.4 7.3 8.1 9.3 8.8 7.7 8.8 [05/26] [05/25] [01/07]
Grand Island Blvd (C) 1472-13 341 19.7 18.8 18.5
(20.6) 20.2 15.6 4.4 8.6 6.4 7.6 8.1 9.3 (9.5) 7.7 8.5 [09/08] [06/20] [01/05]
Brookside Terrace (C) 1472-14 340 22.6 18.2 16.1
19.4 19.4 14.7 16.7 7 5.6 6.1 7.7 (7.6) 8.3 6.6 -- [01/06] [05/25] [05/26]
Niagara Falls (F) 3102-25 xx xx xx xx (19.1) xx xx -- xx xx xx xx xx xx xx --
Buffalo Near Road (C) 1455-02 341 20 18.1 18 18.1 19.4 15.2 17.6 8.1 7 7.7 8.6 (8.3) 8.8 7.8 8.3 [05/25] [07/13] [05/26]
Buffalo Near Road (F) 1455-02 111 15.5 14.4 13.7 xx 22.7 13.7 -- 6.5 6.5 6.6 8.4 (8.3) 9.2 6.7 -- [11/02] [01/07] [05/27]
Dunkirk (F) 0601-04 114 24.5 17.2 12.8
17.5 17.8 12.8 15.7 5.8 6.2 5.7 5.4 (7.9) 7.9 5.8 -- [01/25] [11/02] [06/26]
Amherst (F) 0601-04 115 13.6 12.7 12.5
16.2 19.3 12.5 16.0 5.7 6.3 6.2 6.1 8.1 8 6.1 7.4 [09/06] [05/27] [06/26]
(F) = Federal Reference Method(C) = Continuous, used for Air Quality Index (AQI) calculations
Continuous instrument sampling at 3102-25 was terminated on 12/31/12, and FRM on 4/01/13. Sampling resumed on 4/4/13 at 0601-04.

(Annual Means in parentheses are based on less than 75% available data) *Federal Ambient Air Quality Standard
NYSDEC Region 9
CARBON MONOXIDE - Continuous Gas Filter Correlation
Comparison Between NYS Ambient Air Quality and Ambient Air Quality Standards for Calendar Year 2016
One-Hour Average Running 8-Hour Average (Non-Overlapping)
Maximum not to exceed 35 PPM more than once per calendar year * Maximum not to exceed 9 PPM more than once per calendar year *
Observations Highest Values, PPM Observations Highest Values, PPM
Total % >35 >9 Days>
Station Site No. Obs. Avail PPM 1st 2nd 3rd Total PPM 1st 2nd 9PPM
Buffalo 1401-18 8,298 94 0 1.5 1.3 1.3 8,333 0 0.9 0.9 0 [02/18, 07] [11/08, 08] [11/23,07] [11/08, 02] [11/23, 08]
Buffalo Near-Road 1455-02 8,070 92 0 1.78 1.444 1.34
3,239 0 0.9 0.8
0 [02/02, 08] [04/13, 05] [01/22,07] [01/07, 09] [01/07, 22]

(Annual Means in parentheses are based on less than 75% available data) *Federal Ambient Air Quality Standard
NYSDEC Region 9
OZONE - Continuous UV Light Absorption
Comparison Between NYS Ambient Air Quality and Ambient Air Quality Standards for Calendar Year 2016
8-hr Running Average Begin Hour 4th Highest Daily Maximum 8-Hour Average-
Observations Daily Highest Values, PPM
Not to exceed an avg of 0.075 ppm during the last 3 years, changed to 0.070 ppm beginning
1/1/2016*
Site No.
Total
Obs.
%
Avail
Days
>.070
1st 2nd 3rd 4th 2014 2015 2016 Avg. Station PPM
Dunkirk 0604-01 6,115 99 3 0.082 0.080 0.073 0.069 0.066 0.071 0.069 0.069 [05/25] [06/11] [06/19] [05/24] [06/21] [05/24] [05/24]
Amherst 1451-03 5,324 98 6 0.081 0.075 0.075 0.074 0.063 0.071 0.074 0.069 [05/25] [05/24] [06/19] [06/11] [06/28] [05/09] [06/11]Middleport
3120-02 3,736 97 3 0.076 0.073 0.071 0.07 0.061 0.067 0.07
0.066 (Seasonal) [05/25] [05/24] [06/19] [04/18] [05/20] [05/09] [04/18]

(Annual Means in parentheses are based on less than 75% available data) *Federal Ambient Air Quality Standard
NYSDEC Region 9
NITROGEN DIOXIDE - Continuous Chemiluminescence
Annual Averages 2006 through 2016 Annual Arithmetic Mean (PPB) - Primary Standard (12 month average not to exceed 53 PPB *)
Station Site No. 2006 2007 2008 2009 2010 2011 2012 2013 2014 2015 2016
Buffalo 1401-18 15.53 16.41 15.05 13.88 13 (12.52) 10.46 (10.38) (8.7) 11.1 9.9Buffalo Near-Road 1455-02 xx xx xx xx xx xx xx xx 9.9 12.4 10.78
Amherst 1451-03 10.51 10.23 (9.71) (7.42) 8.19 8.32 6.44 xx xx xx xx
Sampling at 1451-03 was suspended 12/31/12.
Comparison Between NYS Ambient Air Quality and Ambient Air Quality Standards for Calendar Year 2016
One-Hour Averages - average of 98th percentile for last 3 years not to exceed 75 PPB *
Observations 98th Percentile, PPB Highest Values, PPB
% 2014 2015 2016
3-yr
avg.1st 2nd 3rd
Station Site No. Total Avail
Buffalo 1401-18 8,243 94 (54.6) 53.4 54.6 52.0 62.0 60.3 56.1[02/18:07] [03/08:20] [02/18:08]
Buffalo Near-Road 1455-02 7,564 86 (40.1) 52.2 44.7 xx 64.4 60.1 53.8 [05/25:01] [005/25:00] [05/25:02]