amazon in 20 charts—the rise and rise of the e-commerce ... · amazon’s share of internet...
TRANSCRIPT

1
June1,2017
DeborahWeinswig,ManagingDirector,FungGlobalRetail&[email protected]:917.655.6790HK:852.6119.1779CN:86.186.1420.3016Copyright©2017TheFungGroup.Allrightsreserved.
Inthisreport,wepresentmetricsfromcompanyfilings,consumersurveysandresearchfirmstochartthecontinuedevolutionofAmazon.Ourtoptakeawaysinclude:
1) AmazonWebServicesisdrivinggrowthinAmazon’soperatingmargins.Thisbusinessdivisionyieldeda25%operatingmarginin2016,upfrom19%in2015.AndthedivisionisgrowingitsshareofAmazon’stotalrevenues.
2) Amazon’sthird-partymarketplaceisalmostcertainlyprovidingfurthersupporttomargins.HalfofallunitsalesmadethroughAmazonarenowmadebythird-partysellers.
3) AmazonPrimeisshoringuptoplinegrowth.Some42%ofUSadultsnowhaveaPrimemembership,andthatfigurerisesto55%amongmillennials.
Deep Dive: Amazon in 20 Charts—
the Rise and Rise of the E-Commerce Giant
Deborah Weinswig
Managing Director
Fung Global Retail & Technology
US: 917.655.6790
HK: 852.6119.1779
CN: 86.186.1420.3016
2
June1,2017
DeborahWeinswig,ManagingDirector,FungGlobalRetail&[email protected]:917.655.6790HK:852.6119.1779CN:86.186.1420.3016Copyright©2017TheFungGroup.Allrightsreserved.
TableofContents
Introduction............................................................................................3
CompanyMetrics....................................................................................4
TheAmazonCustomer...........................................................................8
Logistics................................................................................................12
NewMarkets........................................................................................13
KeyTakeaways......................................................................................14
FurtherReadingfromFungGlobalRetail&Technology......................14
AmazonShopperIntelligenceService..................................................15TableofFigures
Figure1.US:AmazonEstimatedGrossMerchandiseVolume(USDBil.)4
Figure2.Global:AmazonTotalRevenues(LeftAxis,USDBil.)andOperatingMargin(RightAxis,%)............................................................4
Figure3.AmazonOperatingMargin,bySegment(LeftAxis,%),andAmazonWebServicesRevenueasShareofTotalRevenue(RightAxis,%)............................................................................................................5
Figure4.Global:AmazonThird-PartyUnitSalesasShareofTotalUnitSales(%)andOrdersFulfilledbyAmazon(FBA)asShareofTotalThird-PartyUnitSales(%).................................................................................5
Figure5.US:RankingofLargestRetailers..............................................6
Figure6.Amazon’sShareofInternetRetailSales,byRegion(%)..........6
Figure7.AmazonRevenueGrowth,byCountry,ExcludingCurrencyEffects(YoY%Change)...........................................................................7
Figure8.EstimatedAnnualSpendingatAmazonperAdult(USDatFixed2016ExchangeRates)...................................................................7
Figure9.USConsumerSurvey:ProportionofSurveyRespondentsWhoHaveanAmazonPrimeMembership,byAgeGroup(%).......................8
Figure10.USConsumerSurvey:ProportionofSurveyRespondentsWhoHaveanAmazonPrimeMembership,byHouseholdIncome(%)..8
Figure11.USConsumerSurvey:RetailersPurchasedfrominthePreceding90Days(%)............................................................................9
Figure12.USConsumerSurvey:ProportionofConsumersWhoShoppedatAmazoninthePreceding90Days,byAgeGroup(%).........9
Figure13.USConsumerSurvey:ProportionofConsumersWhoShoppedatAmazoninthePreceding90Days,byHouseholdIncome(%).........................................................................................................10
Figure14.USConsumerSurvey:ProportionofConsumersWhoBoughtItemsinSelectedCategoriesfromAmazoninthePreceding90Days(LeftAxis,%)andAmazon’sRankingAmongUSRetailersforEachCategory(RightAxis).............................................................................10
Figure15.USConsumerSurvey:ProportionofConsumersWhoBoughtWomenswearfromAmazoninthePast90Days(%)...........................11
Figure16.USConsumerSurvey:ProportionofConsumersWhoBoughtMenswearfromAmazoninthePast90Days(%).................................11
Figure17.AmazonFulfillmentandDataCenters:TotalSpace(Mil.Sq.Ft.).........................................................................................................12
Figure18.US:NumberofAmazonFulfillmentCenters,byState.........12
Figure19.AmazonAustralia:EstimatedTotalMerchandiseSales(LeftAxis,AUDBil.exSalesTax)andEstimatedShareofTotalInternetSales(RightAxis,%).......................................................................................13
Figure20.AmazonIndia:NumberofFulfillmentCenters....................13

3
June1,2017
DeborahWeinswig,ManagingDirector,FungGlobalRetail&[email protected]:917.655.6790HK:852.6119.1779CN:86.186.1420.3016Copyright©2017TheFungGroup.Allrightsreserved.
IntroductionFewretailersaretalkedaboutasmuchasAmazon—andnotjustbycommentatorsandanalysts,butalsobyshoppersandjournalists.AtFungGlobalRetail&Technology,wecoverthiscompanyfrequentlyandindepth.
Forthisreport,wehaveminedcompanyfilings,researchdatabases,consumersurveysandpressreports,andwehaveincludedourowncalculationsandestimatesinordertopresent20chartsthatwehopewilldeepenreaders’understandingofAmazon.
Thethemesdiscussedhererangefromforecastsalesandmarginsthrough2022,toaverageper-capitaspendonAmazonbycountry,toAmazon’spopularityinthewomenswearandmenswearcategories.Therearethreesignificantthemesthatweexplore:
• ThestrengtheningofcompanyoperatingmarginsfromthecontributionofAmazonWebServices.
• Thegrowingshareoftotalsalesmadebythird-partysellersonAmazon,whichcanbepresumedtoyieldhighermarginsforAmazonthandirectretailing.
• ThegrowthinAmazonPrimeandthefactthatalmosthalfofUSconsumersnowsaytheyhaveaPrimemembership.
Weprovidelinkstofurtherrelevantreportsfromourglobalteamofanalystsattheendofthisreport.
Source:amazon.com
4
June1,2017
DeborahWeinswig,ManagingDirector,FungGlobalRetail&[email protected]:917.655.6790HK:852.6119.1779CN:86.186.1420.3016Copyright©2017TheFungGroup.Allrightsreserved.
CompanyMetrics
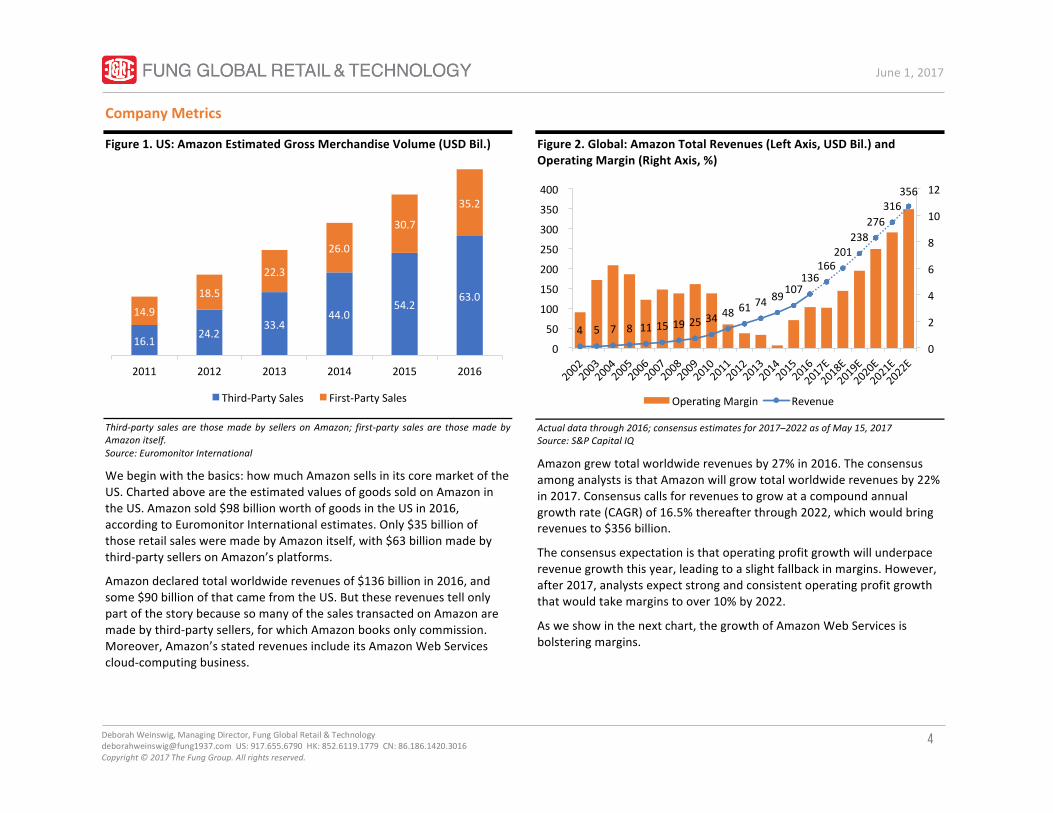
Figure1.US:AmazonEstimatedGrossMerchandiseVolume(USDBil.)
Third-party salesare thosemadeby sellersonAmazon; first-party salesare thosemadebyAmazonitself.Source:EuromonitorInternational
Webeginwiththebasics:howmuchAmazonsellsinitscoremarketoftheUS.ChartedabovearetheestimatedvaluesofgoodssoldonAmazonintheUS.Amazonsold$98billionworthofgoodsintheUSin2016,accordingtoEuromonitorInternationalestimates.Only$35billionofthoseretailsalesweremadebyAmazonitself,with$63billionmadebythird-partysellersonAmazon’splatforms.
Amazondeclaredtotalworldwiderevenuesof$136billionin2016,andsome$90billionofthatcamefromtheUS.ButtheserevenuestellonlypartofthestorybecausesomanyofthesalestransactedonAmazonaremadebythird-partysellers,forwhichAmazonbooksonlycommission.Moreover,Amazon’sstatedrevenuesincludeitsAmazonWebServicescloud-computingbusiness.
Figure2.Global:AmazonTotalRevenues(LeftAxis,USDBil.)andOperatingMargin(RightAxis,%)
Actualdatathrough2016;consensusestimatesfor2017–2022asofMay15,2017Source:S&PCapitalIQ
Amazongrewtotalworldwiderevenuesby27%in2016.TheconsensusamonganalystsisthatAmazonwillgrowtotalworldwiderevenuesby22%in2017.Consensuscallsforrevenuestogrowatacompoundannualgrowthrate(CAGR)of16.5%thereafterthrough2022,whichwouldbringrevenuesto$356billion.
Theconsensusexpectationisthatoperatingprofitgrowthwillunderpacerevenuegrowththisyear,leadingtoaslightfallbackinmargins.However,after2017,analystsexpectstrongandconsistentoperatingprofitgrowththatwouldtakemarginstoover10%by2022.
Asweshowinthenextchart,thegrowthofAmazonWebServicesisbolsteringmargins.
16.124.2
33.444.0
54.263.0
14.918.5
22.3
26.0
30.7
35.2
2011 2012 2013 2014 2015 2016
Third-PartySales First-PartySales
4 5 7 8 1115192534
48617489
107136
166201
238276
316356
0
2
4
6
8
10
12
0
50
100
150
200
250
300
350
400
OperaingMargin Revenue

5
June1,2017
DeborahWeinswig,ManagingDirector,FungGlobalRetail&[email protected]:917.655.6790HK:852.6119.1779CN:86.186.1420.3016Copyright©2017TheFungGroup.Allrightsreserved.
Figure3.AmazonOperatingMargin,bySegment(LeftAxis,%),andAmazonWebServicesRevenueasShareofTotalRevenue(RightAxis,%)
Source:S&PCapitalIQ/FungGlobalRetail&Technology
Amazon’snewlycementedprofitabilityisbeingdrivenbyAmazonWebServices,whoseoperatingmarginsfarexceedthoseoftheremainderofAmazon’sbusiness(i.e.,thesaleofproducts).In2016,AmazonWebServicesgenerateda25%operatingmargin,thoughthatwasdilutedatthegrouplevelbecauseAmazonWebServicescontributedjust9%oftotalrevenue.Thesegmentisexpectedtocontinuegrowingitsshareoftotalrevenue,soitscontributiontogroupmarginswillalsocontinuetogrow.
LossesinAmazon’sinternationalsegmenthavedeepened,andthecompany’splannedmoveintoAustraliaandinvestmentsinIndiamaketheprospectsofashifttoprofitabilityinthatsegmentremoteinthenearterm.
Figure4.Global:AmazonThird-PartyUnitSalesasShareofTotalUnitSales(%)andOrdersFulfilledbyAmazon(FBA)asShareofTotalThird-PartyUnitSales(%)
UnitsrefertophysicalanddigitalunitssoldonAmazonsitesworldwide.FBAshareofthird-partyunitsalesisdisclosedonlyinthefourthquarterofeachyearandisapproximate(e.g.,itwas“morethan55%”in4Q16).Source:Companyreports
Amazon’sprofitabilityisalmostcertainlybeingsupportedalsobythegreatershareofsalesaccountedforbythird-partysellers—althoughAmazondoesnotbreakoutprofitsbyfirst-partyandthird-partysales.Forthird-partysales,Amazontakesacommission,typicallyaround15%ofthesellingprice,inexchangeforlittlemorethanadvertisingtheproductonitssite.
Moreover,amajorityofthird-partysalesarenowfulfilledbyAmazon,whichmeansthatAmazonstoresanddispatchesinventoryonbehalfofthosesellers,therebygeneratingfurtherincrementalfeesforitself.
0.22.1 3.1
0.7 2.2 3.0
(1.9) (2.0) (2.9)
9.9
19.1
25.4
5.2
7.4
9.0
0.01.02.03.04.05.06.07.08.09.010.0
(5.0)
0.0
5.0
10.0
15.0
20.0
25.0
30.0
2014 2015 2016
TotalNorthAmericaInternaionalAmazonWebServicesAmazonWebServicesShareofRevenue
41 42 43 44 45 46 47 48 49 50 49 50
40
5055
0
10
20
30
40
50
60
2Q143Q144Q14 1Q152Q153Q154Q151Q162Q163Q164Q161Q17
Third-PartyUnitSalesas%ofTotalUnitSales
FBAas%ofThird-PartyUnitSales

6
June1,2017
DeborahWeinswig,ManagingDirector,FungGlobalRetail&[email protected]:917.655.6790HK:852.6119.1779CN:86.186.1420.3016Copyright©2017TheFungGroup.Allrightsreserved.
Figure5.US:RankingofLargestRetailers
Source:EuromonitorInternational/FungGlobalRetail&Technology
AmazonwasAmerica’sfourth-largestretailer,onlineoroffline,lastyear.Ithassteadilyclimbedthemarketsharerankings,thoughitstayedatnumberfourbetween2015and2016.
In2016,Amazon’stotalestimatedUSsaleswere$98billion,comparedwithtotalrevenuesof$115billionatKroger,$177.5billionatCVSand$308billionatWalmartUS(excludingSam’sClub).
AccordingtoEuromonitor,Amazoncaptured3.4%ofallUSretailsalesin2016.
Figure6.Amazon’sShareofInternetRetailSales,byRegion(%)
Includessalesbythird-partysellersonAmazon.AustralasiaisthesumofAustraliaandNewZealand.Source:EuromonitorInternational
Amazonenjoyeda33%shareofUSInternetretailsalesin2016,includingsalesmadebythird-partysellers.
Inmarketswheretherehasbeenaconsiderableappetiteforonlineshopping—notablytheUSandGermany—Amazon’sshareofonlinesaleshasgrownconsiderably.Thedrivetogetmorethird-partysellersontoAmazon’splatformhashelpedunderpingrowthinthesemarkets.
9.48.48.5
33.0
16.4
26.5
12.9
40.8
7.8
10.7
0.0
5.0
10.0
15.0
20.0
25.0
30.0
35.0
40.0
45.0
2007 2008 2009 2010 2011 2012 2013 2014 2015 2016
Australasia US UK Germany France

7
June1,2017
DeborahWeinswig,ManagingDirector,FungGlobalRetail&[email protected]:917.655.6790HK:852.6119.1779CN:86.186.1420.3016Copyright©2017TheFungGroup.Allrightsreserved.
Figure7.AmazonRevenueGrowth,byCountry,ExcludingCurrencyEffects(YoY%Change)
Source:S&PCapitalIQ/FungGlobalRetail&Technology
TheUScontributedtwo-thirdsofallAmazonrevenuein2016,andthecountryhasbeenthecompany’sfastest-growingstatedregionalsegment.USrevenueswereup28%yearoveryearin2016.
Germanycontributed10%ofAmazonrevenuelastyear,andrevenueinthecountrygrewby20%.TheUKcontributed7%ofrevenue,andrevenueinthecountrygrewatasimilarratetoGermany.
JapanandtheRestoftheWorldsegmenteachcontributed8%ofrevenuein2016.(Totalsdonotsumto100%duetorounding.)
Therevenuegrowthratesaboveareshownintherespectivenationalcurrenciesinordertostripoutcurrencyeffects.
Figure8.EstimatedAnnualSpendingatAmazonperAdult(USDatFixed2016ExchangeRates)
BasedontotalsalesmadethroughAmazon’srespectivenationalwebsites,includingsalesbythird-partysellers.Calculatedbasedonpopulationdataforthose18+.Source:EuromonitorInternational/USCensusBureau/Eurostat/FungGlobalRetail&Technology
Basedonestimatedtotalsales,includingsalesbythird-partysellers,wecalculatethateachUSadultspentanaverageofjustover$412onAmazonin2016.SpendingbyUKadultswasnotfarbehind.
Thespendingdataaboveareshownintermsoffixed2016exchangeratesinordertostripoutcurrencyeffects.
42.8
30.4
26.3 24.5
28.9
28.1
20.119.717.4
0.0
5.0
10.0
15.0
20.0
25.0
30.0
35.0
40.0
45.0
2011 2012 2013 2014 2015 2016
US Germany UK Japan
359321
241
412377
261
US UK Germany2015 2016

8
June1,2017
DeborahWeinswig,ManagingDirector,FungGlobalRetail&[email protected]:917.655.6790HK:852.6119.1779CN:86.186.1420.3016Copyright©2017TheFungGroup.Allrightsreserved.
TheAmazonCustomerInthissection,weshowcaseUSconsumersurveydatafromourresearchpartnerProsperInsights&Analytics.
Figure9.USConsumerSurvey:ProportionofSurveyRespondentsWhoHaveanAmazonPrimeMembership,byAgeGroup(%)
SurveysconductedMarch2013toApril2017Base:Between4,912and7,609adultsages18+ineachthree-monthperiodSource:ProsperInsights&Analytics
PrimehasbeenadrivingforceinAmazon’sgrowth.USpenetrationratesofPrimemorethandoubled,to42%,inthefouryearsendedApril2017.Millennials(thosebornbetween1983and1998,byProsper’sdefinition)aremorelikelythanthoseinolderagegroupstohaveaPrimemembership.
Thedatachartedaboveshowtheproportionofsurveyrespondentswhoansweredyeswhenasked,“DoyouhaveanAmazonPrimemembership?”Thewordingissignificant,becauselargerproportionsthanthosechartedarelikelytohaveaccesstoPrimedeliverybenefitsthroughaPrimemembershipheldbysomeoneelseintheirhousehold.
Figure10.USConsumerSurvey:ProportionofSurveyRespondentsWhoHaveanAmazonPrimeMembership,byHouseholdIncome(%)
SurveysconductedMarch2013toApril2017Base:Between4,912and7,609adultsages18+ineachthree-monthperiodSource:ProsperInsights&Analytics
IntheUS,more-affluenthouseholdsaremorelikelytohavePrimememberships.Asthegraphaboveshows,growthofPrimemembershipamongthosewithincomesinthe$35,000–$74,999rangetracksgrowthamongtypicalPrimecustomersveryclosely.
42.3%
55.0%
45.6%
32.5%
10.0%15.0%20.0%25.0%30.0%35.0%40.0%45.0%50.0%55.0%
2013 2014 2015 2016 2017
AllAdults MillennialsGenXers BabyBoomers
30.8%
42.3%41.6%
53.2%
10.0%15.0%20.0%25.0%30.0%35.0%40.0%45.0%50.0%55.0%
2013 2014 2015 2016 2017
AllAdults18+ Lessthan$35,000$35,000to$74,999 $75,000+
9
June1,2017
DeborahWeinswig,ManagingDirector,FungGlobalRetail&[email protected]:917.655.6790HK:852.6119.1779CN:86.186.1420.3016Copyright©2017TheFungGroup.Allrightsreserved.
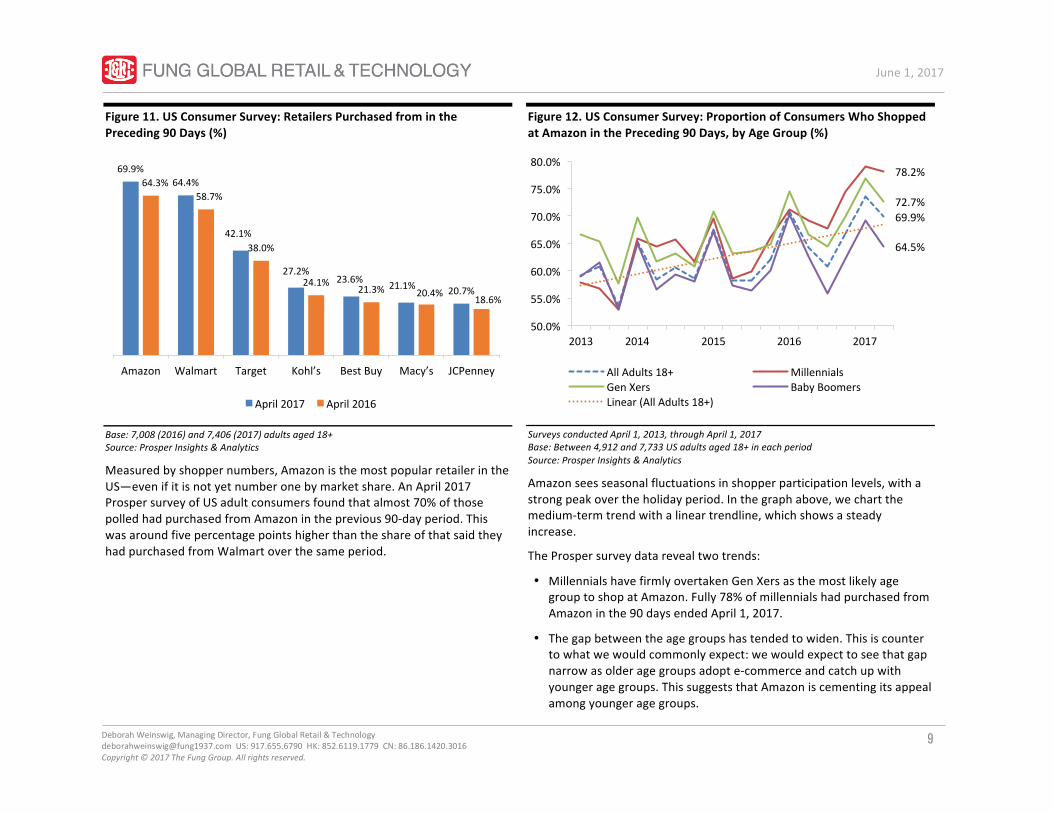
Figure11.USConsumerSurvey:RetailersPurchasedfrominthePreceding90Days(%)
Base:7,008(2016)and7,406(2017)adultsaged18+Source:ProsperInsights&Analytics
Measuredbyshoppernumbers,AmazonisthemostpopularretailerintheUS—evenifitisnotyetnumberonebymarketshare.AnApril2017ProspersurveyofUSadultconsumersfoundthatalmost70%ofthosepolledhadpurchasedfromAmazonintheprevious90-dayperiod.ThiswasaroundfivepercentagepointshigherthantheshareofthatsaidtheyhadpurchasedfromWalmartoverthesameperiod.
Figure12.USConsumerSurvey:ProportionofConsumersWhoShoppedatAmazoninthePreceding90Days,byAgeGroup(%)
SurveysconductedApril1,2013,throughApril1,2017Base:Between4,912and7,733USadultsaged18+ineachperiodSource:ProsperInsights&Analytics
Amazonseesseasonalfluctuationsinshopperparticipationlevels,withastrongpeakovertheholidayperiod.Inthegraphabove,wechartthemedium-termtrendwithalineartrendline,whichshowsasteadyincrease.
TheProspersurveydatarevealtwotrends:
• MillennialshavefirmlyovertakenGenXersasthemostlikelyagegrouptoshopatAmazon.Fully78%ofmillennialshadpurchasedfromAmazoninthe90daysendedApril1,2017.
• Thegapbetweentheagegroupshastendedtowiden.Thisiscountertowhatwewouldcommonlyexpect:wewouldexpecttoseethatgapnarrowasolderagegroupsadopte-commerceandcatchupwithyoungeragegroups.ThissuggeststhatAmazoniscementingitsappealamongyoungeragegroups.
69.9%64.4%
42.1%
27.2%23.6% 21.1% 20.7%
64.3%58.7%
38.0%
24.1%21.3% 20.4%
18.6%
Amazon Walmart Target Kohl’s BestBuy Macy’s JCPenney
April2017 April2016
69.9%
78.2%
72.7%
64.5%
50.0%
55.0%
60.0%
65.0%
70.0%
75.0%
80.0%
2013 2014 2015 2016 2017
AllAdults18+ MillennialsGenXers BabyBoomersLinear(AllAdults18+)
10
June1,2017
DeborahWeinswig,ManagingDirector,FungGlobalRetail&[email protected]:917.655.6790HK:852.6119.1779CN:86.186.1420.3016Copyright©2017TheFungGroup.Allrightsreserved.
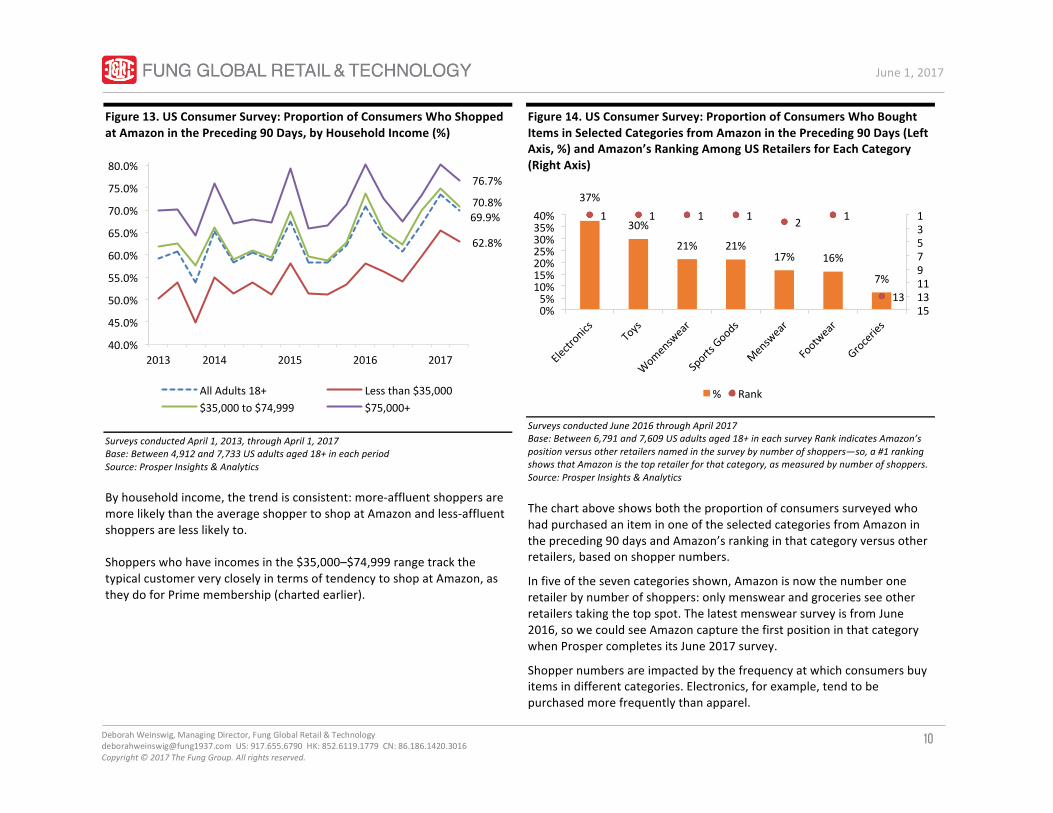
Figure13.USConsumerSurvey:ProportionofConsumersWhoShoppedatAmazoninthePreceding90Days,byHouseholdIncome(%)
SurveysconductedApril1,2013,throughApril1,2017Base:Between4,912and7,733USadultsaged18+ineachperiodSource:ProsperInsights&Analytics
Byhouseholdincome,thetrendisconsistent:more-affluentshoppersaremorelikelythantheaverageshoppertoshopatAmazonandless-affluentshoppersarelesslikelyto.
Shopperswhohaveincomesinthe$35,000–$74,999rangetrackthetypicalcustomerverycloselyintermsoftendencytoshopatAmazon,astheydoforPrimemembership(chartedearlier).
Figure14.USConsumerSurvey:ProportionofConsumersWhoBoughtItemsinSelectedCategoriesfromAmazoninthePreceding90Days(LeftAxis,%)andAmazon’sRankingAmongUSRetailersforEachCategory(RightAxis)
SurveysconductedJune2016throughApril2017Base:Between6,791and7,609USadultsaged18+ineachsurveyRankindicatesAmazon’spositionversusotherretailersnamedinthesurveybynumberofshoppers—so,a#1rankingshowsthatAmazonisthetopretailerforthatcategory,asmeasuredbynumberofshoppers.Source:ProsperInsights&Analytics
ThechartaboveshowsboththeproportionofconsumerssurveyedwhohadpurchasedaniteminoneoftheselectedcategoriesfromAmazoninthepreceding90daysandAmazon’srankinginthatcategoryversusotherretailers,basedonshoppernumbers.
Infiveofthesevencategoriesshown,Amazonisnowthenumberoneretailerbynumberofshoppers:onlymenswearandgroceriesseeotherretailerstakingthetopspot.ThelatestmenswearsurveyisfromJune2016,sowecouldseeAmazoncapturethefirstpositioninthatcategorywhenProspercompletesitsJune2017survey.
Shoppernumbersareimpactedbythefrequencyatwhichconsumersbuyitemsindifferentcategories.Electronics,forexample,tendtobepurchasedmorefrequentlythanapparel.
69.9%
62.8%
70.8%
76.7%
40.0%
45.0%
50.0%
55.0%
60.0%
65.0%
70.0%
75.0%
80.0%
2013 2014 2015 2016 2017
AllAdults18+ Lessthan$35,000$35,000to$74,999 $75,000+
37%
30%
21% 21%17% 16%
7%
1 1 1 1 2 1
13
135791113150%
5%10%15%20%25%30%35%40%
% Rank

11
June1,2017
DeborahWeinswig,ManagingDirector,FungGlobalRetail&[email protected]:917.655.6790HK:852.6119.1779CN:86.186.1420.3016Copyright©2017TheFungGroup.Allrightsreserved.
Figure15.USConsumerSurvey:ProportionofConsumersWhoBoughtWomenswearfromAmazoninthePast90Days(%)
Base:4,912–7,406adultsaged18+ineachsurveyperiodSource:ProsperInsights&Analytics
Morethanone-thirdofallUSmillennialssurveyedhadboughtwomenswearfromAmazoninthe90daysendedApril2017,comparedwith21%ofallUSconsumerssurveyed.
AmazonisnowthenumberonedestinationforwomenswearintheUS,basedonshoppernumbers:itnarrowlyovertookKohl’sasthetopretailerforwomenswear,byshoppernumbers,intheApril2017Prospersurvey.
However,thisdoesnotmeanthatAmazonisthebiggestretailerinthecategorybysales,asthatmetricisaffectedbyfrequencyofshoppingandaveragespendaswellasbynumberofshoppers.
Figure16.USConsumerSurvey:ProportionofConsumersWhoBoughtMenswearfromAmazoninthePast90Days(%)
Base:5,606–8,760adultsaged18+ineachsurveyperiodSource:ProsperInsights&Analytics
Prosper’slatestsurveyregardingmenswearisfromJune2016,whenAmazonwasthesecond-most-shoppedretailerintheprevious90-dayperiodamongthosesurveyed.OnlyWalmartwasmorepopularformenswear.WemayfindthatAmazonhasmoveduptobecomethemost-shoppedretailerformenswearintheJune2017survey.
Aswithwomenswear,Amazon’stotalshoppernumbersconcealmuchhighershoppingratesamongmillennials.
• FormoreonAmazonandapparel,seeourreportDeepDive:RetailRevolution—USApparelShiftsin20Charts.
15.5%13.5%
15.2%16.6%
21.3%
34.2%
24.0%
11.0%
5.0%
10.0%
15.0%
20.0%
25.0%
30.0%
35.0%
Apr13 Apr14 Apr15 Apr16 Apr17
AllAdults18+ MillennialsGenXers Boomers
14.0% 13.4% 13.4%
16.6%
27.9%
18.2%
8.9%
5.0%
10.0%
15.0%
20.0%
25.0%
30.0%
Jun13 Jun14 Jun15 Jun16
AllAdults18+ MillennialsGenXers Boomers

12
June1,2017
DeborahWeinswig,ManagingDirector,FungGlobalRetail&[email protected]:917.655.6790HK:852.6119.1779CN:86.186.1420.3016Copyright©2017TheFungGroup.Allrightsreserved.
Logistics
Figure17.AmazonFulfillmentandDataCenters:TotalSpace(Mil.Sq.Ft.)
Spaceisfor“fulfillment,datacentersandother.”Source:Companyreports
Attheendof2016,Amazonoperated160millionsquarefeetofspaceacrossitsfulfillmentcentersanddatacentersworldwide.Some62%ofthisspacewasintheUS,whichaccountedfor66%of2016revenues.
RecentlyopenedUSfulfillmentcentersaretypicallybetween750,000and1millionsquarefeetandemployaround1,000peopleeach.
AccordingtopropertyresearchfirmMWPVLInternational,Amazonoperatesseveraltypesofdistributioncenters:largefulfillmentcenters,midsizeAmazonPantryandAmazonFreshdistributioncenters,midsizeregionalsortationcenters,smallerdeliverystations(forsortingpackagesforshoppersinnearbyareas)andevensmallerPrimeNowhubs(whichstockpopularproductsforrapiddelivery).
Figure18.US:NumberofAmazonFulfillmentCenters,byState
Includesfulfillmentanddistributioncenters,regionalsortationcenters,AmazonPantryandAmazonFreshdistributioncenters,deliverystationsandPrimeNowhubs,operationalorplanned,asofJanuary2017Source:MWPVLInternational/Statista
Amazonoperated214distributionfacilitiesacrosstheUSasofJanuary2017,accordingtoMWPVLandStatista.CaliforniaandTexasarehometothehighestnumberoffulfillmentcenters.
99.571.7
58.648.335.6
60.4
48.644.2
36.330.8
20162015201420132012
NorthAmerica Internaional

13
June1,2017
DeborahWeinswig,ManagingDirector,FungGlobalRetail&[email protected]:917.655.6790HK:852.6119.1779CN:86.186.1420.3016Copyright©2017TheFungGroup.Allrightsreserved.
NewMarkets
Figure19.AmazonAustralia:EstimatedTotalMerchandiseSales(LeftAxis,AUDBil.exSalesTax)andEstimatedShareofTotalInternetSales(RightAxis,%)
Source:FungGlobalRetail&Technology
InApril2017,AmazonconfirmedthatitissettolaunchafullofferinginAustralia—althoughitdidnotdisclosealaunchdate.Assumingitmovesintothemarketin2018,weestimatethatAmazonAustraliacouldgeneratetotalnetmerchandisesalesofapproximatelyA$4billionin2021andA$10billionin2026(equivalenttoUS$3billionandUS$7.5billion,respectively,atthetimeofwriting).Ourfiguresincludesalesbythird-partymarketplacesellersonAmazon,sotheydonotrepresentrevenuesbookeddirectlybyAmazon.
Theseestimatestranslatetoashareofapproximately12.5%ofAustralianInternetsalesin2021and20%in2026,climbingbyanaverageof150basispointsperyear.
• SeealsoourreportDeepDive:Aussies,GetReadyforAmazon!
Figure20.AmazonIndia:NumberofFulfillmentCenters
Source:Companyreports
IndiaisasecondfocusforinvestmentbyAmazonand,above,wechartthegrowthinitsnumberoffulfillmentcentersinthecountry,basedonpressreports.Inadditiontofulfillmentcenters,AmazonIndiaalsooperatesdeliverystations,whichsortdeliveriesforshoppersinnearbyareas.
InApril2017,AmazonIndiaannouncedthatithadopenedsevennewfulfillmentcentersthatwillbeusedexclusivelyforlargeappliancesandfurniture.InMay,thecompanyannouncedthatitwouldopenafurthersevenIndianfulfillmentcentersbytheendofJune,bringingthetotalto41.
Amazon.inoperatespurelyasamarketplacesite,duetorestrictionsonforeigndirectinvestmentinmultibrandretailing(i.e.,thesellingofarangeofthird-partybrands).InAmazon’sfirst-quarter2017results,CEOJeffBezossaid,“Amazon.inisthemostvisitedandthefastest-growingmarketplaceinIndia.”AmazonIndialaunchedPrimeinJuly2016.
• SeealsoourreportDeepDive:IndiaRisingPart2—E-CommerceDisruptorsinIndia.
4.2 5.3 6.4 7.68.8
10.0
12.514.4
16.117.6
18.9 20.0
0.0
5.0
10.0
15.0
20.0
25.0
0.0
2.0
4.0
6.0
8.0
10.0
12.0
2021E 2022E 2023E 2024E 2025E 2026E
Sales OnlineShare
2
20 2124
34
41
Jul14 Sep15 Jun16 Sep16 Apr17 Jun17E

14
June1,2017
DeborahWeinswig,ManagingDirector,FungGlobalRetail&[email protected]:917.655.6790HK:852.6119.1779CN:86.186.1420.3016Copyright©2017TheFungGroup.Allrightsreserved.
KeyTakeawaysAschartedearlier,analystscurrentlyexpectAmazontogrowworldwiderevenuesby161%,from$136billionin2016to$356billionin2022.Theconsensusamonganalystsisforoperatingmarginstostrengthensteadily,beforereachingdoubledigitsin2022.
Thekeydatapointsfromthisreportthatshowcasethebuildingblocksforthisforecastgrowthare:
1. AmazonWebServicesisbolsteringprofitgrowth.Thisbusinessdivisionyieldeda25%operatingmarginin2016,upfrom19%in2015.AndthedivisionisgrowingitsshareofAmazon’stotalrevenues:AmazonWebServicesaccountedfor9%oftotalrevenuesin2016,upfrom7.4%in2015.
2. Amazon’sthird-partymarketplaceisalmostcertainlyprovidingfurthersupporttomargins(thoughthecompanydoesnotbreakthissegmentout).HalfofallunitsalesmadethroughAmazonarenowmadebythird-partysellers,forwhichAmazonbooksacommissionwithouttakingownershipofinventory.
3. AmazonPrimeisshoringuptoplinegrowth.Some42%ofUSadultsnowhaveaPrimemembershipandthatfigurerisesto55%amongmillennials.Giventhatdeliverybenefitscanbesharedwithinahousehold,asubstantiallyhighershareoftheUSpopulationhasaccesstoPrime.
FurtherReadingfromFungGlobalRetail&TechnologyDeepDive:Aussies,GetReadyforAmazon!
DeepDive:IndiaRisingPart2—E-CommerceDisruptorsinIndia
DeepDive:USConsumerSurvey—AmazonPrimeMembersLoveShoppingOffline,Too
DeepDive:USConsumerSurvey—AmazonYettoCracktheMenswearMarket
DeepDive—USConsumerSurvey:AmazonIsWinningtheBattleintheToySegment
USHealthandBeautyAidsConsumerSurvey:AmazonIsNotOnlyCompetitiveinPrice,butAlsoinCustomerSatisfaction
FootwearPoisedtoGrowat4TimestheRateofApparelThrough2020:DataRevealSpecialtyandOnlineAreBenefiting,withAmazonGainingtheMost
DeepDive:RetailRevolution—USApparelShiftsin20Charts

15
June1,2017
DeborahWeinswig,ManagingDirector,FungGlobalRetail&[email protected]:917.655.6790HK:852.6119.1779CN:86.186.1420.3016Copyright©2017TheFungGroup.Allrightsreserved.
AmazonShopperIntelligenceServiceThisreportfeaturesselecteddatathatareavailablefromtheAmazonShopperIntelligenceService.ThisservicecombinesFungGlobalRetail&TechnologyanalysisandcommentarywithinputonthousandsofUSshoppersfromProsperInsights&Analytics.Itincludes:
• Over10yearsofsurveydataonAmazonshoppersandleadingretailers’shoppers.
• ProsperShopperPreferenceShare(whichindicateshowAmazonisgrowingasapreferredretailerfor11differentmerchandisecategories,andthereasonswhy).
• Retailpositioningmaps(whichplotretailersandtheircompetitorsbasedonthepercentageoftheirshopperswhoshopthereforparticularreasons).
• Netpromoterscores.
• Keydemographics.
Source:FungGlobalRetail&Technology

16
June1,2017
DeborahWeinswig,ManagingDirector,FungGlobalRetail&[email protected]:917.655.6790HK:852.6119.1779CN:86.186.1420.3016Copyright©2017TheFungGroup.Allrightsreserved.
DeborahWeinswig,CPAManagingDirectorFungGlobalRetail&TechnologyNewYork:917.655.6790HongKong:852.6119.1779China:86.186.1420.3016deborahweinswig@fung1937.comJohnMercerSeniorAnalyst
HongKong:8thFloor,LiFungTower888CheungShaWanRoad,KowloonHongKongTel:85223004406London:242-246MaryleboneRoadLondon,NW16JQUnitedKingdomTel:44(0)2076168988NewYork:1359Broadway,9thFloorNewYork,NY10018Tel:6468397017FungGlobalRetailTech.com