amanda ricci rodrigues - university of são paulo
TRANSCRIPT

AMANDA RICCI RODRIGUES
Economic performance of commercial fishing fleets off the South Brazil Shelf from Angra dos Reis (23°S) to Rio Grande (32°S)
Thesis submitted to the Oceanographic Institute of
the University of São Paulo, in partial fulfilment of
the requirement for the degree of Doctor of
Science, program of Oceanography, Biological
Oceanography area.
Supervisor: Prof. Dr. Maria de los Angeles Gasalla
São Paulo
2018

ii
University of São Paulo
Oceanographic Institute
Amanda Ricci Rodrigues
Economic performance of commercial fishing fleets off the South Brazil Shelf from
Angra dos Reis (23°S) to Rio Grande (32°S)
Thesis submitted to the Oceanographic Institute of the University of São Paulo, in
partial fulfilment of the requirement for the degree of Doctor of Science, program of
Oceanography, Biological Oceanography area.
CORRECTED VERSION

iii
SUMMARY
SUMMARY ……………………………………………………………………………... iii
FIGURE INDEX ………………………………………………………………………... v
TABLE INDEX …………………………………………………………………………. vii
ACKNOWLEDGMENTS ……………………………………………………………. ix
ABSTRACT …………………………………………………………………………….. xi
RESUMO ……………………………………………………………………………….. xiii
GENERAL INTRODUCTION…………………………………………………………. 15
1. Introduction………………………………………………………………………. 15
2. Brief history of Fisheries Economics………………………………………….. 16
3. Study area: the natural and human fisheries systems……………………… 19
4. Broad context of the thesis…………………………………………………….. 23
5. Thesis structure…………………………………………………………………. 23
CHAPTER 1 - Harvesting costs and revenues: implication of the performance
of open-access commercial fishing fleets off Rio Grande, Brazil…………………. 25
1. Introduction………………………………………………………………………. 26
1.1. Backgroud…………………………………………………………………... 29
2. Methods....................................................................................................... 30
2.1. Data collection...................................................................................... 30
2.2. Data analysis........................................................................................ 33
3. Results......................................................................................................... 35
3.1. Cost structure....................................................................................... 38
3.2. Financial performance.......................................................................... 39
4. Discussion................................................................................................... 41
5. Conclusion................................................................................................... 46
CHAPTER 2 - Cost structure and financial performance of marine commercial
fisheries in the South Brazil Bight......................................................................... 48
1. Introduction.................................................................................................. 50
2. Methods....................................................................................................... 51
2.1. Data collection...................................................................................... 51
2.2. Data analysis........................................................................................ 56
2.3. Generalized additive models................................................................ 58
3. Results......................................................................................................... 59
3.1. Fleet characteristics ............................................................................. 59
3.2. Cost structure....................................................................................... 60
3.3. Profitability............................................................................................ 67
3.4. Generalized additive models……………………………………………… 68
4. Discussion……………………………………………………………………….. 74
5. Conclusion................................................................................................... 79
iv
CHAPTER 3 - Economic performance of marine commercial fishing fleets in
Southeast and South Brazil................................................................................... 81
1. Introduction.................................................................................................. 83
2. Methods....................................................................................................... 84
2.1. Data collection...................................................................................... 84
2.2. Data analysis........................................................................................ 87
3. Results......................................................................................................... 89
3.1. Investment cost..................................................................................... 89
3.2. Economic performance......................................................................... 89
4. Discussion................................................................................................... 102
5. Conclusion................................................................................................... 105
GENERAL CONCLUSIONS.................................................................................. 108
REFERENCES...................................................................................................... 113
APPENDIX............................................................................................................ 127

v
FIGURE INDEX
Figure 1. Gordon-Schaefer model......................................................................... 18
Figure 2. Location of the study area, South Brazil Shelf LME (in blue), in the
coast of South Brazil, in South America……………………………………... 20
Figure 1.1. Location of the fishing port of Rio Grande (in dots), in the coast of
South Brazil, in South America................................................................... 31
Figure 1.2. Inter-fleet comparison of the relative importance of costs and gross
profits, as estimated by month, excluding the subsidies............................. 38
Figure 1.3. Relative importance of operational costs within each fishing fleet as
estimated per fishing trip, excluding the subsidies...................................... 39
Figure 2.1. Industrial fleets analyzed in the fishing ports of Angra dos Reis (AR),
Santos/Guarujá (SG) and Itajaí/Navegantes (IN) (red dots) on the coast
of the South Brazil Bight (SBB), in South America..................................... 52
Figure 2.2. Attributes included in questionnaires for data-gathering interviews 54
Figure 2.3. Inter-fleet comparison of the relative importance of costs, as
estimated by month..................................................................................... 64
Figure 2.4. Monthly indicators for all sampled fleets. Labor cost as a function of
(A) total revenue and profit and (B) catch (ton) ......................................... 65
Figure 2.5. Average operational costs within each fishing fleet as estimated per
month and per region, Angra dos Reis (AR) Santos/Guarujá (SG) and
Itajaí/Navegantes (IN) ................................................................................ 66
Figure 2.6. Box plot of annual gross profit margin per fleet. The heavy horizontal
line represents the median, the boxes represent the interquartile ranges,
whiskers represent 95% confidence intervals, and the balls represent the
average annual gross profit margins........................................................... 70
Figure 2.7. Graphical summary of the GAMLSS analysis considering purse-
seiner fleets. The response variable, gross profit, is shown on the y-axis
as a centered smoothed function scale to ensure valid pointwise 95%
confidence bands. Covariates and factors are shown on the x-axis: (A)
number of trips. For covariates, solid curves are the smoothing spline fits
conditioned on all other covariates and factors, and the shaded areas are
bounded by pointwise 95% confidence curves around the fit in each
panel........................................................................................................... 72
Figure 2.8. Graphical summary of the GAMLSS analysis considering trawler
fleets. The response variable, gross profit margin, is shown on the y-axis
as a centered smoothed function scale to ensure valid pointwise 95%
confidence bands. Covariates and factors are shown on the x-axis: (A)
landing cost, (B) vessel size, (C) fleet type. For covariates, solid curves
are the smoothing spline fits conditioned on all other covariates and
factors, and the shaded areas are bounded by pointwise 95% confidence
curves around the fit in each panel............................................................. 73
Figure 3.1. Location of the fishery landing ports/regions (red dots) of Southeast
and Southern Brazil.................................................................................... 85
Figure 3.2. Classification of each fleet by category of viability and profitability….. 99
Figure 3.3. Percentage of each category of viability (A) and profitability (B) from
the 17 total fishery fleets from S/SE Brazil and the number and
percentage of fleets per category and region............................................ 100

vi
Figure 3.4. Percentage of fleets classified by each category of viability (V) and
profitability (P) by region, Angra dos Reis (AR), Santos/Guarujá (SG),
Itajaí/Navegantes (IN) and Rio Grande (RG) ............................................. 101

vii
TABLE INDEX
Table 1.1. Attributes included in questionnaires for data-gathering interviews…. 32
Table 1.2. Major characteristics of the four studied fishing fleets based at three
principal industries of the Rio Grande region, in the South Brazil Bight…. 36
Table 1.3. Performance indicators per fishing trip, as monthly and annual mean
values, by fleets in R$ and excluding the subsidies. (S.D: Standard
deviation; EE: Economic efficiency; RR: rate of return profit; PP:
investment payback period) ...................................................................... 37
Table 1.4. A posteriori multiple comparison test of monthly gross profit by fleet.
Number of observed differences. Asterisks indicate statistical
significance……………………………………………………………………... 40
Table 1.5. Annual gross profit, fuel cost and diesel oil subsidy quotas (in R$) by
fleet and by subsidized and non-subsidized
vessels....................................................................................................... 41
Table 2.1. Major characteristics of the nine studied fishing fleets based in the
ports of Angra dos Reis (AR), Santos/Guarujá (SG) and
Itajaí/Navegantes (IN), in the South Brazil Bight. Means are shown per
fishing trip................................................................................................... 55
Table 2.2. Performance indicators estimated per fishing trip, month and year (in
Brazilian Reais, R$) for the purse-seiners of Angra dos Reis (S.D:
Standard deviation; EE: Economic efficiency) ........................................... 61
Table 2.3. Performance indicators per fishing trip, as monthly and annual mean
values, in R$ by fleets of Santos/Guarujá (S.D: Standard deviation; EE:
Economic efficiency) ................................................................................. 62
Table 2.4. Performance indicators per fishing trip, as monthly and annual mean
values, in R$ by fleets of Itajaí/Navegantes (S.D: Standard deviation;
EE: Economic efficiency) ........................................................................... 63
Table 2.5. Summary of GAMLSS models fitted to the gross profit margin
(month), where the explanatory variables are operational costs (fuel,
lubricant, ice, food, vessel maintenance [Vm], landing, and others); fixed
costs (social security [Ss], vessel tracking service, and accountants);
and technical/operational characteristics of the vessels (fleet segment
[fleet], vessel size [Vs], number of trips per month [Tm] and region of
landing [port]) from industrial fleets of Angra dos Reis (AR),
Santos/Guarujá (SG) and Itajaí/Navegantes (IN). (AIC = Akaike
Information Criterion; LRT = Likelihood-ratio test; Pr(Chi) = probability of
Chi squared test, and cs() = cubic spline) ................................................. 69
Table 2.6. Models for explaining monthly profit for purse-seiner and trawler
fleets. Variables in final models selected by LRT and AIC are in bold…… 71
Table 3.1. Economic indicators selected for assessing the performance of
Southeast and Southern Brazil................................................................... 86
Table 3.2. Capital investment, depreciation rate and costs for fleets sampled
based in the ports of Rio Grande (RG), Brazil, 2013-2014........................ 90
Table 3.3. Capital investment, depreciation rate and costs for fleets sampled
based in the ports of Itajaí/Navegantes (IN), Brazil, 2013-2014………….. 91
Table 3.4. Capital investment, depreciation rate and costs for fleets sampled
based in the ports of Santos/Guarujá (SG), Brazil, 2013-2014…………… 92
Table 3.5. Capital investment, depreciation rate and costs for fleets sampled
based in the ports of Angra dos Reis (AR), Brazil, 2013-2014……………. 93

viii
Table 3.6. Rio Grande (RG) region - Average value of technical/operational
characteristics and economic indicators by fleet…………………………… 94
Table 3.7. Itajaí/Navegantes (IN) region - Average value of
technical/operational characteristics and economic indicators by fleet….. 95
Table 3.8. Santos Guarujá (SG) region - Average value of technical/operational
characteristics and economic indicators by fleet…………………………… 96
Table 3.9. Angra dos Reis (AR) region- Average value of technical/operational
characteristics and economic indicators by fleet…………………………… 97
Appendix 2. A posteriori multiple inter-fleet comparison test of monthly
operational costs. Number of observed differences. Asterisks indicate
statistical significance………………………………………………………….. 131

ix
AGRADECIMENTOS (Acknowledgments)
Sou muito grata:
À Profa. Dra. Maria de los Angeles Gasalla pela orientação, pela confiança, e por ser a
maior incentivadora na superação de meus limites. MUITO OBRIGADA por não ter deixado
que eu desistisse do meu doutoramento e pelo apoio nos momentos delicados e decisivos
que passei durante esta jornada.
Ao CNPq - Conselho Nacional de Desenvolvimento Científico e Tecnológico - pelo
financiamento do projeto 406614/2012-1, e à CAPES - Comissão de Aperfeiçoamento do
Pessoal de Ensino Superior - pela bolsa de Doutorado no País concedida.
Á todos os pescadores, mestres e armadores que contribuíram gentilmente durante as
entrevistas.
Devo uma especial menção e expresso aqui o meu profundo reconhecimento aos
bolsistas; Alina Pellegrinelli, Celso Luiz Eleutério, Fabricio Gandini, Marcus Godinho,
Ritchelly Luz e Viviane Steimbach, que trabalharam arduamente durante a coleta e
organização dos dados utilizados neste estudo.
Ao Prof. Dr. Manuel Haimovici e toda a equipe do Lab. de Recursos Pesqueiros
Demersais e Cefalópodes (FURG); e o Eng. Agr. Luiz Rodrigo Maçaneiro e o Biol. Caiame J.
Nascimento (Fundação Pró-TAMAR, Itajaí-SC), por indicarem “o caminho das pedras” para
que eu pudesse acessar os mestres, armadores e pontos de desembarque pesqueiro.
Igualmente agradeço á FIPERJ e a equipe de coordenação do Terminal Pesqueiro Público
de Santos pelo auxílio durante a coleta de dados.
À Profa. Dra. Patrizía R. Abdallah (FURG) pelo valioso auxílio quando estive em Rio
Grande para coletar dados. Muito Obrigada por ter aberto as portas do seu laboratório e
pela paciência em responder as minhas inúmeras dúvidas!
Ao Dr. Felippe A. Postuma pelas valiosas dicas e ajuda com os scripts do programa
“R”.
À Carolina Costa Araújo, pela paciência e colaboração inestimável na formatação das
referencias bibliográficas.
À querida equipe do LabPesq (IOUSP) que sempre torceram por mim e que
compartilharam momentos muito agradáveis e de muita cooperação durante esta jornada.
À Carol Siliprandi por todos os acolhimentos e pelo irrestrito apoio e constante
incentivo, que tanto me ajudaram ao longo desses anos de trabalho.
Aos professores e funcionários do IOUSP, os quais, sempre me atenderam com muita
paciência, gentileza e competência, e tornaram proveitosa a minha estada nesta casa de
ensino.

x
Ao meu querido marido Cristiano, aos meus queridos pais, José Lopes e Vera, e
minha irmã Gabi, por acolher, mimar e cuidar do meu bem mais precioso, a sapequinha
Anandi, quando precisei me ausentar para me dedicar integralmente às coletas de dados,
participação em congressos ou mesmo durante a escrita desta tese. Eu não sei o que seria
de mim sem vocês! Obrigada por todo o amor, incentivo, apoio, e por estarem ao meu lado,
incondicionalmente.
Por fim, obrigada a todos, que de alguma forma, e em alguma fase da minha vida,
proporcionaram a minha chegada até aqui!

xi
ABSTRACT In Brazil, economic data on fisheries are generally scarce, and difficult to interpret
with respect to costs and fishery viability, thus making it difficult to practice consistent
policy and industrial decision-making. This thesis aims to provide a cost-benefit
analysis of seventeen commercial fishing fleets that operated during 2013-2014 in
four port regions of the South Brazil Shelf: Angra dos Reis (AR), Santos and Guarujá
(SG), Itajaí and Navegantes (IN) and Rio Grande (RG). The fleet types included the
following: shrimp-trawlers, pair-bottom-trawlers, single-bottom-trawlers, bottom-
gillnetters, octopus-pots, purse-seiners, surface-longliners and pole-and-line. Based
on an unprecedented set of field survey data collected through interviews with vessel
captains and owners, this study has the following goals: (1) to describe, calculate and
compare the cost structure and gross profitability for all fleets; (2) to identify the
factors (e.g., technical features and economic indicators) that determine fleet gross
profit (from AR, SG and IN) using generalized additive models (GAMLSS); and (3) to
assess the net profitability and viability of the fleets through the following three
economic performance indicators: net profit margin (NPM), net present value (NPV)
and internal rate of return (IRR). Additionally, the effects of fuel subsidy policies on
profitability among South Brazil’s fleets were evaluated. Generally, operational costs
were higher than labor and fixed costs except for longliners, purse-seiners (from AR)
and bottom-gillnetters (from RG), whereas labor costs were higher or had the same
importance as operational costs. Fuel was the primary operational cost for all the
fleets except pair-bottom-trawlers (SG) and purse-seiners (AR), for which vessel
maintenance is the principal operational cost. Gross profitability varied significantly
among the fleets and was clearly related to the following main factors: fuel
consumption, vessel maintenance expense, ice costs, fish price and catch volume.
Particularly for trawlers (from SG and IN) and all purse-seiners, technical features
(i.e., vessel size and number of fishing trips, respectively) also explained profitability.
Moreover, landing cost was a significant factor for those fleets’ profit. Economic
performance indicators exhibited intra-fleet heterogeneity depending on region and
revealed that 24% of the fleets were unviable (NPV less than zero), 23% were in
fragile condition (IRRs and NPM lower than 11%), and 53% had achieved good
economic returns whose IRR values exceeded 12% and whose NPM was > 10%.
The worst economic performance was observed for single-bottom-trawlers (RG) and

xii
purse-seiners (SG) and the best for tuna-longliners (RG) and pair-bottom-trawlers
(SG). Overall, subsidies were ineffective in increasing Rio Grande fleet profits and
may be masking poor economic performance, primarily for single-bottom-trawlers
(RG). Findings should guide private-sector decisions on how to protect the economic
performance of the fleets, on fishery management measures (e.g., input controls,
recovery plans for overfished stocks), and improve current governmental programs
(e.g. the fuel subsidy program).
Keywords: economic indicators, fishing costs, economic viability, profitability of
fisheries, multi-fleet fishery approach, GAMLSS, fishing subsidy.

xiii
RESUMO No Brasil, os dados econômicos sobre as pescarias são geralmente escassos,
dificultando o conhecimento sobre os custos e viabilidade da pesca, tornando difícil a
prática de tomada de decisões políticas consistentes. Esta tese tem como objetivo
fornecer uma análise de custo-benefício de dezessete frotas de pesca comercial que
operaram durante 2013-2014 em quatro regiões da Plataforma Sul do Brasil: Angra
dos Reis (AR), Santos e Guarujá (SG), Itajaí e Navegantes (IN) e Rio Grande (RG).
Os tipos de frotas analisadas froam: arrasto de fundo duplo (camarões), parelhas,
arrasto de fundo simples, emalhe de fundo, pesca de potes (polvo), traineiras,
espinhel de superfície e pesca com vara-e-isca-viva. Com base em um conjunto sem
precedentes de dados de pesquisa de campo coletados através de entrevistas com
mestres e proprietários das embarcações, este estudo teve como objetivo: (1)
descrever, calcular e comparar a estrutura de custos e a lucratividade bruta das
frotas; (2) identificar os fatores (características técnicas e indicadores econômicos)
que determinam o lucro bruto das frotas (de AR, SG e IN) usando modelos aditivos
generalizados (GAMLSS); e (3) avaliar a lucratividade e rentabilidade líquida, e a
viabilidade das frotas por meio dos seguintes indicadores de desempenho
econômico: margem de lucro líquido (NPM), valor presente líquido (NPV) e taxa de
retorno interno (IRR). Além disso, os efeitos da política de subsídio ao combustível
sobre a lucratividade das frotas do sul do Brasil foram avaliados. Geralmente, os
custos operacionais foram maiores que os custos de mão-de-obra e custos fixos,
exceto para as frotas de espinhel de superfície, traineiras (de AR) e emalhe de fundo
(de RG), onde os custos de mão-de-obra foram maiores ou tiveram a mesma
importância que os custos operacionais. O combustível foi o principal custo
operacional para todas as frotas, exceto para as parelhas (SG) e as traineiras (AR),
para os quais a manutenção do barco foi o principal custo operacional. O lucro bruto
variou significativamente entre as frotas e esteve relacionada aos seguintes fatores:
consumo de combustível, despesas de manutenção de embarcações, custos com
gelo, preço do peixe e volume de captura. Particularmente para as frotas de arrasto
de fundo (de SG e IN), parelhas (SG) e traineira, as características técnicas (ou seja,
tamanho da embarcação e número de viagens de pesca, respectivamente) também
explicaram a lucratividade. Além disso, o custo com o desembarque foi um fator
significativo para o lucro dessas frotas. Os indicadores de desempenho econômico

xiv
apresentaram heterogeneidade intra-frota dependendo da região e revelaram que
24% das frotas estavam inviáveis (NPV inferior a zero), 23% estavam em
vulnerabilidade (IRRs e NPM inferiores a 11%) e 53% alcançaram bons retornos
econômicos cujos valores de IRR excederam 12% e o NPM foi > 10%. O pior
desempenho econômico foi observado para as frotas de arrasto-simples de RG e
para as traineiras de SG, e os melhores para os atuneiros (RG) e parelhas (SG). Em
geral, os subsídios foram ineficazes no aumento dos lucros das frotas de Rio Grande
e podem estar mascarando o baixo desempenho econômico, principalmente para a
frota de arrasto-simples. Os resultados apresentados podem ser utilizados para
orientar nas decisões do setor privado sobre como proteger o desempenho
econômico das frotas, as medidas de manejo da pesca (por exemplo, controles de
entrada, planos de manejo para recuperação dos estoques sobrepescados), e ainda
melhorar os programas governamentais atuais (por exemplo, o programa de
subsídio ao combustível).
Palavras-chave: indicadores econômicos, custos de pesca, viabilidade econômica,
rentabilidade das pescarias, abordagem multi-frota, GAMLSS, subsídios para a
pesca.

15
GENERAL INTRODUCTION 1. Introduction This thesis belongs to a research area on marine fisheries economics that
includes research in the fields of fisheries and marine sciences. Economics might be
defined as the study of how and why society (individuals or groups) makes decisions
regarding the use and distribution of resources (FIELD; FIELD, 2006). The use of
economic principles to study the extraction and use efficiency of natural resources,
such as fish stocks, are often categorized as part of natural resources economics,
which is an interdisciplinary research area in economics and thus includes fisheries
economics (CONRAD, 2010; ANDERSEN, 2013). The marine environment is a
natural resource system used by multiple individuals that generates finite quantities
of resources that which can be classified as common-pool (or common-property)
resources (OSTROM; GARDNER; WALKER, 1994). Although fishing resources are
categorized as a renewable resource and a common-property resource (BERKES,
1989), a fishery in which anyone can fish at any time and that is unregulated (i.e., an
open-access regime) is a common-property fishery. The absence of proprietary rights
in the marine environment may result in overexploitation of seafood stocks (MOREY,
1980; OSTROM, 2000; CONRAD, 2010). Thus, the decision to use this resource
today changes the quantity of this resource available to others in the future, and
scarcity generates the principal economic problem: the choice of one alternative to
the detriment of another that must be sacrificed (MOREY, 1980; CONRAD, 2010).
Fishery resources were not always considered potentially scarce resources.
Historically, seafood was considered plentiful in the environment. In 1497, John
Cabot’s crew reported that "the sea there is full of fish that can be taken not only with
nets but with fishing-baskets" (PRINGLE, 1997) and described cod shoals as "so
thick by the shore that we hardly have been able to row a boat through them"
(FRIEDMAN; MCNEILL, 2013). In 1883, Thomas Henry Huxley stated: "believe, then,
that the cod fishery, the herring fishery, the pilchard fishery, the mackerel fishery, and
probably all the great sea fisheries, are inexhaustible; that is to say that nothing we
do seriously affects the number of the fish. And any attempt to regulate these
fisheries seems consequently, from the nature of the case, to be useless." These

16
views were shared by many, including fisheries biologists as late as in the 1950s
(GORDON, 1954; MUNRO, 1992; MUNRO; SUMAILA, 2015).
From the 16th century, the technological development of fishing proceeded
rapidly, and larger, more powerful ships and different types of gear and onboard
processing equipment were introduced. This development, the lack of proprietary
rights for the natural resources, population growth and the demand for seafood
together resulted in an intense exploitation of fish stocks. When fishing efforts have
been excessive, the fish mortality rate as a result of such fishing has been higher
than the fish stock’s rate of recovery. This phenomenon was identified as the tragedy
of the commons by Hardin (1968). A natural resource is a common, i.e., a public,
good. Its exploitation is driven by self-interested persons who seek to privatize the
gain from the exploitation and to share the cost of such exploitation with society.
Because of the human tendency to exploit as much as one can before someone else
does, the establishment of regulation is essential (MOREY, 1980).
Fishing constitutes a complex socio-ecological system (SES) (OSTROM, 2009)
formed by the interaction of three other systems: 1) the natural system, which
includes the fishing resource, the ecosystem and the biophysical environment; 2) the
human system, which includes fishermen, consumers, the market / industry sector,
fishing communities and the social and economic environment; 3) management,
which includes plans, policies, management, development and research (CHARLES,
2008). In the study of complex social and ecological systems, such as fishing, the
study of these interrelationships and the possibility of integration between social and
natural sciences has produced promising results (MILLER et al., 2010; BERKES,
2011). Thus, the field of fisheries economics emerged to address issues such as
"How much, when and how should a resource be harvested today, and how should it
be allocated?" In the last decades, economics aspects have been added to
ecological and social aspects to provide a broader view of this complex system
(ANDERSEN, 2013).
2. Brief history of Fisheries Economics
Ideas regarding common property, open access and fishing licenses were first
presented in 1911 by economist Jens Warming in the paper “Rent of Fishing
Grounds” (SCOTT, 2011). In the early 1930s, Warming noted the loss of rent caused

17
by extending the common-property right and addressed the execution costs and
other aspects of the political economics of fisheries management (ANDERSEN,
1983). Subsequently, in 1940, the Canadian economic historian Harold Innis
published “The Cod Fisheries”. The large, detailed volume addressed the biology of
the cod stocks and fishing conflicts among nations. Most of the book’s economic
details concerned the impact of fish commerce and shipping and their regulation.
However, Innis showed little interest in the economic details of how the fishing effort
and changing techniques affected cod stocks (SCOTT, 2011). In the mid-1950s, D.
C. MacGregor explained in “The Economist Looks at the Oceans” (1949) how fishing
costs could be expected to increase in response to a change in stock size, and G.M.
Gerhardsen published in a Portuguese journal the paper “Production Economics in
Fisheries” (1952). At this time, economic questions were also being addressed by
marine biologists, a number of whom were engaged in advising government
agencies regarding licensing fishers and regulating fishing (SCOTT, 2011).
The first proper fisheries economist was Scott Gordon (MUNRO; SUMAILA,
2015). In 1954, he proposed the economic theory of the fishery as a common-
property resource to a wide audience of general economists. In this paper, Gordon
suggested that a fishing firm had to be managed to a different end, whereby existing,
biology-justified regimes should not be used in isolation. Soon thereafter, Anthony
Scott (1955) asserted that without intervention a common-property industry routinely
exploiting a given fish stock would not only employ more effort than required to
maximize static economic rent but also would fail to allocate effort and catch over a
span of years to maximize the stock's present value (SCOTT, 2011). Later,
mathematician Colin Clark introduced the theory of capital and the theory of
investment into the economic model of the fishery, an idea that dates to the 1970s
(MUNRO; SUMAILA, 2015). He established a clear and explicit link between the
economist’s model of the fishery and that of the biologist, thus constructing a bridge
between biology and economics. Major fisheries policy issues have arisen that can
only be analyzed with the aid of dynamics, i.e., capital theoretical, economic models
of the fishery (ANDERSEN, 2013).
Figure 1 presents the fundamentals of fishery bioeconomics using the
aggregate Schaefer–Gordon model. The primary purpose of this model is to show
how a fishery will likely operate given changes in stock and fishing effort (e.g., fleet
size). A secondary purpose is to suggest and analyze attempts to regulate fisheries

18
to obtain the desired level of effort (ANDERSON; SEIJO, 2010). The basic
components required to construct these models are as follows: number of vessels,
price of fish, total costs of harvesting, information on the biological parameters of the
fish stock (e.g., biomass and reproduction). In terms of total costs, it encompasses
fixed costs, variable costs and opportunity costs of labor and capital. Fixed costs are
independent of fishing operations (depreciation, administration and insurance costs),
whereas variable costs are incurred when fishers go fishing (fuel, bait, food, etc.).
Opportunity costs are the net benefits that could have been achieved in the next best
economic activity, i.e., other regional fisheries, capital investment or alternative
employment.
The reference points of the model are as follows: a) equilibriums open access
(OAY), which is not socially efficient because of its higher effort; and b) maximum
economic yield (MEY) and maximum sustainable yield (MSY), which represent
different fisheries objectives and are the basis on which suitable management
measures are identified.
Figure 1. Gordon-Schaefer model. From: HABIB, ULLAH, and DUY (2014).

19
Fisheries economics uses several theories from different fields to propose ways
of managing fisheries. However, the link between theory and reality in fisheries
managements is difficult in many cases because of the complexity of fishing biology,
interactions among environment and stock, uncertainties, fisherman behavior (i.e., its
economic, social and political aspects), government failures and for other reasons.
Thus, in recent years, fisheries economists have adopted complex dynamic
simulation models that are highly flexible and can be applied to different scenarios (to
analyze, for example, the consequences of various political objectives). Supplied with
biological, ecological and economic data, such models provide a means to influence
fishing management more effectively and in a manner that more closely reflects
reality (ANDERSEN, 2013).
One aspect that must be addressed concerns the cost structure and economic
indicators of fisheries. When these factors are well understood, they can be useful in
evaluating the consequences of fisheries management decisions and assessing and
monitoring the economic and social performance of fisheries (BRANCH et al., 2006;
LAM et al., 2011; DAURÉS et al., 2013). However, in most regions, production costs
remain poorly documented (LAM et al., 2011).
In Brazil, one of the first studies on fisheries economics was published by
Matsuura (1981), who investigated the economical yield of Brazilian sardine.
Subsequently, a small number of academic papers appeared that reported economic
data on marine small-scale fisheries, such as lobster and shrimp (CARVALHO et al.,
1996, 2000, 2003; SOUZA et al., 2009; AZEVEDO et al., 2014), bioeconomic models
and cost analysis for a few species (CASTRO; PETRERE; COMUNE, 2001;
LUCENA; O’BRIEN, 2005; PIO et al., 2016). However, studies that examine
production costs and economic data on fisheries are generally scarce in Brazil.
3. Study area: the natural and human fisheries systems
The study area corresponds to the marine environment of the South Brazil Shelf
Large Marine Ecosystem (SBSLME) (Fig. 2), which extends from 22°S to 34°S
(SHERMAN; HEMPEL, 2006; HEILEMAN; GASALLA, 2009). Large marine
ecosystems (LMEs) are oceanic regions that also include coastal areas and
estuaries and extend to the seaward boundaries of continental shelves and the
outside margins of the main ocean current systems. Distinctive bathymetry,

20
hydrography, productivity and biological communities characterize such extensive
marine ecosystems (BISCAL, 1995). The LME concept is being promoted worldwide
as a tool that will enable ecosystem-based management to use a collaborative
approach to resource management.
Figure 2. Location of the study area, South Brazil Shelf LME (in blue), in the coast of South
Brazil, in South America.
The South Brazil Shelf LME extends over 3 sub-areas: a) the South shelf (28°S-
34°S), b) the South Brazil Bight (23°S-28°S), and c) a slope and oceanic system. It is
bordered by the Brazilian states of Rio de Janeiro, São Paulo, Paraná, Santa
Catarina and Rio Grande do Sul (GASALLA, 2007; HEILEMAN; GASALLA, 2009).
Americas
Rio de Janeiro
AtlanticOcean
Paraná
Rio Grande do Sul
Santa Catarina
São Paulo
South Bra
zilShelf
LME

21
The types and abundances of the shelf’s marine resources are primarily determined
by the physical, oceanographic and climatic characteristics of these regions. Thus,
there is significant primary productivity between Cabo Frio and Angra dos Reis (RJ)
caused by seasonal upwelling of the South Atlantic Central Water (SACW) regime,
which is reflected in the abundance of other levels of the food chain, primarily pelagic
species (MATSUURA, 1995; MMA, 2006). The south shelf is favored by the
convergence of the Malvinas (Falkland) and Brazil currents, which extend north to
the state of Santa Catarina (OLSON et al., 1988; SEELIGER; ODEBRECHT;
CASTELLO, 1998). This mixing of these two major water bodies plays a key role in
the physical and biotic processes (CAMPOS et al., 2000) that support important fish
stocks and a considerable number of top predators (SEELIGER; ODEBRECHT;
CASTELLO, 1998).
Therefore, the South Brazil Shelf is considered important for the commercial
marine fishing sector. Due to the significant numbers of vessels and different fleets
that land at these sites (MMA, 2006; MPA, 2012), the South Brazil Shelf contributes
approximately half of Brazil’s commercial fisheries yield (273,392 tons in 2011).
According to the Union of Shipowners and Fisheries Industries of Itajaí and Its
Region (Sindipi), Santa Catarina is currently the largest state fishing producer (150
thousand tons in 2012) and industrial fishing park in Brazil (ROSA, 2014). The largest
commercial fishing pole in the state is located in the cities of Itajaí and Navegantes.
With approximately 600 large-scale vessels in operation and 3,016 employees
(ROSA, 2014), the cities together account for 86% of the state’s total production
(UNIVERSIDADE DO VALE DO ITAJAÍ, 2003). The production of Pará State is the
second largest in Brazil (87,509 tons in 2011), in the North Brazil Shelf.
Rio de Janeiro's production is the third largest in Brazil with 78,985 tons landed
in 2011 (MPA, 2012). The city with the highest production in the state is Angra dos
Reis with 26,823 tons, i.e., 34% of the total landed in the state (FIPERJ, 2011).
In contrast, the states of Rio Grande do Sul and São Paulo are currently
considered to have lower fisheries production than in past decades (RGP, 2015; IP,
2018). São Paulo achieved a landed volume between 20 and 30 thousand tons from
2009 to 2013 and is considered the eighth-largest Brazilian marine fish producer
(MPA, 2012). The lower fish production registered in São Paulo is attributed to
overfishing and the migration of many industrial vessels from São Paulo to Rio de
Janeiro and Santa Catarina (IP, 2018). São Paulo’s large-scale vessels primarily land

22
in the Santos and Guarujá regions, which together account for approximately 17
thousand tons of production per year, originating from the activity of 404 vessels and
1440 fishermen (IP, 2018). The city of Rio Grande is the primary fishing center in the
state of Rio Grande do Sul (RS) (KLIPPEL et al., 2005). In 2011, the total production
of commercial fishing in Rio Grande was 35,000 tons, and large-scale fishing
accounted for 80% of the total landed (IBAMA, 2012). There are also marine fisheries
in the state of Paraná. However, these fisheries are generally considered small-scale
(i.e., artisanal) with small vessels. In 2011, this state’s total production was
approximately 2 thousand tons (MPA, 2012).
A fishing fleet is an aggregation of fishing vessels of a particular region or using
particular gear, such as a purse-seine fleet. In the study area, the commercial fishing
fleets consisted of groups of vessels with highly varied characteristics depending on
area of operation, type of fishing gear and target species (MMA, 2006). These fleets
can be divided into two categories: coastal and oceanic (i.e., offshore fishing1). The
coastal fleet operates within the area of the continental shelf down to a depth of 100
m. The vessels use on-board mechanization to operate the fishing gear. Motor
propulsion is used, always with diesel engines. Electronic equipment is used for
navigation and fish detection. The hull can be constructed of wood or steel. The main
coastal fleets that operate in the study region are purse-seiners, shrimp-trawlers,
pair-bottom-trawlers and bottom-gillnetters. Appendix 1 shows the Portuguese
translation of each fishing category and more information about the fleets analyzed
by this study. The oceanic fleets consist of vessels of substantial autonomy that can operate
throughout the Exclusive Economic Zone2 (EEZ), including the more distant oceanic
areas. They possess highly sophisticated equipment for navigation and the detection
of fish shoals (FAO, 2010). Large pelagic longliners (primarily employed to catch
species such as tuna, swordfish and blue shark) and pole-and-line vessels comprise
the main oceanic fleets in the study region.
The main species caught by the commercial fleets of the south and southeast
coast are as follows: Brazilian sardinella (Sardinella brasiliensis), whitemouth croaker
(Micropogonias furnieri), argentine croaker (Umbrina canosai), weakfish (Cynoscion
1 offshore fishing is fishing in deep water and at some distance from land. 2 EEZ - extends no more than 200 nautical miles from the territorial sea baseline.

23
spp), penaidae shrimp, shortfin mako (Isurus spp), tuna (Thunnus spp), skipjack tuna
(Katsuwonus pelamis) and swordfish (Xiphias gladius) (FAO, 2010; FIPERJ, 2011;
IP, 2018) (Appendix 1). Sardine is the most important species, producing
approximately 100 thousand tons in 2013 and considered overfished (FAO, 2016).
The available knowledge on the level of sardine stock exploitation in the region is
deficient (CEMBRA, 2010). However, estimates confirm that in the S/SE region
approximately 40 percent of the assessed stocks are overexploited, while
approximately 20 percent are fully exploited (MMA, 2006).
4. Broad context of the thesis This study was part of the project Assessment of the socio-economic viability of
commercial fishing fleets operating in the Southeast and South of Brazil by means of
performance indicators funded by the Brazilian National Research Council (CNPq) -
Process 406614/2012. This project was designed to evaluate and compare the
socioeconomic viability and performance of the most important commercial marine
fishing fleets in the South Brazil Large Marine Ecosystem (SBLME). The project is led
by the University of Sao Paulo, with the collaboration of the University of Rio Grande
(FURG) and the University of British Columbia (Canada) and related partners. The
method of data collection, which is described in the following chapters, was
standardized and applied at the main fishing landing points along the entire south
and southeast coast between latitudes 22ºS and 32ºS.
Throughout this thesis, “Commercial Fishing” is used to refer to the harvesting
of fish (small-scale or large-scale fishing) and other seafood for commercial profit.
5. Thesis structure This thesis is the result of my previous study that aimed to provide a better
understanding of the cost structure and financial-economic performance of
seventeen commercial fishing fleets from Southeast and Southern Brazil. The
unprecedented set of field survey data generated by that study has enabled me to
reveal (unpublished) characteristics of the cost structure and financial-economic
performance of most of the analyzed fleets. This thesis is organized into three
chapters structured in manuscript-style. This may include one manuscript already

24
published (i.e., Chapter 1) and others submitted to peer-reviewed journals (i.e.,
Chapter 2).
In the first chapter, a set of indicators is used to describe, assess and compare
the cost structure and financial performance of four commercial fleets from the Rio
Grande (RS) region. The key factors that affect fishing costs and revenues are
analyzed together with a framework to standardize economic knowledge construction
for data-poor fisheries, such as South Brazil’s. Additionally, the effects of fuel subsidy
policies on profitability among the fleets are evaluated.
The second chapter analyzes the financial performance of the thirteen
commercial fleets that land their production in the port regions of Angra dos Reis,
Santos/Guarujá and Itajaí/Navegantes. Thus, based on cost and revenue data
obtained from field interviews, the key objectives of this chapter are as follows: (1) to
describe, calculate and compare the cost structures of the fleets; (2) to estimate and
analyze the profitability of the studied fleets in the short-term (i.e., gross profit, gross
profit margin and economic efficiency); and (3) to use a generalized additive model to
identify the factors (i.e., technical features and economic indicators) that determine
fleet gross profit margins (from AR, SG and IN).
The final chapter assesses the economic performance of all the studied fleets
from the four regions (i.e., Angra dos Reis, Santos/Guarujá, Itajaí/Navegantes and
Rio Grande), estimating their economic profitability and viability. Static (i.e., net profit
margin) and dynamic models (i.e., net present value (NPV) and internal rate of return
(IRR)) are used as the measurement criteria, and the fleets are classified into three
categories according to their profitability (i.e., good, vulnerable and bad) and viability
(i.e., very good, good, vulnerable and unviable).
Finally, the study sought to also suggesting some policy and fisheries
management advice aimed to protect both the economic performance of the fleets
and fisheries resources. This advice emphasizes the importance of economic data
collection and cost-benefit analysis to increase the efficiency of control measures. In
addition, the study underscores the specific results for the economic aspects of the
fleets that may help vessel owners identify the factors that influence profitability.
Thus, the study may facilitate the creation of measures to improve internal processes
of the fishing industry.

25
CHAPTER 1 - Harvesting costs and revenues: implication of the performance of open-access commercial fishing fleets
off Rio Grande, Brazil.
This chapter was published in Marine Policy 93 (2018) 104-112, doi: 10.1016/j.marpol.2018.04.008
26
CHAPTER 1 - HARVESTING COSTS AND REVENUES: IMPLICATION OF THE PERFORMANCE OF OPEN-ACCESS COMMERCIAL FISHING FLEETS OFF RIO GRANDE, BRAZIL.
ABSTRACT
In order to assess the performance of major commercial fleets, key factors
affecting fishing costs and revenues are provided along with a framework to
standardize economic knowledge construction in data-poor fisheries, such as South
Brazil’s. Additionally, the effects of fuel subsidy policies on profitability were further
evaluated among fleets. The unprecedented set of field survey data generated by
this study revealed that fuel consumption, fish price, and catch volume were the main
factors affecting profitability. Annual gross profit was positive for all fleets. Longliners
showed the highest gross profit margin (29%), while single-bottom-trawlers close to
unviability showed the lowest (0.9%). Overall, subsidies were innocuous at
increasing gross profits and may be masking the economic reality of fishing fleets.
Specific policy advice and management strategies aiming to protect both economic
performance and natural resources are highlighted, including the importance of
economic data collection and cost-benefit analysis to increase efficiency.�
Keywords: Financial performance; fishing subsidy; indicators; fisheries; multi-
fleet approach; operational cost.
1. INTRODUCTION
The contribution of economic analysis to the comparison of fishing fleet
performances, together with environmental and social approaches, have been
considered strategic to solving problems related to fishery mismanagement and
unsustainable practices (GASALLA et al., 2010; LAM et al., 2011). The burden of not
having this perspective represented in both management and policy outcomes is
widely recognized (HANNA, 2011; ANDERSON et al., 2015). However, for several
fishery systems, an economic performance analysis of the fleets has not been
performed (WALDEN, 2013). This is understandable because, in practice, data and
indicators of the socio-economic performance of commercial fleets have not been
made publicly available, and often not even to the scientific community (GASALLA et

27
al., 2010; WALDEN, 2013). Therefore, since the motivation for fishing is profit
(SUMAILA et al., 2008) knowledge of the economic dimension of fisheries can be
particularly useful to address policy questions regarding fishery management.
In Brazil, economic data on fisheries are generally scarce. This is possibly
because current fisheries statistics systems do not include economic data (i.e., costs
and profits) or evaluations of the economic performance and efficiency of fishing
fleets in public reports. The systematic collection and updating of the information
prioritizes data regarding the fishing effort and the landed production per species.
Nevertheless, academic research papers have been reporting economic data on in-
land fisheries (ALMEIDA; MCGRATH; RUFFINO, 2001; GLASER; DIELE, 2004;
CARDOSO; FREITAS, 2006), marine small-scale fisheries, such as for lobster and
shrimp (CARVALHO et al., 1996; CARVALHO; CHAVES; CINTRA, 2003; SOUZA et
al., 2009; AZEVEDO et al., 2014), bioeconomic models and cost analysis for a few
species (MATSUURA, 1981; CASTRO; PETRERE; COMUNE, 2001; LUCENA;
O’BRIEN, 2005; PIO et al., 2016a). According to Gasalla (2010), which was the first
broad study describing comparative multi-fleet analysis of socio-economic
performance indicators for commercial fishing fleets in Brazil, there is a need to build
on the suggested protocol for the standardized collection and analysis of economic
data. Regarding the fishing industry in Brazil, data on the economic performance of
fishing fleets, as explained by a detailed analysis of costs, benefits and profitability,
has, in most cases, been difficult to access and measure and has been notably
unavailable for multi-fleet comparison purposes (GASALLA, 2010).
In terms of subsidy policies for fisheries, there are at least 10 types in Brazil.
Ranging from incentives for ports facilities, capacity enhancing, and closures
compliance of small-scale fishers, to marketing, credit access, social security, and
operational ones (such as fuel), Ruffino and Abdallah (2016) estimated that about
25% of the subsidies provided to fishing activities in Brazil shows high risk potential
for contributing to overcapacity or overfishing. Nevertheless, a comprehensive
subvention program to oil price (BRAZIL, 2016) guarantees that the difference
between national and international diesel prices be equalized for maintaining
international trade. Thus, officially registered vessels (in IBAMA and port authority)
have a fuel tax waiver at the State level, plus a federal pecuniary aid (cash transfer)
for up to 25% of their fuel consumption per year (BRAZIL, 2010a) established as an

28
individual quota in litters (BRAZIL, 2010b). In practice, there is some vessels not
eligible for receiving the subsidy.
According to Abdallah and Sumaila (2007), this policy contributes to an increase
in catch without regard to knowledge on stock sizes, which tends to result in a
decline in the fishery resources because catches are not regulated. Moreover, a
central issue is that subsidizing fisheries without knowing their economic
performance may underestimate the real benefits of the subvention. This issue
becomes even more relevant, since the cost of fuel is significant in fisheries (CAMBIÈ
et al., 2012; WALDEN, 2013; CLAY; KITTS; SILVA, 2014; PIO et al., 2016) and the
appeal for its subsidy is constant in the fishing sector.
In addition, commercial fishing fleets in Brazil operate in an open-access regime
without input or output control by the Government, which restricts solely fish and
mesh size and the seasons for closure of a few resources. It is also well known that
the potential long-term benefits of open-access tends to weaken over time and can
create economic inefficiencies, besides unsustainable yields (WATERS, 1991).
From both the socio-economic and environmental perspectives, there are
significant differences between the fishery fleets, emphasizing the need for specific
studies to provide better knowledge, especially on financing and economics. Indeed,
the lack of fleet studies limits the ability to understand and manage these fisheries.
Another issue is the heterogeneity of the fleets in terms of vessel size and types of
fishing gears, which leads to a variety of economic, social and environmental impacts
that are rarely translated into financial terms or presented together in the form of a
cost-benefit analysis (CRILLY; ESTEBAN, 2013). Furthermore, before implementing
costly management systems, it may be appropriate to investigate the economic
efficiency of an open access fishery, and how the cost-benefit relationship behaves
(WALLIS; FLAATEN, 2000).
Based on these assertions, the purpose of the present study was to evaluate
the financial performance of the multi-fleet commercial fisheries of an open-access
regime in South Brazil, in terms of budget (cost and revenues), as well as the impact
of the government fuel subsidy policy on the profitability of these fleets.
Thus, the objectives of the present study are to (1) provide economic indicators
on the Rio Grande fishing fleets, including their cost structures and profits, and (2) to
present a methodology that may contribute to the organization (and collection) of

29
economic data from Brazilian fisheries currently inexistent. This knowledge was
applied to analyze and compare the economic performance of the different fishing
fleets, and to estimate, compare and discuss the cost of fuel and the effect of the fuel
subsidies policies on profitability, that might be useful for future regional management
plans.
1.1 Background
Commercial fishing in Rio Grande is economically relevant because it is the
main fishing center in the Brazilian state of Rio Grande do Sul. In addition, it is a
traditional activity that involves many stakeholders. Evidence, however, indicates the
decline of the industry, the number of active vessels, and the condition of
overexploitation of certain stocks in the region (PEREZ et al., 2002; HAIMOVICI;
IGNÁCIO, 2005; HAIMOVICI; CARDOSO, 2016). In the 1970’s, the Rio Grande
fishing involved 23 large fishing companies, and the catch reached a maximum of
105,000 tons. Currently, 16 companies are operating in the town and, the catch has
fallen sharply in recent decades and currently stands at approximately 35,000 tons
(IBAMA, 2012).
The causes of the declines may be related to outdated technology,
organizational structure and outdated management methods (VIEIRA et al., 2004).
Other important factors were fishing beyond the reproductive capacity of the species,
blocks on the reproduction of marine species, pollution levels, and external predation
in the economic zone of Brazilian territorial waters (SILVA et al., 2005). Between the
years 1991 and 2001, 290 vessels were active and landed at Rio Grande, and
approximately 10 years later, 266 were considered active in the region, and not all
vessels fish in the region every year-round (HAIMOVICI et al., 2006). The
commercial fishing in Rio Grande region are carried out by different fleets using a
wide variety of gear (e.g., trawls, longlines, gillnets) and catching primarily fish (with a
special emphasis on demersal species, swordfish, sharks and tuna).
Finally, the masters and fishers value their autonomy, resisting both the wage
labor system and long-term agreements with the industry, which predominantly
involves the payment of shares that are now calculated on the overall value of
production per fishing trip (DIEGUES, 1983). Thus, fishers are ‘copartners’ together
with the vessel owners and have no fixed salary. The individual salary is calculated
30
by subtracting the operational cost (fuel, ice, repairs, etc.) and the owner’s portion
(profit) from the gross revenue, while division between the crew is made in parts and
depends on their on-board functions (GASALLA et al., 2010). Furthermore, obtaining
information related to fishing activities in general, but particularly to economic data, is
extremely difficult. First, due to the dynamics of the vessels, which spend the majority
of their time at sea without a fixed date for their return to harbor, they often unload
their merchandise at private locations where access to data is restricted. Second, the
official data is incomplete, not collected regularly, and very often not made publicly
available. Lastly, it seems that there is a ‘secrecy pact’, principally among the vessel
owners and fishing companies, and there is a great deal of reluctance in making
information available and a widespread belief that it will be used against the sector.
2. METHODS
2.1. Data collection
The Rio Grande commercial fleet operating around Southern Brazil was
analyzed. A survey was conducted during 2013-2014 among the primary landing
points in the Rio Grande zone (Fig. 1.1). Key-informant, semi-structured personal
interviews with vessel captains and owners were used (GASALLA et al., 2010;
CAMBIÈ et al., 2012) to gather data related to the technical and fishing effort details,
costs, production data and ex-vessel price by species of the most recent fishing trip
(Table 1.1) by vessel and from four different fleets (bottom-gillnetters, surface-
longliners, pair-bottom-trawlers and single-bottom-trawlers). See in Appendix 1 the
translation of each fishing category from English to Portuguese language. The
questionnaire that was used had relatively little complex structure and required no
more than half an hour to be completed. This approach was applied because it
allows the economic situation of a fleet to be estimated when the official data is not
complete or not collected regularly, as is the case in Brazil. The interviews were
performed at three principal industries due to the significant numbers of vessels that
landed at these sites and that are currently considered representative of the regional
fisheries. Interviews were conducted between June 2013 and May 2014, completing
a total of 106 questionnaires covering the four fleet categories. However, as some
vessels were sampled more than once during the period, the interviews represent

31
22% of the active bottom-gillnetter vessels, 100% of the active longliner vessels, 39%
of active single-bottom-trawler vessels, and 34% of active pair-bottom-trawler
vessels. The number of potentially active vessels in the area was obtained from the
IBAMA (2012) and is shown in Table 1.2, as well as the basic technical
characteristics of the commercial vessels analyzed.
Figure 1.1. Location of the fishing port of Rio Grande (in dots), in the coast of South Brazil, in
South America.

32
Table 1.1. Attributes included in questionnaires for data-gathering interviews.
Attributes groups and collected data
Technical and effort – related data:
Vessel size (m)
Number of fishers
Number of fishing days by trip
Number of fishing trips by month
Fuel consumption (liters) per trip
Ice consumption (t) per trip
Yields:
Total catch per trip by species (in weight, t)
Ex-vessel price by species per trip (R$)
Costs (R$):
Fuel and lubricating oil (per trip)
Food (per trip)
Ice (per trip)
Landing (per trip)
Bait (per trip)
Vessel and gear maintenance (per trip)
Labor (per trip)
Fees and Taxes
A fixed percentage of the gross revenue is taken from each fishing trip for
vessels maintenance and repair. The results obtained on this from our surveys was
considered for that estimate (varying by vessel and fleet, but about 20% for
longliners, single-bottom-trawlers, and pair-bottom-trawlers and 16% for bottom-
gillnetters). Despite the maintenance of the vessels varying between fixed and
variable costs, this factor was only considered to be a variable cost within this study
because, considering the fishing operation, the vessels repair costs can be modified
depending upon the catch produced per trip. Therefore, according to those

33
interviewed, this amount is used to cover costs such as small repairs to the vessels,
equipment and fishing apparatus, as well as the costs involved in larger maintenance
work (the vessel itself and fishing equipment), the purchase of equipment and the
required annual inspections by the Port Authority.
However, it is assumed that the fixed costs comprise all the costs established
on land, since they remain unchanged independent of the catch volume.
Lastly, the annual diesel oil subsidy quotas were obtained based on official
reports (BRAZIL, 2015a, b, c) for individual vessels.
2.2. Data analysis
Average values were used to describe the cost structure of each fleet, as well
as the revenue per fishing trip, monthly and annually. To describe and evaluate the
financial performance of the fleets, a set of indicators was calculated, as follows.
- The average capital cost, also denoted as average capital investment (CI) of
the fishing vessels was estimated, including the initial cost of acquiring a fishing
vessel and all the equipment necessary to perform the activities. To establish the CI,
was asked each owner or captain the value of their vessel, gear and equipment
under the assumption that they had to sell it in its current condition at that time.
- Revenue (R) is the total catch value (ALMEIDA; MCGRATH; RUFFINO, 2001;
NGA, 2009). To compute the value of catch per trip quantities are multiplied by the
current price of fish (obtained from interviews to vessel owners and representatives
of the industry) for the respective quantities. R was calculated monthly and yearly
based on the original database (per fishing trip). The first represents the catch value
per trip multiplied by the average number of trips per month. Annual data was
calculated by multiplying the monthly values by the number of operating months (12
months).
- Operational costs (OC) include variable costs such as fuel, lubricating oil, ice,
food, bait, landings and also repairs to the vessel and gear maintenance. Costs per
month were based on the costs per trip multiplied by the average number of trips per
month. Annual data was calculated by multiplying the average monthly values by the
number of months that the fleet operated (12 months). To calculate the cost of fuel
per trip each observed vessel were considered as non-subsidized, and the average
market price of the diesel oil value was used for the city of Rio Grande and multiplied

34
by the amount of fuel (in liters) on the trip per vessel. This involves speculation about
how these vessels would have performed in the absence of the subsidies. The site of
the National Agency of Petroleum, Natural Gas and Biofuels - ANP was consulted to
establish the market price of diesel oil.
- Fixed costs (FC) included monthly and annual expenses for fees (social
security contribution), vessel tracking service, insurances (vessel and crew),
forwarding agents, and accountants. Data provided were per month and per year (not
per fishing trip).
- Labor costs (LC) includes all payments to crew, and are calculated on the
overall value of production per fishing trip. Thus, fishers are ‘copartners’ together with
the vessel owners and the labor cost is calculated by subtracting the OC (fuel, ice,
repairs, etc.) and the owner’s portion (profit) from the TR.
- Total costs (TC) were calculated using the sum of operational costs and fixed
costs.
Total Costs (TC) = OC + FC + LC
- Gross profit (before interest and taxes) is simply calculated as the total
revenue minus all expenses considered in this study (specifically operating, fixed and
labor costs).
Gross Profit = R – TC
- Economic efficiency (EE) (ALMEIDA; MCGRATH; RUFFINO, 2001) was
estimated by dividing the mean of the annual total revenue (total catch value) by the
mean of the annual total costs.
- Gross profit margin (%) (CARVALHO; CHAVES; CINTRA, 2003) was
calculated by finding the mean of the annual profit as a percentage of the mean of
the annual total revenue. The profit margin represents what is left to the vessel owner
as compensation for the capital as a percentage of sales, i.e., the total revenue.
Gross profit margin (%) = (Gross profit/R)*100
The profitability of the fleets was measure by gross profit margin (%) and gross
profit indicators, and the monthly gross profit and annual gross profit margin (%) were
used to compare the profitability of fleets.

35
Depreciation and the opportunity cost of labor and capital were not included in
the analyses because this study was not designed to be a full economic analysis of
the profitability of the fleets but instead as a financial indication of benefit and cost of
current operations fishing activity to those involved in the sector. Financial
performance is the measure of most interest to fishers, as it represents how much
income they are left with at the end of the year (PASCOE et al., 1996;
GUNNLAUGSSON; SAEVALDSSON, 2016).
Note that all costs and values are in Brazilian currency (Real, R$; conversion
rate of US$1.00 = R$2.23 on May 30, 2014).
The effect of fuel subsidies on profitability for each fleet was evaluated by (1)
separating subsidized and the non-subsidized vessels, and (2) calculating annual
fuel cost per vessel (diesel consumption from the database multiplied by liter price
minus tax waiver for subsidized vessels). However, in some cases, the fuel
consumption exceeds the subsidized quota (the percentual approved by law based
on a fixed consumption per vessel) and that surplus was multiplied by diesel market
price. Then, gross profit was estimate for both non-subsidized and subsidized
vessels, adding the federal pecuniary aid in the second case. Difference in annual
gross profit was tested using a two-sample (independent) t-test.
Significant differences between the monthly profitability and costs related to the
fishing operation per fleet were tested using the Kruskal–Wallis. If the Kruskal-Wallis
test revealed significant differences, then a posteriori pairwise comparisons were
conducted using a nonparametric multiple comparison procedure.
3. RESULTS
A summary of major characteristics of the four studied fishing fleets is shown in
Table 1.2. Longliners ranged from 22 to 28 m length (Table 1.2), with average
catches of 7.1 tonnes of fish per trip (Table 1.3), and with the highest target-stocks
ex-vessel prices/kg (i.e. tuna ranging R$ 22 and R$ 40). The other tree fleets
(bottom-gillnetters, single-bottom-trawlers and pair-bottom-trawlers) target croaker
and weakfish, ranking the lowest ex-vessel prices (i.e. R$ 1.81-2.20/kg). However,
they show differences on average catch, being 26.2 t/trip, 44.5 t/trip and 74.6 t/trip of
fish, respectively (Table 1.3).

36
36
Table 1.2. Major characteristics of the four studied fishing fleets based at three principal industries of the Rio Grande region, in the South Brazil Bight.
Fleet Gear Target-species Bycatch Range length
of vessel sampled (m)
Average number of
crew
Average duration of
fishing (days)
Number of active vessels (IBAMA, 2012)
Number of sampled vessels and percentage
in relation to the number of active
vessels
Bottom- gillnetters Bottom-gillnet
Micropogonias furnieri, Umbrina canosai,
Cynoscion guatucupa
Cynoscion spp, Urophycis spp,
Carcharhinus spp, Pomatomus saltatrix
15 - 26 8.9 15.1 46 10 (22%)
Tuna- longliners Surface longlines
Thunnus spp, Xiphias gladius, Isurus spp
Auxis thazard, Carcharhinus spp, Squalus spp, and
another 20 species.
22 - 28 9.3 10 5 5 (100%)
Pair-bottom- trawlers
Bottom-pair trawls
Umbrina canosai, Micropogonias furnieri, Cynoscion guatucupa
Over 77 species from 25 families. 17 - 25 13.4 16.9 50 17 (34%)
Single-bottom- trawlers Otters trawls Umbrina canosai,
Cynoscion guatucupa
Macrodon atricauda, Prionotus punctatus,
and another 40 species
20 - 27 6.1 16.7 31 12 (39%)

37
37
Table 1.3. Performance indicators per fishing trip, as monthly and annual mean values, by fleets in R$ and excluding the subsidies. (S.D: Standard deviation; EE: Economic efficiency; RR: rate of return profit; PP: investment payback period).
Bottom-gillnetters Longliners Pair-bottom-trawlers Single-bottom-trawlers Mean S.D. Mean S.D. Mean S.D. Mean S.D.
Capital investment 1,400,000 144,584 1,040,000 147,935 1,953,846 750,877 1,533,333 982,831
Per fishing trip: Catch (t) 26.2 11.7 7.1 3.3 74.6 37.7 44.5 27.1 Revenue 56,215 20,906 109,783 51,684 166,977 71,493 80,641 42,495 Operational Cost 27,266 7,104 40,415 12,550 93,846 34,265 68,886 14,905 Labor Cost 14,475 8,032 34,684 27,253 36,565 26,558 5,877 19,950 Fixed Cost 0 0 0 0 Gross profit 14,475 8,032 34,684 27,253 36,565 26,558 5,877 19,950 Monthly: Trips per month 1.48 0.34 2.27 0.72 1.56 0.38 1.70 0.69 Revenue 84,080 38,170 255,678 150,383 257,463 121,881 133,957 110,530 Operational Cost 39,731 12,832 86,711 30,722 142,153 45,828 114,727 58,641 Labor Cost 22,174 13,489 84,483 71,255 57,654 46,431 9,615 38,626 Fixed Cost 5,509 626.63 9,002 0 10,123 848.58 5,748 1,923 Gross profit 15,608 14,068 75,481 71,255 44,795 46,376 3,866 37,487 Annual: Revenue 1,008,965 458,042 3,068,140 1,804,600 3,089,557 1,462,579 1,607,486 1,326,368 Operational Cost 476,780 153,983 1,040,532 368,673 1,705,839 549,939 1,376,726 703,702 Labor Cost 266,092 161,869 1,013,804 855,069 691,858 537,542 115,380 463,517 Fixed Cost 116,212 7,519 108,030 0 164,203 11,651 101,581 24,583 Gross profit 137,208 168,821 905,774 855,069 527,655 536,019 13,799 450,004 Gross profit margin (%) 13.6 29.5 17.1 0.9 EE (R$) 1.22 1.42 1.21 1.01

38
3.1 Cost structure
The average capital cost of the four different fishing fleets is shown in Table 1.3.
Longliners showed the lowest total average investment (approximately R$ 1,153,000)
in contrast to the pair-bottom-trawlers whose initial investments required
approximately R$ 1,764,000. Pair-bottom-trawlers showed the greatest value of
capital cost due to the need of operating two vessels.
For the four fleet segments, the operational, labor and fixed costs varied in
nature and importance (Table 1.3). The operational costs were directly related to the
types of gears used, where pair-bottom-trawlers and single-bottom-trawlers showed
the highest operating costs, respectively (Fig. 1.2). Significant differences in
operational costs were found between fleets (c2= 58.592, df= 3, p< 0.001) and a
posteriori pairwise comparisons showed that pair-bottom-trawlers was significantly
higher operational cost compared with other fleets, except to single-bottom-trawlers.
Figure 1.2. Inter-fleet comparison of the relative importance of costs and gross profits, as estimated by month, excluding the subsidies.
Figure 1.3 shows the relative importance of each type of operational cost within
each fleet per fishing trip. Fuel was the primary cost for all the fleets, accounting for
60%, 48%, 36% and 35% of the total operational costs, excluding the subsidies, for
single-bottom-trawlers, pair-bottom-trawlers, bottom-gillnetters and longliners,
respectively. There are significant differences in fuel costs between the fleets (c2=
0
10
20
30
40
50
60
Bottom-gillnetters Longliners Pair-bottom-trawlers
Single-bottom-trawlers
Cos
ts a
nd P
rofit
s (%
)
Operational Cost
Labor Cost
Fixed Cost
Profit

39
70.37, df= 3, p< 0.0001), however no significant differences were found between
pair-bottom-trawlers and single-bottom-trawlers. The second largest operational cost
was vessel maintenance for all fleets.
Figure 1.3. Relative importance of operational costs within each fishing fleet as estimated per fishing trip, excluding the subsidies.
An inter-fleet comparison of all monthly costs and gross profit is shown in Fig.
1.2. Relatively higher operational and fixed costs were estimated for pair-bottom-
trawlers; however, this was not the fleet with highest profitability since relatively
higher gross profits were recorded for the longliners. Labor costs ranged from 6% to
49% and were lowest for single-bottom-trawlers. Labor costs were significantly
different between fleets (c2= 24.926, df= 3, p< 0.0001) and pairwise comparisons
found significant differences for the following groups: longliners vs. bottom-gillnetters,
longliners vs. single-bottom-trawlers, pair-bottom-trawlers vs. single-bottom-trawlers.
3.2 Financial performance
The profitability indicators (gross profit margin and EE) are shown in Table 1.3.
On average, the fleet that had the greatest gross profit margin, excluding the
subsidies, was the longliners followed by the pair-bottom-trawlers. However,
significant differences were found in the monthly gross profits for all fleets (c2=22.3,
df=3, p= < 0.05), where longliners were significantly more profitable than the bottom-
0 10 20 30 40 50 60 70 80 90 100
Bottom-gillnetters
Longliners
Pair-bottom-trawlers
Simple-bottom-trawlers
Operational costs (%)
Fuel and Oil Vessel maintenanceIce FoodLanding OthersBait

40
gillnetters and single-bottom-trawlers, but not for the pair-bottom-trawlers fleet, which
is more profitable than the bottom-gillnetters (Table 1.4). The longline fleet showed a
high gross profit margin (29.5%) and the opposite occurred with the single-bottom-
trawlers, which showed a very low gross profit margin (0.9%).
In terms of economic efficiency (EE), for every R$1 invested, longliners had an
income of R$1.40, and pair-bottom-trawlers and bottom-gillnetters had an income of
R$1.20 (Table 1.3). On the other hand, single-bottom- trawlers showed zero income
in relation to expenses (EE = R$1.00).
The results show that, in average, the annual gross profit for subsidized and
non-subsidized vessels was positive for all fleets (Table 1.5). However, when was
analyzed each trip separately, of the 106 fishing trips, 13% had negative returns. The
most negative return trips were carried out by non-subsidized vessels, mainly for the
single-bottom trawlers, where 44% of fishing trips have had negative returns. The
subsidized vessels were more profitable than the non-subsidized for pair-bottom-
trawlers and single-bottom-trawlers, and the difference in profitability was 8%, and
44%, respectively. The case of the bottom-gillnetter and longliner fleets were
reversed, non-subsidized vessels were 23% and 53% more profitable than
subsidized. However, annual gross profits were significantly different between
subsidized and non-subsidized vessels only for longliners (p-value= 0.003).
Table 1.4. A posteriori multiple comparison test of monthly gross profit by fleet. Number of observed differences. Asterisks indicate statistical significance.
Kruskal-Wallis test c2=22.3, df=3, p= < 0.05
Fleet Bottom- gillnetters Longliners Pair-bottom-
trawlers Simple-bottom-
trawlers Bottom- gillnetters 29.185* 19.029 9.776 Longliners 29.185* 10.156 38.962* Pair-bottom- trawlers 19.029 10.156 28.806*
Simple-bottom- trawlers 9.776 38.962* 28.806*

41
Table 1.5. Annual gross profit, fuel cost and diesel oil subsidy quotas (in R$) by fleet and by subsidized and non-subsidized vessels.
Bottom-gillnetters Longliners Pair-bottom-
trawlers
Simple-bottom- trawlers
Subsidies case Maximum gross profit (R$) 416,073 1,657,459 2,086,987 1,151,517 Minimum gross profit (R$) -151,707 12,172 -51,717 -780,283 Avarege gross profit (R$) 154,208 615,254 709,423 117,755
Average fuel cost (R$) 136,139 317,111 588,771 795,033
Average subsidy quota (R$) 36,059 62,561 139,070 101,171
Non-subsidies case Maximum gross profit (R$) 389,593 2,521,635 1,510,911 788,955 Minimum gross profit (R$) -132,460 -275,461 -209,300 -302,714 Avarege gross profit (R$) 201,412 1,480,767 543,543 65,462
Average fuel cost (R$) 154,890 294,330 887,218 720,469
4. DISCUSSION
The present study highlighted the importance of a standardized framework to
establish the economic knowledge construction for the fisheries of Brazil. In this
sense, the methodology and the list of basic data provided by this contribution (Table
1,1) can be considered representative of the general economic trend of regional
fleets, and may also be used as a reference for the development of strategies for
collecting, organizing, and analyzing fisheries economic data in Brazil. The recording
of the data of each fishing trip proved to be very illuminating by way of providing
evidence relating to the yielding of negative returns during some sampled fishing
trips, where the operational costs turn out to be higher than the total revenue.
Differences among the fleets were found in respect to costs and revenues
composition, as well as to financial profitability and efficiency. Negative returns per
trip had already been evidenced in previous studies for some pair-bottom-trawlers
from a close region (CASTRO; PETRERE; COMUNE, 2001). However, this has
never been evidenced for bottom-gillnetters, longliners, single-bottom-trawlers, and
pair-bottom-trawlers off South Brazil before.
42
Nevertheless, in average, profitability was positive for all the fleets in 2013-
2014, even in open access fisheries regime and when the fuel subsidies are
excluded. The annual gross profit margin (%) for the Rio Grande fishing fleet
presented here varied widely and may be considered high for longliners (29.5%)
fleets when compared with fleets of other regions of the world. Therefore, for the
national, large scale fleets in France, Portugal and Spain, the average gross profit
margin was 14.1%, 22.5% and 9.5% (STECF, 2015), respectively. On the other
hand, pair-bottom trawlers showed the second best financial performance because
have higher revenue (higher fishing efficiency and higher catches), despite their high
operating costs. However, catch volume seems to be the main factor influencing the
profitability of the trawlers studied, since even targeting the same species with
approximately the same ex-vessel price, they do not differ in operating costs. And
overall, the best financial performance of longliners can be related to their higher
fishing efficiency with target species showing high ex-vessel prices/kg.
How the gross profit margin reflects the percentage of revenue that a sector
retains as profit, the single-bottom-trawler fleet had the lowest efficiency (0.9%), and
can be compared with the demersal trawler fleets of France, Belgium and the UK,
generating a gross profit margin of 0.9%, 1.2% and 1%, respectively (STECF, 2015).
In this sense, this study suggests that the single-bottom trawlers are not
economically profitable, primarily due to high costs, low fish price (average R$ 1.81
per kg), and the decline of the fleet’s target-species, the Argentine croaker stock
(Umbrina canosai) and Whitemouth croaker (Micropogonias furnieri), already
considered overexploited in this region (HAIMOVICI; IGNÁCIO, 2005; PIO;
PEZZUTO; WAHRLICH, 2016). According HAIMOVICI and CARDOSO (2016), the
intense exploitation of the Argentine croaker stock over the last 40 years should
serve as a warning for the high risk of collapse of the second most important species
to the demersal fisheries in the region. One particularly important point is that the
primary targets of 95% of the active vessels in the region are the croaker and
weakfish species (IBAMA, 2012). Because it is a resource exploited by various
vessels belonging to different fleets (Table 1.2), there is no self-regulation of
expectations, thus requiring state action (the right of the public to participate in
fishing).
Overall, a good economic performance can encourage investment in fishing
(CAMBIÈ et al., 2012). In fact, the number of longliner vessels in the region has

43
increased in recent years (MAYER; ANDRADE, 2003), reflecting an investment in
this fishery primarily driven by the high international market price of swordfish
(Xiphias gladius), which is the target species of this fleet (MAYER; ANDRADE, 2005).
Indeed, the International Commission for the Conservation of Atlantic Tunas (ICCAT)
is concerned about the considerable increase in swordfish catches in the South
Atlantic (QUAGGIO et al., 2011), although the Brazilian government has
implemented rules aimed at regulating tuna and tuna-like fish (ICCAT, 2015). Thus,
the effect of overexploitation on future investment needs to be considered and
possibly limited, especially in profitable fisheries (CAMBIÈ et al., 2012).
Monitoring should be an important management action necessary for the
conservation of profitable fleets. Nevertheless, all other demersal resources caught
by other fleets studied here are poorly managed because the regulations, when they
exist, seem inadequate for the current status of the stocks (HAIMOVICI; CARDOSO,
2016, HAIMOVICI et al., 2006; PIO; PEZZUTO; WAHRLICH, 2016). The problems
associated with unregulated or pure open-access fisheries have generally been
recognized and relatively few fisheries around the world are subject to no
management at all (WARD et al., 2004). In fact, in an open-access regime, excess
capacity could occur under a harvesting strategy driven by profit maximization with a
consequent difficulty in achieving the long- term sustainability of the fishery (CAMBIÈ
et al., 2012). In this sense, the cost-benefit analysis should be considered together
with environmental and biological factors that characterize sustainability.
In this study, fuel was the principal cost component for all four fleet segments.
This is consistent with results from many fisheries around the world (TYEDMERS;
WATSON; PAULY, 2005; SUMAILA et al., 2008; NGA, 2009; LAM et al., 2011). Fuel
use varies considerably depending on the fishery (SUMAILA; CHEUNG; THE, 2007),
but in most cases, the passive gear segments suggested consistently lower
consumption, whereas mobile gear showed consistently higher fuel consumption
(THRANE, 2004; DAVIE et al., 2014). This was the case for the fleets analyzed here,
where pair-bottom-trawlers and single-bottom-trawlers that use mobile gear had the
highest fuel costs when compared to the fleets using passive gear, such as bottom-
gillnetters and longliners.
Indeed, with the rising cost of fuel, the decade between 2003 and 2013 saw oil
commodity prices climb by over 300% (EIA, 2012), the most important discussion
was about the profitability of fishing. However, oil prices tend to show great

44
fluctuations, and perhaps the implication of falling oil prices on natural resources
involves the likely increase in fishing pressure. Likewise, fuel subsidies deflate costs,
making more fishing possible unless the number of fishing trips or the catch be
restricted. In the case of the studied fleets, this does not occur because of the current
unmanaged regime, without any reference point of allowable catch and effort.
Surprisingly, no consistent evidence was found that the fuel subsidies policy
resulted in significant increase of gross profits in Rio Grande’s fleets, neither when
comparing subsidized and non-subsidized vessels. In this case, the fuel subsidy may
be masking some low gross profits, mainly for the single-bottom-trawlers, which may
aggravate the future economic performance of that fleet. Moreover, besides resulting
innocuous to increase fleets profitability, the subvention policy seems to give an
unfair advantage to more profitable vessels (e.g. longliners and pair-bottom-trawlers),
that do not show real difficulties in maintaining profit margin even when not receiving
the benefit (Tables 1.3 and 1.5).
This also raises the question on the social dimension of policy effects, since
economic analysis may also consider rent distribution aspects associated with
subventions. Thus, in order to eventually solve some equity issue when reviewing the
subvention criteria in place, the policy could rather be directed to the lowest
profitability vessels, aiming to guarantee more secure financial levels to those most
vulnerable ones. Also, it is clear that the fuel subsidy program generates more
benefits to vessel owners than to crew members, being the crew rent, in those fleets,
a result of a share which is based on fishing trips revenues minus operational costs,
and the subsidy cash transfer is not shared with crew.
Some authors argue that the discount of taxes on fuel for fisheries should not
be considered as a subsidy (e.g. SCHRANK, 2003; MARTINI, 2012) since in some
countries those taxes are allocated for the maintenance of terrestrial highways, and
thus would not apply for non-highway users such as the fishing fleets. However, in
Brazil, this discount should also be considered as a subsidy because all taxes
collected by the government are summed and treated together as a whole (before
distribution among the Federal State, the states, and the municipalities), to be
allocated to meet public services and broader social demands. Subsidies are often
intended to aid and support vulnerable sectors of economy during period of economic
problems, such as in the fishing sector. And subsidies holders may pressure
governments to maintain or increase subsidies, arguing that the catching cost is high.

45
However, in South Brazil, in addition to the fuel subvention, other types of capacity-
enhancing subsidies are applied, resulting in effort increases through artificially
increased profits, and obviously accentuating resource overexploitation (MILAZZO,
1998; RUFFINO; ABDALLAH, 2016). In this case, an effective control of fishing effort
(SCHRANK, 2003), and re-directing the “harmful subsidies” to “beneficial subsidies”,
could be strategies to promote a reduction of the negative effects of subsidies and
the long-term sustainability. Sumaila et al. (2010), for example, propose the idea of
programs towards improving methods for fish catching and processing, and
management organizations as beneficial subsidies.
Considering the condition of overexploitation of stocks in the studied region, the
sharp fall in the volume of the catch, and the closure of industrial plants, the adoption
of the fuel subsidy policy can stimulate a fisheries sector that has already been under
pressure because of its performance over the years. The subsidies remove the costs
from the market reality and create prices that are not in line with the scarcity of the
products. However, very often an increase in the operational costs of vessels cannot
be compensated by an increase in the fishing price (GULBRANDSEN, 2012) and, as
such, many countries have already recognized that their fisheries, besides being
ecologically unsustainable, are heading towards a lack of social and economic
sustainability (GASALLA et al., 2010; FERM, 2004).
Relating to the fleets surveyed, the labor cost is not linked to the number of
crew in each vessel, but rather to the value of the catch. The more profitable the
fleet’s catch, the greater the percentage of the net revenue that will be distributed
among the crew. Therefore, given the "share" system, the crews of the less profitable
fleets share the risks of nonprofitable fishing trips with vessel owners, leaving them
equally vulnerable to debt.
Lastly, while it is noted that economic data on Brazilian fisheries are scarce and
difficult to collect, some steps could be taken to improve this gap. It includes the
implementation of appropriate training to conduct the collection of cost data with or
by industry members and fishermen's associations, and the insertion of this data in
the current fisheries statistics systems and management. Such data should be
updated regularly and processed in a complete and reliable way, which could
encourage fisheries research organizations to use the economic performance
measures presented here.

46
5. CONCLUSION
Longliners and pair-bottom-trawlers were the most economically profitable
commercial fishing fleets in Rio Grande, while single-bottom-trawlers, operating in an
economically wasteful manner, were less profitable and close to being unviable. The
main factors affecting costs and gross profit were: fuel consumption, fish price, and
volume of catch. However, fishing effort (number of active vessels) the exploitation
status of target-stocks, and the lack of management are also indirect factors. Fuel
was the primary cost, and, as expected, costs were directly related to the types of
gear used-fleets using active catch methods showed higher operating costs than the
ones using passive methods.
This study revealed, for the first time in the region, that some fishing trips are
yielding negative economic returns. Nevertheless, on average, profitability was
positive for all fleets even when subsidies were not computed in the analysis.
Moreover, the effects of fuel subsidy policies have not shown significant statistical
differences on gross profits when these are compared between subsidized and
nonsubsidized vessels, such as single-bottom-trawlers, pair-bottom-trawlers, and
bottom-gillnetters. However, negative returns were more frequently seen in
nonsubsidized single-bottom-trawlers.
Overall, subsidies seem to mask the economic reality of regional fisheries, and
may aggravate the economic viability of the less profitable fleets. Besides being
innocuous in this case, applying subsidy programs to very profitable fleets (longliners
and pair-bottom-trawlers) under open-access conditions may promote the
intensification of fishing capacity.
In terms of a standardized framework to ground the economic knowledge
construction in Brazilian fisheries, lessons learnt included two facts: a) collecting and
analyzing attributes “by fishing trip” instead of using monthly or annual data is more
sensitive to evidence negative economic returns; b) the analysis of the average
values of profits and costs lacking proper statistical tests may result in errors without
clarifying the actual situation of vessel’s economic performance.
Finally, the implication of some findings relating to policy advice was explored.
Overinvestments made in different fleets targeting the same species may lead to
economic inefficiencies and should be avoided. Findings should guide decisions and
resolutions to ensure the profitability of regional fisheries, and in fishery management

47
measures (e.g input controls/fishing effort reduction, recovery plans of overfished
stocks). It also suggests the need of a revision of the fuel subsidy program in place in
South Brazil. In this regard, the study showed that it masks the profitability of the bad
performers fleets and have been applied to the vessels that are already rentable and
that should not need the subsidy, especially in comparison to the fleets in bad shape.
It should be mention that the current program seems to also promote an artificial
increase in revenues, and when applied to very profitable fleets that may be
operating in a scenario of overcapacity, overfished stocks, and open-access
conditions, may damage the overall fishery system.

48
CHAPTER 2 - Cost structure and financial performance of marine commercial
fisheries in the South Brazil Bight
This chapter was submitted by Fisheries Research

49
CHAPTER 2 - COST STRUCTURE AND FINANCIAL PERFORMANCE OF MARINE COMMERCIAL FISHERIES IN THE SOUTH BRAZIL BIGHT.
ABSTRACT
In Brazil, economic data on fisheries are generally scarce, and difficult to interpret
with respect to costs and fishery viability, thus making it difficult to practice consistent
policy and industrial decision-making. Financial performance was assessed, as were
the key factors affecting the fishing costs and profitability of the major fisheries fleets
that operated in three Southeast and South regions. Through an unprecedented set
of field survey data from 160 fishing vessels obtained during 2013-2014, we provide
a cost-benefit comparison between different fleets and landing sites. Three using
generalized additive models (GAMLSS) were explored to identify major factors
affecting gross profit. Fuel consumption, vessel maintenance expenses, revenue,
and volume of catch were the most statistically significant factors explaining gross
profit margin. For trawlers and purse-seiners, technical features such as vessel size
and the number of fishing trips explained profitability, respectively, while the landing
costs were significant to both types of fleet. Gross profits for trawlers also depend on
ice cost and fleet type. Large pelagic fisheries showed the highest gross profit, while
shrimp-trawlers, bottom-gillnetters and a purse-seining fleet showed the lowest profit,
close to unviability. Labor wages increase when the financial performance of fleets
improve; however, reduced productivity and high operational cost levels may
decrease the salaries. Specific policy advice and management strategies aiming to
protect both financial performance and natural resources are highlighted, including
the importance of cost-benefit analysis to help businessmen and vessel owners to
identify factors that influence fleet profitability, thereby facilitating the creation of
measures for increased efficiency.
Keywords: economic indicators; fishing costs; profitability; multi-fleet approach;
GAMLSS models.
50
1. INTRODUCTION
Fishing in marine waters supports social and cultural well-being and provides
sources of food and nutrition; moreover, it remains important for providing
employment and economic benefits for those engaged in this activity (FAO, 2016).
However, the benefits that fishery resources can provide will depend largely on how
well they are rebuilt and managed (SUMAILA et al., 2012).
The management of fisheries in order to enhance their sustainability has
primarily focused on the environmental aspect, i.e., conservation of the seafood
stocks, and technological issues (LUCENA; O´BRIEN, 2005). Nonetheless, fishing
behavior is largely driven by economic incentives (PASCOE et al., 1996), and in
recent decades, the social and economic aspects have been considered equally
essential (MUNRO; SUMAILA, 2015; ANDERSON et al., 2015). Furthermore, socio-
economic indicators of fisheries are important measures used to predict, explain,
monitor and evaluate the consequences and impact of the fishing management
decisions (BRANCH et al., 2006; DAURÉS et al., 2013), such as input control
(number and size of vessels, gear and mesh size, and temporal closures) and output
controls (size limits of the species and catch quotas).
In addition, economic data, such as fishing costs and gross revenue, play an
important role in understanding the economic viability of the fisheries (LAM et al.,
2011) and serve as useful information for subsidizing vessels, investors and fishing
incentive programs in decision-making. Thus, financial profitability could indicate the
degree of hardship faced by vessel operators; this is important for assessing the
livelihoods of fishermen, which is the most appropriate measure for indicating the
sustainability of the sector in the short term (BORRELLO et al., 2013).
The critical deterioration of the economic health of the world’s fisheries may be
connected to poor governance and is both a cause and a result of the biological
overexploitation. Thus, the knowledge of the economics of fisheries is fundamental to
build the economic sustainability indispensable to conserving and rebuilding fish
stocks and supports a consistent policy debate on fishery reform (ARNASON;
KELLEHER; WILLMANN, 2009).
However, just as the information on fishing costs and profitability are scarce and
incomplete in most countries (ARNASON; KELLEHER; WILLMANN, 2009; LAM et
al., 2011), in Brazil, the economic and financial performance of fisheries are still

51
poorly documented; there is an insignificant effort by government agencies to obtain
the economic data of fleets (GASALLA et al., 2010), and the fishers and vessel
owners are reluctant to provide complete information, especially for income,
subsidies and taxes. Therefore, this lack of data may be contributing to the
inexistence of economic studies with multi-fleet purposes. Despite these challenges,
Brazilian academic research papers have been reporting economic data for inland
fisheries (ALMEIDA et al., 2001; GLASER; DIELE, 2004; CARDOSO; FREITAS,
2006), marine small-scale fisheries such as for lobster and shrimp (CARVALHO et
al., 1996, 2000; SOUZA et al., 2009; AZEVEDO et al., 2014), bioeconomic models
and for a few species (CASTRO et al., 2001; LUCENA; O’BRIEN, 2005;
MATSUURA, 1981; PIO et al., 2016) and multi-fleet comparison (GASALLA et al.,
2010).
In this context, the present study provides an analysis of the financial
performance of the 13 commercial fleets operating in Southeast and South Brazil.
Thus, based on cost and revenue data obtained from field interviews, the key
objectives of this paper are as follows: (1) describe, calculate and compare the costs
structure of the fish fleets for Southeast and South regions; (2) estimate and analyze
the profitability of the studied fleets in the short-term (gross profit, gross profit margin
and economic efficiency); and (3) identify the factors (technical features and
economic indicators) determining fishing gross profit margins in the regions.
2. METHODS
2.1. Data collection
The aim of the survey was to collect information on the fishing behavior of the
fleet, as well as financial information (such as costs and earnings) for the 2013-2014
financial year. A survey was conducted among the primary landing points in three
regions of Southeast and South of Brazil, namely, Santos/Guarujá (SG),
Itajaí/Navegantes (IN) and Angra dos Reis (AR) (Fig. 2.1). Key-informant, semi-
structured personal interviews with vessel captains and owners were used to gather
data related to the technical and fishing effort details, costs and production data of
the most recent fishing trips (Fig. 2.2) by a vessel. The vessels were aggregated by
type and region (total of three home ports, SG, IN and AR), totaling 13 different

52
industrial and semi-industrial fleet categories: bottom-gillnetters (SG and IN), surface-
tuna-longliners (IN), octopus-pots (SG), pair-bottom-trawlers (SG), pink-shrimp-
trawlers (SG and IN), pole and line (IN), purse-seiners (SG, IN, AR), sea-bob-shrimp-
trawlers (SG), and dolphinfish-longliners (IN). This approach was applied because it
allows the economic situation of a fleet to be estimated when the official data are not
complete or not regularly collected, as is the case in Brazil. The interviews were
performed at principal industries and public landing terminals due to the significant
numbers of vessels that landed at these sites that are currently considered
representative of the regional fisheries.
Figure 2.1. Industrial fleets analyzed in the fishing ports of Angra dos Reis (AR), Santos/Guarujá (SG) and Itajaí/Navegantes (IN) (red dots) on the coast of the South Brazil Bight (SBB), in South America.

53
Data were collected from a random sample of 160 fishing vessels and 214
interviews. The total number of interviews is higher than the number of boats
sampled because some vessels were sampled more than once during the period.
Total vessels in operation, the number of vessels sampled and the number of
interviews per region and per fleet, are shown in Table 2.1. The number of potentially
active vessels was obtained from the PMAP (2013), RGP (2011), TAMAR Project
database (2013), and SINDIPI database (2013).
Vessel maintenance and repair were considered to be a variable cost within this
study because a fixed percentage of the revenue is taken from each fishing trip for
vessel repair and this cost can be modified depending upon the catch produced per
trip. Therefore, according to those interviewed, this amount is used to cover small
repairs to the boat and fishing gears, as well as the costs involved in larger
maintenance work (the boat itself and fishing equipment).
54
Figure 2.2. Attributes included in questionnaires for data-gathering interviews.

55
55
Table 2.1. Major characteristics of the nine studied fishing fleets based in the ports of Angra dos Reis (AR), Santos/Guarujá (SG) and Itajaí/Navegantes (IN), in the South Brazil Bight. Means are shown per fishing trip.
Fleet Gear Target-species Main bycatch Vessels length of
sampled (m) Crew number
(mean) Fishing days
(mean)
Vessels Number (2013)
Sample size (vessels)
Total number of interviews (survey)
AR IN SG AR IN SG AR IN SG AR IN SG AR IN SG AR IN SG
Bottom gillnetters
Bottom-gillnet
Micropogonias furnieri, Umbrina
canosai, Cynoscion spp.
Urophycis spp., Carcharhinus spp.,
Pomatomus saltatrix 18-24 8-19 7 6 26.6 12.8 86 65 11 12 11 26
Tuna longliners
Surface longlines
Xiphias gladius,Thunnus spp., Prionace
glauca
Auxis thazard, Isurus spp., and another 20
species. 17-23 9 18.3 31 6 6
Octopus-pots
Pots and traps Octopus vulgaris Slipper lobsters 14-22 6 12.6 18 13 17
Pair-bottom-trawlers
Bottom pair trawls
Micropogonias furnieri, Umbrina
canosai, Cynoscion spp.
Over 77 species from 25 families. 18-30 9 12.9 9 7 16
Pink-shrimp-trawlers
Double otters trawls
Farfantepenaeus spp.
More than 165 fish species,35
crustaceans, and 25 mollusks.
15-23 16-26 4 5 23.4 18.5 86 74 12 19 12 34
Pole-and-line
Hooked line attached to
a pole
Katsuwonus pelamis
Thunnus spp., Pelagic sharks 18-28 25 16.3 24 4 4
Purse-seiners
Purse-seiners
Sardinella brasiliensis
Chloroscombrus chrysurus,Trachurus lathami, Mugil spp.
14-28 23-33 19-27 17 18 16 1.2 3.1 3 30 56 75 15 16 10 15 17 14
Sea-bob-shrimp-trawlers
Double otters trawls
Xiphopenaeus kroyeri
80 fish species, more than 20 crustaceans, and mollusk species.
6-15 3 11.4 233 27 34
Dolphinfish longliners
(from Itaipava)
Surface longlines
Coryphaena hippurus
Thunnus spp., Pelagic sharks 13-20 6 11.5 91 8 8

56
2.2. Data analysis Average values and their associated relative standard error were used to
describe the cost structure of each fleet, as well as the revenue per fishing trip,
month and year of three regions. The mean value takes into consideration the
number of observations within each fleet. To describe and evaluate the financial
performance of the fleets, a set of indicators was calculated. Key financial indicators
are the level of average capital cost, revenue, operational costs, labor costs, fixed
costs and gross profit.
The average capital cost, also denoted as average capital investment (CI), of
the fishing vessels was estimated, including the initial cost of acquiring a fishing
vessel and all the equipment necessary to perform the activities. To establish the CI,
we asked each owner or captain the value of their vessel, gear and equipment under
the assumption that they had to sell it in its current condition at that time.
Revenue (R) is the total catch value and was calculated from the catch per
species, in kilograms, multiplied by the respective ex-vessel price. The information on
the quantity captured and the price refers to the last trip.
Operational costs (OC) include variable costs such as fuel, lubricating oil, ice,
food, bait, repairs to the vessel and gear maintenance (between 5 to 25% of the
revenue, depending on the vessel), as well as landings costs. Costs per month were
based on the costs per trip multiplied by the average number of trips per month.
Annual data were calculated by multiplying the average monthly values by the
number of months that the fleet operated, and these data can be different for each
fleet (i.e., some target species are managed through the application of closed fishing
seasons). To calculate the cost of fuel per trip, the average market price of the diesel
oil value was used and multiplied by the amount of fuel (in liters) on the trip per
vessel. The site of the National Agency of Petroleum, Natural Gas and Biofuels -
ANP was consulted to establish the market price of diesel oil. Landing cost
corresponded to the fees paid by the vessel when the catches are landed and is
influenced by the total volume of the landing. This rate may vary depending on the
landing point and may be null in some cases.
Labor costs (LC) include all payments to crew, and involves the payment of
shares that are calculated on the overall value of production per fishing trip. Thus, the

57
labor cost is calculated by subtracting the operational cost (fuel, ice, repairs, etc.)
from the revenue, and the crew receive 50% of the net value of landings.
Fixed costs (FC) included monthly and annual expenses for fees (social security
contribution), vessel tracking service, insurance (vessel and crew), forwarding
agents, and accountants.
Total costs (TC) were calculated using the sum of operational costs, labor costs
and fixed costs.
Gross profit (GP) (or EBITDA: earnings before interest, taxes, depreciation and
amortizations) is simply calculated as the revenue minus all expenses considered in
this study (specifically operating, fixed and labor costs).
The following indicators were calculated using the annual mean of the indicators
described above.
Economic efficiency (EE) was estimated by dividing the mean of the annual
revenue (total catch value) by the mean of the annual total costs.
Gross profit margin (%) was calculated by finding the mean of the annual gross
profit as a percentage of the mean of the annual revenue. The gross profit margin
represents what is left to the vessel owner as compensation for the capital as a
percentage of sales, i.e., the revenue.
Depreciation and the opportunity cost of labor and capital were not included in
the analyses because this study was not designed to be a full economic analysis of
the profitability of the fleets but instead as a financial indication of benefit and cost of
current operations fishing activity to those involved in the sector. Financial
performance is the measure of most interest to fishers, as it represents how much
income they are left with at the end of the year (PASCOE et al., 1996;
GUNNLAUGSSON; SAEVALDSSON, 2016).
Note that all costs and values are in Brazilian currency (Real, R$; conversion
rate of US$ 1.00 = R$ 2.23 on May 30, 2014).
To compare data relating to the gross profits and costs of fleets, we prioritize
the use of monthly and annual values because the number of trips per month was
considered in the calculation, and thus, we can better represent the costs and profits
from the fishing operations. A better measure of the financial performance of the
fleets was the “Gross profit margin (%)” and “Gross profit”, and these indicators were
used to compare the profitability of the fleets, as they show how large a proportion of
revenue was left after tall costs have been accounted.

58
Both gross profit margin and monthly costs related to the fishing operation (bait,
food, fuel, ice, landing, others cost, and vessel maintenance) per fleet were tested for
normality using a Shapiro–Wilk test. Because data were found to violate the criteria
for normality, the non-parametric Kruskal–Wallis test (ZAR, 1996) was applied to test
the significant differences between the profitability of the fleets and between the
costs related to the fishing operation (excluding the fixed costs) per fleet. From this
comparison, the statistical software provides a value known as the p-value. If the p-
value is less than 0.05, then it can be stated with a 95% level of confidence that
significant differences exist in the value of the variable between the groups. If the
Kruskal-Wallis test revealed significant differences, then a posteriori pairwise
comparisons were conducted using a nonparametric multiple comparison procedure.
All statistical tests were considered at a 0.05 level of significance.
2.3. Generalized additive models
Statistical models are often used to test different complex relations among
variables and states. Generalized Additive Models for Location, Scale and Shape
(GAMLSS) were used to investigate the main factors that interact with profitability of
the industrial fleets operating in Southeast and South regions. The proposition on
GAMLSS is to be a method to adjust any type of regression model for various types
of distributions, such as Binomial, Poisson, Binomial Negative, Exponential, Normal,
Gamma, Gumbel, Weibull, and others. GAMLSS approach overcomes some
limitations of the Generalized Linear Models (GLM) and the Generalized Additive
Models (GAM), and the premise that the response variable belongs to the
exponential family is relaxed and replaced by a more general distribution family
(RIGBY; STASINOPOULOS, 2005).
GAMLSS were implemented using a series of packages in R (R Development
Core Team, 2013) downloaded fromhttp://www.gamlss.org. The GAMLSS procedure
was used with a cubic spline smoothing function (cs) (STASINOPOULOS; RIGBY,
2007).
Thus, three models were analyzed separately. The first one considered all fleets
and was used to determine the level of significance of the response economic
variable (gross profit margin) with the factors of operational costs (fuel, lubricant, ice,
food, vessel maintenance [Vm], landing and other costs), fixed costs (social security

59
[Ss], vessel tracking service and accountants), and technical/operational
characteristics of the vessels (fleet segment [fleet], vessel size [Vs], number of trips
per month [Tm] and region of landing [port]). However, the second and third model
considering only the data of purse-seiners and trawlers (shrimp-trawlers and pair-
bottom-trawlers), respectively, and the level of significance of the response economic
variable (gross profit) with the factors of operational costs, and technical/operational
characteristics of the vessels.
The variance inflator factor (VIF) was used to test collinearity between variables
in the GAMLSS (MONTGOMERY; PECK, 1992). Values greater than 3 printed by the
function VIF^[1/(2*df)], where df is the degrees of freedom, indicated collinearity;
thus, these variables were excluded from the analysis following the recommendation
made by Zuur et al. (2010).
The best fitted models were selected based on the Akaike Information Criterion
(AIC) statistic, at the running of the stepAIC function. The significance of each term
was assessed using the “drop1” function, and their relative importance assessed
accordingly to the AIC, likelihood-ratio test (LRT) and probability of the Chi-squared
test criteria (PrChi) obtained (STASINOPOULOS; RIGBY, 2007). A Gumbel
probability distribution was selected for the examination of the response variable for
gross profit margin and a normal probability distribution for gross profit.
3. RESULTS 3.1. Fleet characteristics Table 2.1 shows the main features of each fleet, such as fishing gear, target
species, technical and operational characteristics, number of active vessels per
region, as well as the number of vessels sampled and the total number of interviews
per fleet and region. The shrimp-trawler, bottom-gillnetter and purse-seiner fleets are
the largest in terms of the number of active vessels. Sea-bob-shrimp-trawlers have
smaller boats. The size and type of gear usually determined the crew size, the pole-
and-line fleet had the largest crew since more hands are required to operate that
gear, followed by the purse-seiner.

60
3.2. Costs structure The average costs varied quite a lot across the fleets (Tables 2.2, 2.3 and 2.4),
though the operating cost represented the largest charge for all fleets, except
dolphinfish-longliners (IN), purse-seiners (AR), and tuna-longliners (IN) where the
labor cost was higher or has the same relative importance than operational cost (Fig.
2.3). Labor cost was collinear with revenue, gross profit and catch (t) (Fig. 2.4), and
varied widely accordingly for each fleet segment. This variation was also influenced
by value (ex-vessel price) and volume of the catch and the total operational costs,
consequently because the labor salary is calculated by subtracting the operational
cost (fuel, ice, repairs, etc.) from the revenue and the crew receive 50% of the net
value of landings. Thus, fishers are ‘copartners’ together with the vessel owners. On
average, fuel was the main operational cost for all the fleets, except for pair-bottom-
trawlers (SG) and purse-seiners of AR region, where vessel maintenance is the
principal operational cost (Fig. 2.5). Fuel cost may account for approximately 54% of
the operating costs for shrimp-trawlers, and between 42% and 48% for purse-seiners
of IN and SG regions, respectively (Table 2.3 and 2.4). However, when the Kruskal–
Wallis test (ZAR, 1996) was applied, fuel cost was only significantly higher than the
other operating costs (p<0.05) for purse-seiners (SG) and pole-and-line fleets. For all
other fleets, fuel and vessel maintenance costs have the same importance, except
for purse-seiners (IN), where fuel and landing were the main costs, and fuel and ice
(Appendix 2) for purse-seiners (AR).
Significant differences in operational costs were found by pole and line (c2 =
16.541, df = 6, p = 0.01); however, the paired test did not identify differences.

61
Table 2.2. Performance indicators estimated per fishing trip, month and year (in Brazilian Reais, R$) for the purse-seiners of Angra dos Reis (S.D: Standard deviation; EE: Economic efficiency).
Estimated values Purse-seiners Mean S.D. Capital cost 2,550,000 1,217,433 Per fishing trip: Catch (t) 39.73 21.03 Revenue 42,024 21,523 Operational Cost 14,900 5,224
Labor Cost 13,562 9,261 Fixed Cost Gross profit 13,562 9,261
Monthly: Trips per month 12.13 3.44 Revenue 535,087 321,204 Operational Cost 180,434 77,336
Labor Cost 177,327 128,498 Fixed Cost 6,074 2,057 Gross profit 171,253 128,069 Gross Profit margin (%) 41.9 17.5
Annual: Revenue 3,745,611 2,248,429 Operational Cost 1,263,038 541,349
Labor Cost 1,241,287 899,488 Fixed Cost 72,896 24,682 Gross profit 1,168,391 894,471 EE (R$) 1.38 0.19

62
62
Table 2.3. Performance indicators per fishing trip, as monthly and annual mean values, in R$ by fleets of Santos/Guarujá (S.D: Standard deviation; EE: Economic efficiency). Bottom gillnetters Octopus-pots Pair-bottom trawlers Pink-shrimp-trawlers Purse-seiners Sea-bob-shrimp
trawlers Mean S.D. Mean S.D. Mean S.D. Mean S.D. Mean S.D. Mean S.D.
Capital cost 300,000 65,137 741,176 176,985 1,156,250 109,354 793,000 479,748 1,958,333 458,188 215,196 111,524 Per fishing trip: Catch (t) 3.28 2.00 3.01 1.51 31.28 10.33 5.50 5.70 20.67 10.25 1.92 1.57 Total Revenue 27,149 49,341 40,900 19,652 161,970 52,452 66,565 49,858 22,639 12,562 13,508 10,940 Operational Cost 12,182 10,779 22,941 10,365 72,621 13,977 44,950 29,222 13,320 4,496 8,254 6,468 Labor Cost 4,105 4,721 6,185 6,669 44,674 20,854 10,807 14,479 4,659 5,476 2,711 2,737 Profit 4,105 4,721 6,185 6,669 44,674 20,854 10,807 14,479 4,659 5,476 2,711 2,737 Monthly: Trips per month 2.43 0.55 1.91 0.26 1.81 0.25 1.56 0.49 6.36 1.19 2.76 1.86 Total Revenue 44,314 27,672 65,850 37,526 292,699 103,211 96,248 68,546 142,822 68,725 27,978 13,900 Operational Cost 24,105 9,743 41,109 21,525 131,176 28,608 63,856 32,148 83,882 25,892 17,185 8,095 Labor Cost 10,104 11,607 12,371 11,988 80,762 40,191 16,196 22,546 29,470 29,606 5,396 4,648 Fixed Cost 2,468 533 3,338 0 4,511 689 3,761 1,128 6,345 0 1,730 819 Gross Profit 7,636 11,636 9,033 11,988 76,250 39,913 12,435 22,525 23,124 29,606 3,643 4,274 Gross Profit margin (%) 7.67 19.37 13.21 13.39 24.96 4.39 11.64 12.18 11.84 11.99 9.16 14.84
Annual: Total Revenue 531,764 332,066 790,200 450,307 3,512,387 1,238,534 866,236 616,916 999,759 481,075 251,806 125,102 Operational Cost 289,258 116,911 493,306 258,305 1,574,109 343,291 574,703 289,333 587,175 181,244 154,666 72,863 Labor Cost 121,253 139,278 148,447 143,851 969,139 482,290 145,766 202,917 206,292 207,242 48,570 41,838 Fixed Cost 29,630 6,399 40,065 0 54,144 8,263 45,130 13,536 76,155 0 15,578 7,376 Gross Profit 91,623 139,634 108,382 143,851 914,995 478,960 100,637 202,773 130,137 207,242 32,794 38,470 EE (R$) 1.12 0.24 1.17 0.16 1.33 0.08 1.07 0.18 1.11 0.17 1.12 0.17

63
63
Table 2.4. Performance indicators per fishing trip, as monthly and annual mean values, in R$ by fleets of Itajaí/Navegantes (S.D: Standard deviation; EE: Economic efficiency). Bottom-gillnetters Tuna longliners Pink-shrimp-
trawlers Pole and line Purse-seiners Dolphinfish longliners
Mean S.D. Mean S.D. Mean S.D. Mean S.D. Mean S.D. Mean S.D. Capital cost 1,187,500 398,591 2,333,333 666,667 692,857 149,045 2,233,333 3,997,708 3,352,941 2,854,969 391,250 176,185 Per fishing trip: Catch (t) 22.95 11.62 19.18 6.06 8.22 6.86 61.45 27.46 30.22 19.92 7.20 2.68 Total Revenue 87,409 38,534 203,780 78,793 104,072 85,809 185,760 60,373 44,333 25,082 49,388 16,953
Operational Cost 50,614 10,224 74,754 25,548 57,313 31,420 101,646 35,902 22,982 13,829 15,782 9,474 Labor Cost 18,398 15,567 64,513 35,484 23,379 32,323 42,057 24,274 10,675 8,357 16,803 6,793 Profit 18,398 15,567 64,513 35,484 23,379 32,323 42,057 24,274 10,675 8,357 16,803 6,793 Monthly: Trips per month 1.00 0 1.33 0.41 1.17 0.39 1.6 0.48 9.4 3.5 2.5 1.1 Total Revenue 87,409 38,534 277,760 160,811 107,672 83,637 287,138 77,679 354,367 165,796 122,025 62,157 Operational Cost 50,614 10,224 95,296 26,829 60,566 30,815 162,126 67,789 179,522 65,268 37,903 20,996 Labor Cost 18,398 15,567 91,232 70,498 23,553 32,201 62,506 36,152 87,422 67,949 42,061 25,733 Fixed Cost 4,344 729 4,728 324 3,729 356 6,598 2,044 7,995 4,103 646.67 29.44 Gross Profit 14,053 15,743 86,504 70,432 19,823 32,224 55,908 36,363 79,427 69,467 41,414 25,742 Gross Profit margin (%) 10.88 16.06 27.38 8.81 9.88 15.57 19.43 9.95 18.52 11.43 33.16 6.44
Annual: Total Revenue 1,048,909 462,414 3,333,120 1,929,727 969,054 752,737 3,445,650 932,145 2,480,574 1,160,577 610,125 310,787 Operational Cost 607,365 122,689 1,143,551 321,953 545,099 277,341 1,945,506 813,471 1,256,655 456,876 189,517 104,981 Labor Cost 220,772 186,801 1,094,785 845,974 211,977 289,816 750,072 433,821 611,959 475,644 210,304 128,666 Fixed Cost 52,434 8,716 57,028 4,324 44,752 4,282 79,175 24,523 95,948 49,246 7,910 366 Gross Profit 168,339 188,919 1,037,757 845,013 167,224 290,095 670,897 436,356 516,011 494,740 202,394 128,772 EE (R$) 1.14 0.19 1.39 0.16 1.12 0.20 1.26 0.14 1.22 0.18 1.51 0.14

64
Figure 2.3. Inter-fleet comparison of the relative importance of costs, as estimated by month.
50%
71%
65%
70%
50%
70%
69%
76%
61%
72%
47%
69%
66%
48%
22%
32%
25%
49%
27%
27%
19%
37%
22%
52%
25%
28%
0% 20% 40% 60% 80% 100%
Tuna-longliners (IN)
Sea-bob-shrimp-trawlers (SG)
Purse-seiners (IN)
Purse-seiners (SG)
Purse-seiners (AR)
Pole and line (IN)
Pink-shrimp-trawlers (IN)
Pink-shrimp-trawlers (SG)
Pair-bottom-trawlers (SG)
Octopus-pots (SG)
Dolphinfish-longliners (IN)
Bottom-gillnetters (IN)
Bottom-gillnetters (SG)
Total cost (%)
Operational Cost Labor Cost Fixed Cost

65
Figure 2.4. Monthly indicators for all sampled fleets. Labor cost as a function of (A) total revenue and profit and (B) catch (ton).
R² = 0,754
0
50
100
150
200
250
300
350
400
450
0 100 200 300 400 500 600 700 800 900 1000 1100
Labo
r cos
t (R
$ in
thou
sand
s)
Catch (ton)
A))
B))

66
Figure 2.5. Average operational costs within each fishing fleet as estimated per month and per region, Angra dos Reis (AR) Santos/Guarujá (SG) and Itajaí/Navegantes (IN).
0 20 40 60 80 100 120 140 160 180 200
Tuna longliners (IN)
Sea-bob-shrimp- trawlers (SG)
Purse-seiners (IN)
Purse-seiners (SG)
Purse-seiners (AR)
Pole and line (IN)
Pink-shrimp-trawlers (IN)
Pink-shrimp- trawlers (SG)
Pair-bottom- trawlers (SG)
Octopus- pots (SG)
Dolphinfish longliners (IN)
Bottom-gillnetters (IN)
Bottom- gillnetters (SG)
Operational costs (in thousands R$)
Fuel Vessel maintenance Food Ice Landing Oil Others Bait
67
3.3. Profitability Revenues are determined by the interaction between the catch (t) and ex-
vessel prices of species (Tables 2.2, 2.3 and 2.4). Tuna longliners (IN), pink-shrimp-
trawlers (SG and IN) and octopus-pots (SG) caught the highest target-stocks ex-
vessel prices/kg, at R$ 10/kg, R$ 12/kg and R$ 13/kg, respectively (Tables 2.3 and
2.4). In the case of the purse-seiners, the ex-vessel price of sardines and the fish
catch per trip varied between the regions of AR (40 t and R$ 1.06/kg), IN (30 t and
R$ 1.47/kg) and SG (20 t and R$ 1.10/kg) (Tables 2.2, 2.3 and 2.4).
The results show that, on average, the gross profit was positive for all fleets.
However, when we analyzed each trip separately, of the 214 fishing trips, 9.8% had
negative returns. Fishing trips with negative returns were greater for the
Santos/Guarujá region and for trips carried out by shrimp-trawlers, mainly the sea-
bob-shrimp-trawlers, where 18% of fishing trips have had negative returns (see the
standard deviation in Tables 2.3 and 2.4).
The profitability indicators (gross profit, gross profit margin, and EE) are shown
in Tables 2.2, 2.3 and 2.4. Significant differences were detected in the annual gross
profit margin inter-fleet (c2 = 61.727, df = 12, p = < 0.001). On average, the fleet that
had the greatest gross profit margin was the dolphinfish-longliners (IN; 33.15%)
followed by the tuna-longliners (IN; 27.38%), purse-seiners (AR; 25.89%) and pair-
bottom-trawlers (SG; 24.9%) (Fig. 2.6). The purse-seiners (SG; 7.98%), shrimp-
trawlers (SG; 3.6% and IN; 7.8%) and bottom-gillnetters (SG; 7.66%) had the lowest
gross profit margins among all analyzed fleets.
In terms of economic efficiency (EE), for every R$ 1 invested, dolphinfish-
longliners (IN) had an income of R$ 1.51, followed by purse-seiners (AR; R$ 1.38)
and tuna-longliners (IN; R$ 1.39), as the fleets that were more economically efficient
among those analyzed. Shrimp-trawlers (from IN and SG), purse-seiners (SG) and
bottom gillnetters (SG) showed the lowest incomes between R$ 1.07 and R$ 1.12
(Tables 2.2, 2.3 and 2.4).

68
3.4. Generalized additive models All GAMLSS models showed a good fit to the data and the residuals appear
random, although the normal Q-Q plot shows possible single outliers in the upper tail
and lower tail.
For all fleets model, the variance inflator factor (VIF) indicated co-linearity
between the gross profit margin and labor cost, catch (t), and revenue, and thus,
these variables were excluded from the analysis. The final all fleets model is shown
in Table 2.5, and gross profit margins were explained by vessel maintenance cost,
fleet type, fuel cost and ice cost. Gross profit margin showed a negative relationship
with fuel cost (gross profit margin decreases with increasing fuel cost) and a positive
relationship with vessel maintenance cost (Table 2.5). A positive relationship of gross
profit with vessel maintenance cost can be explained because vessel maintenance
cost is a percentage of the revenue, and consequently, when revenue increases
gross profit also increases. The fleet type effect shows that the dolphinfish-longliners
(IN), purse-seiners (AR), and pole-and-line (IN) had the significantly highest gross
profit margins, corroborating with the profitability indicators results, and octopus-pots
had the lowest (Table 2.5).

69
69
Table 2.5. Summary of GAMLSS models fitted to the gross profit margin (month), where the explanatory variables are operational costs (fuel, lubricant, ice, food, vessel maintenance [Vm], landing, and others); fixed costs (social security [Ss], vessel tracking service, and accountants); and technical/operational characteristics of the vessels (fleet segment [fleet], vessel size [Vs], number of trips per month [Tm] and region of landing [port]) from industrial fleets of Angra dos Reis (AR), Santos/Guarujá (SG) and Itajaí/Navegantes (IN). (AIC = Akaike Information Criterion; LRT = Likelihood-ratio test; Pr(Chi) = probability of Chi squared test, and cs() = cubic spline).
Selected model: Profit margin ~ fleet + cs(trips per month) + cs(fuel costs) + cs(ice costs) + cs(vessel maintenance costs) + cs(others costs), family = GU) Variables Estimate Std. Error t value Pr(>|t|) AIC LRT Pr(Chi) (Intercept) 1.55e+01 2.32e+00 6.687 3.19e-10 Vm (df = 4) 3.61e-04 4.32e-05 8.343 2.46e-14 1665.1 97.921 < 2.2e-16 Fuel (df = 4) -2.50e-04 3.26e-05 -7.682 1.21e-12 1605.8 38.529 2.95e-07 Ice (df = 4) -4.12e-04 8.68e-05 -4.750 4.33e-06 1588.1 20.877 0.000854 Tm (df=4) 1.17e+00 4.09e-01 2.857 0.004815 1575.5 8.252 0.142953 Others (df=4) -1.52E-04 1.07E-03 -0.142 0.88711 1575.3 8.096 0.151044 Fleet 1629.6 76.387 2.01e-11 Dolphinfish-longliners (IN) 1.71e+01 3.69e+00 4.635 7.09e-06 Purse-seiners (AR) 2.39e+01 6.13e+00 3.903 0.000137 Pole and line (IN) 1.32e+01 5.44e+00 2.425 0.016351 Pink-shrimp-trawlers (SG) 4.71e+00 2.61e+00 1.804 0.073004 Purse-seiners (SG) 7.84e+00 4.38e+00 1.792 0.074989 Tuna-longliners (IN) 6.59E+00 5.62E+00 1.172 0.242705 Purse-seiners (IN) 1.72E+00 4.86E+00 0.353 0.724757 Pair-bottom-trawlers (SG) 3.54E-01 3.98E+00 0.089 0.929119 Pink-shrimp-trawlers (IN) 7.06E-02 1.38E+00 0.051 0.959193 Sea-bob-shrimp-trawlers (SG) -1.67E+00 2.68E+00 -0.622 0.534508 Octopus-pots (SG) -7.67e+00 3.07e+00 -2.500 0.013386

70
Figure 2.6. Box plot of annual gross profit margin per fleet. The heavy horizontal line represents the median, the boxes represent the interquartile ranges, whiskers represent 95% confidence intervals, and the balls represent the average annual gross profit margins.
For purse-seiners model, the variance inflator factor (VIF) indicated co-linearity
between gross profit and labor cost, vessel maintenance, catch (t) and revenue, so
these variables were excluded from the analysis. Landing cost, number of trips per
month, oil and food costs were the most likely variables in the model (LRT and Chi-
squared test) (Table 2.6). A significant positive relationship was observed between
the gross profit and number of trips above 10 per month (Fig. 2.7).
For trawlers model (shrimp-trawlers and pair-bottom-trawlers), the variance
inflator factor (VIF) indicated co-linearity between gross profit and labor cost, vessel
maintenance, fuel cost, other costs, catch (t) and revenue, and thus, these variables
were excluded from the analysis. Landing and ice costs, fleet type, and vessel size
were the most likely variables in the model (LRT and Chi-squared test) (Table 2.6). A
positive correlation was found between gross profit and landing cost (larger catches
Bottom-gillnetters(IN)
Bottom-gillnetters(SG)
Dolphinfish-longliners(IN)
Octopus-pots(SG)
Pair-bottom-trawlers(SG)
Pink-shrimp-trawlers(IN)
Pink-shrimp-trawlers(SG)
Pole-and-line(IN)
Purse-seiners(AR)
Purse-seiners(IN)
Purse-seiners(SG)
Sea-bob-shrimp-trawlers(SG)
Tuna-longliners(IN)
-40 -20 0 20 40
Profit margin (annual)
71
produce high profits but also high landing costs), with an increasing trend (Fig. 2.8A).
The effect of vessel length on gross profit increased for vessels less than 18 m (Fig.
8B), smaller vessels (in the case almost all the sea-bob-shrimp-trawlers and some
pink-shrimp-trawlers) showed lower gross profits. The gross profits of the pair-
bottom-trawlers and pink-shrimp-trawlers (IN) was significantly higher than the gross
profits of pink-shrimp-trawlers (SG) and sea-bob-shrimp-trawlers (SG) (Fig. 2.8C).
Table 2.6. Models for explaining monthly profit for purse-seiner and trawler fleets. Variables in final models selected by LRT and AIC are in bold.
Dependent variables
N of observations Explonatory variables AIC
Profit purse-seiners
44 ~ port + cs (trips per month) + cs(lubricant cost) + cs(ice cost) + cs(fuel cost) + cs(food cost) + cs(landing cost) 1120.77
Profit trawlers 94
~ fleet segment + cs(vessel size) + cs(trips per month) + cs(lubricating cost) + cs(ice cost) + cs(food cost) + cs(landing cost)
2175.13
Each panel of the GAMLSS plot in Figures. 2.7 and 2.8 is on the same y-axis
scale, allowing for the identification of the relative contribution of each covariate and
factor in explaining model variability.

72
Figure 2.7. Graphical summary of the GAMLSS analysis considering purse-seiner fleets. The response variable, gross profit, is shown on the y-axis as a centered smoothed function scale to ensure valid pointwise 95% confidence bands. Covariates and factors are shown on the x-axis: (A) number of trips. For covariates, solid curves are the smoothing spline fits conditioned on all other covariates and factors, and the shaded areas are bounded by pointwise 95% confidence curves around the fit in each panel.
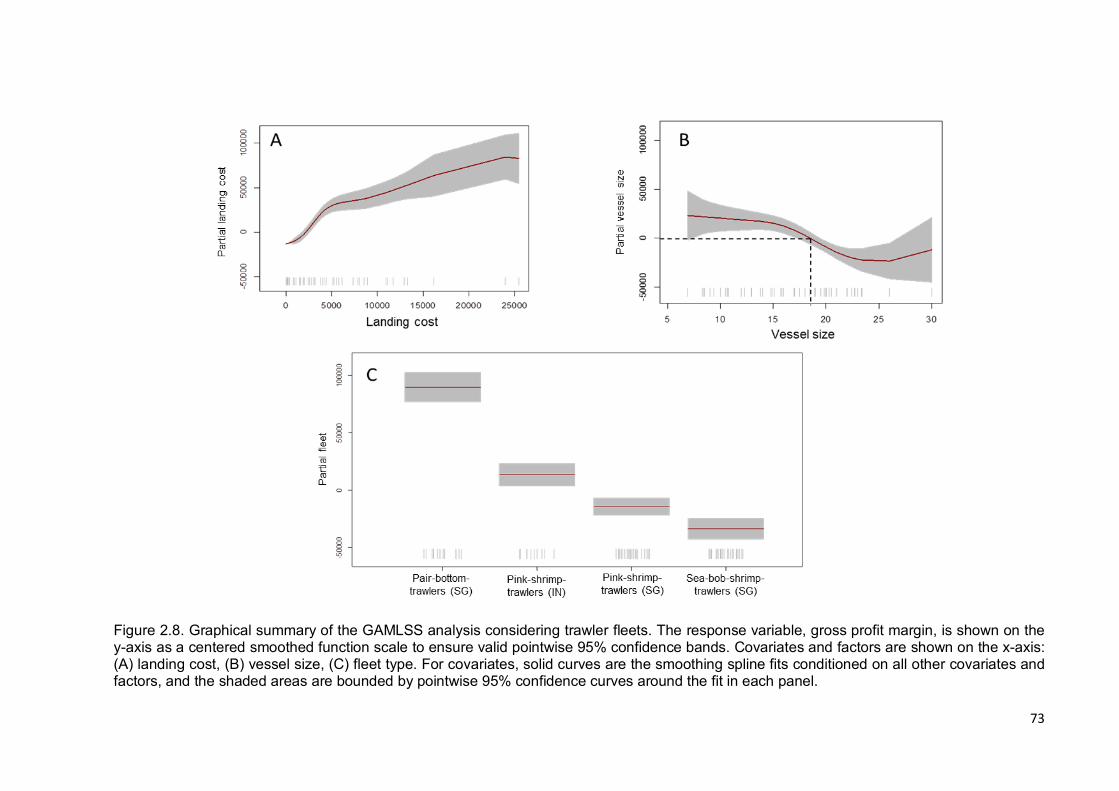
73
73
Figure 2.8. Graphical summary of the GAMLSS analysis considering trawler fleets. The response variable, gross profit margin, is shown on the y-axis as a centered smoothed function scale to ensure valid pointwise 95% confidence bands. Covariates and factors are shown on the x-axis: (A) landing cost, (B) vessel size, (C) fleet type. For covariates, solid curves are the smoothing spline fits conditioned on all other covariates and factors, and the shaded areas are bounded by pointwise 95% confidence curves around the fit in each panel.

74
4. DISCUSSION
Economic data collection is a continuous challenge for fisheries research in
Brazil. Therefore, undoubtedly, the results presented in this paper will be of great
contribution to understanding the economic circumstances still unpublished for most
of the national commercial fleets.
Vessel maintenance cost, fuel cost and fleet type played a key role in explaining
fishing profitability. Indeed, fuel and vessel maintenance costs were the primary
operational costs for all fleets, and the average profitability was positive for all the
fleets in 2013-2014. However, the costs per trip turned out to be higher than the total
revenue per trip for some vessels, mainly for shrimp-trawlers. Negative returns had
already been evidenced for the pair-bottom-trawlers (CASTRO et al., 2001b), purse-
seiners and pink-shrimp-trawlers (GASALLA et al., 2010) off southeastern Brazil.
The gross profit margin for fishing fleets presented here varied widely, and as a
ratio of more than 10 percent can be considered as good (TIETZE; LASCH, 2005),
large pelagic fisheries, pair-bottom-trawlers and purse-seiners (AR) may be
considered highly profitable. This finding may be mainly due to these fleets
presenting higher revenue, with a balance between the volume of sales and the
value of the product (higher fishing efficiency). For example, purse-seiners (AR)
presented the lowest ex-vessel price/kg (R$ 1.06) but had the second highest catch
per trip (39,730 kg) when compared to the other fleets studied. On the other hand,
the shrimp-trawlers, purse-seiners (SG) and bottom-gillnetters (SG) had the lowest
profitability, with gross profit margins between 3.6% and 9.2%, possibly very close to
the negative gross profit, mainly if there was a decrease in the fish sales price and
increase in operational costs. The EE obtained indicated a return of 7 to 12 cents on
the Brazilian Real for shrimp fishing vessels, which is low compared to the R$ 2.93
(US$ 1.18) from marine shrimp aquaculture (REGO et al., 2017).
Paradoxically, for shrimp-trawlers, purse-seiners and bottom-gillnetters, have
many active vessels in the studied area (Table 2.1) and target a fully fished or
overfished species. The decline of some target species in the studied area, such as
pink-shrimp, Brazilian sardines, and demersal fishes was cited by Valentini and
Pezzuto (2006), Pincinato and Gasalla (2010), Haimovici and Cardoso (2016) and
Pio et al. (2016). Furthermore, the increase of the fishing effort incompatible with the
sustainability of resources has already been evidenced, and clearly, the overlap of

75
trawl fleet catch with other fleets in the Southeast and South regions (VALENTINI et
al., 1991; PEREZ et al., 2001).
The differences in the level and structure of fishing costs observed between the
fleets can be related to their dynamics of the fishing operation. For instance, in
general, ‘passive’ fishing methods (e.g., gillnets, pots, and longlines) tend to be less
energy demanding (fuel consumption) than ‘active’ ones (e.g., trawls and seines)
(TYEDMERS et al., 2005; SCHAU et al., 2009). When comparing the studied fleets
that operate passively with active fisheries such as trawlers and purse-seiners, it is
evident that gillnetter, dolphinfish longliner and octopus-pot vessels consume less
fuel, and therefore, this factor can contribute to lower operating costs. However pole-
and-line, which also operates passively, presented high fuel costs, probably because
they operate beyond the continental shelf (offshore). Thus, the range of the distances
from fishing grounds to harbors and the fishing effort might primarily affect
operational costs (PORT et al., 2016).
In the studied fisheries, labor cost was correlated with revenue and catch.
Indeed, according to interviews, vessel captains do not end the fishing trip until they
are able to catch enough to pay the expenses and the labor. This fact opens an
important question about the remuneration systems being based on productivity,
consequently providing incentives for the captains to increase production in order to
maximize their personal income (VESTERGAARD, 2010). However, labor wages can
be varied if there are significant changes in the fishing conditions due to
management measures, uncertain catches due to overfished fish stocks and
increases in fishing effort (GUILLEN et al., 2017). In addition, the complete lack of
output control and overcapacity in the region may worsen the already identified
overexploitation scenario for some stocks, and the fishermen wages can be harmed,
and crew would change jobs to their best possible alternative job. The labor costs
were either the most important cost component or had the same importance of
operational costs in the dolphinfish-longliners, tuna-longliners and purse-seiners (AR)
fisheries, as was the case in small-scale fisheries in France, Germany and Norway
(TIETZE; LASCH, 2005). For the other ten fleets studied, labor cost played a less
important role than operational cost, as also was the case in other fleets elsewhere
such as in Argentine trawlers, Peruvian purse-seiners and French, German and
Norwegian offshore and deep-sea fisheries (TIETZE; LASCH, 2005).
76
In particular, the differences in profitability and EE between the analyzed purse-
seiner fleets are possibly due to the number of trips per month, different landing
costs, and in addition, different prices fetched for the same species (sardine) in
different regions (ports). Furthermore, it is also possible that the economic return may
alternatively be associated with the market and those direct and indirect costs to
achieve it. The value received by the fishermen can also be influenced by
wholesaler's and retailers or the cannery industry (FAGUNDES; VICENTE;
MARGARIDO, 2002; VICENTE; FAGUNDES; MARGARIDO, 2004), and may vary
depending on the distance from the port of landing and the place of fish processing.
Thus, landings by the purse-seiners of Santos and Guarujá need to be transported
by trucks to distant places to be processed and sold, incurring in discounts of the
freight cost in the ex-vessel price. In fact, the sardine price is relatively smaller and
stable in the State of São Paulo (GASALLA et al., 2010; PINCINATO; GASALLA,
2010) than in Itajaí and Navegantes region, where one of the most important cannery
industries of the Southeast and South region is located. In addition, in RJ the market
for in natura sardines assimilates a large portion of the production, and in the last
years many improvements have been made in the ports of Angra dos Reis, what
made viable the landing of larger vessels and the production flow.
The key role of the landing cost in explaining the gross profit can be related to
the difference between catch volume (largest catches higher revenue), where landing
costs are generally considered a linear function of total revenue in bio-economic
models (PRELLEZO et al., 2012). Whereas the key role of food cost on the
profitability of purse-seiners is consistent with the high number of crew members and
trips per month presented.
Conversely, the trawlers model also confirmed the key role of landing costs on
fishing gross profit, in addition to fleet type and ice cost. In fact, this result is
consistent with the differences in the relationship of catch volume between the three
trawlers fleets, where consequently, larger catches produce high profits but also a
larger consumption of ice to maintain the fish and high costs of landing. On the other
hand, the evidence of the effect of vessel size on profit can be especially attributed to
smaller shrimp vessels, that cannot expand their catch and revenues because they
are limited to waters close to shore, due to their low autonomy and restricted storage
capacity.
77
In this study, we estimate the financial performance of fisheries in the Southeast
and South of Brazil, and this was the first estimate for many of the fleets of the
region. It should be understood that the estimate of the gross profit can be
considered as the main indicator for the availability of the fisheries in the short term
(PINELLO et al., 2017). The analysis of this indicator can be the first step to
understanding the current situation of the sector and can subsidize more
comprehensive studies, such as studies on fisheries economic performance;
moreover, this work may also be useful to alert decision-makers to the need for more
effective fisheries management.
Thus, how cost and revenue can be largely attributed to effort or stock size,
respectively, for the lowest profitability fleets presented here, the cost of catching
would seem greater than it could be and may indicate overfishing and fleet
overcapacity. However, fisheries are capable of earning substantial profits provided
they are effectively managed (ARNASON; KELLEHER; WILLMANN, 2009). Thus,
the key role exerted by fleet category (type/region) on the profitability confirms the
importance for the implementation of a fleet management system in the region and
not only of fishing resources in isolation, but mainly for the pair-bottom-trawlers,
bottom-gillnetters and shrimp-trawlers that essentially have multi-specific
characteristics. In addition, the establishment of specific management measures by
fishing category (type/region) could be an alternative for the purse seine (SG) fleet
that presented quite a distinct performance among the three regions studied.
Therefore, for the region of study, where has already been proven through studies on
the dynamics of the fleets and biological factors, the need for a reduction of fishing
effort in bottom-trawling (PEREZ et al., 2001), purse-seine (CERGOLE; ROSSI-
WONGTSCHOWSHI, 2005) and gillnetter fisheries (MENDONÇA; PEREIRA, 2014),
the low profitability shown here for these fleets, are complementary from an
economic point of view of previous evidence.
Conversely, fisheries management has many objectives, of which increasing
economic performance is only one (PASCOE et al., 1996). Thus, the low economic
performance of the fleets should not only encourage management measures, since
high economic profits can stimulate the entry of new vessels into a fishery, thus
intensifying pressure on stocks (WHITMARSH et al., 2000). In fact, the risk of
biological overexploitation will be highest when the species is valuable, costs little to
exploit, is easily caught and is both long-lived and slow-growing (BRANCH et al.,
78
2006), as is the case of some species caught by the profitable large pelagic fisheries
shown here. However, the management of pelagic resources within this region is
non-existent, and biological and ecological information on which to base
management decisions is often lacking (ABDALLAH; SUMAILA, 2007).
To avoid the greatest fishing pressure, and consequently biological
overexploitation and a less efficient fishery (both technically and economically), input
controls (fishing capacity and effort controls) need to be designed in combination with
output controls, directly restricting catch. If a few input aspects are regulated, fishing
fleets may act to maximize their individual well-being, using unregulated dimensions
for increasing the effort, leading to excessive investment in fishing technology, which
may result in unpredictable and unfavorable consequences (BRANCH et al., 2006).
For the multispecies fisheries in the United States, the indices reveal that the
economic wellbeing of the fishing fleet has improved under catch share management
(WALDEN; KITTS, 2014).
On the other hand, the fleet individual results of financial analysis presented
here may be useful for helping businessmen and vessel owners to identify factors
that are influencing fleet profitability, which may facilitate the creation of measures for
improvements in the internal processes of the fishing activity. In this sense, changes
in technological and operational measures, in addition to behavioral adaptations, can
result in significant improvements in profitability (JOHNSON, 2011; SUURONEN et
al., 2012) as a result of reduced costs. For example, fuel savings can be achieved by
eliminating the complete lack of engine maintenance, just as with the use of autopilot
(savings of 20-30%), and a reduction in fishing or cruise speed, friction (without
unnecessary underwater appendages) and unnecessary vessel weight as spare
parts (ABERNETHY et al., 2010; JOHNSON, 2011; POOS et al., 2013; RENCK,
2014). In addition, Pio et al. (2016), estimated that a 46% reduction in fishing gear
size can reduce the maintenance costs by at least 40%, and the expected effects
may be positive with an increase in the profitability of the gillnet fishing fleet in South
Brazil.
Finally, the results presented could also be useful to guide the government
agencies that dictate the development and modernization of Brazilian fisheries fleets
(e.g., PROFROTA, Law 12.712/2012) in the adoption of credit liberalization policies
that prioritize the low-profit vessels in the acquisition of low-impact and cost-effective
technology improvements (e.g., incentives for the purchase of engines that consume

79
less fuel). In addition, the results warn for a possible risk in the release of the
incentives for the acquisition of new vessels for the fleets that are close to the
negative gross profit, where the government support for vessel construction should
inevitably lead to the overcapitalization of the fisheries, with adverse consequences
for stocks, profitability and fisher salaries (OECD, 2006).
5. CONCLUSIONS
For the fleets as a whole, the average financial returns were positive over the
entire period analyzed, indicating that the fleets are still profitable. Nonetheless,
purse-seiners (SG), shrimp-trawlers and bottom-gillnetters (SG) were less profitable
and close to a negative gross profit, especially if there was an increase in fuel and
vessel maintenance costs, which played a key role in explaining the fleet profitability
and were identified as the main operating costs. Dolphinfish-longliners, tuna-
longliners, purse-seiners (AR) and pair-bottom-trawlers were the most profitable
industrial fishing fleets in the region.
For all fleets, the main factors affecting gross profit were fuel consumption,
vessel maintenance expenses, fish price, and volume of catch. However, fishing
effort (number of active vessels), the exploitation status of target-stocks, and the lack
of management are also indirect factors. In addition, and especially for trawlers and
purse-seiners, technical features such as vessel size and number of fishing trips
explained profitability, respectively, while the landing costs were significant to explain
both types of fleet, and the ice cost for trawlers.
Labor wages based on a shared remuneration system increase when the
economic performance of fleets improves; however, reduced productivity and high
operational cost levels may decrease the salaries.
The overall financial performance of the fleet is the most appropriate measure
for indicating the sector’s short-term sustainability. However, considerable variation in
performance was observed within and between the fleets. As such, they are a
benchmark against which future surveys can be compared, and can be used as a
basis for management discussions. This finding also provides information on the
current performance of the fleets and may provide support to decisions by vessels
owners, new entrants to the fishery and the government for funding priorities from

80
vessel construction and modernization, as well as reduce or halt new vessel
construction financing for fleets with low profitability.
To ensure the profitability of regional fisheries, the introduction of a
management system that aims at reducing overcapacity while promoting the
recovery of overfished stocks seems urgent, especially for the Santos/Guarujá
region, where the majority of the less profitable fleets were identified. A preliminary
alternative would be to implement an input control, such as restricting the number of
fishing licenses, especially for the bottom-gillnetters, shrimp-trawlers, and purse-
seiners whose industrial fishing is operating in a scenario of overcapacity, overfished
stocks, and open-access conditions. A reduction in fishing effort could increase
productivity, profitability, and net economic benefits from these fisheries, and
rebuilding fish stocks will lead to increased sustainable yields and lower fishing costs.
From a management perspective, catch and effort controls, such as vessel size for
shrimp-trawlers and number of trips for purse-seiners, can alter the financial
profitability of the national fisheries in the short term. Thus, managers will need to
take into consideration the potentially severe short-term effects in profitability when
developing longer term input controls. Finally, in terms of the governance
perspective, the fleet category (fleet type/region) presented here could be considered
as a unit, mainly for the purse-seine fleet, which presented quite distinct financial
performance in the three regions studied.

81
CHAPTER 3 - Economic performance of marine commercial fishing fleets in
Southeast and South Brazil.

82
CHAPTER 3 - ECONOMIC PERFORMANCE OF MARINE COMMERCIAL FISHING FLEETS IN SOUTHEAST AND SOUTH BRAZIL.
ABSTRACT
A cost-benefit analysis, based on a set of field survey data obtained in four regions of
Southeast and Southern Brazil, namely Angra dos Reis (AR), Santos and Guarujá
(SG), Itajaí and Navegantes (IN) and Rio Grande (RG), aimed to determine the
economic profitability and viability of 17 different fishing fleets. Static (i.e., net profit
margin) and dynamic models (net present value, and internal rate of return (IRR))
were used as the measurement criteria. The fleets were classified into categories in
order to compare their profitability and viability. In general, the fleet units were found
in an economic state that varied from very good to unviable. The results showed that
bottom-gillnetters and single-bottom-trawlers from the RG region as well as pink-
shrimp-trawlers and traditional purse-seining for sardines in the SG region were
economically unviable and do not generate sufficient revenue to cover depreciation,
opportunity cost of capital, and to generate funds for reinvestment, employment and
income. This is possibly due to overcapacity and overexploitation of target resources.
In addition, the bottom-gillnet fleet and purse-seining for sardines from the IN region
as well as the octopus-pots and sea-bob-shrimp-trawlers from the SG region were
especially in fragile condition, very close to economic unviability. On the other hand,
the fishing units that showed good returns included tuna and dolphinfish longliners
(from RG and IN), pair-bottom-trawlers (from SG) and purse-seiners (from AR)
whose IRR values exceeded 40%. Economic performances of the same segments
fleets are heterogeneous, primarily by purse-seiners, bottom-gillnetters and pink-
shrimp-trawlers due to their differences in volume of the catch, number of trips per
month, and the market price of the fish. The findings also indicate that there may be
a variation in economic performance of the fleets depending on the region. Finally,
the not regulation of fishing access required to ensure the sustainability of the fishing
fleets possible revealed unviability as well as a fragile economic condition.
Keywords: economic analyses; fishery profitability and viability; net present value;
internal rate of return.

83
1. INTRODUCTION
The economic performance and viability of a commercial fishery may be viewed
from the possible effects of catch rates and the vessel’s net return (WHITMARSH et
al., 2003). Therefore, the catch rates should be sufficient to supply economic returns
that cover the costs of fishing and provide enough profit to make fishing worthwhile
as a provider of employment and food (KING, 2007). Undoubtedly, reduction of
income occurs in conjunction with biological overfishing and fisheries become
commercially unviable (PAULY, 1993). Thus, both field data and economic indicators
are necessary to evaluate and monitor the economic performance and viability of
commercial fleets and fisheries (BOUNCOEUR et al., 2000; GASALLA et al., 2010)
and can be useful for bioeconomic analyses, impact assessments of management
measures, as well as analyses of optimal size and structure of fishing fleets
(PASCOE et al., 1996; SUMAILA et al., 2008; SIMMONDS et al., 2011).
The economic performance of a fleet differs from its financial performance, as it
includes additional economic costs (annual depreciation costs and opportunity costs
of capital) incurred while operating in the fishery that are not accounted for in
financial statements (SKIRTUN, 2016). The inclusion of the opportunity cost of
capital is important, because it reflects what would have been earned by undertaking
the next best alternative activity. If these returns are not being earned, fishers would
be better off in an alternative activity or investment (PASCOE et al., 1996).
Economic performance indicators evaluate the profitability of the industry to
society associated with harvesting fishery resources, provide an indication of the
sector’s ability to survive in the long term, and are most relevant to the needs of
fishery managers and policy-makers. For example, if management is concerned with
the level of fishing effort, then economic performance indicators are more appropriate
since positive economic profits may signal the entry of new vessels into a fishery,
intensifying pressure on stocks and increasing the need for entry controls.
Conversely, negative or low profit may indicate a possible decrease in labor and
capital from a fishery, overcapacity, or the allocation of effort to other fisheries. Thus,
the economic and financial performance of the fisheries provide slightly different
information, and the distinction between the two measures is important for policy
purposes (PASCOE et al., 1996; WHITMARSH et al., 2000; BORRELO et al., 2013)

84
In Brazil, assessments of economic performance and viability of fishing fleets
are scarce. Additionally, the management of fisheries do not consider the financial
and economic performance of the fleets. In addition, despite the need for an annual
fishing license, industrial fishing fleets in Brazil operate in an open-access regime
without input or output controls by the government, which restricts solely fish and
mesh size as well as the seasons for closure of a few resources. It is also well known
that the potential long-term benefits of open-access tend to weaken over time and
can create economic inefficiencies, except for unsustainable yields (WATERS, 1991).
Thus, the lack of economic analyses appears to be a significant gap that should
be addressed by regional scientific research. In this context, the present study had
the purpose of assessing the economic performance of the main commercial fishing
fleets from Southeast and Southern Brazil and estimating their economic profitability
and viability.
2. METHODS
2.1. Data collection
Economic data referring to the period 2013-2014 were obtained through
questionnaires completed in situ during interviews conducted with vessel owners and
skippers among the main ports across four landing regions of Southeast and
Southern Brazil, namely Angra dos Reis (AR), Santos and Guarujá (SG), Itajaí and
Navegantes (IN) and Rio Grande (RG) (Fig. 3.1), based on their most recent fishing
trip by vessel (at the time of the interview). Key-informant, semi-structured personal
interviews were applied to gather data related to the technical and operational
details, costs, and production data. The technical and operational data included
information about fishing effort (total number of fishing days per trip and number of
trips per month), vessel length and age, and number of crew. The cost data included
operational costs (OP), fixed costs (FC), labor wages (LC), and capital investments
(Table 3.1). The production data included the total catch as well as catch and ex-
vessel price by species (in tons). The vessels were aggregated by type (gear type)
and region (AR, SG, IN, RG), totaling 17 different commercial fleet categories:
bottom-gillnetters (SG, IN and RG), dolphinfish-longliners (IN), octopus-pots (SG),
pair-bottom-trawlers (SG and RG), pink-shrimp-trawlers (SG and IN), pole and line

85
(IN), purse-seiners (SG, IN, AR), sea-bob-shrimp-trawlers (SG), single-bottom-
trawlers (RG), and surface-tuna-longliners (IN and RG). A total of 320 interviews
were performed at principal industry and public landing terminals due to the
significant number of vessels that landed at these sites, which are considered
representative of the regional fisheries (see Chapters 1 and 2 for additional details of
data collection).
All costs and values were collected in Brazilian currency (Real, R$; conversion
rate of US$ 1.00 = R$ 2.23 on May 30, 2014).
Figure 3.1. Location of the fishery landing ports/regions (red dots) of Southeast and Southern Brazil.

86
Table 3.1. Economic indicators selected for assessing the performance of Southeast and Southern Brazil.
Indicators Description Equation
Revenue (R) Average catch value (landed value)
● R = Catch per species (ton) × ex-vessel price per species
Capital investment (CI)
Average current price assigned to the vessel and all the equipment.
● CI = Vessel + gear
Operational costs (OC)
Average annual variable costs
● OC = Fuel +lubricating oil + ice+ food + bait + repairs to the vessel and gear maintenance + landings + others.
Fixed costs (FC)
Average monthly and annual fixed costs
● FC = Fees (social security contribution) + vessel tracking service + insurances (vessel and crew) + forwarding agents + accountants + licenses + depreciation (D).
Labor costs (LC) Average crew wages ● LC = R – OC - owner´s
portion
Opportunity cost (OP)
Benefits that the owner could have obtained by investing their capital (CI) in an alternative risk-free investment (national debt).
● OP = CI × real interest rate (IR) ● IR = [(1 + i)/ (1 + π)] i = 10% (nominal interest rate π= 6,16% (inflation rate)
Net Profit (NP) Difference between revenue and all costs and opportunity costs.
● NP = R - (OC + FC + LC + OP)
Net profit margin (%)
Measure of profitability after all costs have been accounted
● NPM% = (NP/R) * 100
Internal Rate of Return (IRR)
Percent ratio of yearly net profits plus the opportunity cost in relation to the investment.
● IRR=CI+ ∑ " Ft(1+ i)t
#nt=1
Ft = capital inflow at time t i = discount rate
Net present value (NPV)
Measure of the financial viability of capital investment.
●NPV= ∑ " B-C(1+ i)t
#t=Tt=0
t = time in years, T= time horizon, B = benefits in year t, C = the costs in year t, i = discount rate.
87
2.2. Data analysis
The analysis of economic performance from each of the fleets was based on a
set of indicators that are presented in Table 3.1. The evaluation of the commercial
fishing enterprise under economic analysis was undertaken using static and dynamic
models.
The operational cost, labor cost and catch (ton) information requested during
the interviews were related to the recent fishing trip by the operating vessel and have
been converted into annual value (see Chapters 1 and 2 for more details). Thus,
fishing trip data were multiplied by the average number of trips per month and
posteriorly multiplied by the number of months that the fleet operated, which can be
different for each fleet (i.e., some target species are managed through the application
of closed fishing seasons). Average values were used to describe the cost structure
of each fleet as well as the revenue. The mean value takes into consideration the
number of observations within each fleet.
To calculate the cost of fuel per trip, each observed vessel was considered to
be non-subsidized, and the average market price of the diesel oil value was
multiplied by the amount of fuel (in liters) on the trip per vessel. The site of the
National Agency of Petroleum, Natural Gas and Biofuels - ANP was consulted to
establish the market price of diesel oil.
Depreciation costs (R$ yr-1) were estimated following the methodology applied
by Tietze et al. (2005), considering the main components of fishing vessel investment
costs (fixed assets) and an estimate of their service life and percentage of annual
depreciation. Service life and percentage of annual depreciation of batteries, deck
equipment, winches, and monitoring and navigation equipment were obtained using
http://depreciationrates.manager.io/transport-and-storage.
The opportunity cost of capital was calculated using the average interest rates
from 2013-2014. The nominal interest and inflation rates used were 10% and 6.16%,
respectively.
To assess the economic performance of fishing fleets, three indicators were
used, namely Net Profit Margin (NPM), Net Present Value (NPV) and Internal Rate of
Return (IRR). NPM, also known as economic profit margin, is often used as a proxy
of resource rent in fisheries, is a measure of profitability after all costs have been
accounted for and reflects the percentage of revenue that a sector retains as profit

88
(STECF, 2015; PINELLO et al., 2017). NPV is a scalar value expressed in R$ and
represents the financial worth of an investment under a given set of assumptions that
define the stream of revenue and costs over a specified time horizon. Costs include
operational costs, fixed costs, labor costs, annual interest rate, and replacement of
capital items. Capital items, which are incorporated into the time profile of cash flows
as costs incurred on an irregular basis, are assumed to be acquired or replaced at
the following frequencies: deck equipment and winches every 10 years, monitoring
and navigation equipment every 5 years, and batteries every 3 years.
The NPV was calculated according to different rates of interest (10%, 15% and
25%) that represent the opportunity cost of capital (WHITMARSH et al., 2003). IRR is
the rate that will equate to the sum of net cash flows of the initial investment; it is also
defined as the discount rate at which the present value of all future cash flow is equal
to the initial investment. The IRR is the interest rate at which the NPV is zero
(MMOPELWA et al., 2005; SAPAG; SAPAG, 2008). A project is a good investment
proposition if its IRR is greater than the rate of interest that could be earned by
alternative investments (investing in other projects, buying bonds, or even putting the
money in a bank account). The rate of interest used is 10% annually and refers to the
to the average interest rate of the Central Bank of Brazil (locally dubbed as SELIC
rate) during 2013 and 2014. For NPV and IRR, the assessment time horizon
considered in this study is 20 years, corresponding to the service life of the vessel
(WHITMARSH et al., 2003) with the venture capital entirely invested in year zero.
The fleets were classified into three categories according to their profitability:
good (NPM > 10%), vulnerable (or reasonable) (NPM = 0-10%), and bad (NPM <0%)
(TIETZE; LASCH, 2005; STECF, 2015; PINELLO et al., 2017).
The viability of the fleets was classified as unviable (NPV negative and IRR <
10%) (GITTINGER, 1982; MMOPELWA et al., 2005), vulnerable (NPV positive and
IRR 10-11%), good (NPV positive and IRR 12-70%), and very good (NPV positive
and IRR > 70%).

89
3. RESULTS
3.1. Investment cost
The average value of the main components of capital investment including a
breakdown of contribution from the vessel and the gear by fleets is provided in
Tables 3.2, 3.3, 3.4, and 3.5. The main component of vessel investment was hull and
engines; however, for pole-and-line, purse-seiners, pair-bottom-trawlers, and single-
bottom-trawlers, the investment in monitoring and navigation equipment was higher
than that of engines. The largest investment costs were required by purse-seiners
(IN, SG and AR), pole-and-line (IN), tuna-longliners (IN), and pair-bottom-trawlers
(RG), with an average between R$ 3,352,941 and R$ 1,943,846. In contrast, the
dolphinfish longliners (IN), bottom-gillnetters (SG) and sea-bob-shrimp trawlers (SG)
required R$ 391,250, R$ 300,000 and R$ 215,196, respectively. The highest
investments in fishing gear were observed for the purse seine fleets at around R$1
million. The age and length ranges of vessels for each fleet are shown in Tables 3.6,
3.7, 3.8, and 3.9. Thus, 12 of the 17 fleets analyzed are composed of vessels with an
average age greater than 20 years.
3.2. Economic performance
Tables 3.6, 3.7, 3.8, and 3.9 show the economic indicators of the fishing fleets
studied. For the fleet as a whole, NP and NPM were positive over the entire period
analyzed, except for single-bottom-trawlers (RG) and purse-seiners (SG), which
presented negative values.
In terms of net profit (NP) that can be viewed as a measure of the return to the
vessel owner’s equity, the purse-seiners (AR), tuna-longliners (IN and RG) and pair-
bottom-trawlers (SG) showed the highest value with approximately R$ 940,000, R$
800,000 and R$ 782,000, respectively. The results show that six fleets (35%)
achieved NPM between 0% and 10% (vulnerable profitability) and nine (53%) greater
than 10% (Figs. 3.2 and 3.3). The best performance for NPM (between 22% and
27%) was found in the longline fleets (tuna and dolphinfish), purse-seiners (AR) and
pair-bottom-trawlers (SG) (Tables 3.6, 3.7, 3.8, and 3.9).
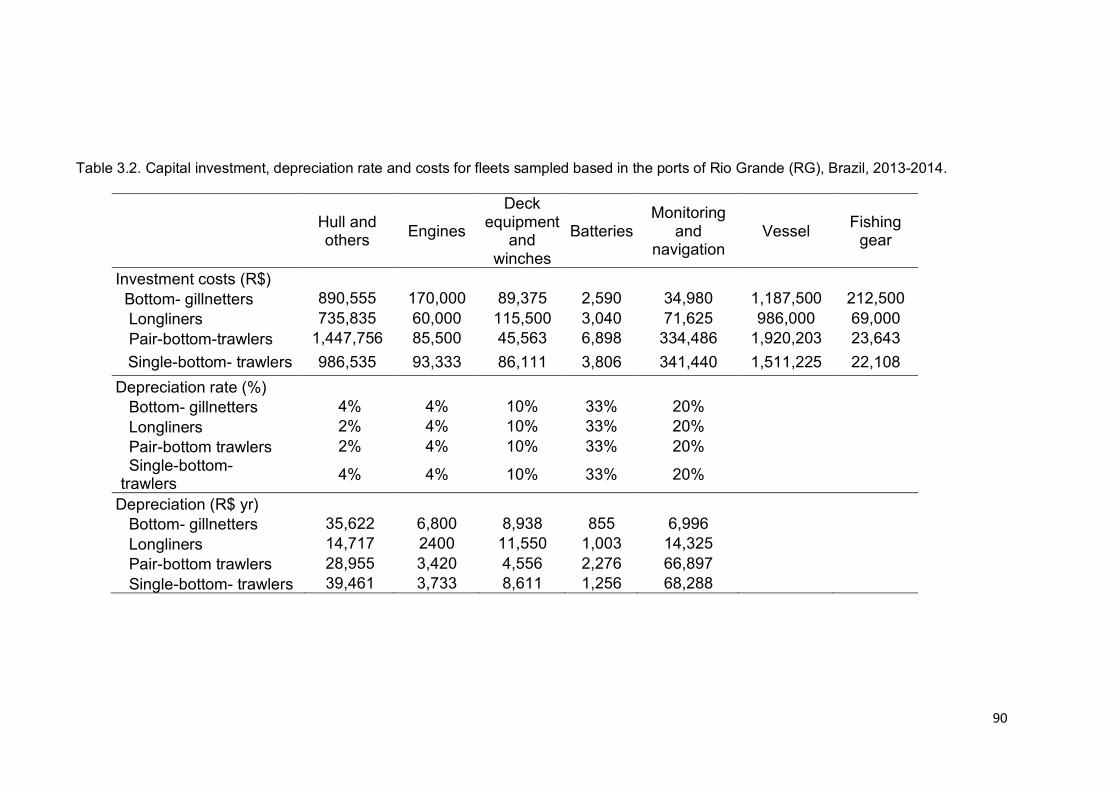
90
90
Table 3.2. Capital investment, depreciation rate and costs for fleets sampled based in the ports of Rio Grande (RG), Brazil, 2013-2014.
Hull and others Engines
Deck equipment
and winches
Batteries Monitoring
and navigation
Vessel Fishing gear
Investment costs (R$) Bottom- gillnetters 890,555 170,000 89,375 2,590 34,980 1,187,500 212,500 Longliners 735,835 60,000 115,500 3,040 71,625 986,000 69,000 Pair-bottom-trawlers 1,447,756 85,500 45,563 6,898 334,486 1,920,203 23,643 Single-bottom- trawlers 986,535 93,333 86,111 3,806 341,440 1,511,225 22,108 Depreciation rate (%) Bottom- gillnetters 4% 4% 10% 33% 20% Longliners 2% 4% 10% 33% 20% Pair-bottom trawlers 2% 4% 10% 33% 20% Single-bottom- trawlers 4% 4% 10% 33% 20%
Depreciation (R$ yr) Bottom- gillnetters 35,622 6,800 8,938 855 6,996 Longliners 14,717 2400 11,550 1,003 14,325 Pair-bottom trawlers 28,955 3,420 4,556 2,276 66,897 Single-bottom- trawlers 39,461 3,733 8,611 1,256 68,288

91
91
Table 3.3. Capital investment, depreciation rate and costs for fleets sampled based in the ports of Itajaí/Navegantes (IN), Brazil, 2013-2014.
Hull and others Engines
Deck equipment
and winches Batteries Monitoring
and navigation Vessel Fishing gear
Investment costs (R$) Bottom-gillnetters 905,683 121,250 20,000 12,000 31,900 1,090,833 96,667 Dolphinfish longliners 182,773 87,500 45,000 5,977 20,000 341,250 50,000 Pink-shrimp-trawlers 532,485 76,538 42,500 2,500 33,000 687,024 5,833 Pole-and-line 1,809,933 320,000 431,000 2,560,933 72,400 Purse-seiners 1,698,824 194,167 80,000 8,000 371,950 2,352,941 1,000,000 Tuna longliners 1,872,983 102,500 171,250 3,600 88,000 2,238,333 95,000 Depreciation rate (%) 4% 4% 10% 33% 20% Depreciation (R$ yr) Bottom- gillnetters 36,227 4,850 2,000 3,960 6,380 Dolphinfish longliners 7,311 3,500 4,500 1,972 4,000 Pink-shrimp-trawlers 21,299 3,062 4,250 825 6,600 Pole-and-line 72,397 12,800 86,200 Purse-seiners 67,953 7,767 8,000 2,640 74,390
Tuna longliners 74,919 4,100 17,125 1,188 17,600

92
92
Table 3.4. Capital investment, depreciation rate and costs for fleets sampled based in the ports of Santos/Guarujá (SG), Brazil, 2013-2014.
Hull and others Engines
Deck equipment and
winches Batteries
Monitoring and
navigation Vessel Fishing gear
Investment costs (R$) Bottom- gillnetters 151,145 41,429 20,000 2,600 29,827 245,000 55,000
Octopus-pots 431,701 92,000 50,000 3,500 38,975 623,176 118,000 Pair-bottom trawlers 559,789 198,667 45,563 6,898 320,333 1,131,250 25,000 Pink-shrimp-trawlers 640,387 97,000 16,500 1,653 31,052 786,592 6,407 Purse-seiners 623,708 87,500 48,750 4,375 194,000 958,333 1,000,000 Sea-bob-shrimp trawlers 149,640 22,800 9,967 2,616 24,256 209,279 5,916 Depreciation rate (%) 2% 4% 10% 33% 20% Depreciation (R$ yr)
Bottom-gillnetters 3,023 1,657 2,000 858 5,965 Octopus-pots 8,634 3,680 5,000 1,155 7,795 Pair-bottom trawlers 11,196 7,947 4,556 2,276 64,067
Pink-shrimp-trawlers 12,808 3,880 1,650 545 6,210
Purse-seiners 12,474 3,500 4,875 1,444 38,800 Sea-bob-shrimp trawlers 2,993 912 997 863 4,851

93
93
Table 3.5. Capital investment, depreciation rate and costs for fleets sampled based in the ports of Angra dos Reis (AR), Brazil, 2013-2014.
Hull and others Engines
Deck equipment
and winches
Batteries Monitoring
and navigation
Vessel Fishing gear
Investment costs (R$) 1,339,268 96,333 48,750 4,917 355,732 1,845,000 705,000.00 Depreciation rate (%) 4% 4% 10% 33% 20% Depreciation (R$ yr) 53,571 3,853 4,875 1,623 71,146

94
94
Table 3.6. Rio Grande (RG) region - Average value of technical/operational characteristics and economic indicators by fleet.
Bottom-
gillnetters Tuna-
longliners Pair-bottom
trawlers Single-bottom-
trawlers Technical/operational characteristics
Range length of vessel (m) 15 - 26 22 - 28 17 - 25 20 - 27 Vessel age (years) 20 42 27 23 Catch per fishing trip (t) 26.2 7.1 74.6 44.5
Capital investment (R$) 1,400,000 1,040,000 1,953,846 1,533,333 Revenue (R$ yr) 1,008,965 3,068,140 3,089,557 1,607,486 Costs (R$ yr)
Operational Cost 476,780 1,040,532 1,705,839 1,376,726 Labor Cost 266,092 1,013,804 691,858 115,380 Fixed Cost 175,794 152,441 270,729 223,331 Opportunity cost of capital 50,641 37,619 70,674 55,463
Profitability indicators Net profit 39,658 823,744 350,456 -163,414 Net profit margin (%) 3.9 26.8 11.3 -10.2 NPV (rate of 10%) -285,285 6,347,554 1,733,394 -1,790,680 NPV (rate of 15%) -575,368 4,391,468 775,367 -1,702,595 NPV (rate of 25%) -877,975 2,349,548 -221,371 -1,607,357 IRR (rate of 10%) 6.84% 78.41% 22.2% NEGATIVE

95
95
Table 3.7. Itajaí/Navegantes (IN) region - Average value of technical/operational characteristics and economic indicators by fleet.
Bottom-
gillnetters Dolphinfish longliners
Pink-shrimp-trawlers Pole-and-line Purse-
seiners Tuna
longliners Technical/operational characteristics
Range length of vessel (m) 18-24 13-20 15-23 18-28 23-33 17-23
Vessel age (years) 18 12 18 11 20 24 Catch per fishing trip (t) 23 7 8 61.5 30 19
Capital investment (R$) 1,187,500 391,250 692,857 2,633,333 3,352,941 2,333,333 Revenue (R$ yr) 1,048,909 610,125 969,054 3,445,650 2,480,574 3,333,120
Total Costs (R$ yr) Operational Cost 607,365 189,517 545,099 1,945,506 1,256,655 1,143,551 Labor Cost 220,772 210,304 211,977 750,072 611,959 1,094,785 Fixed Cost 106,237 29,339 81,181 251,047 257,331 172,283 Opportunity cost of capital 42,954 14,152 25,062 95,252 121,282 84,401
Profitability indicators Net profit 71,581 166,812 105,735 403,773 233,347 838,100 Net profit margin (%) 6.8 27.3 10.9 11.7 9.4 25.1 NPV (rate of 10%) 82,462 1,126,821 555,514 2,112,539 228,647 5,533,402 NPV (rate of 15%) -250,936 727,762 228,240 876,920 -698,277 3,461,113 NPV (rate of 25%) -598,562 311,366 -113,121 -408,609 -1,662,227 1,298,480 IRR (rate of 10%) 11.01% 46.39% 20.86% 21.01% 11.01% 40.00%

96
96
Table 3.8. Santos Guarujá (SG) region - Average value of technical/operational characteristics and economic indicators by fleet.
Bottom- gillnetters
Octopus-pots
Pair-bottom trawlers
Pink-shrimp-trawlers
Purse-seiners Sea-bob-shrimp trawlers
Technical/operational characteristics
Range length of vessel (m) 8-19 14-22 18-30 16-26 19-27 10-15
Vessel age (years) 30 27 33 33 27 30 Catch per fishing trip (t) 3.3 3 31.3 5.5 20.7 1.9
Capital investment (R$) 300,000 741,176 1,156,250 793,000 1,958,333 215,196 Revenue (R$ yr) 531,764 790,200 3,512,387 866,236 999,759 251,806 Total Costs (R$ yr)
Operational Cost 289,258 493,306 1,574,109 574,703 587,175 154,666 Labor Cost 121,253 148,447 969,139 145,766 206,292 48,570 Fixed Cost 43,254 66,620 144,529 70,790 137,737 26,294 Opportunity cost of capital 10,852 26,810 41,824 28,684 70,836 7,784
Profitability indicators Net profit 67,147 55,017 782,786 46,292 -2,282 14,492
Net profit margin (%) 12.6 7.0 22.3 5.3 -0.2 5.8 NPV (rate of 10%) 364,494 25,236 5,503,407 -51,984 -1,178,877 8,548 NPV (rate of 15%) 190,854 -171,157 3,757,650 -245,999 -1,373,829 -49,024 NPV (rate of 25%) 9,880 -377,467 1,938,475 -448,232 -1,575,445 -108,873 IRR (rate of 10%) 26.22% 10.51% 70.47% 9.02% NEGATIVE 10.59%

97
Table 3.9. Angra dos Reis (AR) region- Average value of technical/operational characteristics and economic indicators by fleet.
Purse-seiners Technical/operational characteristics
Range length of vessel (m) 14-28 Vessel age (years) 17 Catch per fishing trip (t) 39
Capital investment (R$) 2,550,000 Revenue (R$ yr) 3,745,611 Total Costs
Operational Cost 1,263,038 Labor Cost 1,241,287 Fixed Cost 208,519 Opportunity cost of capital 92,238 Profitability indicators
Net profit 940,529 Net profit margin (%) 25.1 NPV (rate of 10%) 6,045,072 NPV (rate of 15%) 3,788,597 NPV (rate of 25%) 1,436,622 IRR (rate of 10%) 40.40%
The Internal Rate of Return (IRR) and the Net Present Value (NPV) allow us to
analyze the economic viability of fleets. When considering all fleets, 12% and 41%
had very good and good viability, respectively, 23% were vulnerable, and 24%
attained unviability (Fig. 3.3). Single-bottom-trawlers (RG), purse-seiners (SG),
bottom-gillnetters (RG), and pink-shrimp-trawlers (SG) had IRR under 10% and
negative NPV (Fig. 3.2) for all assumption discount rates (10%, 15% and 25%)
(Tables 6 and 8). Tuna-longliners (RG) and pair-bottom-trawlers (SG) showed very
good viability (IRR = 78% and 70.5%, respectively), while dolphinfish longliners, tuna
longliners (IN) and purse-seiners (AR) had good viability with IRR between 40% and
46% (Fig. 3.2 and Tables 3.6, 3.7, 3.8, and 3.9). However, pair-bottom trawlers
(RG), bottom-gillnetters (IN, SG), pink-shrimp-trawlers (IN), pole-and-line (IN), purse-
seiners (IN), octopus-pots, and sea-bob-shrimp-trawlers had IRR between 10% and
22% (Tables 3.6, 3.7 and 3.8).
For all fleets, the estimates of NPV (Tables 3.6, 3.7, 3.8 and 3.9) decrease as
the discount rate rises. The NPV is negative for bottom-gillnetters (IN), purse-seiners
(IN), octopus-pots (SG), and sea-bob-shrimp trawlers (SG) when the discount rate is

98
greater than 10%, and for pair-bottom trawlers (RG), pink-shrimp-trawlers (IN), and
pole-and-line (IN) when the discount rate is 25%.
When comparing fleets of regions, Itajaí/Navegantes had the highest number of
fleets with good profitability (n = 4) and viability (n = 4) (Fig. 3.4). On the other hand,
although the Santos/Guarujá region has a fleet classified as having very good
viability, most of the fleets in this region were classified as vulnerable and unviable
(66%) (Fig. 3.4).

99
99
Figure 3.2. Classification of each fleet by category of viability and profitability.

100
100
Figure 3.3. Percentage of each category of viability (A) and profitability (B) from the 17 total fishery fleets from S/SE Brazil and the number and percentage of fleets per category and region.
Good53%
Vulnerable
35%
Bad12%
Profitability
Very good12%
Good41%Vulnerable
23%
Unviable24%
Viability
Good Vulnerable Bad Total
AR 1 (5.9%) 1
SG 2 (11.8%) 3 (17.6%) 1 (5.9%) 6
IN 4 (23.5%) 2 (11.8%) 6RG 2 (11.8%) 1 (5.9%) 1 (5.9%) 4
Total 9 (53%) 6 (35%) 2 (12%) 17
Number of fleets per category and region
A
B
Very good Good Vulnerable Unviable TotalAR 1 (5.9%) 1SG 1 (5.9%) 1 (5.9%) 2 (11.8%) 2 (11.8%) 6IN 4 (23.5%) 2 (11.8%) 6RG 1 (5.9%) 1 (5.9%) 2 (11.8%) 4
Total 2 (12%) 6 ( 41%) 4 (23.6%) 4 (23.6%) 17
Number of fleets per category and region
7

101
Figure 3.4. Percentage of fleets classified by each category of viability (V) and profitability (P) by region, Angra dos Reis (AR), Santos/Guarujá (SG), Itajaí/Navegantes (IN) and Rio Grande (RG).
0 20 40 60 80 100
GoodVery good
GoodVulnerable
BadVery good
GoodVulnerable
UnviableGood
VulnerableBad
Very goodGood
VulnerableUnviable
GoodVulnerable
BadVery good
GoodVulnerable
Unviable
PV
PV
PV
PV
ARSG
INR
G
n=4
n=4
n=6
n=6
n=6
n=6
n=1

102
4. DISCUSSION
Measures of economic viability and performance are often used as
indicators of the future direction of change in fisheries and are important tools in
the policy development process and by considering investment incentives to
vessel owners (COGLAN; PASCOE, 1999). Economic performance indicators
presented have been based on survey data from large-scale fisheries because
they are often seen as higher priority for fishery management and policy
making.
To assess the economic profitability and viability of fishing fleets of
Southeast and Southern Brazil, three indicators were used: the net profit margin
NPM (%), NPV and IRR (%). The net profit margin reflects the percentage of
revenue that a sector retains as profit; a zero or negative value may indicate
high competition in the sector and can be used as one of the indicators of
overcapacity (STECF, 2015). Thus, this may be what is occurring with the
single-bottom-trawlers (RS) and purse-seiners (SG) in Southeast and Southern
Brazil, whose NPM’s were found to be negative in this study. On the other hand,
profit margin values greater than 10% are considered good and indicate that the
segment is generating a satisfactory resource rent (TIETZE; LASCH, 2005;
STECF, 2015; PINELLO et al., 2017). Thus, profit margin values greater than
22% found in this study for large-pelagic longline fishing, pair-bottom-trawlers
(SG) and purse-seiners (AR) indicate that these fleets performed very well
economically during 2013 and 2014.
The NPV determines the viability of an investment or loan to purchase a
new vessel. If the NPV result is positive, the IRR (internal rate of return)
exceeds the cost of opportunity and the investment is of interest. The opposite
is true if the result is negative. The IRR is the maximum interest that a project
could pay for resources used if the project is to recover investment and
operating costs as well as still break-even (GITTINGER, 1982). The higher the
IRR is, the better and more profitable the business (fishery), and we can
consider the IRR as the interest rate that a financial application would need to
yield to be as profitable as the business. Thus, when considering these two
indicators of viability, the analyzed fleets can be classified into three groups.

103
First, fleets that are completely unviable (negative NPV and IRR less than
the opportunity cost of capital of 10%) include bottom-gillnetters and single-
bottom-trawlers for the Rio Grande region and pink-shrimp-trawlers and purse-
seining for sardines in the Santos/Guarujá region. This indicates that fishing
would yield smaller economic returns compared to a decision to invest the
capital of the cost amount in a bank at 10%. Purse-seiners and pink-shrimp-
trawlers for the Santos/Guarujá region have already been considered
economically net losers by Gasalla et al. (2010) in previous years. This
suggests that the results of the present study are not an artifact of the one year
examined but may be representative of longer-term trends in relative profitability
of these fisheries. In general, these four fleets are facing a serious situation for
two reasons: a) competition between bottom-gillnetters and single-bottom-
trawlers for the same target-species (Umbrina canosai and Micropogonias
furnieri); that is, intense fishing effort (number of active vessels); and b) a
decrease in the availability of target-species of these fisheries that can be
considered overexploited in the region (PAEZ, 1993; VALENTINI et al., 1991;
D’INCAO et al., 2002; HAIMOVICI; CARDOSO, 2016).
Second, the fleets considered vulnerable (octopus-pots (SG), sea-bob-
shrimp trawlers (SG), bottom-gillnetters (IN), and purse-seiners (IN)), had
negative NPVs with an interest rate higher than 15% and IRR values around
10% annually, indicating that the rate of return is very close to the rate of
attractiveness. However, in all fleets cited above, the net profit margin values
were positive but less than 10%. This classifies these fleets as having
vulnerable profitability and may be very close to the economic unviability case
when unpredictable factors that affect economic performance of a fishing
operation occur, including changes in the cost of key inputs such as increased
fuel costs, falling demand for the product and regulatory restrictions on fishing
(KING, 2007).
Finally, the fleets that showed a positive NPV for discount rates greater
than 20% and high values of IRR were large pelagic longline fisheries (tuna and
dolphinfish), pink-shrimp-trawlers (IN), pole-and-line (IN), pair-bottom-trawlers
(RG and SG), bottom-gillnetters (SG), and purse-seiners (AR). This means that
the investment generates a positive income stream and is viable under the
present conditions of free access to fishing (open access fishery). Here I define

104
an open access fishery as one in which fishing rights are non-existent, output
controls to the fishery are ill-defined or still unrestricted (GREBOVAL; MUNRO,
1999), and despite the existence of regulations governing the use of the fishery
resource, the rules are not followed or enforced.
According to Stutely (2000), fisheries are considered as high-risk activities
and require higher and faster returns on investment, with IRR greater than 40%
to 50%. Thus, we can consider that the best economic performance is shown by
tuna-longliners (RG) and pair-bottom-trawlers (SG) (IRR = 78% and 70%,
respectively), followed by dolphinfish longliners (IN, IRR=46%), tuna longliners
(IN, IRR=40%), and purse-seiners (AR, IRR= 40%). This finding may be mainly
due to these fleets presenting higher revenue, with a balance between the
volume of sales and the value of the product (higher fishing efficiency) as
discussed in Chapter 2. This result indicates that fishing investors may still find
this fishery attractive in the near future.
Consequently, good economic performance of these fleets can encourage
investment in at least part of the benefits of gear size and vessel technology, by
upgrading their engines, electronic equipment, and even in the construction of
new vessels. This investment of capital in vessel improvement may lead to an
increase in fishing capacity for these fleets, and in an open-access regime, the
excess capacity could occur with consequent difficulty in achieving the long-
term sustainability of the fisheries (CAMBIÉ et al., 2012). In fact, in the past,
Brazilian fleets received great credit and fiscal incentives for the construction
and modernization of their vessels that were spent on activities that increased
overfishing without taking into account the sustainability of fish stocks
(ABDALLAH; SUMAILA, 2007).
According to Paez (1993), the species traditionally harvested in Brazil,
including sardine, shrimp, croaker, weakfish, among others, were exploited to
nearly the maximum sustainable level in the early 1990s and may now be
overfished because the effort has grown widely since then (ABDALLAH;
SUMAILA, 2007). Thus, the effect of technological progress and reinvestment of
capital in the past caused an excess of capacity mainly for purse-seiners (SG),
bottom-gillnetters (RG), pink-shrimp-trawlers (SG), and single-bottom-trawlers
(RG) that were found as economically unviable in this study, as well as bottom-
gillnetters (IN), purse-seiners (IN), octopus-pots (SG), and sea-bob-shrimp-

105
trawlers (SG) that were found to have vulnerable viability and profitability.
Consequently, the increase in fishing pressure on stocks as well as the
reduction of incomes may be occurring with biological overfishing.
Therefore, the practice of subsidies for diesel oil is a reality in Brazilian
fisheries, and the operating costs of the fleets analyzed in this study were lower
than what was estimated. Nonetheless, this involves speculation about how
these fleets would have performed in the absence of the subsidies.
When comparing the same type of fleet by region, different economic
behavior should be noted, primarily for purse-seiners, bottom-gillnetters and
pink-shrimp-trawlers. Generally, the difference in economic performance
between these fleets can be attributed to the observed differences between the
volume of the catch per trip, number of trips per month, and market price of the
fish as discussed in Chapter 2 of this thesis. However, the best economic
performance of the bottom-gillnetters (SG) in relation to the other two bottom-
gillnetters (IN and RG) can be correlated to the difference between the initial
investment (vessels’ value) and the differences in the estimated values of
depreciation and opportunity cost presented by this study. Thus, based on how
the results from economic profitability and viability differ between the same fleet
segments over the regions, it seems that generalizations of regulatory
measures based only on the target species of fishery resources would be
inadequate.
In comparison, the fleets of Itajaí/Navegantes presented a more
homogeneous economic performance than in the other studied regions; that is,
no fleet with good viability and unviability was evidenced since the majority are
in a good economic state. The exceptions are purse-seining for sardines and
bottom-gillnet, classified as vulnerable in terms of economic viability.
Finally, for assess the viability of the fleets (IRR) was used a relatively
optimistic scenario with rate of interest of 10%. However, the exposed scenario
may be affect and modify if higher rates of interest are to be applied, mainly for
fleets classified as good viability, which in a less optimistic scenario, could be
classified as vulnerable and would specially be in a fragile condition.
106
5. CONCLUSION
From the 17 fleets studied, 24% were considered unviable, 23%
vulnerable, and 41% and 12% can be considered to have good and very good
viability, respectively (as a result of high incomes in fishery products in relation
to required investments). However, in terms of profitability, 12% of the fleets are
experiencing losses (bad profitability), and 35% and 53% can be considered
vulnerable and of good profitability, respectively.
For the time horizon of 20 years, we can conclude that bottom-gillnetters
and single-bottom-trawlers for the Rio Grande region as well as pink-shrimp-
trawlers and traditional purse-seining for sardines in the Santos/Guarujá region
operate in an economically wasteful manner, where the rate of return was less
than the presumed opportunity cost rate of 10% and NPV < 0. Furthermore, it
seems that these fisheries do not generate sufficient revenue to cover the cost
of depreciation as well as the opportunity cost of capital to generate funds for
reinvestment or to generate more employment and income. In addition, the
bottom-gillnet fleet and purse-seining for sardines from the Itajaí/Navegantes
region and octopus-pots and sea-bob-shrimp-trawlers from the Santos/Guarujá
region would especially be in a fragile condition, possibly very close to
economic unviability.
Whereas the commercial fisheries mentioned above need to be
economically viable to achieve self-reliance and provide food security and direct
economic benefits including income and employment, urgent measures must be
taken to ensure the sustainable development of these fishing fleets. Thus, the
economic vulnerability and unviability of some of the fleets in this study are
expected to be particularly relevant for consideration of the policy arena with
regard to the inclusion of an input control (fishing capacity and effort controls) in
combination with output controls, restricting catch directly and, thus, avoidance
of open-access regimes.
Finally, tuna-longliners (RG and IN), pair-bottom-trawlers (SG), dolphinfish
longliners (IN), and purse-seiners (AR) have obtained acceptable levels of
profitability during the period analyzed. Thus, it is concluded that the
expectations of obtaining an economic return on an investment in these fleets

107
are higher than those generated from alternative capital investments. In
addition, the pelagic fleets presented an economic performance that was
somewhat superior to the demersal ones in terms of relative importance.
Profitability and viability of the fleets differ between the same segments as
well as over regions. The Itajaí/Navegantes fleets seem to present the best
economic performance, while a greater number of less profitable and more
vulnerable fleets were identified in the Santos/Guarujá region. In addition, the
same fleet segments present different economic performance by region.
Therefore, while the present results concerning economic aspects of the fleets
do not reflect a pattern observed along all SE/S regions, they demonstrate the
need for broadening the view of the management of regional fisheries. It most
definitely cannot be characterized by only the target species.
108
General conclusions
109
GENERAL CONCLUSIONS
To evaluate and monitor the economic performance and viability of
commercial fleets and fisheries, field data and economic indicators are required.
Such data and indicators can be useful for bioeconomic analyses, impact
assessments of management measures, and analyses of the optimal size and
structure of fishing fleets. Economic and financial analysis of fisheries is
generally scarce in Brazil, and the absence of detailed data and analysis seems
to constrain the creation of a management context that would favor policy and
industrial decision-making. A multi-fleet perspective increases the optimal use
of this type of data at the ecosystem level and provides a unique perspective for
ecosystem-based fisheries management.
The presented knowledge construction on fishing costs is unprecedented
for the scale of the South Brazil Shelf Large Marine Ecosystem (SBLME). In
addition, this study provides a data set and data analysis that are fundamental
to understanding and comparing the cost structure of commercial fleets. Thus,
the study constitutes the basis for the examination of financial and economic
performance.
Generally, cost structure was similar among the SBLME fishing fleets, with
operational costs being higher, followed by labor costs. For the longliners, and
purse-seiners (from AR), the following inverse pattern was found: labor costs
were higher or had the same relative importance as operational costs.
Labor costs (or labor wages) are influenced by catch value and volume as
well as the running (i.e., operational) costs of fishing, whereas wages are
constrained by reduced productivity and high operational cost levels.
Operational costs varied depending on fishery type, gear and fishing
operations dynamics. Fuel cost, as expected, and vessel repair and
maintenance were the main operational costs for most fleets.
Firstly, based on the evidence that fuel is the primary fishing cost, it was
originally expected that current fuel subsidy policies would contribute to
improving the profitability of Rio Grande’s fleets. However, this expectation was
not confirmed, and the analysis revealed that the subsidies were ineffective in
increasing gross profits. In the case of Rio Grande, the subsidies may in fact

110
mask the economic reality of certain fishing fleets, particularly the single-
bottom-trawlers, which exhibited negative economic performance.
Gross profitability varied significantly among the fleets and was clearly
related to the following main factors that influence gross profit: fuel
consumption, vessel maintenance expenses, ice cost, fish price, and catch
volume. In addition, for certain fleets, such as the trawlers (from SG and IN) and
purse-seiners (from AR, SG and IN), technical features (i.e., vessel size and
number of fishing trips, respectively) also explained profitability. Moreover,
landing cost was a significant factor for the profit of those fleets.
Generally, the fishing fleets that exhibited the poorest short-term
performance also exhibited the poorest long-term performance. This outcome
suggests that the short-term profitability indicator (i.e., gross profit margin)
provides highly approximate insights into the net profitability of the fleets (i.e.,
long-term indicators). The short-term indicators (i.e., gross profit and gross profit
margin) are highlighted by this study as a benchmark indicative of how fleet
economics are behaving. These indicators may be used to identify vulnerable
fleets that require a better understanding of economic analyses, including
depreciation and opportunity cost, and of management.
Indicators of profitability and viability (i.e., net profit margin, net present
value, and internal interest return) identified the fleets with better economic
performance. All large-pelagic fleets (longliners and pole-and-line vessels), pair-
bottom-trawlers, purse-seiners for sardines from Angra dos Reis, bottom-
gillnetters from Santos/Guarujá and pink-shrimp-trawlers from Itajaí/Navegantes
were considered the fleets with the best economic performance of the region.
Thus, those fleets may be considered economically viable and capable of
continuing to generate employment and income for fishermen and the sector.
In contrast, bottom-gillnetters and single-bottom-trawlers from Rio Grande
and pink-shrimp-trawlers and traditional sardine purse-seiners from
Santos/Guarujá are operating in an economically wasteful manner and can be
considered unviable with bad profits even in an open-access regime. These
fleets do not seem to generate sufficient revenue to cover the cost of
depreciation and the opportunity cost of capital to generate funds for
reinvestment or capable of generating more employment and income. In
addition, the bottom-gillnetters and sardine purse-seiners from

111
Itajaí/Navegantes and the octopus-pot and sea-bob-shrimp-trawler fleets from
Santos/Guarujá are in a particularly fragile condition verging on economic
unviability.
The study also revealed intra-fleet heterogeneity according to region.
Fleets of the same segment (i.e., purse-seiners, bottom gillnets, pink-shrimp-
trawlers) exhibited different economic performances in different ports (AR, SG,
IN, RG). This outcome was due to the intrinsic characteristics of each location,
differences in catch volumes, the number of fishing trips per month, and the
market price of fish. The findings indicate that variation in the economic
performance of the fleets according to region is an important factor for
management purposes since fleets may not be treated homogeneously but only
in terms of fleet type.
For practical use, the fleet categories presented here (i.e., fleet type and
region) should be considered management units due to the distinct economic
performance of the same fleet in the four studied regions.
Overall, this thesis provides new, useful and detailed information on
several aspects of the cost structure and economic performance of the main
commercial fishing fleets in the Southern and Southeastern regions of Brazil
that comprise the SBLME.
The findings should guide decisions and resolutions aimed to redress the
economic situation of unviable and vulnerable fleets and in fishery management
measures (e.g., input controls/fishing effort reduction, recovery plans for
overfished stocks). The findings also suggest a need to revise the fuel subsidy
program in place in South Brazil. In this regard, the study showed that the
subsidy masks the profitability of the poorly performing fleets and that it has
been applied to vessels that are already profitable and do not require the
subsidy, particularly compared to fleets in poor economic condition. The
program also seems to promote an artificial increase in revenues, and when
applied to highly profitable fleets that may be operating in a scenario of
overcapacity, overfished stocks, and open-access conditions, it may damage
the overall fishery system.
Finally, this study presents a method for economic data collection that may
contribute to standardizing economic knowledge construction in data-poor
fisheries, such as S/SE Brazil’s. While it is noted that economic data on

112
Brazilian fisheries are scarce and difficult to collect, several steps could be
taken to improve this situation. These steps include the collection and insertion
of data on fishing costs and revenue in the current fisheries statistics systems.
The findings can also be particularly useful as a basis for future
projections and policy questions regarding the management of the fisheries and
fleets while ensuring food security, income and employment in the sector.
In addition, the individual results for each fleet may be useful for business
purposes and help vessel owners identify the factors that influence the
profitability of their vessels. Such outcomes may facilitate improvement in the
internal processes of the fishing industry.
Lastly, it should be mentioned that the relevant thesis findings and
evidence should be ideally considered in connection with other regional issues
that may indirectly influence the economic performance of fishing vessels, such
as the regional fishing effort (i.e., number of active vessels), the exploitation
status of target stocks, and the lack of fisheries management.

113
References

114
REFERENCES ABDALLAH, P. R.; SUMAILA, U.R. A historical account of Brazilian policy on fisheries subsidies. Marine Policy, v. 31, p. 444-50, 2007. ABERNETHY, K. E. et al. Fuelling the decline in UK fishing communities? ICES Journal of Marine Science, v. 67, p. 1076-1085, 2010. ALMEIDA, O. T. et al. The commercial fisheries of the lower Amazon: an economic analysis. Fisheries Management and Ecology, v. 8, p. 253-269, 2001. ANDERSEN, P. ‘On Rent of Fishing Grounds’: a Translation of Jens Warming's 1911 Article, with an Introduction. History of Political Economy, v. 15, n. 3, p. 391-396, 1983. ANDERSON, L. G.; SEIJO, J. C. Bioeconomics of fisheries management. Ames, IA: Wiley Blackwell, 2010. ANDERSON, J. L. et al. The Fishery Performance Indicators: A Management Tool for Triple Bottom Line Outcomes. PLoS ONE, v. 10, n. 5, p. e0122809, 2015. ARNASON, R.; KELLEHER, K.; WILLMANN, R. The Sunken Billions: The Economic Justification for Fisheries Reform. Agriculture and Rural Development Department. Washington, DC: The World Bank, 2009. AZEVEDO, V. G. et al. Custos operacionais de captura da frota camaroeira do litoral norte do Estado de São Paulo: análise comparada entre valores de mercado e valores de cooperados. Brazilian Journal of Aquatic Science and Technology, v. 18, n. 1, p. 71-79, 2014. BARCLAY, K.; CARTWRIGHT, I. Governance of tuna industries: the key to economic viability and sustainability in the Western and Central Pacific Ocean. Marine Policy, v. 31, p.348-58, 2007. BERKES, F. (Ed.). Common property resources: Ecology and community-based sustainable development. London: Belhaven Press, 1989. 302 p. BERKES, F. Implementing ecosystem-based management: evolution or revolution? Fish and Fisheries, v. 13, n. 4, p. 465-476, 2011. BINET, T. Fuelling the threat for sustainable fisheries in Europe. Brussels: WWF European Policy Office, 2007. BISCAL, G. The Southeast South American shelf large marine ecosystem: Evolution and components. Marine Policy, v. 19, n. 1 p. 21-38, 1995. BORRELLO, A. et al. Profitability of the EU fishing fleet. In: Directorate-general for internal policies policy department B: structural and cohesion

115
policies. European Parliament's Committee on Fisheries. IP/B/PECH/IC/2013-087. 2013. BOUNCOEUR, J. et al. On the (ir)relevance of rates of return measures of economic performance to small boats. Fisheries Research, v. 49, n. 2, p. 105-115, 2000. BRANCH, T. A. et al. Fleet dynamics and fishermen behavior: lessons for fisheries managers. Canadian Journal of Fisheries and Aquatic Sciences, v. 63, n. 7, p. 1647-1668, 2006. BRAZIL. Presidência da República. Decreto nº 7.077, de 26 de janeiro de 2010. In: Diário Oficial [da] Republica Federativa do Brasil, Brasília, DF, 27 jan. 2010a. Seção 1, p 29. BRAZIL. Ministério da Pesca e Aquicultura IN n° 2, de 27 de janeiro de 2010. In: Diário Oficial [da] Republica Federativa do Brasil, Brasília, DF, 28 jan. 01 2010b. Seção 1, p. 51. BRAZIL. Ministério da Pesca e Aquicultura, Portaria nº 14, de 28 de janeiro de 2015. In: Diário Oficial [da] Republica Federativa do Brasil, Brasília, DF, 29 jan. 2015a. Seção 1, p. 56. BRAZIL. Ministério da Pesca e Aquicultura. Portaria nº 61, de 26 de fevereiro de 2015. Diário Oficial [da] Republica Federativa do Brasil, Brasília, DF, 27 fev. 2015b. Seção 1, p. 103. BRAZIL. Ministério da Pesca e Aquicultura, Portaria nº 166, de 29 de abril de 2015. In: Diário Oficial [da] Republica Federativa do Brasil, Brasília, DF 30 abr. 2015c. Seção 1, p 90. BRAZIL Subvention Program to Oil Price Diesel for Fishing Vessels program. 2016. Ministério da Agricultura, Pecuária e Abastecimento. Disponível em: <http://sistemasweb.agricultura.gov.br/ssadp/legislacao/listar>. Acesso em: 06 out. 2017.
CAMBIÈ, G. et al. Economic performance of costal fisheries in Galicia (NW Spain): case study of Cíes Islands. Aquatic Living Resources, v. 25, p. 195-204, 2012. CAMPOS, E. J. D. et al. Shelf break upwelling driven by Brazil current cyclonic meanders. Geophysical Research Letter, v. 27, p. 751-754, 2000. CARDOSO, R. S.; FREITAS, C. E. C. The composition of cost and income of fishing expeditions of small-scale fishing fleet in the Medium Madeira River region, state of Amazonas, Brazil. Acta Amazonica, v. 36, n. 4, p. 519-24, 2006.

116
CARVALHO, R. C. A. et al. Custos e rentabilidade de embarcações envolvidas na pesca da lagosta no nordeste do Brasil, 1995. Boletim Técnico-Científico do CEPENE, Tamandaré, v. 4, n. 1, p. 233-61, 1996. CARVALHO, R. C. A. et al. Análise de custo e rentabilidade da captura e beneficiamento de camarão, Estados de Pernambuco e Alagoas, Nordeste do Brasil, 1997-1998. Boletim Técnico-Científico do CEPENE, Tamandaré, v. 8, p. 279-296, 2000. CARVALHO, R. C. A. et al. Análise de custo e rentabilidade de embarcações industriais envolvidas na captura de camarão-rosa no litoral norte do Brasil, 2002. Boletim Técnico Científico do CEPNOR, Belém, v, 3, n. 1, p. 179-190, 2003. CASTRO, L. A. B. et al. Sensitivity of the BEAM4 fisheries bioeconomic model to the main biological input parameters. Ecological Modelling, v. 141, p. 53-66, 2001. IBAMA (INSTITUTO BRASILEIRO DO MEIO AMBIENTE E DOS RECURSOS NATURAIS RENOVÁVEIS). Desembarque de pescado no Rio Grande do Sul: 2011. Rio Grande: IBAMA/CEPERG, 2012. CERGOLE, M. C.; ROSSI-WONGTSCHOWSKI, C. L. D. B. Dinâmica populacional da sardinha Sardinella brasiliensis. In: CERGOLE, M. C.; ÁVILA-DA-SILVA, A. O.; ROSSI-WONGTSCHOWSLI, C. L. D. B. (Ed.). Análise das principais pescarias comerciais das regiões Sudeste e Sul do Brasil: dinâmica populacional das espécies em explotação. São Paulo: Instituto Oceanográfico – USP, 2005. 176 p. (Série Documentos REVIZEE – Score Sul). CEMBRA (CENTRO DE EXCELÊNCIA PARA O MAR BRASILEIRO). O Brasil e o Mar no Século XXI. Rio de Janeiro: CEMBRA, 2010. CHARLES, A. T. Sustainable Fishery Systems. Oxford: Blackwell Science Ltd, 2008. CLAY, P. M. et al. Measuring the social and economic performance of catch share programs: Definition of metrics and application to the U.S. Northeast Region groundfish fishery. Marine Policy, v. 44, p. 27-36, 2014. COGLAN, L.; PASCOE, S. Separating resource rents from intra-marginal rents in fisheries’ economic survey data. Agricultural and Resource Economics Review, v. 28 n. 2, p. 219-228, 1999. CONRAD, J. M. Resource Economics. 2nd ed. New York: Cambridge University Press, 2010. 300 p. CRILLY, R.; ESTEBAN, A. Small versus large-scale, multi-fleet fisheries: The case for economic, social and environmental access criteria in European fisheries. Marine Policy, v. 37, p. 20-27, 2013.

117
D’INCAO, F. et al. Avaliação da pesca de camarões nas regiões sudeste e sul do Brasil. Atlântica, Rio Grande, v. 24, n. 2, p. 103-116, 2002. DAURÈS, F. et al. Modelling the cost structure of French fishing vessels in the Bay of Biscay. Fisheries Research, v. 146, p. 74-85, 2013. DAVIE, S. et al. Modelling fuel consumption of fishing vessels for predictive use. ICES Journal of Marine Science, v. 72, n. 2, p. 708-19, 2014. DIEGUES, A. C. S. Pescadores, Camponeses e Trabalhadores do Mar. São Paulo: Ática,1983. EIA (U. S. Energy Information Agency). Europe Brent Spot Price Fob. Disponível em: <http://www.eia.gov/dnav/pet/hist/LeafHandler.ashx?n=PET&s= RBRTE&f=M>. Acesso em: 22 mai. 17, 2012. FAGUNDES, L.; VICENTE, J.R.; MARGARIDO, M.A. Margens de comercialização e causalidade de preços de sardinha, 1984-1996. Agric., v. 49, n. 1, p. 1-14, 2002. VICENTE, J.R.; FAGUNDES, L.; MARGARIDO, M.A. Determinantes da oferta e demanda de sardinha, 1989-2000. In: XLII CONGRESSO DA SOCIEDADE BRASILEIRA DE ECONOMIA E SOCIOLOGIA RURAL, Cuiabá, MT, julho 2004. FAO (FOOD AND AGRICULTURE ORGANIZATION). The State of World Fisheries and Aquaculture 2016. Contributing to food security and nutrition for all. Rome: FAO, 2016. 200 p. FAO (FOOD AND AGRICULTURE ORGANIZATION). Fishery and Aquaculture Country Profiles. Brazil. Country Profile Fact Sheets. In: FAO Fisheries and Aquaculture Department [online]. Rome. Updated 1 June 2010. [Cited 20 January 2018]. Disponível em: <http://www.fao.org/fishery/>. FERM (FISHERIES ECONOMICS RESEARCH AND MANAGEMENT PTY). LTD. ITQs, ageing boats, and the price of fish: Profitability and autonomous adjustment in the South-East Trawl Fishery. Canberra: Fisheries Research Fund, 2004. Disponível em: <http://www.afma.gov.au/ fisheries/sess/sess_commonwealth/publications/200411_ferm_report.pdf>. Acesso em: 22 mai.17. FIELD, B. C.; FIELD, M. K. Environmental economics: an introduction. New York: McGraw-Hill, 2006. FIPERJ (FUNDAÇÃO INSTITUTO DE PESCA DO ESTADO DO RIO DE JANEIRO). Relatório 2011. Rio de Janeiro: FIPERJ, Secretaria de Desenvolvimento Regional, Abastecimento e Pesca, 2011. 52 p. Relatório. FRIEDMAN, D.; MCNEILL, D. Morals and Markets: The Dangerous Balance. New York: Palgrave Macmillan, 2013.

118
GASALLA, M.A. Ecosystem-based fisheries modeling in the South Brazil Shelf: a review based on the LME perspective. In: GLOBAL CONFERENCE ON LARGE MARINE ECOSYSTEMS, 2007, Qingdao, China, September 2007. GASALLA, M. A. et al. A comparative multi-fleet analysis of socio-economic indicators for fishery management in SE Brazil. Progress in Oceanography, v. 87, p. 304-19, 2010. GERHARDSEN, G. M. Production Economics in Fisheries. Revista de Economia, Lisboa, v. 5, p. 1-12, 1952. GITTINGER, J. P. Economic Analysis of Agricultural Projects. Washington: The Johns Hopkins University Press, 1982. GLASER, M.; DIELE, K. Asymmetric outcomes: assessing central aspects of the biological, economic and social sustainability of a mangrove crab fishery, Ucides cordatus (Ocypodidae), in North Brazil. Ecological Economics, v. 49, n. 3, p. 361-73, 2004. GORDON, H. S. The Economic Theory of a Common-Property Resource: The Fishery. Journal of Political Economy, v. 62, n.2, p. 124-42, 1954. GONZÁLEZ, P. E. et al. Economic impacts of using copper alloy mesh in trout aquaculture: Chilean example. Aquaculture Economics & Management, v. 17, n. 1, p. 71-86, 2013. GREBOVAL, D.; MUNRO, G. Overcapitalization and excess capacity in world fisheries: underlying economics and methods of control. In: GREBOVAL, D. (Ed.), Managing fishing capacity: selected papers on underlying concepts and issues. FAO Fisheries Technical Paper, n. 386. Rome: FAO, 1999. p 1-48. GUILLEN, J. et al. Remuneration systems used in the fishing sector and their consequences on crew wages and labor rent creation. Maritime Studies, v. 16, n. 3, 2017. GULBRANDSEN, O. Fuel savings for small fishing vessels - a manual. Rome: FAO, 2012. 57 p. GUNNLAUGSSON, S. B.; SAEVALDSSON, H. The Icelandic fishing industry: Its development and financial performance under a uniform individual quota system. Marine Policy, v. 71, p. 73-81, 2016. HABIB, A. ULLAH, MD. H.; DUY, N.N. Bioeconomics of Commercial Marine Fisheries of Bay of Bengal. Economics Research International, v. 2014, Article ID 538074, 2014. 10 p. HAIMOVICI, M.; CARDOSO, L. G. Stock collapse of Umbrina canosai off southern Brazil due to the introduction of mid-water trawl. Boletim Instituto de Pesca, v. 42, n. 1, p. 258–267, 2016.

119
HAIMOVICI, M.; IGNÁCIO, J. M. Micropogonias furnieri (Desmarest, 1823). In: CERGOLE, M. C.; ÁVILA-DA-SILVA, A. O.; ROSSI-WONGSCHOSKI, C. L. B. (Ed.). Análise das principais pescarias comerciais da região sudeste-sul do Brasil: dinâmica populacional das espécies em explotação, São Paulo: Instituto Oceanográfico-USP, 2005, p. 101-07. (Série Documentos REVIZEE-Score Sul). HAIMOVICI, M.; VASCONCELLOS, M.; KALIKOSKI, D. C.; ABDALAH, P. R.; CASTELLO, J. P.; HELLEBRANDT, D. Diagnóstico da pesca no litoral do estado do Rio Grande do Sul. In: ISAAC, V. J.; MARTINS A. S.; HAIMOVICI, M.; ANDRIGUETTO-FILHO, J. M. (Ed.). A pesca marinha e estuarina do Brasil no século XXI: recursos, tecnologias, aspectos socioeconômicos e institucionais. Belém: UFPA, 2006, p. 141-56. HANNA, S. Economics in the Service of Fisheries Policy and Practice. Marine Resource Economics, v. 26, p. 87-94, 2011. HEILEMAN, S.; GASALLA, M.A. South Brazil Shelf LME - Chapter XVI. In: SHERMAN, K.; HEMPEL, G. (Org.). The UNEP Large Marine Ecosystems Report: A Perspective on Changing Conditions in LMEs of the World's Regional Seas. 2rd ed. Nairobi: United Nations Environmental Program (UNEP), 2008. p. 723-734. ICCAT (INTERNATIONAL COMMISSION FOR THE CONSERVATION OF ATLANTIC TUNAS). Report for biennial period, 2014-15, Part I, vol. 3. Madrid: ICCT Reports, 2015. Disponível em: <https://www.iccat. int/en /pubs_biennial.htm>. Acesso em: 22 mai. 17. IP (INSTITUTO DE PESCA DO ESTADO DE SÃO PAULO). Uma Visão Geral da Pesca em São Paulo. São Paulo, 2018. Disponível em: <http://www.propesq.pesca.sp.gov.br/16/conteudo>. Acesso em: 20 jan. 2018. JOHNSON, T. Fuel-Saving Measures for Fishing Industry Vessels. Alaska Sea Grant Marine Advisory Program, ASG-57, 2011. Disponível em: <http://nsgd.gso.uri.edu/aku/akug11010.pdf>. Acesso em: 10 ago. 2017. KING, M. G. Fisheries biology, assessment, and management. Oxford: Blackwell Publishing Ltd, 2007. KLIPPEL, S.; VOOREN, C. M.; LAMÓNACA, A. F.; PERES, M. B. A Pesca industrial no Sul do Brasil. In: VOOREN, C. M.; KLIPPEL, S. (Ed.). Ações para a conservação de tubarões e raias no sul do Brasil. Porto Alegre: Igaré, 2005, p. 135-1782. LAM, V. W. Y. et al. Construction and first applications of a global cost of fishing database. ICES Journal of Marine Science, v. 68, n. 9, p. 1996-2004, 2011. LUCENA, F.; O’BRIEN, C. M. The consequences of different scenarios in the management of the gillnet and purse-seine fisheries targeting Pomatomus

120
saltatrix and Cynoscion guatucupa in southern Brazil: a bio-economic approach. ICES Journal of Marine Science, v. 62, p. 201-13, 2005. MARTINI, R. 2012. Fuel Tax Concessions in the Fisheries Sector. OECD Food, Agriculture and Fisheries Papers, n. 56. Paris: OECD Publishing, 2012. MATSUURA, Y. Análise econômica da produção da sardinha na região Sudeste do Brasil. Boletim Instituto Oceanográfico, v. 30, n.1, p. 57-64, 1981. MAYER, F. P.; ANDRADE, H. A. Captura, Esforço e CPUE do Espadarte (Xiphias gladius) desembarcado em Santa Catarina em 2000 e 2001. Notas Técnicas da FACIMAR, v. 7, p. 23-36, 2003. MAYER, F. P.; ANDRADE, H. A. Swordfish (Xiphias gladius) and blue shark (Prionace glauca) fishery and the dynamics of the fleet off southeastern Brazilian coast. Collective Volume of Scientific Papers, ICCAT, v. 58, n. 3, p. 1204-1214, 2005. MENDONCA, J. T., PEREIRA, A. L. C. Management of gillnet fisheries in the south coast of the state of São Paulo, Brazil. Anais da Academia Brasileira de Ciências, v. 86, n. 3, p. 1227-1237, 2014. MILAZZO, M. Subsidies in world fisheries: A re-examination. World Bank Technical Paper, n. 406. Washington, DC: The World Bank, 1998. Fisheries series. MILLER, K. et al. Climate change, uncertainty, and resilient fisheries: Institutional responses through integrative science. Progress in Oceanography, v. 87, p. 338-346, 2010. MMA (MINISTÉRIO DO MEIO AMBIENTE). Programa REVIZEE: Avaliação do potencial sustentável de recursos vivos na zona econômica exclusiva – Relatório Executivo. Brasília: MMA, 2006. 280 p. MPA (MINISTÉRIO DA PESCA E AQUICULTURA). Boletim estatístico da Pesca e Aquicultura 2011. Brasília: MPA/CGMIP, 2012. 60p. MMOPELWA, G. et al. Cost Benefit Analysis of Commercial Fishing in Shakawe, Ngamiland. Botswana Notes and Records, v. 37, p. 11-21, 2005. Special Edition on Human Interactions and Natural Resource Dynamics in the Okavango Delta and Ngamiland. MONTGOMERY, D. C.; PECK, E. A. Introduction to Linear Regression Analysis. New York: Wiley, 1992. MOREY, E. R. Fishery economics: an introduction and review. Natural Resources Journal, v. 20, p. 827-851, 1980.

121
MUNRO, G. R. Mathematical Bioeconomics and the Evolution of Modern Fisheries Economics. Bulletin of Mathematical Biology, v. 54, n. 2, p. 163-84, 1992. MUNRO, G. R.; SUMAILA, U. R. On the Contributions of Colin Clark to Fisheries Economics. Environmental and Resource Economics, v. 61, n. 1, p. 1-17, 2015. MURPHY, C. A. et al. Natural abiotic factors more than anthropogenic perturbation shape the invasion of Eastern Mosquitofish (Gambusia holbrooki). Freshwater Science, v. 34, n. 3, p. 965-974, 2015. NGA, C. T. H. A study on the economic efficiency of the offshore long line fishery in Khanh Hoa Province, Vietnam. 2009. 68 f. Master Thesis (Fisheries and Aquaculture Management and Economics) – The Norwegian College of Fishery Science, University of Tromso, Norway, 2009. OECD (ORGANIZATION FOR ECONOMIC CO-OPERATION AND DEVELOPMENT). Financial Support to Fisheries: implications for sustainable development. Paris: OECD Publishing, 2006. 374p. OLSON, D. B. et al. Temporal variations in the separations of Brazil and Malvinas Currents. Deep Sea Research, v. 35, p. 1971-1990, 1988. OSTROM, E. General Framework for Analyzing Sustainability of Social-Ecological Systems. Science, v. 325, p. 419-422, 2009. OSTROM, E. Reformulating the Commons. Swiss Political Science Review, v. 6, n. 1, p. 29-52, 2000. OSTROM, E.; GARDNER, R.; WALKER, J. M. Rules, Games, and Common-Pool Resources. Ann Arbor, MI: University of Michigan Press, 1994. PAEZ, M. L. D. Exploração de recursos pesqueiros no Brasil. Revista de Administração, v. 28, p. 51–61, 1993. PAIVA, C.S.M.; FREIRE, D.M.C.; CECATTI, J.G. Generalized Additive Models for Location, Scale and Shape (GAMLSS) for Modeling Reference. Revista Brasileira de Ciências da Saúde, v. 12, n. 3, p. 289-310, 2008. PASCOE, S. Estimation of cost functions in a data poor environment: the case of capacity estimation in fisheries. Applied Economics, v. 39, p. 2643-2654, 2007. PASCOE, S. et al. Economic and financial performance of the UK English Channel fleet. CEMARE Research Report, n. 44, CEMARE, University of Portsmouth, UK, 1996. PAULY, D. From growth to Malthusian overfishing: stages of fisheries resources misuse. Traditional Marine Resource Management and Knowledge

122
Information Bulletin, v. 3, p.7-14, 1993. PEREZ, J. A. A. et al. Estrutura e dinâmica da pescaria do peixe-sapo Lophius gastrophysus no sudeste e sul do Brasil. Boletim do Instituto de Pesca, v. 28, n. 2, p. 205-31, 2002. PEREZ, J. A. A. et al. Relatório da reunião técnica de ordenamento da pesca de arrasto nas regiões Sudeste e Sul do Brasil. Notas Técnicas da FACIMAR, v. 5, p. 1-34, 2001. PINCINATO, R. B. M.; GASALLA, M. A. Priceless prices and marine food webs: Long-term patterns of change and fishing impacts in the South Brazil Bight as reflected by the seafood market. Progress in Oceanography, v. 87, p. 320-330, 2010. PINELLO, D. Handbook for fisheries socio-economic sample survey. Principles and practice. FAO Fisheries and Aquaculture Technical Paper, n. 613, Rome: FAO, 2017, 613 p. PIO, V. M. et al. A cost-benefit analysis of three gillnet fisheries in Santa Catarina, Brazil: contributing to fisheries management decisions. Latin American Journal of Aquatic Research, v. 44, n. 5, p. 1096-1115, 2016. PIO, V.M.; PEZZUTO, P.R.; WAHRLICH, R. Only two fisheries? Characteristics of the industrial bottom gillnet fisheries in southeastern and southern Brazil and their implications for management. Latin American Journal of Aquatic Research, v. 44, n. 5, p. 882-97, 2016. PMAP (PROGRAMA DE MONITORATMENTO DA ATIVIDADE PESQUEIRA MARINHA E ESTUARINA DO ESTADO DE SÃO PAULO). 2013. Disponível em: <http://www.propesq.pesca.sp.gov.br/>. Acesso em: ago. 2014 POOS, J. J. et al. Adaptive response of beam trawl fishers to rising fuel cost. ICES Journal of Marine Science, v. 70, n. 3, p. 675-684, 2013. PORT, D. et al. The evolution of the industrial trawl fishery footprint off southeastern and southern Brazil. Latin American Journal of Aquatic Research, v. 44, n. 5, p. 908-925, 2016. PRINGLE, H. Cabot, Cod and the Colonist. Canadian Geographic, v. July/Augus, p. 30-39, 1997. PRELLEZO, R. et al. A review of EU bio-economic models for fisheries: The value of a diversity of models. Marine Policy, v. 36, n. 2, p. 423-431, 2012. QUAGGIO, A. L. C. et al. Fishery biology of the swordfish (Xiphias gladius, Linnaeus 1758) caught by surface longliners based in Itajaí, southern Brazil. Brazilian Journal of Oceanography, v. 59, n. 2, p. 171-84, 2011.

123
REGO, M. A. S. et al. Financial viability of inserting the biofloc technology in a marine shrimp Litopenaeus vannamei farm: a case study in the state of Pernambuco, Brazil. Aquaculture International, v. 25, v. 1, p. 473-483, 2017. RENCK, E. Comparação entre as embarcações pesqueiras que praticam o método de cerco construídas no vale do Itajaí e Peru. 2014. Trabalho de Conclusão do Curso (Engenharia Naval), Universidade Federal de Santa Catarina, 2014. RGP (REGISTRO GERAL DA ATIVIDADE PESQUEIRA). Registro Geral da Atividade Pesqueira. 2015. Disponível em: <http://sinpesq.mpa.gov.br/rgp>. Acesso em: 22 mai.17. RIGBY, R. A; STASINOPOULOS, D. M. Generalized Additive Models for Location, Scale and Shape. Applied Statistics, v. 54, p. 507–554, 2005. ROMEO, G. et al. Socioeconomic Performance of Fisheries in the “Stretto” Coast FLAG in Southern Italy. Procedia - Social and Behavioral Sciences, v. 223, p. 448-455, 2016. ROSA, E. Produção registrada entre 2010 e 2013 mantém Santa Catarina na liderança da indústria pesqueira. Notícias do Dia, Florianópolis, 12 Mar. 2014. Disponível em: <https://ndonline.com.br/florianopolis/noticias/producao-registrada-entre-2010-e-2013-mantem-santa-catarina-na-lideranca-da-industria-pesqueira> Acesso em: 20 jan. 2018. RUFFINO, M. L.; ABDALLAH, P. R. Fisheries subsidies in Brazil in the century XX: statistics and discussion. In: CONGRESSO BRASILEIRO DE ECONOMIA, ADMINISTRAÇÃO E SOCIOLOGIA RURAL, 54., 2016, Maceió. Resumos Maceió: UFAL, 2016.
SAPAG, N.; SAPAG, R. Preparación y evaluación de proyectos. Bogotá: McGrawHill, 2008, 445 p. SCHAU, E. M. et al. Energy consumption in the Norwegian fisheries. Journal of Cleaner Production, v. 17, n. 3, p. 325-334, 2009. SCHRANK, W. E. Introducing fisheries subsidies. FAO Fisheries Technical Paper, n. 437. Rome: FAO, 2003. 52 p. SCOTT, A. The Pedigree of Fishery Economics. Marine Resource Economics, v. 26, n. 1, p. 75-85, 2011. SEELIGER, U.; ODEBRECHT, C.; CASTELLO, J. P. 1998. Os Ecossistemas Costeiro e Marinho do Extremo Sul do Brasil. Rio Grande: Ecoscientia, 1998. 341p. SHERMAN, K.; HEMPEL, G. (eds.) The UNEP Large Marine Ecosystem Report: A perspective on changing conditions in LMEs of the world's

124
Regional Seas. UNEP Regional Seas Report and Studies n. 182. Nairobi, Kenya, 2008. 872 p. SILVA, R. C. et al. 2005. A Industria pesqueira no Rio Grande do Sul – Ascensão e Queda. REAd, v. 11, n. 6, 2005. SIMMONDS, E. J. et al. The role of fisheries data in the development evaluation and impact assessment in support of European fisheries plans. ICES Journal of Marine Science, v. 68, n.8, p. 1689-1698, 2011. SINDIPI- Sindicato dos Armadores e Indústrias de Pesca de Itajaí e Região. 2013. Database. SKIRTUN, M. Review of financial and economic performance of the Fijian offshore longline fishery. Fiji Department of Fisheries, Annual report to the Commission: part 1 information on fisheries, research and statistics, Country report WCPFC-SC12-AR/CCM-07, Scientific Committee, WCPFC, 2016 SOUZA, K. M. et al. Viabilidade econômica da pesca de camarão-sete-barbas com embarcação de pequeno porte na praia do Perequê, Guarujá, Estado de São Paulo. Informações Econômicas, v.39, n.4, p. 30-37, 2009. STASINOPOULOS, D. M.; RIGBY, R. A. Generalized additive models for location scale and shape (GAMLSS) in R. Journal of Statistical Software, v. 23, n. 7, 2007. STECF (SCIENTIFIC, TECHNICAL AND ECONOMIC COMMITTEE FOR FISHERIES). The 2015 Annual Economic Report on the EU Fishing Fleet (STECF-15-07). 2015. Luxembourg: Publications Office of the European Union EUR 27428 EN - JRC 97371, 434 p. STRAMMA, L.; ENGLAND, M. On the water masses and mean circulation of the South Atlantic Ocean. Journal of Geophysical Research, v. 104, p. 2863-2883, 1999. STUTELY, R. Plan de negocios: la estrategia inteligente. México: Pearson Education, 2000, 320 p. SUMAILA, U. R. et al. A bottom-up re-estimation of global fisheries subsidies. Journal of Bioeconomics, v. 12, p. 201-225, 2010. SUMAILA, U. R. et al. Benefits of Rebuilding Global Marine Fisheries Outweigh Costs. PLoS ONE, v. 7, n. 7, p. e40542, 2012. SUMAILA, U. R. et al. Fuel price increase, subsidies, overcapacity, and resource sustainability. ICES Journal of Marine Science, v. 65, p. 832-840, 2008. SUMAILA, U. R. et al. Rebuilding Hong Kong’s marine fisheries: an evaluation of management option. Fisheries Centre Research Reports, v. 15, n. 3, 2007.
125
SUURONENA, P. et al. Low impact and fuel efficient fishing—Looking beyond the horizon. Fisheries Research, v. 119-120, p. 135-146, 2012. TAMAR - Projeto Tartaruga Marinha. Banco de dados 2013. Plano de Ação Nacional para a Redução da Captura Incidental de Tartarugas Marinhas pela Atividade Pesqueira. THRANE, M. Energy Consumption in the Danish Fishery: Identification of Key Factors. Journal of Industrial Ecology, v. 8, n. 1, p. 223-39, 2004. TIETZE, U.; LASCH, R. Findings of the interregional study on the financial and economic performance of marine capture fisheries. In: TIETZE, U.; LASCH, R.; THOMSEN, B.; RIHAN, D. Economic performance and fishing efficiency of marine capture fisheries. FAO Fisheries Technical Paper, n. 486, Rome: FAO, 2005. TYEDMERS, P.H et al. Fuelling global fishing fleets. Ambio, v. 34, n. 8, p. 635-38, 2005. UNIVERSIDADE DO VALE DO ITAJAÍ. CENTRO DE CIÊNCIAS TECNOLÓGICAS DA TERRA E DO MAR. Boletim estatístico da pesca industrial de Santa Catarina – ano 2002. Itajaí: UNIVALI-CTTMar, 2003. 93 p. Relatório técnico. VALENTINI, H. et al. Análise do camarão-rosa (Penaeus brasiliensis e P. paulensis) nas regiões sudeste e sul do Brasil. Atlântica, Rio Grande, v. 13, n. 1, p. 143-158, 1991. VALENTINI, H. et al. Evolução da pesca das principais espécies demersais da costa sudeste do Brasil, pela frota de arrasteiros de parelha baseada em São Paulo, de 1968 a 1987. Atlântica, Rio Grande, v. 13, n. 1, p. 87-95, 1991. VALENTINI, H.; PEZZUTO, P. R. Análise das principais pescarias comerciais da Região Sudeste-Sul do Brasil com base na produção controlada do período 1986-2004. São Paulo: Instituto Oceanográfico – USP, 2006. (Série documentos REVIZEE). VESTERGAARD, A. Principal-Agent Problems in Fisheries. In: GRAFTON, R.; HILBORN, R.; SQUIRES, D.; TAIT, M.; WILLIANS, M. (Ed.). Handbook of Marine Fisheries Conservation and Management. New York, NY: Oxford University Press, 2010, p. 563-571. VIEIRA, M. M. et al. Fatores institucionais determinantes da configuração dos campos organizacionais da indústria da pesca no Rio de Janeiro e no Rio Grande do Sul. Revista Brasileira de Administração Pública, v. 38, p. 947-77, 2004. WALDEN J. B.; KITTS, N. Measuring fishery profitability: An index number approach. Marine Policy, v. 43, p. 321-326, 2014.

126
WALDEN, J. B. Economic health of the northeast (U.S.) multispecies trawl fleet 1996–2010. Fisheries Research, v. 139, p. 98-104, 2013. WALLIS, P.; FLAATEN, O. Fisheries management costs: concepts and studies. In: BIENNIAL CONFERENCE OF THE INTERNATIONAL INSTITUTE OF FISHERIES ECONOMICS AND TRADE (IIFET), 10., 2000, Corvallis. Proceedings...Corvallis, Oregon, USA: IIFET, 2000. Disponível em: <https://ir.library.oregonstate.edu/concern/conference_proceedings_or_journals/37720d576>. Acesso em: 22 mai. 2017. WARD, J. M. et al. Measuring and assessing capacity in fisheries: Basic concepts and management options. FAO Fisheries Technical Papers, n. 433, Rome: FAO, 2004. WARMING, J. 1911. Om “grundrente” af fiskegrunde. Nationalókonomisk Tidsskrift, p. 495–506, 1991. Translated in ANDERSEN, P. ‘On Rent of Fishing Grounds’: a Translation of Jens Warming's 1911 Article, with an Introduction. History of Political Economy, v. 15, n. 3, p. 391-396, 1983. WATERS, J. R. Restricted Access vs. Open Access Methods of Management: Toward More Effective Regulation of Fishing Effort. Marine Fisheries Review, v. 53, n. 3, p. 1-10, 1991. WHITMARSH, D. et al. The economic sustainability of artisanal fisheries: the case of the trawl ban in the Gulf of Castellammare, NW Sicily. Marine Policy, v. 27, p. 489-497, 2003. WHITMARSH, D. et al. The profitability of marine commercial fisheries: A review of economic information needs with particular reference to the UK. Marine Policy, v.24, n.3, p. 257-263, 2000. ZAR, J. H. Biostatistical Analysis. 3rd ed. New Jersey: Prentice Hall, 1996, 662 p. ZUUR, A. F. et al. A protocol for data exploration to avoid common statistical problems. Methods in Ecology and Evolution, v.1, p. 3-14, 2010.
127
Appendix

128
APPENDIX Appendix 1. Portuguese names of studied fishing fleets, type of fishing gear and target species.

129
Frota(Fleet)
Espécie-alvo (Target-species)
Aparelho de pesca (Gear)
Atuneiros(Tuna-longliners )
Destinado à captura de peixes pelágicos, e formado por uma linha principal (linha madre), linhas secundárias (alças) e anzóis que são deixado à deriva sustentado por bóias.
Frota de Itaipava - Espinhel pelágico
(Dolphinfish-longliners)
Espinhel de superfície
Atuns
Meca/Espadarte
Tubarão-azul
Espinhel de superfície
A pesca do dourado está associada à atuação de uma frota semi-industrial, especializada no uso de anzóis e linhas, sediada em Itaipava no Estado do Espírito Santo.
Dourado
Vara e isca-viva (Pole-and-line)
Nesta modalidade de pesca, a isca é mantida viva a bordo em tinas e lançada ao mar para atrair o cardume. À bordo do barco, os pescadores munidos de vara com linha e anzol as lançam em cima do cardume e capturam o peixe.
Vara e isca-viva
Bonito-listrado

130
Frota (Fleet)
Espécie-alvo (Target-species)
Aparelho de pesca (Gear)
Sardinha-verdadeira
Traineira ou Cerco(Purse-seiners )
Pesca de polvo com potes(Octopus-pots)
Os potes, são dispostos no fundo marinho, e são presos a uma linha mestra. Em uma das extremidades é preso um arinque com poita e boia, para localização do aparelho.
O cerco consiste na utilização de uma grande rede utilizada para cercar cardumes de peixes. Após a visualização dos cardumes, um bote é baixado da embarcação levando uma das pontas da rede, fazendo o cerco do cardume.
Polvo-verdadeiro
Rede de cerco
Armadilha (potes)

131
131
Appendix 2. A posteriori multiple inter-fleet comparison test of monthly operational costs. Number of observed differences. Asterisks indicate statistical significance.
Bottom-gillnetters Dolphinfish-longliners
Octopus pots
Pair-bottom-trawlers
Pink-shrimp-trawlers Purse-seiners
Sea-bob-shrimp-trawlers
Tuna-longliners
IN SG IN SG SG IN SG AR IN SG SG IN bait-food 6.13 8.20bait-fuel 2.63 8.10bait-ice 19.43* 12.30
bait-landing 14.90bait-others 12.40
bait-vessel maintenance 9.31* 6.80food-fuel 32.45* 47.84* 3.5 27.93* 32.71* 32.16* 99.36* 29.36* 42.05* 27.89* 68.55* 16.30food-ice 6.86 2.53 13.31 11.6875 11.31 8.75 0.103 29.46* 3.91 2.93 4.82 4.10
food-landing 5.73 68.46* 19.4375 17.84 13.58 13.75 0.9 20.44 11.72 6.70food-others 16.91 40.03* 32.84* 17.79 45.94 53.45* 4.20
food-vessel maintenance 29.40* 29.73 3.18 25.68* 43.59* 24.71 69.07 32.10* 21.41 4.18 37.23* 15.00fuel-ice 25.59* 45.30* 16.81* 39.62* 21.4 23.42 99.47 0.1 45.97* 24.96* 73.38* 20.40*
fuel-landing 26.72* 116.30* 47.37* 50.56* 45.75* 85.62 28.46* 21.62 39.61* 23.00*fuel-others 49.36* 87.88* 65.56* 49.95* 145.30 122.00* 20.50*
fuel-vessel maintenance 3.05 18.11 6.68 2.25 10.87 7.46 30.29 2.73 20.65 23.71* 31.32 1.30ice-landing 1.14 71.00* 7.75 29.15* 22.33 13.85 28.56* 24.35* 14.65 2.60ice-others 23.77 42.57* 44.15* 26.54* 45.84 48.62* 0.10
ice-vessel maintenance 22.55 27.19 10.12 37.37* 32.28* 15.96 69.18 2.63 25.32* 1.25 42.05* 19.10landing-others 22.64 28.42 15.00 4.21 59.69 2.50
landing-vessel maintenance 23.68 98.19* 45.12* 61.43* 38.29* 55.32 31.20* 0.97 15.90 21.70*others-vessel maintenance 46.31* 69.76* 76.43* 42.50* 115.01 90.68* 19.20*
Kruskal-Wallis test, df= 5, p= < 0.05