alum treatment report - king county, washington€¦ · alum treatment report april 2006 ... online...
TRANSCRIPT
i
Lake Hicks Alum Treatment Report April 2006
Photo by Tom Smayda Department of Natural Resources and Parks Water and Land Resources Division Lake Stewardship Program King Street Center 201 South Jackson, Suite 600 Seattle, WA 98104 (206) 296-6519 TTY Relay: 711 www.metrokc.gov/dnr

ii
King County Executive Ron Sims Director of Department of Natural Resources and Parks Pam Bissonnette Division Manager of Water and Land Resources Division Mark Isaacson Water and Land Resources Division Staff Sally Abella Don Althauser Ben Budka Beth Cullen Gabriella Hannach Shannon Kelley Will Mansfield Michael Murphy Terry Siebens Despina Strong

iii
ACKNOWLEDGEMENTS King County staff members were instrumental in developing the Lake Hicks Integrated Phosphorus Management Plan (IPMP) and implementing the alum treatment at the lake. Key staff included Don Althauser, Will Mansfield, and Shannon Kelley of the Capital Projects, and Open Space Acquisition (CPOSA) group; Ben Budka, Gabriela Hannach, Terry Siebens and Despina Strong at the King County Environmental Lab; as well as Sally Abella, Beth Cullen, and Michael Murphy from the Lake Stewardship Program. Thanks to Tricia Shoblom of Washington Department of Ecology Bellevue Regional Office for her assistance with reviewing the IPMP and obtaining the NPDES permit. Finally, special thanks to the members of the White Center community for their efforts to improve Lake Hicks and Lakewood Park for the benefit of all who visit the park. The Friends of Hicks Lake, and in particular long-time resident Dick Thurnau, have been vocal proponents of restoration and improvement projects at Lake Hicks.

iv
CONTENTS TABLE OF CONTENTS................................................................................................... iv TABLE OF FIGURES....................................................................................................... iv INTRODUCTION .............................................................................................................. 1 BACKGROUND INFORMATION ................................................................................... 1
Watershed and Lake Characteristics............................................................................... 1 History of Problem.......................................................................................................... 2 Past Management Efforts................................................................................................ 2
2004 WQ Characterization ................................................................................................. 2 Bi-Weekly Monitoring.................................................................................................... 2 Toxicity Results .............................................................................................................. 3
PRE-TREATMENT TASKS.............................................................................................. 5 Budget Secured through KC Capital Projects Group ..................................................... 6 Phosphorus Reduction Options Examined; Alum Recommended ................................. 6 Permit Requires Phosphorus Management Plan ............................................................. 6 Buffer Chosen ................................................................................................................. 6 Jar Tests Determine Correct Amounts of Alum and Buffer ........................................... 7 Chemicals Purchased from Local Supplier..................................................................... 8 Consultant and Applicator Hired .................................................................................... 8
DAY OF TREATMENT..................................................................................................... 9 Chemicals delivered to site ............................................................................................. 9 Staff and assignments ................................................................................................... 10 Boats on the water......................................................................................................... 10 Filling the tanks on the boats ........................................................................................ 10 Monitoring during Treatment ....................................................................................... 13
POST-TREATMENT MONITORING RESULTS .......................................................... 14 NEXT STEPS ................................................................................................................... 15 Appendices........................................................................................................................ 16
FIGURES and TABLES Figure 1. Lake Hicks 2004 Toxicity Test Results............................................................... 4 Figure 2.Cyanobacteria Bloom in Lake Hicks, Summer 2004 ........................................... 4 Figure 3. Jar Test Results: pH............................................................................................. 8 Figure 4. Sodium aluminate totes ....................................................................................... 9 Figure 5. Loading Tanks on the Boats .............................................................................. 11 Figure 6. Alum treatment boats at Lake Hicks ................................................................ 12 Figure 7. Alkalinity and pH During Treatment ................................................................ 13 Figure 8. Total Phosphorus Values in 2004 and 2005...................................................... 14 Figure 9.Chlorophyll a Values in 2004 and 2005............................................................. 14 Figure 10. Secchi Values in 2004 and 2005 ..................................................................... 15 Table 1. 2004 Water Quality Data ...................................................................................... 3 Table 2. Ratios of Alum and Buffer Used in Jar Tests ....................................................... 7 Table 3. Staff Assignments on Day of Treatment............................................................. 10

1
INTRODUCTION On April 11, 2005, King County performed an alum treatment at Lake Hicks, a four-acre lake just south of Seattle in the White Center neighborhood of unincorporated King County. Water quality monitoring prior to the treatment determined that water and sediments of the lake were very high in phosphorus and that internal loading from hypolimnetic anoxia was a primary source of phosphorus loading. High concentrations of phosphorus in the lake were leading to frequent dense cyanobacteria blooms, which created unsightly conditions at the lake and posed a potential health threat to humans, pets, and wildlife. An alum treatment was determined to be the most appropriate and cost effective management technique to lower phosphorus concentrations in the lake and reduce the frequency and severity of the cyanobacteria blooms. Post-treatment monitoring results have shown the treatment to be successful. There are several other documents that discuss water quality and past projects at Lake Hicks. A recent management plan, the Lake Hicks Integrated Phosphorus Management Plan (IPMP) was completed just prior to implementation of the alum treatment. The IPMP outlines past and present conditions at the lake and recommends an alum treatment. The IPMP is cited throughout this report. Printed copies of the IPMP are available from the King County Department of Natural Resources and Parks (KCDNRP); the IPMP is online at http://dnr.metrokc.gov/wlr/waterres/smlakes/reports.htm.
BACKGROUND INFORMATION
Watershed and Lake Characteristics Lake Hicks’ watershed is located between the cities of Burien and Seattle in unincorporated King County. The 678-acre watershed is within the 1200-acre Salmon Creek sub-basin of the Duwamish/Green River WRIA 9 as defined by the Washington State Department of Ecology (Ecology). The majority of the watershed is developed. The IPMP discusses watershed features in further detail. The lake is entirely within King County’s 32-acre Lakewood Park. The lake is mainly fed by urban surface runoff, although groundwater also contributes water to the lake (Lake Hicks IPMP). The water and sediments in the lake are extremely rich in nutrients – phosphorus being of primary concern. During periods of normal precipitation, the lake ranges from four to five meters deep, with a surface area of about 4-acres. Generally water levels at Lake Hicks follow the same pattern as most other lakes in the Puget Sound lowlands of lower water levels in summer and higher levels in winter. Because the lake is relatively small compared to the size of the watershed, and the watershed has a high percentage of impermeable surface, the depth and surface area of the lake vary a great deal depending on rainfall patterns. The lake has no natural outlet, but there is a pump system that operates when the water

2
level reaches a certain elevation. Capacity of the outlet pump is limited by a choke point downstream, so heavy sustained rains can and do flood the lake.
History of Problem In recent years, cyanobacteria blooms have become more frequent and dense. In 2004 samples were collected from three different blooms, and in each case tested positive for toxins. Without relatively expensive toxicity tests, there is no way of knowing whether a particular bloom is toxic. Given the frequency and severity of cyanobacteria blooms in the lake, and the risks posed to humans, pets, and wildlife by blooms that produce toxins, King County staff decided to take actions that would result in decreased phosphorus concentrations in the lake and thus control nuisance blooms.
Past Management Efforts Water quality problems have existed at Lake Hicks for many years. The IPMP outlines the water quality studies and improvement projects completed in the last 30 years by King County DNRP and its predecessor agencies. This is the first time alum has been used at Lake Hicks for phosphorus control.
2004 WQ Characterization
Bi-Weekly Monitoring Water quality was monitored prior to the alum treatment to establish baseline conditions and verify that high phosphorus concentrations existed. Baseline samples were collected monthly from May through October. Parameters measured during baseline monitoring included total phosphorus (TP), total nitrogen, total suspended solids (TSS), chlorophyll a, pH, dissolved oxygen (DO), conductivity, and temperature, not all of which is included in this report. Other data can be obtained upon request. After storms in which an inch or more of rain fell at nearby SeaTac airport in a 24-hour period, storm samples were collected. Additional parameters measured for storm samples included orthophosphate and fecal coliform concentrations. Analysis of near-bottom water during the summer months showed very low concentrations of dissolved oxygen and phosphorus concentrations that were much higher than samples collected at a depth of one-meter. Anoxic conditions at the water-sediment interface allow a chemical reaction to take place, pulling phosphorus from the sediment into the water which becomes available to algae in the euphotic zone when the lake mixes. Monitoring results show that TP concentrations remained high in the lake throughout the sampling period. Further, chlorophyll a concentrations also were high during the summer months, representing large algae populations which likely led to the poor water clarity (Table 1).

3
Table 1. 2004 Water Quality Data at 1 m depth
Date Secchi (m) Chlorophyll-a Total P (mg/L)
Total N (mg/L)
Fecal Coliform
(cfu/100ml) 5/19/2004 2.2 11.2 0.0288 0.6390 8 6/2/2004 1.8 13.5 0.0453 0.7390 34 6/17/2004 1.6 18.6 0.0297 0.5740 100 6/30/2004 1.2 7.37 0.0400 1.4500 60 7/13/2004 0.9 36.8 0.0410 1.2500 120 7/27/2004 0.4 195 0.0910 2.7100 6 8/10/2004 0.15 126 0.1020 1.7100 230 8/24/2004 0.4 30.4 0.1230 1.9100 690 9/7/2004 0.8 76.7 0.1080 1.8400 83 9/21/2004 0.6 54.2 0.0995 1.4100 130 10/5/2004 0.6 51.6 0.1160 1.5000 74 10/20/2004 0.6 62.9 0.0998 1.4300 460
These data are shown graphically and compared with post-treatment monitoring results on pages 12-13 of this report. Appendix A contains monitoring results for other parameters, storm events, and results of the phytoplankton monitoring, which showed that potentially toxic cyanobacteria species were the predominant phytoplankton species through much of the summer.
Toxic Cyanobacteria Blooms During summer 2004, King County staff and community residents noticed dense cyanobacteria blooms through much of the summer (B. Cullen, pers. comm.). Seven water samples tested positive for the presence of microcystin, a hepatotoxin found in certain species of cyanobacteria. Although toxin levels did not exceed safety standards of 1μg/L set by the World Health Organization, toxins were detected in each of the samples as shown in Figure 4. Different methods were used to evaluate toxin amounts over the period, and actual amounts of some samples may have been under-reported (IPMP).

4
Microcystin, Lake Hicks 2004
0
0.2
0.4
0.6
0.8
1
1-Ju
l
15-J
ul
29-J
ul
12-A
ug
26-A
ug
9-Se
p
23-S
ep
7-O
ct
ppb
in fi
ltere
d w
ater
World Health organization threshold
Figure 1. Lake Hicks 2004 Toxicity Test Results The dense cyanobacteria blooms posed potential risk to people and animals coming into contact with the water. The blooms also detracted from the aesthetic value of the lake and park.
Figure 2.Cyanobacteria Bloom in Lake Hicks, Summer 2004

5
PUBLIC INVOLVEMENT AND PERMITS
Public Meetings Prior to the alum treatment, King county hosted two public meetings to discuss with the community the water quality problems occurring at the lake and the potential solutions to the problem. Comments and suggestions from community members at the January 12th meeting were incorporated into the IPMP. Nine community members attended the meting on January 12. The meeting on March 24 was attended by 13 community members. Announcements of the meetings were sent to all members of the Friends of Lake Hicks, and to all businesses and homes within ¼ mile of the watershed; ArcView GIS software was used to determine the parcels and mailing addresses within ¼ mile of the lake. Copies of the meeting announcements and agendas for each meeting are included in Appendix B.
SEPA Checklist and Determination of Non-significance As required by the NPDES permit, a State environmental Policy Act (SEPA) checklist was completed for the proposed project. After reviewing the Checklist, King County, the lead agency, determined that the alum treatment would not have a significant adverse impact on Lake Hicks, earning the project a Determination of Non-significance (DNS). Notice of the DNS was distributed to all residents within ¼ mile of the lake as well as required agencies and organizations. A copy of the SEPA checklist and the DNS are included in Appendix C of this report.
Public Notice and Press releases In addition to public meeting announcement notices sent to residents in the Lake Hicks area, there were also three announcements published in the in the local newspaper, The White Center News. The announcements were a requirement of the NPDES permit, and were published according to the schedule required by the permit; the notices were published on March 2, 2005. March 9, 2005, and March 16, 2005. Copies of the announcements are included in Appendix C. Approximately one-week prior to the planned alum treatment, a press release was sent to local and regional media. The press release outlined the plan for the alum treatment and highlighted the predicted benefits of the alum treatment to the water quality in Lake Hicks.

6
PRE-TREATMENT TASKS
Budget Secured through KC Capital Projects Group King County’s Capital Projects and Open Space Acquisitions (CPOSA) group in the Water and Land Resources Division agreed to provide funding for the project. This funding enabled staff from the Lake Stewardship Program to manage the pre-treatment monitoring, the alum treatment, and post-treatment monitoring.
Phosphorus Reduction Options Examined; Alum Recommended King County Lake Stewardship Program staff considered available management techniques that would lower phosphorus concentrations in the lake (IPMP). Options included alum treatment, dilution, stormwater retention and treatment, sediment oxidation techniques, aeration, dredging, and instituting a watershed education campaign. Lake Stewardship Program staff determined that an alum treatment would be most likely to succeed in achieving immediate relief from phosphorus-related cyanobacteria blooms at Lake Hicks. Stormwater controls and an education of watershed residents were also recommended in the IPMP for longer-term results.
Permit Requires Phosphorus Management Plan In 2005, alum treatments in Washington required coverage under the National Pollution Discharge Elimination System (NPDES) permit, a permit required by the Clean Water Act (1972) and administered by the state of Washington. Typically, before granting NPDES permit coverage for using herbicides to control nuisance aquatic weeds the Washington Department of Ecology required an Integrated Aquatic Vegetation Management Plan (IAVMP). For lack of a separate classification, alum treatments were grouped with nuisance weed control projects, and therefore, required an Integrated Phosphorus Management Plan (IPMP). The Lake Hicks IPMP, completed in March 2005, compiles watershed and lake history, outlines the sources of phosphorus, examines the phosphorus control options, and recommends using aluminum sulfate (alum) and sodium aluminate (buffer) to control internal phosphorus loading at Lake Hicks. The IPMP also discusses other treatment strategies to be incorporated; the Friends of Hicks Lake intends to initiate a watershed education campaign, and the King County CPOSA group has other projects underway upstream of Lake Hicks that are intended to improve water quality of the surface waters flowing to Lake Hicks. The IPMP is available online at: http://dnr.metrokc.gov/wlr/-waterres/smlakes/reports.htm.
Buffer Chosen In lakes with relatively low alkalinity, such as Lake Hicks, using a “buffering agent” during the alum treatment is required to prevent the pH in the lake from decreasing to a point that would threaten aquatic life. Of the several different substances that could have been used to buffer the alum treatment, sodium aluminate was determined to be the most cost-effective because it also contributes a high weight of aluminum by volume. Other

7
buffering solutions considered included slaked lime and calcium carbonate, neither of which adds any aluminum to the lake during the alum treatment.
Jar Tests Determine Correct Amounts of Alum and Buffer To estimate the correct ratio of aluminum sulfate (alum) to sodium aluminate (buffer), staff at the King County Environmental Lab performed several “jar tests.” The goal was to identify the amount of alum and buffer equaling a dose of 25mg aluminum per liter of lake water, while maintaining pH in the lake just above 6.5, a condition of the NPDES permit. The sodium aluminate has a higher content of aluminum per unit weight than the alum, so it contributed more aluminum to the lake. This was a primary consideration in using this buffer rather than other available buffering substances such as calcium carbonate. Lab personnel performed quick tests prior to the full 24-hour treatment tests to determine the approximate ratios of alum to buffer to use in the 24-hour jar test. Three ratios were applied, with two sample sets for each ratio of alum to buffer (Table 2). Table 2. Ratios of Alum and Buffer Used in Jar Tests
Replicate number
mg Al from alum mg Al from buffer
1 12.02 12.98 2 12.02 12.98 3 11.74 13.26 4 11.74 13.26 5 12.32 12.68 6 12.32 12.68
For each set of replicates, lab personnel, measured the initial pH initially, after the alum was applied, after the buffer was applied, and at one hour after treatment, four hours after treatment, and just before and after 24-hours post-treatment (Figure 3). Replicate tests 3 and 4 yielded the pH endpoint closest to 6.5, so that ratio was chosen as the most appropriate from the ratios tested. However, the alum and sodium aluminate products used in the jar tests were supplied by different vendors than the products used in the treatment, so some changes in proportions were made to ensure that volumes of alum to buffer were in the correct ratio to each other, and that the chemicals were in the correct ratio to the lake water. After estimating the lake volume and analyzing data from the jar tests, staff determined the optimal ratio of alum to buffer from Cascade Columbia Distributors to be 2418 gal aluminum sulfate (48% solution) to 985 gal sodium aluminate (43% solution).

8
Jar Test Results: pH
4.50
5.50
6.50
7.50
0 0 0 1 4 23.83 24.2Hours after jar test treatment
Rep1
Rep2
Rep3
Rep4
Rep5
Rep6
After alum After buffer 23h50min 24h10min1-hourInitial pH 4-hours
Figure 3. Jar Test Results: pH In addition, the water used in the jar test was analyzed for orthophosphate, total phosphorous, and alkalinity. These results were not integral to determining the dose of alum and buffer necessary for the treatment, but showed that the treatment would be effective in removing phosphorus. The results from the pH tests and analysis of other parameters are shown in Appendix D.
Chemicals Purchased from Local Supplier Suppliers were sought who could provide both of the chemicals. After reviewing three bids, the company chosen to provide the chemicals was Cascade Columbia Distributors, a chemical distributor located in south Seattle.
Consultant and Applicator Hired None of the King County staff working on the project had previous experience with alum treatments, so a consultant with relevant experience was hired to advise King County staff during the project. King County hired Tom Smayda of Smayda Environmental Consultants. The applicator hired was AquaTechnex, the lowest bidder among several aquatic herbicide applicators with the necessary equipment for the job.

9
DAY OF TREATMENT
Chemicals delivered to site The alum was contained in a tanker truck that remained on site throughout the day. The tanker truck was equipped with an air-pressure system that could force the alum out of the truck and through the hoses. The sodium aluminate was delivered to the site in four 250-gallon plastic tanks, or “totes” (Figure 4). Each tote had an air vent at the top and a “cam-lock” fitting at the bottom where the drain hose could be attached. The totes were not rated for increased pressure, so filling the tanks relied upon the totes being at a higher elevation than the tanks on the boats so gravity and the weight of the sodium aluminate would allow the fluid to flow through the hoses.
Figure 4. Sodium aluminate totes

10
Staff and assignments There were several King County staff members on site during the alum treatment, each with one or more tasks (Table 3). Table 3. Staff Assignments on Day of Treatment Staff Affiliation Tasks Sally Abella KC DNRP Water sampling, photos Beth Cullen KC DNRP Water sampling Michael Murphy KC DNRP Project Manager Ben Budka KC DNRP Water sampling, photos Terry Siebens KC DNRP Alkalinity titrations Tom Smayda Smayda Environmental Consultants Water sampling, photos Chris Clinton AquaTechnex Treatment boat/tank operator Terry McNabb AquaTechnex Treatment boat/tank operator Kyle Langan AquaTechnex Treatment boat/tank operator CCD Truck driver CCD Chemical tanks and hoses Tricia Shoblom from the Washington State Department of Ecology was at the site for part of the day to ensure that the application was going according to the NPDES permit conditions. A spill and accident response plan was developed and on site during the treatment. This plan is included as Appendix E.
Boats on the water AquaTechnex staff arrived at the lake in the morning and launched two boats into the lake, using the beach on the east side of the lake as a ramp.
Filling the tanks on the boats To maintain stable pH, the two chemicals must be added to the water simultaneously. Because alum and sodium aluminate are both very heavy liquids, putting two tanks on a single boat would have required using small tanks and refilling them very often. Instead, tanks for each chemical were placed on separate boats – a 150 gallon tank on a larger boat for the alum, and a 75 gallon tank on a smaller boat for the sodium aluminate. Two-inch (inside diameter) hoses were attached to the outlet ports of the tanker truck and the totes using cam-lock fittings. The hoses ran from the tanker truck and the totes down hill to the boats on the lake, a drop of approximately 10 feet (Figure 5.)

11
Figure 5. Loading Tanks on the Boats The alum flowed relatively easily through the hoses, and the tank on the boats could be filled in several minutes. Additionally, the tanker truck could pressurize the tank, allowing the alum to be forced through the hose to the tank on the boat. The pressurized tank of the truck was useful in accelerating the fill rate as fluid pressure decreased as volume in the truck decreased through the day. The sodium aluminate product was a viscous fluid, with a consistency at room temperature similar to corn syrup. The cool weather on the day of the treatment (air temperature ~10°C) increased the viscosity of the liquid, making it very slow to flow through the hose from the totes to the tanks on the boats. The first tank took about 30 minutes to fill. To reduce the friction between the fluid and the inside of the hose, the hose leading from the sodium aluminate totes to the tank on the boat was shortened as much as possible. With the shorter hose, the tank for the second run filled in approximately 15 minutes. However, it was clear that in order to finish the treatment in a single day as hoped, the sodium aluminate tank would need to be filled more quickly. To further increase the flow of the sodium aluminate through the hose, a diaphragm pump was connected in-line between the sodium aluminate totes and the hoses leading to the tanks on the boats. The pump increased the rate of flow, but the process proved to be very hard on the pump. Two older pumps failed to in quick succession, due to insufficient horsepower to pump the viscous fluid. Two additional, more powerful pumps were rented from a local rental shop. One of these pumps blew a gasket after filling several tanks. The second rented pump made it through the remainder of the day. The tanks enabled the sodium aluminate tank to be filled in less than 10 minutes. This problem could have been prevented by using a four-inch inside-diameter hose from the pumps to the tank, and by having the sodium aluminate stored in a heated room prior to the treatment so the liquid would have been less viscous.

12
Application process The alum tank held 150 gallons and the buffer tank held with 62 gallons, which was very close to the proper ratio determined by the jar tests; during treatment, the pumping rates were adjusted so the two tanks were emptied at approximately the same time. At 9am the alum and buffer tanks filled and treatment began. The boat delivering alum led the way, and the second boat applying the buffer followed closely behind. The boats crossed the lake from north to south and back, progressing from the west end of the lake toward the beach at the eastern shore of the lake. Each run across the lake slightly overlapped the area covered in the previous cross, ensuring that the entire bottom of the lake was blanketed with alum. The two boats were within 20 feet of one another at all times, and traveled at slow speeds during the treatment.
Figure 6. Alum treatment boats at Lake Hicks When filling the tanks for the fourteenth trip onto the lake, the alum in the tanker truck ran dry. The truck driver opened the top hatch of the tank and discovered that less alum had been delivered than the requested amount, leaving approximately 150 gallons of sodium aluminate that could not be used; adding buffer only to the lake could have caused undesirable dramatic increases in pH. Treatment finished just before 4pm.

13
Because of the short supply of alum, the supplier only charged for the alum and sodium aluminate that was used in treatment. However, the treatment did not deliver the target concentration of 25mg aluminum per liter of lake water. Total amounts of alum and buffer added to the lake were: ~ 2040 gallons of 48% aluminum sulfate (alum) ~ 850 gallons of 43% sodium aluminate (buffer) Because the alum ran out when the tank was partially filled on the 14th treatment trip, the exact volume of the alum and sodium aluminate added to the lake is not known. However, based on the amount of sodium aluminate left in the fourth tote (~150gal), and knowing that alum and buffer were added in a ratio of 2.4:1, it is possible to estimate the treatment volume of alum and buffer. Estimated treatment volume was 2040 gallons of 48% aluminum sulfate to 850 gallons of 43% sodium aluminate. Based on the estimated volume of chemicals applied and the estimated volume of the lake on the day of treatment, the estimated treatment concentration was approximately 22 mg aluminum per liter of water in the lake.
Monitoring during Treatment During treatment King County staff were taking physical measurements and collecting samples from the lake. Physical measurements included pH and Secchi; water samples were analyzed for alkalinity. Ongoing measurements were taken to ensure that conditions in the lake were remaining relatively constant so as not to cause harm to plants and animals living in the lake. Maintaining pH above 6.5 was a requirement of the NPDES permit. No specific values were given, but the permit required monitoring alkalinity during the treatment. Data collected during the alum treatment show that conditions remained stable during most of the treatment. At about 10 A.M. pH values fell below 6.5, but were quickly brought up by adding additional buffer to the area (Figure 7).
0
5
10
15
20
25
30
35
8:00 9:00 10:00 11:00 12:00 13:00 14:00 15:00 16:00
Alk
alin
ity
4
5
6
7
8
pH
Alkalinity pH
Figure 7. Alkalinity and pH During Treatment

14
POST-TREATMENT MONITORING RESULTS Post-treatment monitoring began just after the treatment, and continued through the December 2005. 2005 data are included in Appendix A. King County plans to measure phosphorus concentrations and other parameters several times during 2006 and 2007 to determine if the alum treatment continues to prevent phosphorus release from the sediments. The following charts shows the baseline data collected during 2004 compared with data collected in 2005 after the alum treatment (Figures 8-9-10).
Total Phosphorus 1m
0.00
0.05
0.10
0.15
0.20
0 61 122 183 244 305
dept
h (m
)
2004 2005
J-F M-A M-J J-A S-O N-D
Figure 8. Total Phosphorus Values in 2004 and 2005
Chlorophyll-a 1m
0
50
100
150
0 61 122 183 244 305
ug/L
2004 2005
195
J-F M-A M-J J-A S-O N-D
Figure 9.Chlorophyll a Values in 2004 and 2005

15
Secchi Transparency0
1
2
3
4
5
0 61 122 183 244 305de
pth
(m)
2004 2005
J-F M-A M-J J-A S-O N-D
Figure 10. Secchi Values in 2004 and 2005 The data from 2005 illustrate clearly that the alum treatment was successful in sequestering phosphorus in the sediment of the lake. Phosphorus levels were lower in 2005 (Figure 8), and likely led to decreased algae growth evidenced by lower chlorophyll a values in 2005 (Figure 9). Decreased algae growth likely resulted in the deeper Secchi transparencies (Figure 10).
NEXT STEPS In October 2005, the Capital Projects, Open Space and Acquisitions (CPOSA) group in King County’s Water and Land Resources Division completed construction of a bio-swale just upstream of Lake Hicks, which reconfigured the outlet of the detention pond to the east of the parking lot on the west side of Lakewood Park. The bio-swale is designed to retain a large volume of water in addition to the pond, slow the flow of the inlet to the lake, and allow some of the sediment to settle out, while roots of the plants along the banks of the bio-swale take up some of the nutrients that would otherwise flow directly to the lake. Staff from the King County Lake Stewardship program will continue to work with members of the White Center community in efforts to educate residents in the Lake Hicks watershed about phosphorus reduction measures, Best Management Practices, and other ways they can help maintain the health and beauty of Lake Hicks.

16
Appendices Appendix A Water Quality Data Appendix B Public Meeting Documentation Appendix C SEPA Documents Appendix D Jar Test Results Appendix E Emergency Response Plan

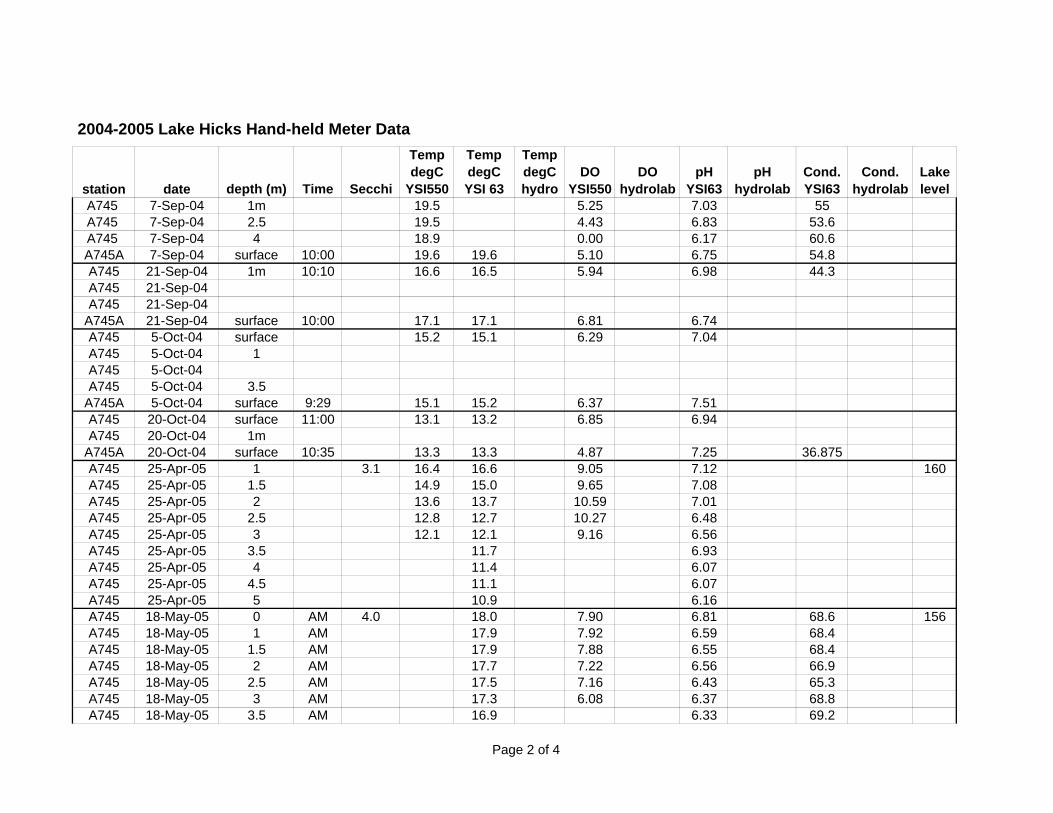
2004-2005 Lake Hicks Hand-held Meter Data
station date depth (m) Time Secchi
Temp degC
YSI550
Temp degC YSI 63
Temp degC hydro
DO YSI550
DO hydrolab
pH YSI63
pH hydrolab
Cond. YSI63
Cond. hydrolab
Lake level
A745 19-May-04 1 10:30 19.1 19.1 8.10 6.99 49.7A745 19-May-04 2.5 10:45 17.1 16.6 2.60 6.26 51.5A745 19-May-04 4.5 10:50 11.9 6.19 56.3
A745A 19-May-04 surface 11:20 19.7 19.7 8.35 6.76 50.2A745 2-Jun-04 1 11:38 19.0 19.0 10.23 7.9 48
A745A 2-Jun-04 surface 11:00 20.1 20.2 10.17 7.52 50.3A745 17-Jun-04 1 11:40 21.3 21.5 9.26 8.24 47.5A745 17-Jun-04 3.3 16.3 1.50A745 17-Jun-04 4.8 13.8 0.74 5.93
A745A 17-Jun-04A745 30-Jun-04 1 11:33 23.6 23.7 7.35 7.9 55.3A745 30-Jun-04 3.5 11:40 19.6 20.0 0.15 6.67 53.2A745 30-Jun-04 4.5 11:44 13.1 0.13 6.29 129.9
A745A 30-Jun-04 surface 11:05 24.1 24.2 7.85 8.21 56.4A745 13-Jul-04 1 9:30 22.0 9.42 8.93 53.6A745 13-Jul-04 3.5 9:40 17.1 0.04 6.16 65.7A745 13-Jul-04 4.9 9:45 13.9 6.14 119.7
A745A 13-Jul-04 surface 9:20 22.2 22.2 9.78 8.82 54.2A745 27-Jul-04 1 12:28 23.6 8.57 8.6 53.4A745 27-Jul-04 2 21.1 0.05 6.99 61.1A745 27-Jul-04 2.5 18.1 0.04 6.48 136
A745A 27-Jul-04 surface 12:28 27.6 13.06 10.03 86.3A745 10-Aug-04 1 9:45 21.4 21.4 5.58 7.29 0A745 10-Aug-04 2.5 9:55 19.5 19.4 0.06 6.42 0A745 10-Aug-04 3 10:05 17.7 0.00 6.42 0
A745A 10-Aug-04 surface 9:10 23.0 23.2 11.50 9.77 62.9A745 24-Aug-04 surface 20.7 1.38 6.35A745 24-Aug-04 1m 20.4 2.66 6.06A745 24-Aug-04 2.5m 20.2 2.21 5.96A745 24-Aug-04 3.5m 18.2 0.19 6.24
A745A 24-Aug-04 surface ~9:45A745 7-Sep-04 surface
Page 1 of 4
2004-2005 Lake Hicks Hand-held Meter Data
station date depth (m) Time Secchi
Temp degC
YSI550
Temp degC YSI 63
Temp degC hydro
DO YSI550
DO hydrolab
pH YSI63
pH hydrolab
Cond. YSI63
Cond. hydrolab
Lake level
A745 7-Sep-04 1m 19.5 5.25 7.03 55A745 7-Sep-04 2.5 19.5 4.43 6.83 53.6A745 7-Sep-04 4 18.9 0.00 6.17 60.6A745A 7-Sep-04 surface 10:00 19.6 19.6 5.10 6.75 54.8A745 21-Sep-04 1m 10:10 16.6 16.5 5.94 6.98 44.3A745 21-Sep-04A745 21-Sep-04
A745A 21-Sep-04 surface 10:00 17.1 17.1 6.81 6.74A745 5-Oct-04 surface 15.2 15.1 6.29 7.04A745 5-Oct-04 1A745 5-Oct-04A745 5-Oct-04 3.5
A745A 5-Oct-04 surface 9:29 15.1 15.2 6.37 7.51A745 20-Oct-04 surface 11:00 13.1 13.2 6.85 6.94A745 20-Oct-04 1m
A745A 20-Oct-04 surface 10:35 13.3 13.3 4.87 7.25 36.875A745 25-Apr-05 1 3.1 16.4 16.6 9.05 7.12 160A745 25-Apr-05 1.5 14.9 15.0 9.65 7.08A745 25-Apr-05 2 13.6 13.7 10.59 7.01A745 25-Apr-05 2.5 12.8 12.7 10.27 6.48A745 25-Apr-05 3 12.1 12.1 9.16 6.56A745 25-Apr-05 3.5 11.7 6.93A745 25-Apr-05 4 11.4 6.07A745 25-Apr-05 4.5 11.1 6.07A745 25-Apr-05 5 10.9 6.16A745 18-May-05 0 AM 4.0 18.0 7.90 6.81 68.6 156A745 18-May-05 1 AM 17.9 7.92 6.59 68.4A745 18-May-05 1.5 AM 17.9 7.88 6.55 68.4A745 18-May-05 2 AM 17.7 7.22 6.56 66.9A745 18-May-05 2.5 AM 17.5 7.16 6.43 65.3A745 18-May-05 3 AM 17.3 6.08 6.37 68.8A745 18-May-05 3.5 AM 16.9 6.33 69.2
Page 2 of 4

2004-2005 Lake Hicks Hand-held Meter Data
station date depth (m) Time Secchi
Temp degC
YSI550
Temp degC YSI 63
Temp degC hydro
DO YSI550
DO hydrolab
pH YSI63
pH hydrolab
Cond. YSI63
Cond. hydrolab
Lake level
A745 18-May-05 4 AM 16.6 6.35 70.4A745 18-May-05 4.5 AM 15.8 6.66 70.5A745 18-May-05 5 AM 15.0 6.66 76.4A745 18-May-05 5.5 AM 14.9 2.35A745 8-Jun-05 0.1 AM 3.6 18.85 6.71 7.29 70.2 115A745 8-Jun-05 0.5 AM 18.83 7.11 7.3 70.1A745 8-Jun-05 1 AM 18.81 6.88 7.33 70.1A745 8-Jun-05 1.5 AM 18.8 6.87 7.33 70.4A745 8-Jun-05 2 AM 18.74 6.57 7.29 69.9A745 8-Jun-05 2.5 AM 18.62 5.33 7.16 70.9A745 8-Jun-05 3 AM 18.26 2.97 6.98 72.2A745 8-Jun-05 3.5 AM 17.21 0.7 6.85 75.4A745 8-Jun-05 4 AM 16.31 0.23 6.75 75.8A745 8-Jun-05 4.5 AM 15.38 0.16 6.88 96.7A745 6-Jul-05 0.5 AM 2.3 22.5 22.35 7.88 7.47 7.58 66.5 67.5 129A745 6-Jul-05 1 AM 22.4 22.24 7.98 7.39 7.54 66.2 67.4A745 6-Jul-05 1.5 AM 22.2 22.13 7.84 7.36 7.51 62.0 67.1A745 6-Jul-05 2 AM 21.9 21.73 7.98 7.33 7.55 62.4 67.8A745 6-Jul-05 2.5 AM 21.5 21.14 6.95 7.29 7.39 62.4 68.2A745 6-Jul-05 3 AM 20.8 20.43 2.65 6.72 6.96 62.7 70.5A745 6-Jul-05 3.5 AM 20 19.37 0.58 6.51 6.79 63.7 72.9A745 6-Jul-05 4 AM 19.1 17.83 0.21 6.44 6.67 63.3 78.6A745 6-Jul-05 4.5 AM 17.3 16.68 0.19 6.39 6.66 71.5 91.9A745 17-Aug-05 0.5 1.7 22.5 22.5 22.45 7.47 7.62 7.66 7.65 80.6 48.1 90A745 17-Aug-05 1 22.5 22.6 22.45 7.47 7.56 7.62 7.63 80.3 48.2A745 17-Aug-05 1.5 22.5 22.6 22.45 7.39 7.81 7.6 7.57 80.5 48.1A745 17-Aug-05 2 22.5 22.6 22.45 7.4 7.61 7.59 7.61 80.6 48A745 17-Aug-05 2.5 22.5 22.6 22.42 7.45 7.32 7.58 7.56 80.5 48.2A745 17-Aug-05 3 22.5 22.5 22.26 6.96 5.96 7.42 7.31 81 48.6A745 17-Aug-05 3.5 22.3 21.75 1.57 7.08 6.61 81.2 45.6A745 17-Aug-05 4 20.5 19.63 1.50 6.43 6.47 77 66.7A745 17-Aug-05 4.5 18.5 17.4 1.29 6.48 6.3 136.5 115
Page 3 of 4

2004-2005 Lake Hicks Hand-held Meter Data
station date depth (m) Time Secchi
Temp degC
YSI550
Temp degC YSI 63
Temp degC hydro
DO YSI550
DO hydrolab
pH YSI63
pH hydrolab
Cond. YSI63
Cond. hydrolab
Lake level
A745 14-Sep-05 0.2 10:00 1.8 18.74 6.19 7.1 71.4 77A745 14-Sep-05 1 10:00 18.75 6.35 7.21 71A745 14-Sep-05 1.5 10:00 18.74 6.26 7.11 70.8A745 14-Sep-05 2 10:00 18.72 6.33 7.06 71A745 14-Sep-05 2.5 10:00 18.7 5.93 7.01 71A745 14-Sep-05 3 10:00 18.68 6.05 6.98 71.1A745 14-Sep-05 3.5 10:00 18.62 5.47 7.01 71.2A745 14-Sep-05 4 10:00 18.57 4.96 7.01 71.4A745 14-Sep-05 4.5 10:00 18.44 3.78 6.91 73.4A745 19-Oct-05 0.2 0.9 14.29 9.86 7.35 70.2 86A745 19-Oct-05 1 14.28 9.75 7.45 70.5A745 19-Oct-05 1.5 14.28 9.5 7.43 70.5A745 19-Oct-05 2 14.2 9 7.33 70.8A745 19-Oct-05 2.5 14.14 8.6 7.28 70.9A745 19-Oct-05 3 14.12 8.45 7.24 70.8A745 19-Oct-05 3.5 14.1 8.45 7.22 70.9A745 19-Oct-05 4 14.09 8.25 7.18 71.1A745 19-Oct-05 4.5 14.08 8.25 7.13 71A745 19-Oct-05 5 14.07 7.13 6.97 72.1
Page 4 of 4

2004-2005 Lake Hicks Nutrient and Fecal Coliform Data
Date Secchi (m) Chlor-a (μg/L) Total P (μg/L) Total N (μg/L) FC (CFU/100mL)19-May-04 2.2 11.2 0.0288 0.6390 82-Jun-04 1.8 13.5 0.0453 0.7390 3417-Jun-04 1.6 18.6 0.0297 0.5740 10030-Jun-04 1.2 7.37 0.0400 1.4500 6013-Jul-04 0.9 36.8 0.0410 1.2500 12027-Jul-04 0.4 195 0.0910 2.7100 610-Aug-04 0.15 126 0.1020 1.7100 23024-Aug-04 0.4 30.4 0.1230 1.9100 6907-Sep-04 0.8 76.7 0.1080 1.8400 8321-Sep-04 0.6 54.2 0.0995 1.4100 1305-Oct-04 0.6 51.6 0.1160 1.5000 7420-Oct-04 0.6 62.9 0.0998 1.4300 46011-Apr-05 0.0723 43012-Apr-05 0.0124 2225-Apr-05 3.1 5.61 0.0178 0.379 3318-May-05 4.0 3.45 0.0226 0.523 348-Jun-05 3.7 0.05 0.0212 0.554 266-Jul-05 2.3 4.44 0.0260 0.724 40
17-Aug-05 1.7 8.23 0.0289 0.625 3514-Sep-05 1.8 9.20 0.0427 0.859 519-Oct-05 0.9 0.0341 92

APPENDIX B: PUBLIC MEETING DOCUMENTATION This appendix contains documents related to two public meetings held prior to the alum treatment. January 12, 2005
• Meeting Flyer • Meeting Agenda • Sign-in sheet
March 24, 2005
• Meeting Flyer • Meeting Agenda • Sign-in sheet

Lake Hicks Alum Treatment Public MeetingWednesday January 12, 20056:30 – 8 p.m.Cascade Middle School, in the choir room (directions and map on back)11212 10th Ave SW, Seattle 98146
Please join us to discuss plans for improvements to Lake Hicks (Garrett). The Washington State Department of Ecology considers Lake Hicks to be impaired by excessively high phosphorus levels that contribute to frequent algae blooms. King County is applying for a permit to treat the lake next spring with aluminum sulfate (alum), which will lower phosphorus concentrations in the water and "cap" the phosphorus rich sediments. County staff and community leaders will be present to answer questions about the alum treatment and other planned improvements at Lake Hicks and Lakewood Park.
DIRECTIONS to Cascade Middle School:From SW 116th Street, head north on 10th Ave SW.
Cascade Middle School will be on your right, just south of Lakewood Park.
Park in the lot and follow the signs to the choir room (toward the back of the school).
0412LakeHicksAlumFlyer.p65 mdev
Department of Natural Resources and Parks
Water and Land Resources Division

Lake Hicks Alum Treatment 2nd Public MeetingThursday, March 24, 20056:30 – 8 p.m.Cascade Middle School, in the choir room (directions and map on back)11212 10th Ave SW, Seattle 98146
Please join us to discuss plans for improvements to Lake Hicks (Garrett). The Washington State Department of Ecology considers Lake Hicks to be impaired by excessively high phosphorus levels that contribute to frequent algae blooms. King County is applying for a permit to treat the lake next spring with aluminum sulfate (alum), which will lower phosphorus concentrations in the water and "cap" the phosphorus rich sediments. County staff and community leaders will be present to answer questions about the alum treatment and other planned improvements at Lake Hicks and Lakewood Park.
Department of Natural Resources and Parks
Water and Land Resources Division
Department of Natural Resources and Parks
Water and Land Resources Division
Department of Natural Resources and Parks
Water and Land Resources Division

DIRECTIONS to Cascade Middle School:From SW 116th Street, head north on 10th Ave SW.
Cascade Middle School will be on your right, just south of Lakewood Park.
Park in the lot and follow the signs to the choir room (toward the back of the school).
DIRECTIONS to Cascade Middle School:From SW 116th Street, head north on 10th Ave SW.
Cascade Middle School will be on your right, just south of Lakewood Park.
Park in the lot and follow the signs to the choir room (toward the back of the school).
DIRECTIONS to Cascade Middle School:From SW 116th Street, head north on 10th Ave SW.
Cascade Middle School will be on your right, just south of Lakewood Park.
Park in the lot and follow the signs to the choir room (toward the back of the school).
0412LakeHicksAlumFlyer.p65 mdev
0412LakeHicksAlumFlyer.p65 mdev
0412LakeHicksAlumFlyer.p65 mdev

APPENDIX D: Jar Test Results
3/8/05 Lake Hicks tests with Univar buffer
BeakerTotal Al
dosebuffer Al/
alum AlAl from alumAl from
buffer alum bufferbuffer/
alum alum bufferbuffer/
alum alum 10% buffer 10%
# (mg/L) w/w (k) (mg/L) (mg/L) (mg/L) (mg/L) w/w (ml/L) (ml/L) v/v (ml/L) (ml/L) initialafteralum
afterbuffer initial final
1 25 1.08 12.02 12.98 276.94 134.10 0.48 0.209 0.117 0.561 2.086 1.170 7.209 4.9 6.053 11:50 10.7 10.7
2 25 1.08 12.02 12.98 276.94 134.10 0.48 0.209 0.117 0.561 2.086 1.170 7.050 4.9 6.179 12:02 10.5 10.6
3 25 1.13 11.74 13.26 270.44 137.01 0.51 0.204 0.120 0.587 2.037 1.196 7.050 4.9 6.353 12:17 10.4 10.5
4 25 1.13 11.74 13.26 270.44 137.01 0.51 0.204 0.120 0.587 2.037 1.196 7.009 4.9 6.351 12:29 10.6 10.6
5 25 1.03 12.32 12.68 283.76 131.04 0.46 0.214 0.114 0.535 2.137 1.144 7.056 4.9 5.953 12:47 10.5 10.5
6 25 1.03 12.32 12.68 283.76 131.04 0.46 0.214 0.114 0.535 2.137 1.144 6.352 4.9 6.042 13:03 10.7 10.8
Beaker
#alum
(mg/L)Buffer (mg/L) Time
time1 h
time4 h
time24 h
-10 min
time24 h
+10 minmean
24 h pH T (oC)
1 12.02 12.98 12:51 6.129 15:52 6.268 11:40 6.407 12:00 6.339 6.37 10.1
2 12.02 12.98 13:05 6.131 16:04 6.206 11:52 6.421 12:16 6.407 6.41 9.8
3 11.74 13.26 13:17 6.363 16:18 6.416 12:02 6.445 12:25 6.500 6.47 10.2
4 11.74 13.26 13:30 6.464 16:26 6.276 12:23 6.440 12:42 6.393 6.42 9.8
5 12.32 12.68 13:46 6.186 16:46 6.031 12:35 6.198 12:58 6.182 6.19 10.1
6 12.32 12.68 14:03 6.223 17:01 6.077 12:52 6.252 13:13 6.267 6.26 10.1
5 min soak on all 24 h measurements
pH pH pH pH
pH (continuous stirring)
time
T (oC)
pH record (top only, no stirring)
Aluminum (mg/L) Product (mg/L) Product (ml/L)

Beaker
# Lims # Sample date / time orthoPtotal P(mg/L) Alk
1 24 h sample L34910-1 12:05 <mdl 0.0059 5.6
2 24 h sample -2 12:20 <mdl 0.0063 5.8
3 24 h sample -3 12:30 <mdl 0.0056 7.0
4 24 h sample -4 12:45 <mdl <mdl 6.9
5 24 h sample -5 13:00 <mdl <mdl 4.5
6 24 h sample -6 13:15 <mdl 0.0058 4.9
Alum (Cascade) -7 10:00
Alum, 10% -8 10:00
Sodium Aluminate (Univar) -9 10:00
Sodium Aluminate 10% -10 10:00
Lake Hicks water L34903-1 <mdl 0.0553 17.5
Al from alum (mg) = 25 /(1+k), where k = buffer-Al / alum-Al w/w ratioAl from buffer (mg) = 25 - Al from alum (mg)
Alum based on USALCO 48.2%w/w ratio Al2/product 0.04340Product weight 11.1 lbs/gal
5,045,455 mg/gal1328 mg/ml
Buffer Univar 30%w/w ratio Al2/product 0.0968Product weight 9.58 lbs/gal
4,354,545 mg/gal1146 mg/ml
3/9/2005
3/9/2005
3/9/2005
3/7/2005
3/9/2005
3/9/2005
3/9/2005
3/9/2005
Sample record
3/9/2005
3/9/2005
3/9/2005

APPENDIX E: EMERGENCY RESPONSE PLAN This appendix contains a copy of the Emergency Response Plan developed to guide staff in the event of a spill or medical emergency during the alum treatment.