alternative investments observer -...
TRANSCRIPT

AlternativeInvestments ObserverAlternativeInvestments Observer
2 Managed-Futures Category Overview We take a deep dive into this fast-expanding cateogory.
9 Absolute and Relative Momentum: A Primer Why momentum works.
12 A Game of Two Halves Which market environments are best for trend-followers?
Fund Reports 16 AllianzGI U.S. Equity Hedged 18 Goldman Sachs Multi-Manager Alternatives 20 Madison Covered Call and Equity Income 22 PIMCO Worldwide Long/Short Fundamental Strategy 24 Quaker Event Arbitrage
26 Quarterly Data Review: Q4 2014
33 Hedge Fund Database Overview
Volume 7, Number 1 Spring 2015
Morningstar Alternative Investments Observer Spring 2015
2
After languishing for several years, managed-futures funds bounced back in 2014, with the average fund notching a 9% return. Investors appear to have taken notice, pumping more than $1.4 billion into the Morningstar Category in the first two months of 2015, including a single-month record of $800 million in January.
Performance-chasing aside, there’s some reason for enthusiasm. Managed-futures strategies employ an intriguing approach—trend-following—that research has shown can hold promise in enhancing a portfolio’s risk-adjusted returns. Unfortunately, though, most of the available managed-futures funds are too pricey, too opaque, or too unproven to recommend. Indeed, we’ve awarded a positive rating to only two of the six managed-futures funds that we cover. (Those six funds together account for about 70% of that category’s aggregate assets under management.)
For investors seeking to add liquid alternatives exposure to a portfolio, managed futures have
value as one of the least correlated strategies in the universe. However, although we’ve seen welcome improvements in transparency and fees in recent years, the limited number of strategies that are currently worthy of investor attention in Morningstar’s view means that prospective investors should undertake due diligence of managed-futures funds cautiously. In this overview of the managed-futures category, we identify key characteristics and concerns regarding these funds and outline the framework for what Morningstar seeks in a positively rated fund.
Managed-Futures Fund Category: Morningstar CoverageMorningstar currently covers six of the roughly 50 funds in the managed-futures category, with those funds recently accounting for roughly 70% of the category’s aggregate assets under management. (The two Silver-rated AQR funds
use the same strategy, differing only in the amount of leverage used.) Those funds, and their ratings, are shown below in Exhibit 1.
For a complete list of managed-futures funds, see the appendix to this commentary.
How Managed-Futures Funds WorkManaged-futures funds derive returns from two sources: first, income and capital gains earned on long and short investments in futures contracts, and second, interest earned on the collateral that secures those futures investments (futures contracts only require a small amount of capital to gain exposure to a large notional amount, with the rest held as collateral). In recent years, with yields having fallen close to zero, collateral has generated a negligible return, but if the Federal Reserve raises short-term interest rates, that could change.
Managed-Futures Category OverviewWe take a deep dive into this fast-expanding mutual fund category.
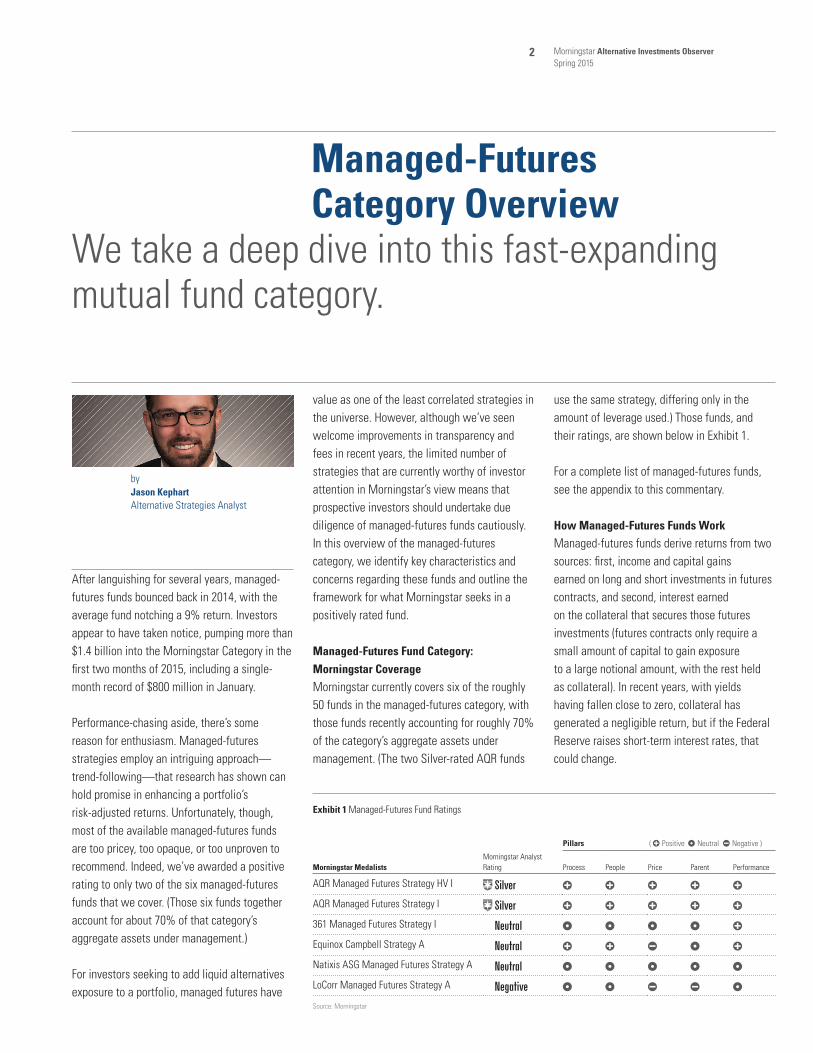
by Jason KephartAlternative Strategies Analyst
Pillars ( ∞ Positive ¶ Neutral § Negative )
Morningstar MedalistsMorningstar Analyst Rating Process People Price Parent Performance
AQR Managed Futures Strategy HV I „ ∞ ∞ ∞ ∞ ∞
AQR Managed Futures Strategy I „ ∞ ∞ ∞ ∞ ∞
361 Managed Futures Strategy I ˇ ¶ ¶ ¶ ¶ ∞
Equinox Campbell Strategy A ˇ ∞ ∞ § ¶ ∞
Natixis ASG Managed Futures Strategy A ˇ ¶ ¶ ¶ ¶ ¶
LoCorr Managed Futures Strategy A ¨ ¶ ¶ § § ¶
Source: Morningstar
Exhibit 1 Managed-Futures Fund Ratings

Morningstar Alternative Investments Observer Spring 2015
3
Managed-futures strategies try to take advantage of momentum, the idea that winners will keep winning and losers will keep losing, in one or more asset classes. Academics have extensively researched why momentum exists and whether or not it’s likely to continue. The most compelling case for why it exists is rooted in behavioral economics. Investors tend to buy when things are going up, extending the gains, thereby drawing in even more investors until eventually, after a short period, the trend collapses. (For more insight on the theoretical basis of trend-following and momentum, see Sam Lee’s article “Absolute and Relative Momentum: A Primer” on Page 9 of this issue.)
Managed-futures strategies typically use quantitative, rules-based models to detect and exploit trends via futures contracts, either by going long or short the market segments concerned. The frequency of momentum shifts in the market also leads to relatively high turnover for managed-futures funds.
There are a variety of trend-following strategies that managed-futures funds follow. Some focus on a single asset class while others range across multiple markets. Some employ trend-following models that measure shorter periods of a few months, while others focus on longer periods, up to a year. Some managed-futures funds are run by a single manager, while others are spread across multiple managers for diversification purposes. Moreover, different managers set different volatility targets, which can significantly affect the expected returns and risk of a given fund. Each strategy has its own merits. (Research has shown that momentum can be profitable over more than one time frame and across many different markets.) 1
Given the diversity of trend-following strategies, there’s been significant dispersion in managed-futures funds’ risk and return profiles, as shown in Exhibit 2.
Managed-Futures Category Overview
Exhibit 2 Performance Dispersion
Mariner Mgd Futures Strategy 2Longboard Mgd Futures Strategy IDirexion Idxd Mgd Futures Strat ACatalyst Hedged Futures Strategy AAltegris Futures Evolution Strtgy ANatixis ASG Mgd Futures Strtgy AForward Commodity L/S Strtgy InstlLoCorr Mgd Futures Strtgy AAQR Mgd Futures Strategy ITransamerica Mgd Futures Strtgy I2
Total Return Annualized 2-Year (Month-End)
State Street/Ramius Mgd Futs Strat ACredit Suisse Mgd Futs Strat AGoldman Sachs Mgd Futures Strat AMariner Mgd Futures Strategy ARaylor Mgd Futures Strategy AEquinox MutualHedge Futures Strtgy APrinceton Futures Strategy AGuggenheim Mgd Futures Strategy AAspen Mgd Futures Strategy AAltegris Mgd Futures Strategy A
Arrow Mgd Futures Strategy AGrant Park Mgd Futures Strategy ALoCorr Long/Short Commodity Strats AWakefield Mgd Futures Strategy ASFG Futures Strategy ADunham Alternative Strategy NAltegris Macro Strategy AHatteras Mgd Futures Strat A361 Mgd Futures Strategy INuveen Gresham L/S Cmdty Strat A
TFS Hedged Futures
Standard Deviation
Standard Deviation and Total Return data are annualized from 1/1/13 through 2/28/15.
2-Yr
Tot
al R
etur
n %
24
20
16
12
8
4
0
–4
0 642 108 12
Source: Morningstar
1 Hurst, B., Ooi Y.H., and Pedersen L.H. 2013. “Demystifying Managed Futures.” Journal of Investment Management, Vol. 11, No. 3. https://www.joim.com/abstract.asp?ArtID=487

Morningstar Alternative Investments Observer Spring 2015
4
Trend-following strategies tend to excel amid market turmoil, because bear and bull markets typically take several months to develop and peak, giving trend-followers a chance to ride the trend downward or upward. During the financial crisis, for example, the S&P 500 peaked in October 2007 but didn’t bottom until March 2009. That gave trend-followers an ample amount of time to avoid the brunt of the downturn. In fact, many trend-following strategies delivered robust returns during the crisis.
Conversely, trend-following can languish in certain market climates. For example, trend-followers have had difficulty adapting to short bursts of volatility that see markets fall and rebound over just a couple of months. That was the case in the summer of 2011, when alternating market swings wrong-footed many trend-following strategies, explaining their poor showing that year.
To a certain extent, that’s to be expected—virtually any investing approach will go in and out of style with changing market conditions. But what has distinguished trend-following, and thus managed-futures strategies, is its diversification potential. Indeed, trend-following has historically shown very little correlation to stock or bond markets. The biggest reasons for these diversifying properties are the ability of trend-followers to take short positions—and thus profit from a downward trend in prices and not only upward momentum—and the multiplicity of asset classes in which they trade, many of which in their own right have low correlations to stocks and bonds. As shown in Exhibit 3, the managed-futures category has exhibited low correlations to most other asset classes, including alternatives, during the past five years.
Exhibit 3 Managed-Futures Five-Year Category Correlations
S&P 500 TR USD 0.19
MSCI ACWI NR USD 0.19
MSCI EM NR USD 0.12
Barclays US Agg Bond TR USD 0.12
Barclays US Corp IG TR USD 0.16
BofAML US HY Master II TR USD 0.13
Multialternative Category 0.42
Long-Short Equity Category 0.18
Market-Neutral Category –0.11
Multicurrency Category 0.13
Non-Traditional-Bond Category 0.16
Source: Morningstar
We can also look at the benefits of adding managed futures to a portfolio. For example, we looked at the past 15 years ended Jan. 31, 2015, to estimate the effect of adding a 10% managed-futures allocation to a traditional 60%/40% portfolio of stocks and bonds. We used three different scenarios—funding the 10% allocation fully from stocks, fully from bonds, or pro-rata from stocks and bonds. (Since the track record of managed-futures mutual funds is very limited, we used the Morningstar MSCI Systematic Trading Hedge Fund Index. Hedge fund indexes have their share of weaknesses, but this index is a decent proxy for how trend-followers have performed.)
Exhibit 4 Portfolio Effects of Adding Managed Futures
Total Return (Ann) Sharpe Ratio
Managed Futures 5-Yr 10-Yr 15-Yr 5-Yr 10-Yr 15-Yr
60/40 Portfolio 11.25 7.04 5.41 1.45 0.65 0.42
Less stocks 9.96 7.04 5.84 1.53 0.77 0.55
Less bonds 11.05 7.33 5.68 1.41 0.69 0.46
Less stk/bonds 10.51 7.19 5.76 1.46 0.73 0.50
*Through Jan. 31. Managed-futures allocation representedby Morningstar MSCI Systematic Trading Hedge Fund Index.
Source: Morningstar
As Exhibit 4 shows, the 60/40 portfolio’s risk-adjusted returns would have gotten the biggest boost if funded entirely from stocks. The benefit of funding the allocation from bonds was
positive but only incrementally so. That makes sense given the strategy’s strong returns during equity bear markets. It also makes sense from a volatility standpoint, as the volatility levels of most managed-futures vehicles are closer to that of stocks than bonds.
There is some debate over how sustainable managed futures’ behavior as a stock-market buffer will be going forward. Over a multidecade period, managed-futures strategies have gained a good share of their returns from being long interest rates during their long-trending decline. If interest rates were to start rising for a sustained period and trend-followers were therefore largely short interest rates, they could lose some of the diversifying traits they have historically shown during stock-market downturns (because that’s when being long bonds has great defensive value). (For more on the future prospects of trend-following, see Craig Stanford’s article “A Game of Two Halves” on Page 12 of this issue).
How We Assess Managed-Futures FundsHigh fees, short track records, and uninspiring returns are among the reasons we’ve awarded a positive Morningstar Analyst Rating to only two of the managed-futures funds we cover (versions of the same strategy).
When evaluating managed-futures funds, Morningstar analysts apply the same five-pillar rating process that they use in assessing other types of funds, adapting it as necessary to account for issues specific to managed-futures strategies.
ProcessWhile there are many well-founded approaches to trend-following, we particularly look for firms that back up academic models with robust testing of their own, supported by well-qualified, well-resourced quantitative research teams that review and update models on a continuous and forward-looking basis. We prefer more-diversified strategies (across time horizons and market opportunity sets); they
Managed-Futures Category Overview

Morningstar Alternative Investments Observer Spring 2015
5
reduce the possibility of a fund’s experiencing a significant drawdown because of overconcentration in a limited number of markets. Although we do not take a position on whether a higher- or lower-volatility target is preferable, we prefer firms with established and sensible risk-management processes for addressing drawdowns, leverage, and counterparty risks. Managed-futures strategies are highly liquid but still have capacity constraints, so we expect firms to be able to articulate a capacity rationale for the strategy across all account types and a plan for closing funds when they reach capacity. Finally, we believe that firms should be as transparent as possible in explaining their investment and risk-management processes and disclosing portfolio holdings and exposures.
Process Spotlight:
Collateral Management
Although some funds have kept their collateral in cash despite zero interest rates, others, such as LoCorr Managed Futures LFMIX and Altegris Futures Evolution Strategy EVOIX, have invested it in bonds. This tactic could generate extra yield, but it also courts extra interest-rate risk, which can bite into returns. For example, both of those funds were among the worst-performing managed-futures funds in the spring of 2013, when interest rates unexpectedly spiked. LoCorr lost 9.47%, the worst of any managed-futures fund, while Altegris lost 5.19%. The average managed-futures fund was roughly flat over the same period. At a minimum, investors should consider a fund’s approach to managing collateral when evaluating the strategy’s prudence.
PeopleAs with any fund type, we look for management teams with deep expertise and long experience running the same or similar mandates. Because many managed-futures funds have short track records, we will assess a manager’s experience running the strategy as a commodity trading advisor (CTA) or hedge fund. With respect to
subadvised funds, we evaluate whether the advisor has strengths in manager selection as well as, ideally, a background in alternatives, managed-futures, or quantitative approaches. For firms that have not operated such vehicles previously, we look for management teams with a strong quantitative background, in particular running momentum or trend-following models. Managers should have adequate research staff to conduct ongoing model testing and fulfill risk-management functions. There is no set number for what constitutes an adequate team—such judgments depend on the complexity of the models and number of markets invested in, number of strategies overseen, and size of the fund complex.
Parent Morningstar reviews the parent companies of managed-futures funds as part of the separate stewardship review process we conduct for all fund firms. With so many new entrants in the managed-futures category, we pay particular attention to a firm’s focus on investment expertise and processes, versus an emphasis on distribution and sales efforts. The hallmarks of an investor-centric parent are below-average fees, high transparency, heavy manager investment in the funds they manage, and a thoughtful plan for managing capacity.
PerformancePerformance assessments for managed-futures funds are challenging, given that most funds have short track records and considering the largely unfavorable environment for trend-following. In addition, there are few good options for benchmarking managed-futures funds. Morningstar analysts assign Positive Performance ratings to strategies that not only have consistently outperformed peers on a risk-adjusted basis, but also have done so in accordance with expectations based on the strategy’s design. For instance, if a fund has a program in place to minimize drawdowns (such as exiting a trade when it declines a certain percentage), we would expect it to exhibit better results than peers when managed futures
as a whole are faring poorly. If a fund is new but employs a strategy that’s been utilized in another structure for some time, we will take that longer track record into account. However, we also account for any meaningful differences between the fund and that predecessor structure in assessing fees, leverage, volatility targets, or the universe of markets invested in.
PriceTo earn a Positive Price score, managed-futures funds must be cheaper than average when compared with the entire alternatives universe. In addition, Morningstar analysts compare a fund’s fees with the managed-futures category average. Finally, Morningstar analysts will examine the prospectus notes for funds using swap structures to assess any performance fees and will count those as a negative relative to the published expense ratios for a fund.
Price Spotlight:
Open and Hidden Costs of Managed Futures
Managed futures is the most expensive alternatives category that Morningstar follows, as shown in Exhibit 5. (The prospectus net expense ratio is a more accurate measure of multimanager funds’ expenses, as it includes the cost of the underlying funds.)
Exhibit 5 Alternatives Category Net Expense Ratios
Annual Report Prospectus
Managed Futures 2.06 2.09
Multialternative 1.72 2.02
Long-Short Equity 1.86 1.90
Market Neutral 1.75 1.71
Commodities Broad Basket 1.35 1.38
Nontraditional Bond 1.31 1.39
Source: Morningstar
That said, managed-futures funds’ expense ratios don’t always tell the whole story. That’s because a handful of funds use total-return swaps to access the net of fee returns of their subadvisors’ hedge fund strategies. By using the
Managed-Futures Category Overview

Morningstar Alternative Investments Observer Spring 2015
6
swap, these managed-futures funds are able to exclude the hedge fund fees—usually between 1% and 2% management fees and up to 20% performance fees–from the fund’s annual report net expense ratio. (The fund companies that engage in this practice argue that it’s the only way to get access to the best talent, though that is debatable at best.) Nevertheless, those costs still lower returns and, therefore, investors should scan the fine print carefully.
Morningstar’s lone Medalist in the managed-futures category, AQR Managed Futures AQMIX (along with its higher-volatility sibling QMHIX), epitomizes many of the best practices we seek in our five pillars.
Morningstar Analyst Rating: „The fund earns a Silver rating because of its diversified approach, thoughtfully constructed process, and impressive lineup of managers. The fund fell short of earning a Gold rating because even though it earned high marks for each pillar, manager investment could be higher, and its track record is still limited. We believe investors in the fund can expect a smoother ride, as compared with other managed-futures funds, and superior drawdown control.
Process Rating: ∞ PositiveThe fund earns a Process Pillar rating of Positive because it has a well-implemented, broadly diversified strategy. AQR’s process is rooted in its own academic research on momentum, which forms the basis for its more diversified offering. While the firm believes in the momentum factor, its research shows that it’s impossible to predict which assets classes, or time periods, will exhibit favorable and sustained trends (both positive and negative). Therefore, the fund takes a diversified approach across asset classes and time periods. Management closely monitors cross correlations of contracts and tweaks exposures accordingly—ramping up gross exposures when cross correlations are low and damping volatility when correlations are high. The fund also
employs a drawdown system that cuts risk in five 13% increments during a pullback. While drawdown management isn’t fundamental to a positive process, doing so exhibits a concerted effort to preserve capital, which is the concern of many investors in this space.
Finally, while the fund has grown tremendously in size, AQR has shown itself to be excellent at capacity management. The firm monitors the size of its positions, relative to the futures markets it trades in, and keeps a watchful eye on inflows. AQR doesn’t rewrite its process in the face of strong flows, instead opting to close the fund to preserve the current process.
People Rating: ∞ PositiveThe fund earns a People Pillar rating of Positive because of its large, academically focused bench. AQR embodies the ideal level of talent and efficient management structure to operate a managed-futures fund. The team boasts an impressive bench whose size and skill level trump many actively managed peers. The fund lists five managers and is supported by a 38-person global asset-allocation team that helps construct and maintain the firm’s models. AQR’s entire research staff is in-house, and its team is cross-listed on various other alternative strategies. But unlike other passive alternative providers, AQR’s managers aren’t listed on an unwieldy number of products, keeping their attention focused on only a handful of funds.
Parent Rating: ∞ PositiveThe fund earns a Parent Pillar rating of Positive because of its low fees, research-oriented culture, and track record of closing funds before they get too large. Many of the firm’s strategies are systematic in nature and are less expensive than peers. The average AQR fund ranks in the 31st percentile of category peers (lower being cheaper). AQR’s funds are based on the firm’s internal research, which is typically industry-leading on factor analysis, while minimizing the manufacture of “hot” funds whose investment rationale seems suspect. But AQR isn’t perfect. Manager
investments exceed $500,000 in funds accounting for only 7% of the firm’s mutual fund assets. Somewhat mitigating that, the firm tends to hold the line on assigning managers to funds, limiting them to just a handful at most. Finally, the firm has an excellent process of gauging capacity and closing funds.
Performance Rating: ∞ PositiveThe firm earns a Positive Performance Pillar rating because of its relative outperformance versus its peers. With many different implementations of trend-following approaches, performance in the category tends to be widely dispersed. This fund, however, takes a broadly diversified approach, investing in all four asset classes (equities, currencies, commodities, and fixed income). The result has been positive, with favorable rankings compared with the category, earning a 5-star Morningstar Rating. And it has held its own against the Credit Suisse Managed Futures Liquid index, outpacing it by 1.1% per year since inception.
Price Rating: ∞ PositiveThe fund earns a Positive Price Pillar rating because of the simplicity, transparency, and competitiveness of AQR’s pricing structure. AQR Managed Futures’ 1.23% expense ratio ranks in the lowest decile of the managed-futures category and is in the lower half of all alternative funds. The fund charges no performance fees or any other “hidden” manager fees that are sometimes levied by managed-futures funds that employ subadvisors.
Managed-Futures Category Overview
Morningstar Alternative Investments Observer Spring 2015
7
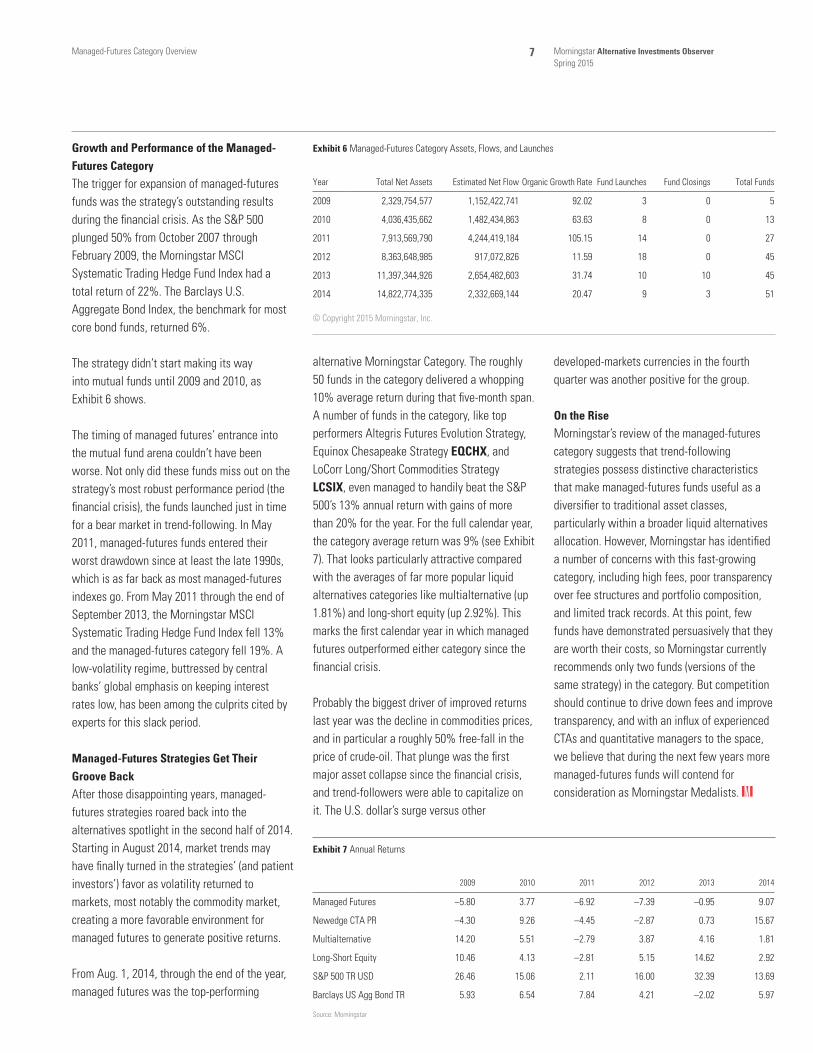
Growth and Performance of the Managed-Futures CategoryThe trigger for expansion of managed-futures funds was the strategy’s outstanding results during the financial crisis. As the S&P 500 plunged 50% from October 2007 through February 2009, the Morningstar MSCI Systematic Trading Hedge Fund Index had a total return of 22%. The Barclays U.S. Aggregate Bond Index, the benchmark for most core bond funds, returned 6%.
The strategy didn’t start making its way into mutual funds until 2009 and 2010, as Exhibit 6 shows.
The timing of managed futures’ entrance into the mutual fund arena couldn’t have been worse. Not only did these funds miss out on the strategy’s most robust performance period (the financial crisis), the funds launched just in time for a bear market in trend-following. In May 2011, managed-futures funds entered their worst drawdown since at least the late 1990s, which is as far back as most managed-futures indexes go. From May 2011 through the end of September 2013, the Morningstar MSCI Systematic Trading Hedge Fund Index fell 13% and the managed-futures category fell 19%. A low-volatility regime, buttressed by central banks’ global emphasis on keeping interest rates low, has been among the culprits cited by experts for this slack period.
Managed-Futures Strategies Get Their Groove BackAfter those disappointing years, managed-futures strategies roared back into the alternatives spotlight in the second half of 2014. Starting in August 2014, market trends may have finally turned in the strategies’ (and patient investors’) favor as volatility returned to markets, most notably the commodity market, creating a more favorable environment for managed futures to generate positive returns.
From Aug. 1, 2014, through the end of the year, managed futures was the top-performing
alternative Morningstar Category. The roughly 50 funds in the category delivered a whopping 10% average return during that five-month span. A number of funds in the category, like top performers Altegris Futures Evolution Strategy, Equinox Chesapeake Strategy EQCHX, and LoCorr Long/Short Commodities Strategy LCSIX, even managed to handily beat the S&P 500’s 13% annual return with gains of more than 20% for the year. For the full calendar year, the category average return was 9% (see Exhibit 7). That looks particularly attractive compared with the averages of far more popular liquid alternatives categories like multialternative (up 1.81%) and long-short equity (up 2.92%). This marks the first calendar year in which managed futures outperformed either category since the financial crisis.
Probably the biggest driver of improved returns last year was the decline in commodities prices, and in particular a roughly 50% free-fall in the price of crude-oil. That plunge was the first major asset collapse since the financial crisis, and trend-followers were able to capitalize on it. The U.S. dollar’s surge versus other
developed-markets currencies in the fourth quarter was another positive for the group.
On the RiseMorningstar’s review of the managed-futures category suggests that trend-following strategies possess distinctive characteristics that make managed-futures funds useful as a diversifier to traditional asset classes, particularly within a broader liquid alternatives allocation. However, Morningstar has identified a number of concerns with this fast-growing category, including high fees, poor transparency over fee structures and portfolio composition, and limited track records. At this point, few funds have demonstrated persuasively that they are worth their costs, so Morningstar currently recommends only two funds (versions of the same strategy) in the category. But competition should continue to drive down fees and improve transparency, and with an influx of experienced CTAs and quantitative managers to the space, we believe that during the next few years more managed-futures funds will contend for consideration as Morningstar Medalists. K
Managed-Futures Category Overview
Year Total Net Assets Estimated Net Flow Organic Growth Rate Fund Launches Fund Closings Total Funds
2009 2,329,754,577 1,152,422,741 92.02 3 0 5
2010 4,036,435,662 1,482,434,863 63.63 8 0 13
2011 7,913,569,790 4,244,419,184 105.15 14 0 27
2012 8,363,648,985 917,072,826 11.59 18 0 45
2013 11,397,344,926 2,654,482,603 31.74 10 10 45
2014 14,822,774,335 2,332,669,144 20.47 9 3 51
© Copyright 2015 Morningstar, Inc.
Exhibit 6 Managed-Futures Category Assets, Flows, and Launches
2009 2010 2011 2012 2013 2014
Managed Futures –5.80 3.77 –6.92 –7.39 –0.95 9.07
Newedge CTA PR –4.30 9.26 –4.45 –2.87 0.73 15.67
Multialternative 14.20 5.51 –2.79 3.87 4.16 1.81
Long-Short Equity 10.46 4.13 –2.81 5.15 14.62 2.92
S&P 500 TR USD 26.46 15.06 2.11 16.00 32.39 13.69
Barclays US Agg Bond TR 5.93 6.54 7.84 4.21 –2.02 5.97
Source: Morningstar
Exhibit 7 Annual Returns

Morningstar Alternative Investments Observer Spring 2015
8Managed-Futures Category Overview
1-Year 3-Year
Year Ticker Inception Date Total ReturnStandard Deviation
Total Return
Standard Deviation
Correlation to S&P 500
Morningstar Rating Overall Manager Structure*
361 Global Managed Futures Strategy I AGFZX 2/12/14 — — — — — — Single Manager
361 Managed Futures Strategy I AMFZX 12/20/11 5.13 4.80 6.46 6.46 -0.10 Q Q Q Q Single Manager
Abbey Capital Futures Strategy I ABYIX 7/1/14 — — — — — — Multimanager
Altegris Futures Evolution Strategy A EVOAX 10/31/11 26.00 8.98 7.09 9.46 0.30 Q Q Q Q Multimanager
Altegris Macro Strategy A MCRAX 6/1/11 3.64 5.70 -4.81 5.40 –0.29 Q Multimanager
Altegris Managed Futures Strategy A MFTAX 8/26/10 6.87 7.18 –0.41 7.20 0.17 Q Q Q Multimanager
American Beacon AHL Mgd Futs Strat A AHLAX 8/19/14 — — — — — — Single Subadviser
AQR Managed Futures Strategy HV I QMHIX 7/16/13 14.68 15.36 — — — — Single Manager
AQR Managed Futures Strategy I AQMIX 1/6/10 9.69 10.13 7.31 8.90 –0.06 Q Q Q Q Q Single Manager
Arrow Managed Futures Strategy A MFTFX 4/29/10 4.50 7.29 –2.92 6.65 –0.01 Q Q Single Manager
Aspen Managed Futures Strategy A MFBPX 8/2/11 7.83 9.07 3.11 7.10 –0.04 Q Q Q Single Manager
Campbell Core Trend Institutional CCTFX 12/31/14 — — — — — — Single Manager
Catalyst Hedged Futures Strategy A HFXAX 12/15/05 7.74 10.77 4.91 8.74 –0.42 — Single Manager
Catalyst Time Value Trading A TVTAX 11/7/14 — — — — — — Single Manager
Credit Suisse Managed Futs Strat A CSAAX 9/28/12 14.41 9.57 — — — — Single Manager
Direxion Idxd Mgd Futures Strat A DXMAX 2/1/12 14.65 13.69 — — — Q Q Single Manager
Discretionary Managed Futures Strat FUTEX 9/3/13 5.25 3.55 — — — — Single Subadviser
Dunham Alternative Strategy N DNASX 2/12/09 3.14 6.67 1.43 5.55 0.80 Q Q Q Single Subadviser
Equinox Aspect Core Diversified Strat I EQAIX 11/4/14 — — — — — — Single Subadviser
Equinox BH-DG Strategy I EBHIX 12/31/13 12.57 9.05 — — — — Single Subadviser
Equinox BlueCrest Systematic Macro I EBCIX 6/17/14 — — — — — — Single Subadviser
Equinox Campbell Strategy A EBSAX 3/1/13 17.26 13.24 — — — Single Subadviser
Equinox Chesapeake Strategy I EQCHX 9/7/12 22.68 14.22 — — — Single Subadviser
Equinox Crabel Strategy I EQCRX 3/8/13 8.35 8.73 — — — Single Subadviser
Equinox MutualHedge Futures Strategy A MHFAX 12/31/09 9.71 7.57 0.69 7.61 0.20 Q Q Q Multimanager
Forward Commodity L/S Strategy Instl FCMLX 12/31/10 0.57 10.35 –6.16 10.70 –0.04 Q Single Manager
Goldman Sachs Managed Futures Strat A GMSAX 2/29/12 –2.75 7.61 — — — Q Q Single Manager
Grant Park Managed Futures Strategy A GPFAX 3/4/11 5.87 6.83 –1.44 5.67 0.09 Q Q Multimanager
Guggenheim Managed Futures Strategy A RYMTX 3/2/07 10.06 9.05 0.61 7.54 0.15 Q Q Q Single Manager
Hatteras Managed Futures Strat A HMFAX 9/28/12 –4.78 4.97 — — — — Multimanager
Insignia Macro A IGMFX 12/31/13 6.32 6.10 — — — — Multimanager
LoCorr Long/Short Commodity Strats A LCSAX 12/30/11 22.07 7.15 –2.17 7.26 –0.15 Q Q Single Subadviser
LoCorr Managed Futures Strategy A LFMAX 3/22/11 15.42 6.31 0.83 9.18 0.12 Q Q Q Multimanager
LoCorr Market Trend A LOTAX 6/30/14 — — — — — Single Subadviser
Longboard Managed Futures Strategy I WAVIX 6/27/12 14.84 10.68 — — — — Single Manager
Mariner Managed Futures Strategy A MHBAX 12/16/11 –6.77 7.24 –5.12 8.30 0.15 Q N/A
Natixis ASG Managed Futures Strategy A AMFAX 7/30/10 21.76 9.31 6.80 9.82 0.38 Q Q Q Q Single Manager
Nuveen Gresham L/S Cmdty Strat A NGSAX 7/30/12 2.92 5.55 — — — Single Subadviser
PIMCO TRENDS Managed Futures Strat A PQTAX 12/31/13 20.26 5.76 — — — Single Manager
Princeton Futures Strategy A PFFAX 7/8/10 7.60 9.15 –1.57 7.77 0.05 Q Q Multimanager
Raylor Managed Futures Strategy A TMFAX 9/28/12 4.87 8.52 — — — — N/A
Salient Trend I SPTIX 1/2/13 14.21 19.63 — — — Single Manager
SFG Futures Strategy A EFSAX 12/30/11 9.45 6.34 1.53 6.06 0.15 Q Q Q Multimanager
State Street/Ramius Mgd Futs Strat A RTSRX 9/13/11 14.41 9.60 4.88 9.44 0.24 Q Q Q Single Subadviser
Steben Managed Futures Strategy A SKLAX 4/1/14 — — — — — — Multimanager
Superfund Managed Futures Strategy A SUPRX 12/31/13 2.37 8.98 — — — — N/A
TFS Hedged Futures TFSHX 12/29/11 –3.16 5.45 0.12 6.83 0.43 Q Q Single Manager
Wakefield Managed Futures Strategy A WKFAX 9/10/12 4.87 5.20 — — — N/A
Witherspoon Managed Futures Strategy A CTAAX 1/18/13 5.32 5.99 — — — Multimanager
Source: Morningstar Direct. All return periods except for Morningstar Rating through 12/31/14. *Manager Structure determined qualitatively by examining fund’s public filings. If public documents did not provide sufficient details the fund was designated N/A.
Appendix

Morningstar Alternative Investments Observer Spring 2015
9
In respectable investment circles, technical analysis is given as much consideration as voodoo, and the word chartist is synonymous with crank and charlatan. However, the tendency for prices to exhibit momentum is arguably the most robust pattern in financial markets. Academia was slow to acknowledge it, perhaps because it drives a stake through the heart of the so-called weak-form efficient-market hypothesis, which states that past prices can’t predict future prices.
The first major study on momentum was published in 1993, in the Journal of Finance, the field’s top journal.1 Narasimhan Jegadeesh and Sheridan Titman noted the puzzling efficacy of simple strategies that sorted U.S. stocks by past six- to 12-month returns, buying the highest-returning and shorting the lowest-returning. Their study acted as a hole in the dam, encouraging a trickle then a torrent of studies that found relative momentum in foreign
stocks, commodities, currencies, bonds—pretty much everywhere.
Despite the overwhelming evidence for relative momentum and its eventual acknowledgement by even diehard efficient-market adherents, absolute momentum (also known as trend- following or time series momentum) remains a touchy subject. Trend-following is market- timing, pure and simple, and the injunction against it is taken seriously by respectable sorts. A 2012 study by Tobias Moskowitz, Yao Hua Ooi, and Lasse H. Pedersen has poked a hole in the dam the same way Jegadeesh and Titman’s study did in 1993.2 The study was published in the Journal of Financial Economics, the second-most prestigious finance journal. Moskowitz, Ooi, and Pedersen found eerie profitability in a strategy that goes long a futures or forward contract when its trailing 12-month return in excess of cash is positive and goes short when it’s negative. This strategy is economically identical to the classic chartist’s strategy of buying an asset when it’s above its moving average and selling when it’s below. By recasting it and linking it to the existing literature, Moskowitz, Ooi, and Pedersen have wrapped a scientific veneer over an old chartist’s idea.
And indeed it is a very old idea. The great 19th century classical economist David Ricardo
is said to have advised friends to “never refuse an option when you can get it,” “cut short your losses,” and “let your profits run on.”3 Charles Dow, founder and editor of The Wall Street Journal, propounded a system of technical analysis. Upon his death in 1902, his successor, William Peter Hamilton, refined what he called Dow Theory and practiced it until his death in 1929. Dow Theory is a trend-following strategy. In a now-famous study published in 1933, Alfred Cowles showed that Hamilton’s advice would have resulted in lower returns than a simple buy-and-hold portfolio, 12.0% versus 15.5% annualized.4 However, Stephen J. Brown, William Goetzmann, and Alok Kumar revisited Dow Theory almost a century later and found that over 27 years Hamilton’s calls generated excess risk-adjusted returns, and his strategy would have worked out of sample.5 Because Hamilton would go into cash and sometimes even short the market, a portfolio tracking his calls would have exhibited only a third of the beta of the market and an alpha of around 4%.
Theories of MomentumThere is no good risk-based theory that addresses the prevalence and profitability of momentum. Sure, some efforts have been made, but none are persuasive. For example, in order to demonstrate that momentum is a risky strategy, defenders of the efficient-market
Absolute and Relative Momentum: A PrimerWhy momentum works, at least for now.
by Samuel LeeEditor, Morningstar ETFInvestor
1 Jegadeesh, N. & Titman, S. 1993. “Returns to Buying Winners and Selling Losers: Implications for Stock Market Efficiency.” J. Finance, Vol. 48, No. 1, P. 65. http://www.e-m-h.org/JeTi93.pdf2 Moskowitz, T. J., Ooi, Y. H., & Pedersen, L. H. 2012. “Time Series Momentum.” J. Financial Econ., Vol. 104, P. 228. http://openarchive.cbs.dk/bitstream/handle/10398/8862/time_series_momentum_lasse_heje.pdf?sequence=13 Grant, J. 1837. The Great Metropolis, Vol. II. http://www.victorianlondon.org/publications/thegreatmetropolis2-1.htm4 Cowles III, A. 1933. “Can Stock Market Forecasters Forecast?” Econometrica, Vol. 1, No. 3, P. 309. http://cowles.econ.yale.edu/archive/reprints/forecasters33.pdf5 Brown, S. J. Goetzmann, W., & Kumar, A. 1998. “The Dow Theory: William Peter Hamilton’s Track Record Reconsidered.” J. Finance, Vol. 53, No. 4, P. 1311. http://depot.som.yale.edu/icf/papers/fileuploads/2439/original/98-86.pdf

Morningstar Alternative Investments Observer Spring 2015
10
hypothesis point to the momentum factor’s sharp losses in 1932 and 2009. The momentum factor is constructed by taking the average returns of large- and small-cap high prior-return portfolios, minus the average returns of large- and small-cap low prior-return portfolios, refreshed monthly.
That looks like a plausible risk story. Momentum profits are like premiums you get for selling
catastrophe insurance. You’re rewarded most of the time but pay for it by suffering the rare and vicious loss. However, these extreme returns are artifacts of the way the momentum factor is constructed. During market panics, the betas of the high- and low-momentum portfolios diverge dramatically, with the high-momentum portfolios comprising the safest, most-boring stocks, and the low-momentum portfolios comprising the most-volatile,
least-liquid, and riskiest stocks.6 When the market rebounds, the long-short momentum factor is killed, because the high-momentum safe portfolio greatly lags the low-momentum junk portfolio. I constructed a long-short momentum factor that goes long high-momentum stocks but shorts the market. This version of the factor looks steady because the betas of the long and short portfolios stay more evenly matched through both normal and panic markets.
The risk-based story looks even less defensible when you look at the magnitude and timing of trend-following’s payoffs. Trend- following generates exceptional risk-adjusted returns. Even worse, its best returns come during extreme markets. In stable markets, trend-following performs reasonably well but won’t shoot the lights out, earning about the risk-free rate.7 Trend-following is like an insurance policy that pays you to own it, an impossible creature.
Academics seeking to preserve risk-based theories have bent over backward to explain the trendiness of markets, and many of their explanations have an ad hoc feel to them. For equities, it’s time-varying, serially correlated risk premiums or mysterious risk factors. For commodities, it’s the theory of storage, where price momentum is a proxy for tight inventories, which in turn should be compensated for with a “convenience yield.” For currencies, it’s central banks that try to manage exchange rates. While some of these explanations are undoubtedly true and useful, Hamilton, the much-maligned father of Dow Theory, offers a prescient explanation for trend-following’s success: “Prosperity will drive men to excess, and repentance for the consequences of those excesses will produce a corresponding depression.” The modern interpretation of the behavioral story goes like this: In light of surprising or extreme news, investors anchor
Absolute and Relative Momentum: A Primer
Exhibit 1 Momentum Factors
1927 20131967 1977 1987 1997 20071947 19571937
1000.00
100.00
10.00
1.00
0.10
Source: Morningstar
Exhibit 2 Beta-Matched Momentum Factors
1927 20141967 1977 1987 1997 20071947 19571937
1000.00
100.00
10.00
1.00
0.10
Source: Morningstar
6 Kent , D., & Moskowitz, T. 2014. “Momentum Crashes.” Working Paper. http://papers.ssrn.com/sol3/papers.cfm?abstract_id=24862727 Kaminski , K. M., & and Mende, A. 2011. “Crisis Alpha and Risk in Alternative Investment Strategies.” CME Group. http://www.cmegroup.com/education/files/PM146_Education_Kaminski_article.pdf

Morningstar Alternative Investments Observer Spring 2015
11Absolute and Relative Momentum: A Primer
new price estimates to old prices and do not fully adjust for its impact. Investors are also loath to realize losses, preferring to keep dogs until they break even, and are too quick to sell winners. Both biases prevent prices from instantly reflecting new information; instead, prices slowly adjust to fair value, creating sustained price movements. Performance-chasers hop on the trend, over-extending it, creating a self-fulfilling cycle that draws in more investors. Eventually, Herbert Stein’s law kicks in: “If something cannot go on forever, it will stop.” The trend collapses, leaving the investors who got in at the top holding the bag.
The literature behind this story is impressive and not in much dispute, so I won’t recapitulate it. What are less appreciated are the limits to arbitrage, the sand in the market mechanism that keeps smart money from bringing prices back in line with their fundamental values. Momentum is unusual in that it is perfectly rational for an investor who knows an asset is overpriced to contribute to the bubble or at least not try to fight against it too hard. George Soros, one of the most successful investors of all time, even said, “When I see a bubble forming I rush in to buy, adding fuel to the fire. That is not irrational.” 8 A would-be arbitrager who tries to do the opposite, short-selling a bubble, runs the real danger of going broke, because shorting requires you to get both the path and terminal prices of the asset right. An extreme example is the dot-com bubble, which required almost exact timing to short successfully. A short-seller who was even a few months too early would have been hurt badly; a short-seller who was even earlier would have been driven out of business.
The Holy Grail?The behavioral story implies that the growing capital dedicated to managed futures will reduce its profitability, possibly to the point where it offers little reward. A “fair” reward for
a strategy that does well in bad times is actually a low or even negative expected return. So far, there has been little evidence of this, though statistical tests are usually not powerful enough to detect all but the most dramatic changes. In one of his rare comments on investing strategy, Jim Simons, founder of Renaissance Technologies and dean of quantitative investors, said trend-following had “lost its zip” in recent years.9 He also noted that “almost any good viable predictive signal will almost certainly erode over five years. You have to keep coming up with new things. The market is working against you.” This was in 2007. Trend-following seems to have defied Simons’ predictions, although he might have been talking about fast trend-following signals, which do seem to have lost their power.
Trend-following looks like the Holy Grail of alternative investments. It’s uncorrelated to stocks and bonds, has an attractive Sharpe ratio, is liquid, and is one of the few strategies that does well in bad times. If you take the historical results of trend-following at face value, there is every reason to dedicate a big chunk of your portfolio to the strategy. However, doing so also requires you to believe that the markets are almost comically inefficient, at least at the macro level, and that other would-be alpha prospectors haven’t tapped the well dry. K
8 Soros, G. 2010. “The Soros Lectures at the Central European University.” (New York: Public Affairs) http://soros.3cdn.net/6bb92fa722dfd77d25_y3m6bhd7w.pdf9 Hamilton, D. 2007. “Renaissance hedge fund: Only scientists need apply.” Reuters, May 22, http://www.reuters.com/article/2007/05/22/simons-hedge-idUSN2135575220070522

Morningstar Alternative Investments Observer Spring 2015
12
Managed futures, or trend-following, is one of the least constrained alternative strategies, since it is free to invest in futures markets around the globe and has no bias to be either long or short. Craig Stanford, the head of alternative investments for Morningstar’s Ibbotson Associates Australia, provides an overview on the sources of trend-followers’ returns and how they have performed in different market conditions.
Trend-following strategies (sometimes known as commodity trading advisors, or CTAs) have been embraced by many investors as a core part of their alternatives allocation. The historical experience of most investors is that the strategy has been a reliable return generator in most market environments but especially when equities fare badly, and for this reason, the strategy is seen as having valuable portfolio-construction benefits.
This article contrasts trend-following’s performance over two different periods to show
that the strategy works better in some environments than it does in others, and then addresses some common misconceptions about trend-following and how the strategy generates returns. To close out the discussion, we look at some potential problems that would arise when using the strategy as an equity diversifier during a bear market for fixed income.
Prior to the global financial crisis, trend-following strategies were popular with investors, and it is not hard to see why. They had a solid stand-alone track record, invested in liquid instruments, and had valuable portfolio-construction benefits because
of their low correlation and low beta to both equities and bonds. Their performance during the global financial crisis cemented this view, as they were one of the few strategies that investors viewed as having delivered on their return promises.
Here we compare the performance of a concentrated allocation to trend-following strategies (represented by the Morningstar MSCI Systematic Trading Diversified Index) to the performance of a diversified hedge fund portfolio including trend-following (represented by the Morningstar MSCI Composite Equal Weighted Index). With the five-year anniversary of the equity market bottom (March 2009) now
A Game of Two HalvesWhich market environments are best for trend-followers?
by Craig StanfordHead of Alternative InvestmentsIbboston Associates Australia
Exhibit 1 10-Year Performance
Annualized Return Volatility Sharpe Ratio
0
5
10
0.0
0.5
1.0March 2004 through February 2014
Trend-FollowingDiversified Hedge Fund Portfolio
Source: Morningstar Ibbotson
Morningstar Alternative Investments Observer Spring 2015
13
behind us, it is a good opportunity to compare the performance of trend-followers with a diversified hedge fund portfolio over two separate periods: for the five years prior to the market bottom during the global financial crisis and the five years since then.
Comparing performance across the 10-year period from March 2004 to February 2014,
the diversified hedge fund portfolio outperformed the trend-followers by a decent margin (5.5% annualized vs. 4.0%), while displaying a lower level of volatility (6.0% vs. 9.8%). This is reflected in risk-adjusted return measures like the Sharpe ratio, which was 0.7 for the diversified hedge fund portfolio vs. 0.3 for trend-following (Exhibit 1).
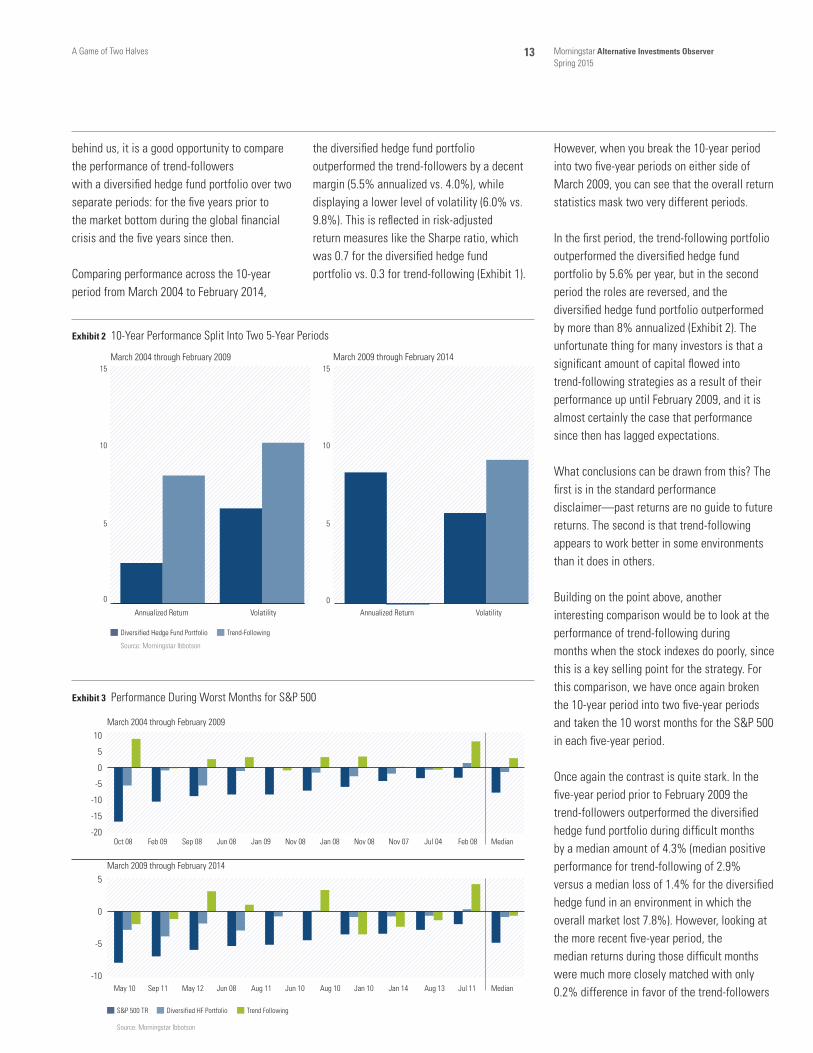
However, when you break the 10-year period into two five-year periods on either side of March 2009, you can see that the overall return statistics mask two very different periods.
In the first period, the trend-following portfolio outperformed the diversified hedge fund portfolio by 5.6% per year, but in the second period the roles are reversed, and the diversified hedge fund portfolio outperformed by more than 8% annualized (Exhibit 2). The unfortunate thing for many investors is that a significant amount of capital flowed into trend-following strategies as a result of their performance up until February 2009, and it is almost certainly the case that performance since then has lagged expectations.
What conclusions can be drawn from this? The first is in the standard performance disclaimer—past returns are no guide to future returns. The second is that trend-following appears to work better in some environments than it does in others.
Building on the point above, another interesting comparison would be to look at the performance of trend-following during months when the stock indexes do poorly, since this is a key selling point for the strategy. For this comparison, we have once again broken the 10-year period into two five-year periods and taken the 10 worst months for the S&P 500 in each five-year period.
Once again the contrast is quite stark. In the five-year period prior to February 2009 the trend-followers outperformed the diversified hedge fund portfolio during difficult months by a median amount of 4.3% (median positive performance for trend-following of 2.9% versus a median loss of 1.4% for the diversified hedge fund in an environment in which the overall market lost 7.8%). However, looking at the more recent five-year period, the median returns during those difficult months were much more closely matched with only 0.2% difference in favor of the trend-followers
A Game of Two Halves
Exhibit 2 10-Year Performance Split Into Two 5-Year Periods
Annualized Return Volatility Annualized Return Volatility
Trend-FollowingDiversified Hedge Fund Portfolio
March 2004 through February 2009 March 2009 through February 2014
0
5
10
15
0
5
10
15
Source: Morningstar Ibbotson
Exhibit 3 Performance During Worst Months for S&P 500
Diversified HF Portfolio Trend FollowingS&P 500 TR
March 2004 through February 2009
Source: Morningstar Ibbotson
-20
-15
-10
-5
0
5
10
-10
-5
0
5March 2009 through February 2014
May 10 Sep 11 May 12 Jun 08 Aug 11 Jun 10 Aug 10 Jan 10 Jan 14 Aug 13 Jul 11 Median
Oct 08 Feb 09 Sep 08 Jun 08 Jan 09 Nov 08 Jan 08 Nov 08 Nov 07 Jul 04 Feb 08 Median

Morningstar Alternative Investments Observer Spring 2015
14
compared with the 4.3% difference in the prior period (Exhibit 3).
Thus, it appears that during difficult months for equity markets since the market bottom in March 2009, trend-followers have not been much more helpful than a diversified hedge fund portfolio. The data also almost certainly confirm that the environment for trend-followers has changed between the two periods; if you combine this with the outright performance numbers quoted earlier, it is fairly clear that the diversified hedge fund portfolio has been a much better investment since the global financial crisis. Whether or not this will remain the case going forward remains to be seen, but any investor counting on trend-following alone is making a bet that conditions will return to those that prevailed before the global financial crisis.
Anecdotally, some investors attribute trend-followers’ ability to make money during difficult months for equity markets to the strategy’s holding positions that are “long volatility,” while others think that short equity or commodity positions are the key. Unfortunately, neither is generally correct. The strategy doesn’t involve the purchase of options or other volatility-based instruments, so it is not truly “long volatility.” Trend-following may sometimes behave as if it is “long volatility” but correlation doesn’t imply causality. The strategy may or may not be short equities and commodities at times, but this depends on how trends have developed prior to that point. If markets have been consistently trending upward for some time (and remember the very long-term trend in most assets has been up, so the natural bias is to be long most assets) then it is highly likely that a trend-follower is long those markets and is unlikely to switch from being long to being short very quickly.
The key and most consistent profit generators for most trend-followers during difficult months for equities are long positions in fixed
income (typically at both the front and back end of the curve). Intuitively, the reason for the positive contribution makes sense because fixed income typically rallies during equity market sell-offs. It also explains why trend-followers performed poorly in May and June 2013 when equities performed poorly; in a departure from their historical behavior, bonds and equities both sold off at the same time, thus long positions in fixed income produced losses.
In fact, if you were to look at all the months when equities fall and then at the combined contribution to trend-followers’ returns during those months from fixed income, equities, and other assets, you would likely find that fixed income was a significant and positive return generator while the other asset classes had negative contributions. This is represented in Exhibit 4 (chart on the left), where equities post a significantly negative return (negative 3%) and the trend-follower posts a slightly positive return (1%). Delving into a little more detail, however, the chart on the right shows that the trend-follower made 1.8% in fixed income while generating losses in equities (negative 0.5%) and other assets (negative 0.3%).
Given that long positions in fixed income have been so important, it is also worth thinking about what would happen during a bear market in the asset class, given expectations for rising rates in the coming years. Could trend-followers still make money, and perhaps more importantly, how would this impact the benefits they bring from a portfolio-construction perspective?
The first point to consider is whether trend-followers make money by being short fixed income. The good news is yes, they can—but the reality is that it is not quite a simple reversal of being long. Being short fixed income means that you are in effect paying away the bond coupon instead of receiving it, so there is a consistent drag instead of a consistent boost to returns, although this may be somewhat offset by earning more interest on the fund’s cash balances.
The other and probably more important factor, though, is that being short fixed income is the reverse of the position that has generated the bulk of the profits during difficult months, so the implication is that this position will probably start to generate losses during difficult months and compound an investor’s negative performance instead of offsetting it.
A Game of Two Halves
Exhibit 4 Median Performance During Poor Months
Equity Market Trend-Following P&L Trend-FollowingP&L
OtherEquitiesFixed Income–3.5
–3.0
–2.5
–2.0
–1.5
–1.0
–0.5
0.0
0.5
1.0
1.5
-1.0
-0.5
0.0
0.5
1.0
1.5
2.0
Trend-FollowingEquity Markets
Source: Morningstar Ibbotson

Morningstar Alternative Investments Observer Spring 2015
15
If fixed-income positions rally (as they typically do) during equity market sell-offs, and you are long equities and short fixed income, you will experience losses on your long equity as well as your short fixed-income positions—the classic perfect storm.
ConclusionThe purpose of this article is not to discredit trend-following as a viable strategy or suitable investment, since we invest in the strategy as a component of our diversified alternatives portfolios at Morningstar Investment Management, even though the benefits of doing so have been less clear since the global financial crisis. Rather, we aim to analyze how trend-followers have performed across different periods and to show that the strategy cannot be expected to outperform all the time—even in difficult markets. The performance of trend-followers depends on the positions the portfolio holds at the time, and those positions depend on how prices have moved prior to that.
In trying to explain the past five years of subdued performance by trend-followers, some trend-following managers have blamed central-bank intervention, but this is really guesswork since we have no ability to know what would have happened in the absence of this intervention. It is entirely possible that it has caused movements in the currency, fixed-income, and equity markets that have actually been a net benefit to the strategy.
We also analyzed how trend-followers tend to generate positive returns during difficult months for equity markets and concluded that most often it was long positions in fixed income that were the key profit generators as against short positions in equities or other assets.
Perhaps most importantly, we then offered some thoughts on how trend-followers might perform during a bear market for fixed income (if they are short the asset class) and concluded that many of their desired performance characteristics could in fact
reverse with the impact on a portfolio being larger instead of smaller losses. This could have a devastating impact on portfolios that rely on trend-followers to reduce their equity risk, since at times an allocation to trend-followers will actually add to your risk, and thus it makes sense to use trend-following or managed-futures strategies within the context of a broadly diversified alternatives portfolio and not in a concentrated fashion. K
A Game of Two Halves

Morningstar Alternative Investments Observer Spring 2015
16
by Josh Charney
Advisor Allianz Global Investment Fund Management LLC
Advisor Location New York, New York
Assets Under Management $15 million
Inception Date Dec. 4, 2012
Investment Type Mutual fund
Morningstar Category Long-short equity
PeopleThis U.S.-based options investment team was founded in 2005 and is part of Allianz Global Investors U.S. in New York. The team has nine members and manages approximately $3.3 billion in assets for institutional clients. Its chief investment officer and lead portfolio manager, Greg Tournant, heads the structured products team at Allianz Global Investors, which he joined in 2001. Tournant has 20 years of investment experience. He was previously a co-CIO at Innovative Options Management. Stephen Bond-Nelson has been with Allianz Global Investors since 1999 and also has 20 years of experience. Finally, Trevor Taylor joined the firm in 2008. He was also previously co-CIO of Innovative Options Management and has 14 years of experience.
PurposeThis fund is meant to provide investors with equitylike market exposure, but with a tempered risk profile. Because the fund uses put options, losses shouldn’t exceed the strike price of the put options during a sudden market pullback. The fund is also meant to provide moderate upside participation.
ProcessManagement’s systematic process offers protection from large drawdowns while exploiting idiosyncrasies in options pricing. The process employs a variable collar on its S&P 500 portfolio—management buys put options on the S&P 500 to protect against large drawdowns, and it partially offsets the puts’ cost by selling call options on the index, thereby capping some potential gains. The collar varies based on market volatility. If volatility is higher, management places a wider band on its collar to allow its stock portfolio more room to appreciate. Also, put options are relatively more expensive when volatility is higher, so management compensates by buying options further out of the money. Finally, when volatility is lower, management tightens the collar, thus giving the fund greater protection at a cheaper cost. Management tends to spend slightly more on put options than it recoups when selling calls.
Management maintains its put options between 4% and 10% out of the money and its call options between 3% and 10% out of the money. Options cover 100% of the portfolio’s net exposure, so losses below the puts are fully protected, and gains greater than the calls are fully capped. The fund also seeks to take advantage of discrepancies in the price of options across the duration curve by going long cheaper one-year put options and going short more-expensive one-month call options, which it rolls over each month.
PortfolioManagement starts its portfolio-construction process by investing every dollar of the fund’s assets in the SPDR S&P 500 ETF SPY. It then looks to fully inoculate the portfolio with put options. The put options are bought one year from expiration and are staggered in equal one-twelfth increments across a one-year duration. Each month, when a portion of the options expire, management will repurchase the one-year option contracts. To recoup the cost of the insurance, management then sells call options. These options, however, are only one-month duration options and are rolled over each month. Management contends there is a duration spread between the put and call options because of the relative difference in costs between one-year and one-month options.
PriceThis fund’s cost is very favorable versus its peers. Compared with all alternative funds, all share classes have Morningstar Fee Levels of Low, the lowest percentile fee designation. At 1.25% for the A shares and 1.00% for the Institutional shares, the expenses also compare very favorably with the long-short equity category’s average cost of 1.86%. K
AllianzGI U.S. Equity HedgedFund Reports
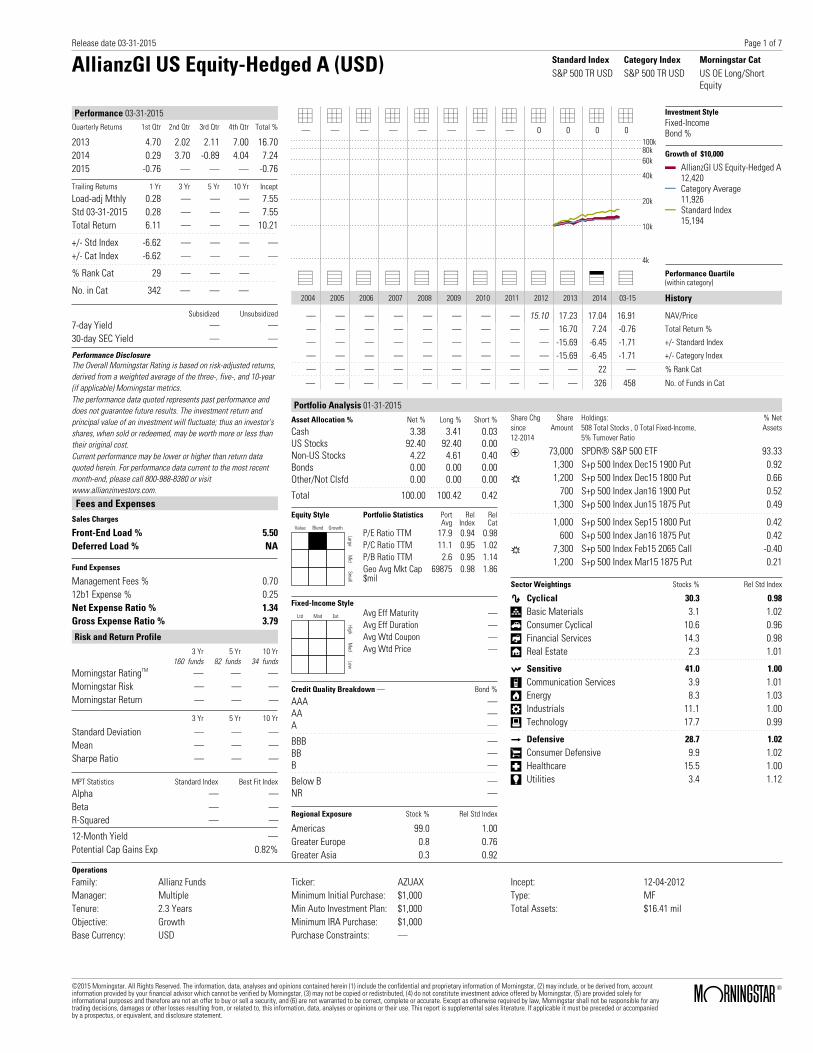
AllianzGI US Equity-Hedged A (USD) Standard Index Category Index Morningstar CatS&P 500 TR USD S&P 500 TR USD US OE Long/Short
Equity
Performance 03-31-2015Quarterly Returns 1st Qtr 2nd Qtr 3rd Qtr 4th Qtr Total %
2013 4.70 2.02 2.11 7.00 16.702014 0.29 3.70 -0.89 4.04 7.242015 -0.76 — — — -0.76
Trailing Returns 1 Yr 3 Yr 5 Yr 10 Yr Incept
Load-adj Mthly 0.28 — — — 7.55Std 03-31-2015 0.28 — — — 7.55Total Return 6.11 — — — 10.21
+/- Std Index -6.62 — — — —+/- Cat Index -6.62 — — — —
% Rank Cat 29 — — —
No. in Cat 342 — — —
Subsidized Unsubsidized
7-day Yield — —30-day SEC Yield — —
Performance DisclosureThe Overall Morningstar Rating is based on risk-adjusted returns,derived from a weighted average of the three-, five-, and 10-year(if applicable) Morningstar metrics.The performance data quoted represents past performance anddoes not guarantee future results. The investment return andprincipal value of an investment will fluctuate; thus an investor'sshares, when sold or redeemed, may be worth more or less thantheir original cost.Current performance may be lower or higher than return dataquoted herein. For performance data current to the most recentmonth-end, please call 800-988-8380 or visitwww.allianzinvestors.com.
Fees and ExpensesSales Charges
Front-End Load % 5.50Deferred Load % NA
Fund Expenses
Management Fees % 0.7012b1 Expense % 0.25Net Expense Ratio % 1.34Gross Expense Ratio % 3.79
Risk and Return Profile3 Yr 5 Yr 10 Yr
160 funds 82 funds 34 funds
Morningstar RatingTM — — —Morningstar Risk — — —Morningstar Return — — —
3 Yr 5 Yr 10 Yr
Standard Deviation — — —Mean — — —Sharpe Ratio — — —
MPT Statistics Standard Index Best Fit Index
Alpha — —Beta — —R-Squared — —
12-Month Yield —Potential Cap Gains Exp 0.82%
0 0 0 0 0 0 0 0 0 0 0 0— — — — — — — — 0 0 0 0
4k
10k
20k
40k
60k80k100k
Investment StyleFixed-IncomeBond %
Growth of $10,000
AllianzGI US Equity-Hedged A12,420Category Average11,926Standard Index15,194
_ _ _ _ _ _ _ _ _ _ & _ Performance Quartile(within category)
2004 2005 2006 2007 2008 2009 2010 2011 2012 2013 2014 03-15 History
— — — — — — — — 15.10 17.23 17.04 16.91 NAV/Price
— — — — — — — — — 16.70 7.24 -0.76 Total Return %
— — — — — — — — — -15.69 -6.45 -1.71 +/- Standard Index
— — — — — — — — — -15.69 -6.45 -1.71 +/- Category Index
— — — — — — — — — — 22 — % Rank Cat
— — — — — — — — — — 326 458 No. of Funds in Cat
Portfolio Analysis 01-31-2015Asset Allocation % Net % Long % Short %
Cash 3.38 3.41 0.03US Stocks 92.40 92.40 0.00Non-US Stocks 4.22 4.61 0.40Bonds 0.00 0.00 0.00Other/Not Clsfd 0.00 0.00 0.00
Total 100.00 100.42 0.42
Equity Style
Value Blend Growth
LargeM
idSm
all
Portfolio Statistics PortAvg
RelIndex
RelCat
P/E Ratio TTM 17.9 0.94 0.98P/C Ratio TTM 11.1 0.95 1.02P/B Ratio TTM 2.6 0.95 1.14Geo Avg Mkt Cap$mil
69875 0.98 1.86
Fixed-Income Style
Ltd Mod Ext
HighM
edLow
Avg Eff Maturity —Avg Eff Duration —Avg Wtd Coupon —Avg Wtd Price —
Credit Quality Breakdown — Bond %
AAA —AA —A —
BBB —BB —B —
Below B —NR —
Regional Exposure Stock % Rel Std Index
Americas 99.0 1.00Greater Europe 0.8 0.76Greater Asia 0.3 0.92
Share Chgsince12-2014
ShareAmount
Holdings:508 Total Stocks , 0 Total Fixed-Income,5% Turnover Ratio
% NetAssets
T 73,000 SPDR® S&P 500 ETF 93.331,300 S+p 500 Index Dec15 1900 Put 0.92
R 1,200 S+p 500 Index Dec15 1800 Put 0.66700 S+p 500 Index Jan16 1900 Put 0.52
1,300 S+p 500 Index Jun15 1875 Put 0.49
1,000 S+p 500 Index Sep15 1800 Put 0.42600 S+p 500 Index Jan16 1875 Put 0.42
R 7,300 S+p 500 Index Feb15 2065 Call -0.401,200 S+p 500 Index Mar15 1875 Put 0.21
Sector Weightings Stocks % Rel Std Index
h Cyclical 30.3 0.98
r Basic Materials 3.1 1.02t Consumer Cyclical 10.6 0.96y Financial Services 14.3 0.98u Real Estate 2.3 1.01
j Sensitive 41.0 1.00
i Communication Services 3.9 1.01o Energy 8.3 1.03p Industrials 11.1 1.00a Technology 17.7 0.99
k Defensive 28.7 1.02
s Consumer Defensive 9.9 1.02d Healthcare 15.5 1.00f Utilities 3.4 1.12
Operations
Family: Allianz FundsManager: MultipleTenure: 2.3 YearsObjective: GrowthBase Currency: USD
Ticker: AZUAXMinimum Initial Purchase: $1,000Min Auto Investment Plan: $1,000Minimum IRA Purchase: $1,000Purchase Constraints: —
Incept: 12-04-2012Type: MFTotal Assets: $16.41 mil
Release date 03-31-2015
©2015 Morningstar. All Rights Reserved. The information, data, analyses and opinions contained herein (1) include the confidential and proprietary information of Morningstar, (2) may include, or be derived from, accountinformation provided by your financial advisor which cannot be verified by Morningstar, (3) may not be copied or redistributed, (4) do not constitute investment advice offered by Morningstar, (5) are provided solely forinformational purposes and therefore are not an offer to buy or sell a security, and (6) are not warranted to be correct, complete or accurate. Except as otherwise required by law, Morningstar shall not be responsible for anytrading decisions, damages or other losses resulting from, or related to, this information, data, analyses or opinions or their use. This report is supplemental sales literature. If applicable it must be preceded or accompaniedby a prospectus, or equivalent, and disclosure statement.
ß®
Page 1 of 7

Morningstar Alternative Investments Observer Spring 2015
18
by Josh Charlson
Advisor Goldman Sachs
Advisor Location New York, New York
Assets Under Management $951 Million
Inception Date Apr. 30, 2013
Investment Type Mutual fund
Morningstar Category Multialternative
PeopleThe fund is comanaged by Jason Gottlieb and Ryan Roderick. Both are veterans of Goldman Sachs, Gottlieb having joined the firm in 1996 and Roderick in 1999. Gottlieb and Roderick are both managing directors within the AIMS Group and on the 10-person AIMS Hedge Fund and Public Markets Investment Committee, which approves managers for inclusion in this fund. Previously at Goldman, Gottlieb worked in firmwide risk manage-ment. Roderick previously worked in Goldman’s private wealth-management division. They are supported by the research resources of the AIMS Group, which consists of 275 people worldwide and is organized by strategy areas. They also interact with and have oversight from the investment committee, which is chaired by Kent Clark, CIO of the AIMS hedge fund team. Gottlieb and Roderick currently have only modest investments in the fund of $50,000 to $100,000 each.
PurposeLike many multimanager funds in the multialternative category, this fund looks to produce absolute returns (middle to high single-digit returns), along with reduced levels of correlation and volatility, defined by Goldman Sachs as a beta of 0.4 to 0.6 relative to the MSCI World Index, and volatility of half to two thirds of the market.
ProcessThe core of this fund originates in the Alternative Investments & Manager Selection (AIMS) Group at Goldman Sachs. This 275-person team, part of Goldman’s investment management division, is responsible for manager research selection for alternative strategies, including hedge funds, private equity, and real assets. One compelling aspect of this fund’s strategy is that investors benefit from the same well-resourced research team that oversees Goldman’s private hedge fund platform. A 10-person investment committee must approve every manager proposed for the platform, while a separate team that reports up to the CFO handles operational due diligence. This mutual fund’s two comanagers, with support from Goldman’s Portfolio Allocation Group, make the allocation decisions across alternative substrategies, driven by broader market views of the AIMS team. The managers believe that eight to 12 underlying managers are optimal given the fund’s current size, and they expect around 10% manager turnover annually. The fund has an anticipated capacity level of $3 billion to $4 billion.
PortfolioAs of Dec. 31, 2014, the portfolio contained nine underlying managers allocated across five broad alternative strategies. Currently, the largest strategy allocation is to event-driven and credit (42.4%), and long-short equity (25.0%) is the next largest. That represents an increase from earlier in the year, with reduced allocations to dynamic equity (8.6%) and opportunistic fixed income (8.2%). Tactical trading has remained stable at 15.8% of assets. The overweighting to event-driven and credit is spread across three managers: Ares (focusing on high-yield and bank loans), Brigade (also credit-focused), and Halcyon (event-driven). Goldman Sachs managers will tailor strategies to fit the constraints of a 1940 Act mutual fund, so in the case of Halcyon, the portfolio limits use of its less-liquid credit strategies and focuses more on liquid strategies like merger arbitrage.
During the past year, the fund’s net exposure has ranged as high as 114% and as low as 71%, where it stood in January 2015. Gross exposure during that period saw a maximum of 192% and a low of 143%. As of January 2015, from an asset-class perspective, the fund held 40% in equities, 48% in fixed-income, and 12% in foreign-exchange contracts.
PriceGoldman Sachs is currently capping the expense ratios of this fund at 2.55% for the A shares and 2.15% for the Institutional shares (subject to board review at the end of April 2015). Despite the cap, these Morningstar Fee Levels still rank as High and Above Average, respectively, relative to the funds’ similarly distributed alternative fund peers. K
Goldman Sachs Multi-Manager AlternativesFund Reports

Goldman Sachs Multi-Manager Alts A(USD)
Standard Index Category Index Morningstar CatMorningstarModerate TargetRisk
MorningstarModerate TargetRisk
US OEMultialternative
Performance 03-31-2015Quarterly Returns 1st Qtr 2nd Qtr 3rd Qtr 4th Qtr Total %
2013 — — 3.04 3.55 —2014 0.19 2.96 -1.48 0.97 2.612015 3.31 — — — 3.31
Trailing Returns 1 Yr 3 Yr 5 Yr 10 Yr Incept
Load-adj Mthly -0.02 — — — 2.77Std 03-31-2015 -0.02 — — — 2.77Total Return 5.80 — — — 5.85
+/- Std Index 1.59 — — — —+/- Cat Index 1.59 — — — —
% Rank Cat 25 — — —
No. in Cat 372 — — —
Subsidized Unsubsidized
7-day Yield — —30-day SEC Yield — —
Performance DisclosureThe Overall Morningstar Rating is based on risk-adjusted returns,derived from a weighted average of the three-, five-, and 10-year(if applicable) Morningstar metrics.The performance data quoted represents past performance anddoes not guarantee future results. The investment return andprincipal value of an investment will fluctuate; thus an investor'sshares, when sold or redeemed, may be worth more or less thantheir original cost.Current performance may be lower or higher than return dataquoted herein. For performance data current to the most recentmonth-end, please call 800-526-7384 or visitwww.goldmansachsfunds.com.
Fees and ExpensesSales Charges
Front-End Load % 5.50Deferred Load % NA
Fund Expenses
Management Fees % 2.0012b1 Expense % 0.25Net Expense Ratio % 2.68Gross Expense Ratio % 4.12
Risk and Return Profile3 Yr 5 Yr 10 Yr
200 funds 129 funds 22 funds
Morningstar RatingTM — — —Morningstar Risk — — —Morningstar Return — — —
3 Yr 5 Yr 10 Yr
Standard Deviation — — —Mean — — —Sharpe Ratio — — —
MPT Statistics Standard Index Best Fit Index
Alpha — —Beta — —R-Squared — —
12-Month Yield —Potential Cap Gains Exp 3.95%
0 0 0 0 0 0 0 0 0 0 0 0— — — — — — — — — 44 41 —
4k
10k
20k
40k
60k80k100k
Investment StyleFixed-IncomeBond %
Growth of $10,000
Goldman Sachs Multi-Manager Alts A11,152Category Average10,478Standard Index11,397
_ _ _ _ _ _ _ _ _ _ * _ Performance Quartile(within category)
2004 2005 2006 2007 2008 2009 2010 2011 2012 2013 2014 03-15 History
— — — — — — — — — 10.46 10.58 10.93 NAV/Price
— — — — — — — — — — 2.61 3.31 Total Return %
— — — — — — — — — — -2.28 1.94 +/- Standard Index
— — — — — — — — — — -2.28 1.94 +/- Category Index
— — — — — — — — — — 47 — % Rank Cat
— — — — — — — — — — 373 497 No. of Funds in Cat
Portfolio Analysis 12-31-2014Asset Allocation % Net % Long % Short %
Cash 40.63 40.65 0.02US Stocks 17.81 26.00 8.19Non-US Stocks 2.36 3.41 1.05Bonds 24.18 59.58 35.40Other/Not Clsfd 15.01 16.18 1.17
Total 100.00 145.83 45.83
Equity Style
Value Blend Growth
LargeM
idSm
all
Portfolio Statistics PortAvg
RelIndex
RelCat
P/E Ratio TTM 19.5 1.09 1.02P/C Ratio TTM 12.9 1.28 1.18P/B Ratio TTM 2.2 1.03 0.93Geo Avg Mkt Cap$mil
20593 0.80 0.85
Fixed-Income Style
Ltd Mod Ext
HighM
edLow
Avg Eff Maturity —Avg Eff Duration —Avg Wtd Coupon —Avg Wtd Price —
Credit Quality Breakdown — Bond %
AAA —AA —A —
BBB —BB —B —
Below B —NR —
Regional Exposure Stock % Rel Std Index
Americas 89.5 1.25Greater Europe 10.5 0.69Greater Asia 0.0 0.00
Share Chgsince09-2014
ShareAmount
Holdings:893 Total Stocks , 885 Total Fixed-Income,144% Turnover Ratio
% NetAssets
T 151,453 SPDR® S&P 500 ETF -4.4514 mil B039604 Irs Usd P F 2.50600 -1.9614 mil B039604 Irs Usd R V 03mlibor 1.90
R 9 mil B044332 Irs Usd P F 3.53042 -1.32
R 9 mil B044332 Irs Usd R V 03mlibor 1.31
T 77,400 CVS Health Corp 1.066 mil S040084 Irs Eur R F 1.31200 1.026 mil S040084 Irs Eur P V 06meurib -1.01
T 143,500 Oracle Corporation 0.92
T 67,908 Aon PLC 0.92
R 6 mil B44437 Irs Usd P F 3.48187 -0.90
R 6 mil B44437 Irs Usd R V 03mlibor 0.90
T 108,855 American International Group Inc 0.87
T 56,035 NextEra Energy Inc 0.85
R 219,325 Ally Finl Pfd 0.84
Sector Weightings Stocks % Rel Std Index
h Cyclical 42.4 1.07
r Basic Materials 6.3 1.16t Consumer Cyclical 11.4 0.96y Financial Services 17.0 0.95u Real Estate 7.8 1.70
j Sensitive 36.3 0.99
i Communication Services 1.1 0.29o Energy 4.7 0.64p Industrials 10.6 0.90a Technology 19.9 1.45
k Defensive 21.3 0.90
s Consumer Defensive 4.3 0.51d Healthcare 13.6 1.23f Utilities 3.4 0.79
Operations
Family: Goldman SachsManager: MultipleTenure: 2.0 YearsObjective: GrowthBase Currency: USD
Ticker: GMAMXMinimum Initial Purchase: $1,000Min Auto Investment Plan: $250Minimum IRA Purchase: $250Purchase Constraints: —
Incept: 04-30-2013Type: MFTotal Assets: $1,064.67 mil
Release date 03-31-2015
©2015 Morningstar. All Rights Reserved. The information, data, analyses and opinions contained herein (1) include the confidential and proprietary information of Morningstar, (2) may include, or be derived from, accountinformation provided by your financial advisor which cannot be verified by Morningstar, (3) may not be copied or redistributed, (4) do not constitute investment advice offered by Morningstar, (5) are provided solely forinformational purposes and therefore are not an offer to buy or sell a security, and (6) are not warranted to be correct, complete or accurate. Except as otherwise required by law, Morningstar shall not be responsible for anytrading decisions, damages or other losses resulting from, or related to, this information, data, analyses or opinions or their use. This report is supplemental sales literature. If applicable it must be preceded or accompaniedby a prospectus, or equivalent, and disclosure statement.
ß®
Page 1 of 7

Morningstar Alternative Investments Observer Spring 2015
20
by A.J. D’Asaro
Advisor Madison Funds
Advisor Location Madison, Wisconsin
Assets Under Management $61 million
Inception Date Nov. 2, 2009
Investment Type Mutual fund
Morningstar Category Long-short equity
PeopleRay Di Bernardo is the lead portfolio manager for all of Madison Investment Advisors’ covered-call portfolios, which include this fund, closed-end funds, and separate accounts. Prior to joining Madison in 2003, Di Bernardo was an equity analyst at Concord Trust, focusing on global health-care companies. Before that, he was an equity analyst and comanager of international and emerging-markets portfolios at a Toronto-based international-equity firm. He invests between $10,001 and $50,000 alongside fund shareholders.
Di Bernardo is supported by co-portfolio manager Frank Burgess, the president and chief investment officer of Madison Investment Advisors, which he founded in 1974. A member of the firm’s board of directors, he focuses on strategic planning for the business and the management of the firm’s equity-option strategies. He invests between $100,001 and $500,000 in Madison Covered Call and Equity Income and more than $1 million across other Madison funds.
Management is supported by Madison’s large-cap growth team, which helps with the fund’s stock selection. Walter Dewey has managed that team since December 2012.
PurposeMadison Covered Call and Equity Income Fund invests long in U.S. stocks and sells calls to generate current income, at the expense of future stock market upside. The strategy delivers lower returns than a long-only equity index, but the option income provides a cushion of return against minor market pullbacks. This fund is suited for bond investors looking to diversify with equities and equity investors with a lower tolerance for risk.
ProcessThe fund invests in a concentrated portfolio of approximately 45 U.S. stocks with market capitaliza-tions of above $3 billion. Management selects stocks using a growth-at-a-reasonable-price strategy, which favors companies with long track records of growth, earnings stability, sustainable competitive advantage, and conservative balance sheets. Management also favors management teams with strong records of stewardship of shareholder capital. Management assigns a fair value to each holding by discounting future cash flows and attempts to buy at a discount to that value. Turnover is fairly high at 139% over the trailing 12 months. Management sells out-of-the-money calls on an average of 85% of the stock portfolio. The decision to sell calls, and how far out of the money to strike them, depends on management’s bullishness on the underlying stock. In general, as a stock approaches management’s estimate of fair value, the fund will sell calls closer to the money, capping their upside and receiving more income, eventually letting the stock get called away.
PortfolioAs of Dec. 31, 2014, the fund was invested in 44 stocks. Compared with the S&P 500, the fund was underweight financial stocks by 11.0 percentage points and health-care stocks by 8.6 percentage points, preferring to hold cash. The fund’s cash position stood at 17.9% of assets, which is about average for the fund. The fund’s cash position has historically reached as high as 25% to allow the fund flexibility in stock selection. The fund’s top picks included Amazon.com AMZN, SPDR Gold Shares GLD, and Costco Wholesale COST, each with weightings of 2.8% of the portfolio. The fund’s dividend yield was 1.2% and the weighted average market capitalization was $66.5 billion. As of the same date, the fund had sold call options on 80% of its equity portfolio. The average days to expiration for the options were 31, down from approximately 45 days in the previous quarter.
PriceMadison Covered Call and Equity Income is offered in R6, Y, A, and C share classes, which charge 0.87%, 1.03%, 1.25%, and 1.75%, respectively. The R6 share class is offered only in select 401(k) plans. Compared with other long-short equity funds, shares are priced significantly below the category average 1.90% expense ratio. The 1.03% Institutional share-class expense ratio is also average compared with similarly distributed no-load large-cap funds and is about equal to the large-blend category’s 0.95%. K
Madison Covered Call and Equity Income Fund Reports

Madison Covered Call &Equity Income A (USD)
Overall Morningstar RatingTM Standard Index Category Index Morningstar CatQQQ S&P 500 TR USD S&P 500 TR USD US OE Long/Short
Equity160 US OE Long/Short Equity
Performance 03-31-2015Quarterly Returns 1st Qtr 2nd Qtr 3rd Qtr 4th Qtr Total %
2013 3.54 0.21 4.81 4.36 13.482014 2.11 2.62 0.60 0.55 5.992015 0.93 — — — 0.93
Trailing Returns 1 Yr 3 Yr 5 Yr 10 Yr Incept
Load-adj Mthly -1.26 4.73 6.37 — 6.70Std 03-31-2015 -1.26 — 6.37 — 6.70Total Return 4.77 6.82 7.64 — 7.87
+/- Std Index -7.96 -9.30 -6.82 — —+/- Cat Index -7.96 -9.30 -6.82 — —
% Rank Cat 38 42 38 —
No. in Cat 342 160 82 —
Subsidized Unsubsidized
7-day Yield — —30-day SEC Yield — —
Performance DisclosureThe Overall Morningstar Rating is based on risk-adjusted returns,derived from a weighted average of the three-, five-, and 10-year(if applicable) Morningstar metrics.The performance data quoted represents past performance anddoes not guarantee future results. The investment return andprincipal value of an investment will fluctuate; thus an investor'sshares, when sold or redeemed, may be worth more or less thantheir original cost.Current performance may be lower or higher than return dataquoted herein. For performance data current to the most recentmonth-end, please call 800-877-6089 or visitwww.madisonfunds.com.
Fees and ExpensesSales Charges
Front-End Load % 5.75Deferred Load % NA
Fund Expenses
Management Fees % 0.8512b1 Expense % 0.25Net Expense Ratio % 1.28Gross Expense Ratio % 1.28
Risk and Return Profile3 Yr 5 Yr 10 Yr
160 funds 82 funds 34 funds
Morningstar RatingTM 3Q 3Q —Morningstar Risk Avg Avg —Morningstar Return Avg Avg —
3 Yr 5 Yr 10 Yr
Standard Deviation 6.41 10.64 —Mean 6.82 7.64 —Sharpe Ratio 1.06 0.74 —
MPT Statistics Standard Index Best Fit IndexMorningstar
Lifetime Moderate2050
Alpha -2.13 -0.01Beta 0.58 0.62R-Squared 74.33 83.02
12-Month Yield —Potential Cap Gains Exp -2.59%
0 0 0 0 0 0 0 0 0 0 0 0— — — — — — — — 0 0 0 0
4k
10k
20k
40k
60k80k100k
Investment StyleFixed-IncomeBond %
Growth of $10,000
Madison Covered Call &Equity Income A15,072Category Average12,767Standard Index22,375
_ _ _ _ _ _ _ _ _ _ * _ Performance Quartile(within category)
2004 2005 2006 2007 2008 2009 2010 2011 2012 2013 2014 03-15 History
— — — — — 10.10 10.14 9.63 9.60 9.93 9.64 9.53 NAV/Price
— — — — — — 8.89 3.33 9.24 13.48 5.99 0.93 Total Return %
— — — — — — -6.18 1.22 -6.76 -18.90 -7.69 -0.02 +/- Standard Index
— — — — — — -6.18 1.22 -6.76 -18.90 -7.69 -0.02 +/- Category Index
— — — — — — — — — — 27 — % Rank Cat
— — — — — — — — — — 326 458 No. of Funds in Cat
Portfolio Analysis 02-28-2015Asset Allocation % Net % Long % Short %
Cash 26.10 26.10 0.00US Stocks 67.67 70.92 3.25Non-US Stocks 2.51 2.58 0.07Bonds 0.00 0.00 0.00Other/Not Clsfd 3.73 3.73 0.00
Total 100.00 103.32 3.32
Equity Style
Value Blend Growth
LargeM
idSm
all
Portfolio Statistics PortAvg
RelIndex
RelCat
P/E Ratio TTM 20.3 1.07 1.11P/C Ratio TTM 11.3 0.96 1.03P/B Ratio TTM 3.0 1.08 1.30Geo Avg Mkt Cap$mil
46668 0.65 1.24
Fixed-Income Style
Ltd Mod Ext
HighM
edLow
Avg Eff Maturity —Avg Eff Duration —Avg Wtd Coupon —Avg Wtd Price —
Credit Quality Breakdown — Bond %
AAA —AA —A —
BBB —BB —B —
Below B —NR —
Regional Exposure Stock % Rel Std Index
Americas 96.5 0.98Greater Europe 3.4 3.33Greater Asia 0.1 0.39
Share Chgsince01-2015
ShareAmount
Holdings:560 Total Stocks , 1 Total Fixed-Income,139% Turnover Ratio
% NetAssets
6,000 Amazon.com Inc 3.7818,000 PowerShares QQQ ETF 3.23
9,200 SPDR® S&P 500 ETF 3.2116,300 SPDR® Gold Shares 3.1319,200 Starbucks Corp 2.97
30,800 eBay Inc 2.9520,300 T. Rowe Price Group Inc 2.78
2,800 Google Inc Class C 2.591,200 Priceline Group Inc 2.46
23,600 Baker Hughes Inc 2.44
18,800 Occidental Petroleum Corp 2.4212,200 Diageo PLC ADR 2.4048,900 EMC Corp 2.3428,500 Verizon Communications Inc 2.3325,600 General Mills Inc 2.28
Sector Weightings Stocks % Rel Std Index
h Cyclical 35.2 1.14
r Basic Materials 1.3 0.45t Consumer Cyclical 23.8 2.16y Financial Services 10.0 0.68u Real Estate 0.1 0.04
j Sensitive 51.9 1.27
i Communication Services 3.6 0.95o Energy 14.6 1.82p Industrials 10.7 0.96a Technology 22.8 1.27
k Defensive 12.9 0.46
s Consumer Defensive 8.7 0.90d Healthcare 4.1 0.27f Utilities 0.1 0.04
Operations
Family: Madison FundsManager: MultipleTenure: 5.5 YearsObjective: Equity-IncomeBase Currency: USD
Ticker: MENAXMinimum Initial Purchase: $1,000Min Auto Investment Plan: $50Minimum IRA Purchase: $500Purchase Constraints: —
Incept: 10-30-2009Type: MFTotal Assets: $62.24 mil
Release date 03-31-2015
©2015 Morningstar. All Rights Reserved. The information, data, analyses and opinions contained herein (1) include the confidential and proprietary information of Morningstar, (2) may include, or be derived from, accountinformation provided by your financial advisor which cannot be verified by Morningstar, (3) may not be copied or redistributed, (4) do not constitute investment advice offered by Morningstar, (5) are provided solely forinformational purposes and therefore are not an offer to buy or sell a security, and (6) are not warranted to be correct, complete or accurate. Except as otherwise required by law, Morningstar shall not be responsible for anytrading decisions, damages or other losses resulting from, or related to, this information, data, analyses or opinions or their use. This report is supplemental sales literature. If applicable it must be preceded or accompaniedby a prospectus, or equivalent, and disclosure statement.
ß®
Page 1 of 7

Morningstar Alternative Investments Observer Spring 2015
22
by Jason Kephart
Advisor PIMCO
Advisor Location Newport Beach, California
Assets Under Management $3 billion
Inception Date Dec. 4, 2014
Investment Type Mutual Fund
Morningstar Category Long-short equity
PeopleThis fund is jointly managed by PIMCO and subadvisor Research Affiliates. Rob Arnott, founder of Research Affiliates, represents the subadvisor as a named manager on this fund. Research Affiliates is the brains behind the global fundamental indexing strategy that the fund uses to drive its returns. Research Affiliates has a long and well-respected track record of constructing fundamentally weighted indexes. Their indexes are most popular in exchange-traded funds, particularly PowerShares FTSE RAFI US 1000 PRF.
The fixed-income portion of the fund is managed by PIMCO’s absolute return bond team, which also manages Neutral-rated PIMCO Unconstrained Bond PFIUX. There’s been considerable turnover among the team since Bill Gross departed the firm. Even though this fund is less than a year old, it’s already had one manager change. Saumil Parikh left PIMCO in mid-January 2015. He was replaced by Sudi Mariappa, who was named as a comanager alongside Mohsen Fahmi. Still, the overall team is strong and backed by PIMCO’s ample research resources.
PurposeThis long-short equity fund offers investors access to a hedged version of Research Affiliate’s low-volatility fundamental indexing strategy. It can be used to lower the overall risk of a portfolio of long-only equity mutual funds. ProcessThis fund’s returns are a combination of three factors. The first is the long-short global equity strategy developed by Research Affiliates. The index is long companies in the 19 countries with liquid futures markets that have a combination of low market betas and score well on Research Affiliate’s fundamental screen, which scores companies on metrics like price/cash flow and price/book value. The most attractive stocks with the lowest betas have the highest weightings in the long index. The index is short market-cap-weighted country indexes. It’s expected to have a market beta of 0.3. The fund’s overall beta can range between 0.0 and 0.6, though. The overall beta is managed by PIMCO’s tail-risk hedging group. The beta should go up when expected volatility is low, measured by factors like VIX, and should go lower as expected volatility rises. The index is accessed via derivatives. Since the derivatives only require modest collateral, PIMCO is left with a pile of cash to manage. It does so in a similar fashion to PIMCO Unconstrained Bond. As long as the bond strategy can outperform the cost of the derivatives, it can be additive to the fund’s total returns.
PortfolioAs of Dec. 31, 2014, the Research Affiliates index was 150% gross long global equities and 75% gross short. That’s in line with the long-term expectations. The largest net sector weightings were telecommunications (18.2%), consumer staples (15.4%), and utilities (13.9%). Even though the overall net exposure is 75%, the focus on low-beta equities brings the index’s overall beta down to 0.30. PIMCO’s tail-risk hedging team wasn’t making any adjustments to the fund’s overall beta.
The biggest theme in the absolute return bond portfolio was a strong U.S. dollar. The strategy was long the dollar versus the yen, euro, Australian dollar, and Canadian dollar as the investment committee believes the growth challenges outside the United States will lead to currency deprecia-tion. It also had a slightly negative duration and favored Treasury Inflation-Protected Securities.
PriceThis fund is offered in six share classes. The Institutional shares have an expense ratio of 1.19%, which is below average compared with similarly distributed peers. The average long-short equity Institutional share class has an expense ratio of 1.54%. The A shares have an expense ratio of 1.59%, which is also below average compared with peers. K
PIMCO Worldwide Long/Short Fundamental Strategy
Fund Reports

PIMCO Worldwide L/S Fdmtl Strat A (USD) Standard Index Category Index Morningstar CatS&P 500 TR USD S&P 500 TR USD US OE Long/Short
Equity
Performance 03-31-2015Quarterly Returns 1st Qtr 2nd Qtr 3rd Qtr 4th Qtr Total %
2013 — — — — —2014 — — — — —2015 1.09 — — — 1.09
Trailing Returns 1 Yr 3 Yr 5 Yr 10 Yr Incept
Load-adj Mthly — — — — -6.52Std 03-31-2015 — — — — -6.52Total Return — — — — -1.08
+/- Std Index — — — — —+/- Cat Index — — — — —
% Rank Cat — — — —
No. in Cat — — — —
Subsidized Unsubsidized
7-day Yield — —30-day SEC Yield — —
Performance DisclosureThe Overall Morningstar Rating is based on risk-adjusted returns,derived from a weighted average of the three-, five-, and 10-year(if applicable) Morningstar metrics.The performance data quoted represents past performance anddoes not guarantee future results. The investment return andprincipal value of an investment will fluctuate; thus an investor'sshares, when sold or redeemed, may be worth more or less thantheir original cost.Current performance may be lower or higher than return dataquoted herein. For performance data current to the most recentmonth-end, please call 888-877-4626 or visitwww.pimco.com/investments.
Fees and ExpensesSales Charges
Front-End Load % 5.50Deferred Load % NA
Fund Expenses
Management Fees % 1.3412b1 Expense % 0.25Net Expense Ratio % 1.59Gross Expense Ratio % 1.64
Risk and Return Profile3 Yr 5 Yr 10 Yr
160 funds 82 funds 34 funds
Morningstar RatingTM — — —Morningstar Risk — — —Morningstar Return — — —
3 Yr 5 Yr 10 Yr
Standard Deviation — — —Mean — — —Sharpe Ratio — — —
MPT Statistics Standard Index Best Fit Index
Alpha — —Beta — —R-Squared — —
12-Month Yield —Potential Cap Gains Exp —
0 0 0 0 0 0 0 0 0 0 0 0— — — — — — — — — — 47 —
4k
10k
20k
40k
60k80k100k
Investment StyleFixed-IncomeBond %
Growth of $10,000
PIMCO Worldwide L/S FdmtlStrat A10,109Category Average10,122Standard Index10,095
_ _ _ _ _ _ _ _ _ _ _ _ Performance Quartile(within category)
2004 2005 2006 2007 2008 2009 2010 2011 2012 2013 2014 03-15 History
— — — — — — — — — — 9.72 9.82 NAV/Price
— — — — — — — — — — — 1.09 Total Return %
— — — — — — — — — — — 0.14 +/- Standard Index
— — — — — — — — — — — 0.14 +/- Category Index
— — — — — — — — — — — — % Rank Cat
— — — — — — — — — — — 458 No. of Funds in Cat
Portfolio Analysis 12-31-2014Asset Allocation % Net % Long % Short %
Cash -130.58 126.56 257.15US Stocks 0.37 0.37 0.00Non-US Stocks 0.38 0.38 0.00Bonds 152.54 246.46 93.92Other/Not Clsfd 77.29 153.68 76.39
Total 100.00 527.45 427.45
Equity Style
Value Blend Growth
LargeM
idSm
all
Portfolio Statistics PortAvg
RelIndex
RelCat
P/E Ratio TTM 17.3 0.91 0.95P/C Ratio TTM 9.9 0.84 0.90P/B Ratio TTM 2.0 0.72 0.86Geo Avg Mkt Cap$mil
65939 0.92 1.76
Fixed-Income Style
Ltd Mod Ext
HighM
edLow
Avg Eff Maturity —Avg Eff Duration —Avg Wtd Coupon —Avg Wtd Price —
Credit Quality Breakdown — Bond %
AAA —AA —A —
BBB —BB —B —
Below B —NR —
Regional Exposure Stock % Rel Std Index
Americas 55.2 0.56Greater Europe 44.6 43.73Greater Asia 0.1 0.53
Share Chgsince—
ShareAmount
Holdings:0 Total Stocks , 215 Total Fixed-Income,— Turnover Ratio
% NetAssets
R 929 mil Cdx Itraxx Main22 5y Ice 69.13
R 1,018 mil Cdx Ig23 5y Ice 62.49
R 9 mil Ralveiut Trs Equity 1ml+48.8 Gst 59.96
R 10 mil Ralveiit Trs Equity 1ml+72 Fbf 59.74
R 5 mil Ralveiet Trs Equity 1ml+99 Gst 30.14
R 132,140 Sptr Trs Equity 1ml+43.5 Bps 30.08
R 100,548 Ndduwxus Trs Equity 1ml+6 Fbf 29.96
R 424 mil Irs Usd 2.500 06/17/15-7y Cme 26.08
R 316 mil Irs Usd 2.500 12/17/14-7y Cme 19.68
R 225 mil 10 Year US Treasury Note Future Ma 17.21
R 305 mil Irs Aud 3.250 12/17/14-5y Cme 15.48
R 524,870 Ndueegf Trs Equity 1ml+20 Bps 12.73
R 202 mil US Treasury Note 12.17
R 199 mil Irs Usd 1.750 06/17/15-3y Cme 12.03
R 144 mil FNMA 4% TBA 9.28
Sector Weightings Stocks % Rel Std Index
h Cyclical 35.3 1.14
r Basic Materials 4.8 1.62t Consumer Cyclical 9.6 0.87y Financial Services 19.1 1.31u Real Estate 1.7 0.76
j Sensitive 36.5 0.89
i Communication Services 5.2 1.34o Energy 9.4 1.17p Industrials 9.9 0.89a Technology 12.1 0.67
k Defensive 28.2 1.00
s Consumer Defensive 11.2 1.15d Healthcare 12.7 0.82f Utilities 4.3 1.42
Operations
Family: PIMCOManager: MultipleTenure: 0.3 YearObjective: GrowthBase Currency: USD
Ticker: PWLAXMinimum Initial Purchase: $1,000Min Auto Investment Plan: $250Minimum IRA Purchase: $1,000Purchase Constraints: —
Incept: 12-04-2014Type: MFTotal Assets: $3,224.86 mil
Release date 03-31-2015
©2015 Morningstar. All Rights Reserved. The information, data, analyses and opinions contained herein (1) include the confidential and proprietary information of Morningstar, (2) may include, or be derived from, accountinformation provided by your financial advisor which cannot be verified by Morningstar, (3) may not be copied or redistributed, (4) do not constitute investment advice offered by Morningstar, (5) are provided solely forinformational purposes and therefore are not an offer to buy or sell a security, and (6) are not warranted to be correct, complete or accurate. Except as otherwise required by law, Morningstar shall not be responsible for anytrading decisions, damages or other losses resulting from, or related to, this information, data, analyses or opinions or their use. This report is supplemental sales literature. If applicable it must be preceded or accompaniedby a prospectus, or equivalent, and disclosure statement.
ß®
Page 1 of 7

Morningstar Alternative Investments Observer Spring 2015
24
by A.J. D’Asaro
Advisor Quaker Funds
Advisor Location Berwyn, Pennsylvania
Assets Under Management $106 million
Inception Date Nov. 21, 2003
Investment Type Mutual Fund
Morningstar Category Multialternative
PeopleThomas F. Kirchner founded this fund (previously named the Pennsylvania Avenue Fund) in 2003 and sold it to Quaker Funds in 2009. Prior to establishing Pennsylvania Avenue, Kirchner worked as a bond trader and financial engineer for Banque Nationale de Paris S.A. from 1996-99. From 1999-2004, Kirchner was retained by Fannie Mae as a financial engineer. He is a graduate of Kings College, University of London, Institut d’Etudes Politiques de Paris, and University of Chicago Booth School of Business. He invests between $100,001 and $500,000 in the mutual fund.
Paul Hoffmeister joined Quaker Funds in 2010 as co-portfolio manager of the Event Arbitrage Fund. He served as the chief economist of Bretton Woods Research between 2006 and 2014, and director of market strategy at Polyconomics from 2004-06. He serves as economic counsel to Bretton Woods Research and is a graduate of Georgetown University with a bachelor’s degree in accounting and finance. The team is also supported by one analyst.
PurposeThis fund invests in an event-driven equity strategy, covering seven distinct classifications of company events. Its goal is to offer higher risk-adjusted returns than a long-only equity fund, and with a low correlation to traditional equity indexes. As such, it is suitable as a lower-volatility replacement for equity exposure, or as part of a diversified alternatives allocation.
ProcessPortfolio managers Thomas Kirchner and Paul Hoffmeister scan the markets daily for potential event-driven and arbitrage opportunities. The fund primarily invests in activist situations, merger arbitrage, distressed securities, spin-offs, and capital restructuring. For example, the fund’s largest holding is Pfizer PFE, which they expect to announce a spin-off in the near future. Once a potential event is identified, the duo analyzes time to completion, involved parties, risks to completion, and potential return. Individual position sizes reflect a maximum 2% of portfolio value-at-risk and liquidity requirements. The team’s macro view informs the fund’s tactical allocation to various types of events.
Kirchner and Hoffmeister take a collaborative approach to risk management, divvying up positions to monitor for new developments. Some of the fund’s event positions have a short component to hedge out market risk, such as merger arbitrage and capital structure arbitrage. Others, such as distressed securities, special situations, and activist investor situations, are unhedged or partially hedged, introducing some amount of market risk into the portfolio. The resulting mix is about 60% net long the stock market (during the past three years), although this number can fluctuate.
PortfolioAs of Dec. 31, 2014, the fund was invested in 86 events. The fund’s strategy allocation was as follows: activist situations (28.06%), special situations (15.10%), distressed securities (13.14%), event-driven merger arbitrage (8.29%), classic merger arbitrage (6.72%), capital structure arbitrage (7.82%), liquidations (2.39%), and cash (14.28%). The fund defines event-driven merger arbitrage as a merger-related event with less certainty about deal terms, such as an announced deal without a definitive merger agreement. In the first quarter of 2015, management increased its allocation to merger arbitrage to 23% from 15% at year-end, reflecting widened spreads. The fund also entered into several distressed debt positions in the energy sector following its precipitous decline. Also in the first quarter of 2015, management moved to fully invest the fund’s remaining cash, citing a wide array of opportunities. The fund was invested broadly across the market-capitalization spectrum, with a weighted average market capitalization of $5.33 billion as of year-end 2014.
PriceQuaker Event Arbitrage is offered in I, A, and C share classes, which charge 1.74%, 1.99%, and 2.74%, respectively. All share classes are above average relative to other alternative mutual funds. K
Quaker Event ArbitrageFund Reports

Quaker Event Arbitrage A(USD)
Overall Morningstar RatingTM Standard Index Category Index Morningstar CatQQQ Morningstar
Moderate TargetRisk
MorningstarModerate TargetRisk
US OEMultialternative200 US OE Multialternative
Performance 03-31-2015Quarterly Returns 1st Qtr 2nd Qtr 3rd Qtr 4th Qtr Total %
2013 3.30 2.32 2.97 3.17 12.282014 1.33 2.63 -3.55 1.81 2.122015 1.23 — — — 1.23
Trailing Returns 1 Yr 3 Yr 5 Yr 10 Yr Incept
Load-adj Mthly -3.59 3.24 2.09 3.12 5.50Std 03-31-2015 -3.59 — 2.09 3.12 5.50Total Return 2.02 5.20 3.25 3.71 6.03
+/- Std Index -2.19 -2.85 -5.07 -3.07 —+/- Cat Index -2.19 -2.85 -5.07 -3.07 —
% Rank Cat 59 32 66 43
No. in Cat 372 200 129 22
Subsidized Unsubsidized
7-day Yield — —30-day SEC Yield — —
Performance DisclosureThe Overall Morningstar Rating is based on risk-adjusted returns,derived from a weighted average of the three-, five-, and 10-year(if applicable) Morningstar metrics.The performance data quoted represents past performance anddoes not guarantee future results. The investment return andprincipal value of an investment will fluctuate; thus an investor'sshares, when sold or redeemed, may be worth more or less thantheir original cost.Current performance may be lower or higher than return dataquoted herein. For performance data current to the most recentmonth-end, please call 800-220-8888 or visitwww.quakerfunds.com.
Fees and ExpensesSales Charges
Front-End Load % 5.50Deferred Load % NA
Fund Expenses
Management Fees % 1.3012b1 Expense % 0.25Net Expense Ratio % 1.98Gross Expense Ratio % 2.15
Risk and Return Profile3 Yr 5 Yr 10 Yr
200 funds 129 funds 22 funds
Morningstar RatingTM 3Q 2Q 3QMorningstar Risk +Avg Avg AvgMorningstar Return Avg -Avg Avg
3 Yr 5 Yr 10 Yr
Standard Deviation 5.58 6.21 8.14Mean 5.20 3.25 3.71Sharpe Ratio 0.93 0.54 0.31
MPT Statistics Standard Index Best Fit IndexMorningstar
SEC/ConsumerCyclical TR USD
Alpha -0.13 -2.25Beta 0.67 0.39R-Squared 56.81 69.74
12-Month Yield —Potential Cap Gains Exp -1.78%
0 0 3 3 6 6 6 6 6 5 5 2— — 91 64 60 50 56 59 54 72 81 81
4k
10k
20k
40k
60k80k100k
Investment StyleEquityStock %
Growth of $10,000
Quaker Event Arbitrage A18,743Category Average13,022Standard Index21,349
_ _ _ _ _ _ _ _ _ _ _ _ Performance Quartile(within category)
2004 2005 2006 2007 2008 2009 2010 2011 2012 2013 2014 03-15 History
12.01 12.99 13.19 12.43 9.23 11.80 12.58 11.59 12.12 13.53 12.97 13.13 NAV/Price
26.85 12.51 11.06 0.04 -25.74 27.84 7.45 -5.70 5.86 12.28 2.12 1.23 Total Return %
15.37 5.47 -1.90 -8.59 -3.55 6.07 -4.88 -6.29 -6.18 -2.03 -2.77 -0.14 +/- Standard Index
15.37 5.47 -1.90 -8.59 -3.55 6.07 -4.88 -6.29 -6.18 -2.03 -2.77 -0.14 +/- Category Index
— — — — — — — — — — — — % Rank Cat
— — — — — — — — — — — 497 No. of Funds in Cat
Portfolio Analysis 02-28-2015Asset Allocation % Net % Long % Short %
Cash 5.73 5.73 0.00US Stocks 66.49 69.41 2.92Non-US Stocks 13.94 14.66 0.72Bonds 8.43 8.43 0.00Other/Not Clsfd 5.41 5.67 0.26
Total 100.00 103.90 3.90
Equity Style
Value Blend Growth
LargeM
idSm
all
Portfolio Statistics PortAvg
RelIndex
RelCat
P/E Ratio TTM 20.7 1.15 1.09P/C Ratio TTM 9.0 0.89 0.82P/B Ratio TTM 1.9 0.90 0.81Geo Avg Mkt Cap$mil
6470 0.25 0.27
Fixed-Income Style
Ltd Mod Ext
HighM
edLow
Avg Eff Maturity —Avg Eff Duration —Avg Wtd Coupon —Avg Wtd Price 84.60
Credit Quality Breakdown — Bond %
AAA —AA —A —
BBB —BB —B —
Below B —NR —
Regional Exposure Stock % Rel Std Index
Americas 87.0 1.21Greater Europe 11.6 0.77Greater Asia 1.4 0.11
Share Chgsince01-2015
ShareAmount
Holdings:83 Total Stocks , 27 Total Fixed-Income,280% Turnover Ratio
% NetAssets
105,000 Pfizer Inc 3.5968,000 LSB Industries Inc 2.55
R 83,400 NCR Corp 2.4426,900 Crown Castle International Corp 2.31
T 1 mil API Technologies Corp 2.31
64,900 FTD Companies Inc 2.2544,700 GlaxoSmithKline PLC ADR 2.1142,500 Merrill Lynch Intl ([Wts/Rts]) 2.1036,400 eBay Inc 2.1056,900 Mondelez International Inc Class A 2.09
59,600 Vodafone Group PLC ADR 2.0531,300 FMC Corporation 1.9874,600 Equity Commonwealth 1.9774,500 Telephone and Data Systems, Inc. 1.8981,500 Hertz Global Holdings Inc 1.87
Sector Weightings Stocks % Rel Std Index
h Cyclical 35.6 0.90
r Basic Materials 9.0 1.67t Consumer Cyclical 17.7 1.50y Financial Services 4.9 0.27u Real Estate 4.0 0.87
j Sensitive 46.0 1.25
i Communication Services 8.8 2.28o Energy 3.4 0.46p Industrials 14.9 1.27a Technology 18.8 1.37
k Defensive 18.5 0.78
s Consumer Defensive 6.5 0.77d Healthcare 11.9 1.08f Utilities 0.0 0.00
Operations
Family: QuakerManager: MultipleTenure: 11.4 YearsObjective: GrowthBase Currency: USD
Ticker: QEAAXMinimum Initial Purchase: $2,000Min Auto Investment Plan: $2,000Minimum IRA Purchase: $1,000Purchase Constraints: —
Incept: 11-21-2003Type: MFTotal Assets: $106.45 mil
Release date 03-31-2015
©2015 Morningstar. All Rights Reserved. The information, data, analyses and opinions contained herein (1) include the confidential and proprietary information of Morningstar, (2) may include, or be derived from, accountinformation provided by your financial advisor which cannot be verified by Morningstar, (3) may not be copied or redistributed, (4) do not constitute investment advice offered by Morningstar, (5) are provided solely forinformational purposes and therefore are not an offer to buy or sell a security, and (6) are not warranted to be correct, complete or accurate. Except as otherwise required by law, Morningstar shall not be responsible for anytrading decisions, damages or other losses resulting from, or related to, this information, data, analyses or opinions or their use. This report is supplemental sales literature. If applicable it must be preceded or accompaniedby a prospectus, or equivalent, and disclosure statement.
ß®
Page 1 of 7

Morningstar Alternative Investments Observer Spring 2015
26
Estimated Net Flows ($ Mil)
30,000
25,000
20,000
15,000
10,000
5,000
0
–5,000
–10,000
–15,00009-2013 12-2013 03-2014 06-2014 09-2014 12-2014
TotalLong-Short EqMngd FuturesMkt NeutralMultialternativeNontrad Bond Bear MarketMulticurrency
Quarterly Alternative Mutual Fund FlowsDuring the fourth quarter of 2014, alternative mutual funds’ net outflows amounted to $8.6 billion, a reversal from last quarter’s inflows of roughly $9.6 billion. Multialternative and managed futures were the only categories that experienced inflows this quarter, with $2.8 billion and $690 million, respectively. The mar-ket-neutral ($3.7 billion), long-short equity ($3.3 billion), and non-traditional-bond ($3.1 billion) categories experienced the highest outflows, while bear-market ($1.2 billion) and multicur-rency ($749 million) funds experienced declines despite inflows in the previous quarter.
Total Net Assets ($ Mil)
Bear Market
09-2013 12-2013 03-2014 06-2014 09-2014 12-2014
350,000
250,000
200,000
300,000
150,000
100,000
50,000
Long-Short EqMngd FuturesMkt NeutralMultialternativeNontrad Bond Multicurrency
Quarterly Alternative Mutual Fund Assets Under ManagementAssets under management for all alternative mutual funds decreased by 3.78% quarter over quarter, totaling more than $304 billion at the end of December 2014. Five of the seven alter-native mutual fund categories decreased in assets in the fourth quarter. Bear-market funds experienced the largest with percentage losses in assets both this quarter and over the yearly time period, losing 25.30% in the quarter and 35.16% since 2013. Market-neutral and multi-currency funds both experienced roughly a 12% decrease in assets this quarter, despite a mod-est spike in the third quarter. Managed futures and multialternative were the only categories that experienced increases in assets, at 10.96% and 5.78%, respectively. Nontraditional bond, the largest category in terms of assets, experi-enced the smallest decrease in assets, with a loss of 3.13%.
Flows and Assets Under Management: Alternative Mutual Funds

Morningstar Alternative Investments Observer Spring 2015
27
Estimated Net Flows ($ Mil)
Fund of Hedge Funds FlowsSingle-Manager HF Flows
12,000
09-2013 12-2013 03-2014 06-2014 09-2014 12-2014
10,000
8,000
6,000
4,000
2,000
0
–2,000
–4,000
–6,000
–8,000
–10,000
–12,000
Total Net Assets ($ Mil)500,000
Fund of Hedge Funds AssetsSingle-Manager HF Assets
09-2013 12-2013 03-2014 06-2014 09-2014 12-2014
450,000
400,000
350,000
300,000
250,000
200,000
150,000
100,000
50,000
Quarterly Hedge Fund FlowsSingle-manager hedge funds in Morningstar’s database experienced inflows of $4.3 billion, while funds of hedge funds recorded outflows of just more than $1.1 billion during the fourth quarter of 2014. Multistrategy (single-manager) hedge funds experienced the highest inflows, with nearly $6.2 billion, and long-short debt (single manager) trailed with the second-highest inflows at $1.1 billion, marking a fifth consecu-tive quarter of inflows. U.S. long-short equity, systematic-futures, and global-macro (single-manager) hedge funds demonstrated the largest outflows of $1.1 billion, $755 million, and $706 million, respectively. For the funds of hedge funds, the debt category was the only one to display positive flows this quarter, with inflows of $323 million. Multistrategy funds, on the other hand, experienced the largest outflows ($849 million) for the second quarter in a row. Macro-systematic and equity fund of funds displayed the next largest outflows, at $254 million and $149 million, respectively.
Quarterly Hedge Fund Assets Under ManagementIn the fourth quarter of 2014, assets under management for single-manager hedge funds in Morningstar’s database increased slightly by 0.61% to $327.1 billion. Despite recent gains, however, assets decreased by a total of 6.55% during the last year. In contrast with single-manager hedge funds, hedge funds of funds in Morningstar’s database managed 26.15% fewer assets than in the prior quarter, with $59.9 billion assets recorded as of Dec. 31, 2014. Assets under management of hedge funds of funds decreased 34.45% year over year (from December 2013). Overall, combined assets declined by 4.74% this quarter, and 12.33% since December 2013.
Flows and Assets Under Management: Hedge Funds

Morningstar Alternative Investments Observer Spring 2015
28
Alternative Fund Performance: Growth of $10,000
US OE Long-Short EquityUS OE Managed Futures
US OE Market NeutralMSCI World NR USD Morningstar MSCI Comp Hedge Fund (AW)
Barclays Global Aggregate TR USD
06-2013 12-201406-2014 09-201412-2013 03-201409-2013
14,000
12,000
10,000
8,000
6,000
4,000
2,000
Total Returns %
Barclays Global Aggregate TR USD
Morningstar MSCI Composite AW
MSCI World NR USD US OE Long-ShortEquity
US OE Managed Futures
US OE MarketNeutral
18
Quarterly Return 2014-Q4 Base Currency Total Ret 1 Yr (Qtr-End) Base CurrencyTotal Ret Annlzd 3 Yr (Qtr-End) Base Currency Total Ret Annlzd 5 Yr (Qtr-End) Base Currency
16
14
12
10
8
6
4
0
2
–2
Growth of a $10,000 Alternative InvestmentIn the fourth quarter of 2014, the managed-futures category average displayed the largest percentage increase in comparison with all other alternative investment categories, grow-ing by 6.17%. Global stocks, as represented by the MSCI World NR Index; hedge funds, as represented by the Morningstar MSCI Comp Hedge Fund Index; and the long-short equity category average all gained approximately 1% during the same time period. During the 18 months ended Dec. 31, 2014, the MSCI World NR Index continued to outperform all other categories, with a 22.6% return. During the same period, the Morningstar MSCI Composite Hedge Fund Index saw an overall gain of 12.36%, long-short equity funds gained 11.37%, and the managed-futures category average increased by 10.85%. The Barclays Global Bond Index and the market-neutral category average gained 2.94% and 2.72%, respectively, during the 18-month period, as well.
Performance of Alternative Investments Over TimeManaged futures displayed the highest returns compared with other alternative investments this quarter, with a 6.17% return. Global stocks, as represented by the MSCI World NR Index, steadily outperformed all other alternative investments over the three- and five-year time frames (ended Dec. 31) and sustained positive returns over the one-year period as well as in the past quarter. Long-short equity funds had the second-highest returns over the three- and five-year periods but were slightly outpaced both this quarter and over the one-year period. Global bonds, as represented by the Barclays Global Aggregate TR USD Index, and U.S. market-neutral funds fared the worst over the one-, three-, and five-year periods, in addition to this past quarter.
Alternative Investment Performance
*Morningstar no longer publishes proprietary hedge fund indexes. Morningstar now uses the Morningstar MSCI series of indexes, including the Morningstar MSCI Composite AW, a currency-hedged asset-weighted index of 1,000 hedge funds, or the applicable category averages.

Morningstar Alternative Investments Observer Spring 2015
29
Morningstar Alternative Mutual Fund Category Averages: Q4 2014 Total Returns %
0–2–4 8642–8 –6
US OE Managed Futures
S&P 500 TR
Barclays US Agg Bond TR USD
US OE Long-Short Equity
US OE Multialternative
US OE Market Neutral
US OE Nontraditional Bond
US OE Multicurrency
US OE Bear Market
–10 –5 0 5 10 15
HF China Long-Short Equity
HF Systematic Futures
S&P 500 TR USD
HF Currency
Barclays US Agg Bond TR USD
HF Global Macro
HF Diversified Arbitrage
HF Multistrategy
HF Asia/Pacific Long-Short Equity
HF Debt Arbitrage
HF Europe Long-Short Equity
HF U.S. Small-Cap Long-Short Equity
HF Emerging Markets Long-Short Equity
HF Merger Arbitrage
HF Equity Market Neutral
HF U.S. Long-Short Equity
HF Bear Market Equity
HF Global Long-Short Equity
HF Event Driven
HF Long-Short Debt
HF Distressed Securities
HF Volatility
HF Convertible Arbitrage
Morningstar Hedge Fund Category Averages: Q4 2014 Total Returns %
Alternative Mutual FundsIn the fourth quarter of 2014, equities managed to display modest gains. Managed futures and the S&P 500 gained 6.17% and 4.93%, respectively. The Barclays U.S. Aggregate Bond TR Index, long-short equity mutual funds, which aim to protect against stock-market downdrafts, and multialternative funds all experienced positive gains of under 2.00%. The average bear-market fund, which aims to obtain profits during weak equity markets, returned negative 7.68% in the fourth quarter. Additionally, multi-currency, non-traditional-bond, and market-neutral funds all experienced losses of less than 3.00%.
Hedge FundsHedge funds saw relatively consistent losses across categories in the fourth quarter of 2014. Only China long-short equity (13.1%) and systematic futures (5.86%) beat the S&P 500, which returned 4.93%. Currency hedge funds also posted positive returns at 1.9%. However, all other hedge fund categories experienced losses in the quarter. The worst-performing categories included convertible arbitrage, volatility, and distressed securities, which decreased by 7.57%, 6.17%, and 4.24%, respectively.
Fourth-Quarter 2014 Performance by Category

Morningstar Alternative Investments Observer Spring 2015
30
Asia/Pacific Long-Short EquityBear Market EquityChina Long-Short EquityEmg Markets Long-Short EquityEurope Long-Short EquityGlobal Long-Short EquityU.S. Long-Short EquityU.S. Small Cap Long-Short EquityU.S. OE Long-Short Equity
3-Year Risk Return % by Category or Strategy
Convertible ArbitrageDebt ArbitrageDiversified ArbitrageEquity Market NeutralMerger ArbitrageU.S. OE Market Neutral
CurrencyU.S. OE Currency
Distressed SecuritiesEvent Driven
Global MacroSystematic FuturesU.S. OE Managed Futures
Long-Short DebtVolatilityU.S. OE Non-traditional Bond
MultistrategyU.S. OE Multialternative
3-Year Risk %
3-Yr
Ret
urn
%
20
15
10
5
0
–5
–100 642 108 161412
Three-Year Standard Deviation and ReturnOf the 28 alternative mutual fund and hedge fund category averages, 24 displayed positive returns over the three-year period ended Dec. 31, 2014. Hedge funds in the China long-short equity, distressed securities, and long-short equity categories produced the highest three-year total returns of 15.04%, 8.74%, and 7.01%, respectively. Distressed-securities hedge funds also posted the highest risk-adjusted returns, followed by long-short equity, non-traditional-bond mutual funds, and debt-arbitrage and China long-short equity hedge funds. In contrast, the U.S. bear-market mutual fund category displayed the second-lowest risk-adjusted return, displaying a 24.82% annualized loss over the three-year period ended December (off the scale of this chart), while also exhibiting the highest (14.71% annualized) standard deviation. Volatility hedge funds displayed the lowest risk-adjusted returns.
Risk Versus Return: Alternative Mutual Funds and Hedge Funds

Morningstar Alternative Investments Observer Spring 2015
31
Correlations by Alternative Fund Strategy
1.00 to 0.76
0.00 to –0.24
0.75 to 0.51
–0.25 to –0.49
0.50 to 0.26
–0.50 to –0.74
0.25 to 0.00
–0.75 to –1.00
Three-Year Correlations: Alternative Mutual Fund Categories 1 2 3 4 5 6 7
1 US OE Bear Market 1.00
2 US OE Long-Short Equity –0.96 1.00
3 US OE Managed Futures –0.09 0.13 1.00
4 US OE Market Neutral –0.72 0.81 0.21 1.00
5 US OE Multialternative –0.87 0.88 0.33 0.78 1.00
6 US OE Multicurrency –0.72 0.65 –0.13 0.52 0.70 1.00
7 US OE Nontraditional Bond –0.54 0.52 –0.01 0.45 0.75 0.73 1.00
Three-Year Correlations: Hedge Fund Categories 1 2 3 4 5 6 7 8 9 10 11 12 13 14 15 16 17 18 19 20 21
1 HF Asia/Pacific Long-Short Equity 1.00
2 HF Bear-Market Equity –0.23 1.00
3 HF China Long-Short Equity 0.11 –0.33 1.00
4 HF Convertible Arbitrage 0.66 –0.15 –0.11 1.00
5 HF Currency 0.26 –0.26 0.12 0.04 1.00
6 HF Debt Arbitrage 0.77 –0.14 0.00 0.86 0.21 1.00
7 HF Distressed Securities 0.67 –0.18 0.08 0.87 0.05 0.79 1.00
8 HF Diversified Arbitrage 0.70 –0.22 0.16 0.66 0.23 0.78 0.68 1.00
9 HF Emerging-Markets Long-Short Equity 0.79 –0.31 0.28 0.72 0.46 0.80 0.73 0.68 1.00
10 HF Equity Market Neutral 0.76 –0.22 –0.06 0.78 0.21 0.87 0.69 0.82 0.75 1.00
11 HF Europe Long-Short Equity 0.75 –0.27 0.09 0.78 0.17 0.87 0.76 0.73 0.78 0.85 1.00
12 HF Event Driven 0.74 –0.27 0.13 0.87 0.13 0.86 0.88 0.72 0.85 0.81 0.86 1.00
13 HF Global Long-Short Equity 0.82 –0.37 0.09 0.77 0.22 0.88 0.77 0.78 0.83 0.88 0.90 0.91 1.00
14 HF Global Macro 0.70 –0.28 0.13 0.59 0.41 0.76 0.57 0.63 0.70 0.73 0.74 0.69 0.77 1.00
15 HF Long-Short Debt 0.80 –0.15 –0.08 0.87 0.20 0.92 0.81 0.81 0.80 0.90 0.85 0.86 0.86 0.73 1.00
16 HF Merger Arbitrage 0.61 –0.31 0.08 0.72 0.00 0.71 0.72 0.57 0.58 0.66 0.76 0.78 0.74 0.58 0.71 1.00
17 HF Multistrategy 0.78 –0.26 0.07 0.79 0.26 0.92 0.74 0.77 0.86 0.86 0.89 0.91 0.94 0.81 0.91 0.73 1.00
18 HF Systematic Futures 0.37 –0.29 0.15 0.03 0.28 0.20 0.06 0.23 0.23 0.26 0.22 0.15 0.30 0.70 0.24 0.24 0.35 1.00
19 HF U.S. Long-Short Equity 0.73 –0.41 0.08 0.76 0.20 0.84 0.75 0.73 0.80 0.84 0.86 0.90 0.96 0.68 0.79 0.73 0.89 0.17 1.00
20 HF U.S. Small-Cap Long-Short Equity 0.59 –0.38 0.11 0.64 0.08 0.71 0.70 0.60 0.67 0.66 0.76 0.85 0.85 0.54 0.66 0.72 0.80 0.07 0.90 1.00
21 HF Volatility 0.04 –0.09 –0.21 0.34 –0.20 0.04 0.17 0.02 –0.06 0.13 0.05 0.21 0.09 0.13 0.17 0.35 0.14 0.19 0.06 0.07 1.00

Morningstar Alternative Investments Observer Spring 2015
32
Correlation of Mutual Funds to U.S. Stocks and Bonds S&P 500 Correlation (USD) Barclays U.S. Agg Correlation (USD)
3-Year 5-Year 10-Year 3-Year 5-Year 10-Year
US OE Bear Market –0.95 –0.96 –0.95 –0.04 0.20 –0.13
US OE Managed Futures 0.17 0.27 0.28 –0.01
US OE Multicurrency 0.66 0.69 0.45 0.25 0.05 0.05
US OE Multialternative 0.87 0.92 0.92 0.34 –0.07 0.16
US OE Nontraditional Bond 0.55 0.58 0.69 0.40 0.20 0.20
US OE Market Neutral 0.79 0.46 0.17 0.07 –0.05 –0.05
US OE Long-Short Equity 0.96 0.96 0.94 –0.01 –0.25 0.02
Correlation of Hedge Funds to U.S. Stocks and Bonds S&P 500 Correlation (USD) Barclays U.S. Agg Correlation (USD)
3-Year 5-Year 10-Year 3-Year 5-Year 10-Year
HF Asia/Pacific Long-Short Equity 0.68 0.78 0.74 0.13 –0.10 0.15
HF Bear-Market Equity –0.44 –0.53 –0.49 –0.05 0.06 0.06
HF China Long-Short Equity 0.06 0.31 0.25 –0.07 –0.17 –0.03
HF Convertible Arbitrage 0.52 0.68 0.68 –0.08 –0.13 0.19
HF Currency 0.27 0.50 0.36 0.24 –0.01 0.14
HF Debt Arbitrage 0.71 0.77 0.73 0.07 –0.04 0.19
HF Distressed Securities 0.54 0.70 0.74 –0.02 –0.17 –0.04
HF Diversified Arbitrage 0.66 0.57 0.59 0.02 –0.03 0.18
HF Emerging-Markets Long-Short Equity 0.71 0.76 0.71 0.09 –0.10 0.09
HF Equity Market Neutral 0.75 0.82 0.70 0.02 –0.13 0.12
HF Europe Long-Short Equity 0.75 0.84 0.77 –0.07 –0.21 0.08
HF Event Driven 0.67 0.84 0.81 0.03 –0.19 0.05
HF Global Long-Short Equity 0.85 0.90 0.81 0.05 –0.16 0.08
HF Global Macro 0.64 0.69 0.52 0.19 0.02 0.16
HF Long-Short Debt 0.67 0.73 0.73 0.15 0.02 0.26
HF Merger Arbitrage 0.58 0.76 0.75 0.06 –0.06 0.21
HF Multistrategy 0.77 0.84 0.73 0.16 –0.06 0.14
HF Systematic Futures 0.32 0.44 0.17 0.38 0.13 0.09
HF U.S. Long-Short Equity 0.86 0.92 0.88 –0.03 –0.26 –0.02
HF U.S. Small-Cap Long-Short Equity 0.68 0.83 0.84 –0.03 –0.24 –0.02
HF Volatility –0.16 –0.08 0.15 0.26 0.28 0.38
Morningstar MSCI Composite AW 0.72 0.78 0.69 0.36 –0.01 0.06
Correlations of Alternative Funds to Traditional Asset Classes

Morningstar Alternative Investments Observer Spring 2015
33
Fund Additions Added Removed
Dec-14Nov-14Oct-14Sep-14Aug-14Jul-14Jun-14May-14Apr-14Mar-14Feb-14Jan-14Dec-13Nov-13Oct-13
Month-End Database Fund Levels
5300
5400
5500
5600
5700
5800
5900
Dec-14Nov-14Oct-14Sep-14Aug-14Jul-14Jun-14May-14Apr-14Mar-14Feb-14Jan-14Dec-13Nov-13Oct-135300
5400
5500
5600
5700
5800
5900
Net Fund Additions by MonthIn the fourth quarter of 2014, Morningstar’s hedge fund database experienced a net removal of 171 funds. During the quarter, the database saw 274 additions and 445 fund with-drawals. Funds drop out because they have liquidated or because they cease sharing perfor-mance data, typically because of poor perfor-mance. Fund additions occur as a result of new fund launches or a recent decision to supply data to Morningstar.
Month-End Database Fund Levels As of Dec. 31, 2014 the Morningstar hedge fund database contained 5,306 funds that actively report performance and assets-under-management data. This figure contains about 3,491 single-manager hedge funds, 1,409 funds of hedge funds, and 406 CTAs and managed futures. As of quarter-end, the number of funds in the database had dropped approximately 5.13% from June 2014 levels.
Morningstar Hedge Fund Database Overview as of 12-31-2014

Morningstar Alternative Investments Observer Spring 2015
34
Morningstar Hedge Fund Database by Region Region # Funds
N. America/Caribbean 3,059 Africa 51 Asia/Australia 447 Europe 1,748 South America 1 Other 0
Total 5,306
North America and Surrounding 3,059Cayman Islands 1,248 United States 1,083 British Virgin Islands 275 Canada 218 Bermuda 185
Curaçao 40 Bahamas 8 Barbados 1St Kitts and Nevis 1 Africa 51South Africa 23 Mauritius 23 United Arab Emirates 2Seychelles 2 Swaziland 1 Asia and Australia 447China 424 Australia 12 Hong Kong 3Israel 3 Japan 2
Christmas Island 1Marshall Islands 1Vanuatu 1
Europe 1,748Luxembourg 843 Ireland 238 Switzerland 164 France 104Guernsey 99
Italy 51Liechtenstein 48 Spain 46 Jersey 31 United Kingdom 27
Netherlands 25Malta 20 Gibraltar 12 Germany 8 Sweden 8
Isle of Man 5 Macedonia 4Norway 4Channel Islands 3 Finland 3
Portugal 2Austria 1Belgium 1
Denmark 1
South America 1Chile 1
Other
South america
Europe
Asia/Australia
Africa
North America/Carribbean
Hedge Funds by RegionApproximately 57.65% of hedge funds in the Morningstar database are legally domiciled in the North American/Caribbean region, primarily in the Cayman Islands and United States. A large percentage of U.K. hedge funds are also domiciled in the Cayman Islands for tax and regulatory purposes. Roughly 32.94% of funds in Morningstar’s database are domiciled in Europe, including both European Union and non-EU jurisdictions, and 8.42% of funds are domiciled in Asia and Australia, primarily in China. All figures are as of Dec. 31, 2014.
Hedge Funds by LocationApproximately 81% of the hedge funds in Morningstar’s database are domiciled in the United States, the Cayman Islands, China, Canada, the British Virgin Islands, Bermuda, and Luxembourg. Switzerland, France, and Ireland continue to domicile a large portion of European hedge funds as well, trailing Luxembourg.
Morningstar Hedge Fund Database Overview as of 12-31-2014

Morningstar Alternative Investments Observer Spring 2015
35
Type Rank Service Provider % of Database
Prime Broker 1 Goldman Sachs 6.89 2 Morgan Stanley 6.60 3 UBS 4.29 4 J.P. Morgan 4.11 5 Credit Suisse AG 4.08 6 Newedge Group 2.60 7 Deustche Bank 2.31 8 Interactive Brokers 1.98 9 Jefferies 1.69 10 Bank of America 1.26
Legal Counsel 1 Elvinger, Hoss & Prussen 6.80 2 Maples & Calder 5.24 3 Walkers 4.79 4 Seward & Kissel 4.28 5 Dechert 3.38 6 Sidley Austin 3.26 7 Schulte Roth & Zabel 2.49 8 Arendt & Medernach 2.39 9 Conyers Dill & Pearman 2.01 10 Shearman & Sterling 1.76
Auditor 1 PricewaterhouseCoopers 23.55 2 KPMG 22.16 3 Ernst & Young 17.59 4 Deloitte 15.48 5 Rothstein Kass 4.26 6 McGladrey 2.21 7 BDO 1.41 8 Grant Thornton 1.74 9 Eisner Amper 1.18 10 Arthur Bell 0.29
Administrator 1 Credit Suisse 7.01 2 Citco 6.09 3 BNY 4.37 4 State Street 3.96 5 Citi 3.12 6 UBS 2.74 7 Fund Partner Solutions 2.63 8 RBC 2.27 9 HSBC 2.05 10 Northern Trust 2.02
Service ProvidersGoldman Sachs, Morgan Stanley, and UBS are the largest prime brokerage-service providers to hedge funds in Morningstar’s database, serving a 17% share combined. The big four accounting firms are employed by approximately 78% of the hedge funds listed in Morningstar’s data-base, with PricewaterhouseCoopers leading the pack. Credit Suisse provides administration services to more than 7% of funds in Morning-star’s database, in comparison with the next-largest administrator, Citco, which services 6.09% of funds in the database. Elvinger, Hoss & Prussen, Maples & Calder, and Walkers are the three largest legal-counsel-service providers to hedge funds in the database, with a combined 16% market share. This data is as of December 2014.
Morningstar Hedge Fund Database Overview as of 12-31-2014

Editor Josh Charlson
Contributors Josh Charney; A.J. D’Asaro; Jason Kephart; Samuel Lee; Craig Stanford
Copy Editor Edward Cavanaugh
Design John Erdodi; April Hoover
Data Collection Elizabeth Weilburg
Publisher/Director of Global Manager Research Jeff Ptak
Director of Manager Research, North America Jon Hale
President of Research Haywood Kelly
©2015 Morningstar. All Rights Reserved. The information contained in theAlternative Investments Observer (“Report”): (1) is proprietary to Morningstar, Inc., and its affiliates (collectively, “Morningstar”) and/or their content providers; (2) may not be copied or distributed by any means; and (3) is not warranted to be accurate, complete, or timely. For certain types of investment vehicles (e.g., hedge funds) Morningstar depends on the investment vehicle itself to provide Morningstar with accurate and complete data. To the extent that one or more of these investment vehicles do not provide Morningstar with data or these data are deficient in any way, the data and statistics provided by Morningstar may be compromised. In addition, because the data contained in Morningstar’s database are primarily backward looking (i.e., they’re comprised of historical performance statistics), neither the data nor Morningstar’s analysis of them can be relied upon to predict or assess future performance—whether of an individual investment (each, a “Fund”), any particular Fund industry segment or the totality of all Funds in the industry. Unless otherwise specified, the data set out in this Report represent summary data for those reporting Funds comprising the applicable industry segment or the industry as a whole (to the extent included in Morningstar’s database). Please note that, as a general matter, any return or related statistics that are based upon a limited number of data points are considered statistically suspect and, therefore, may be of limited value. By making the Report available, Morningstar is not providing investment advice or acting as an investment advisor to anyone in any jurisdiction. All data, information and opinions are subject to change without notice and certain of these opinions may not be consistent across Morningstar. Neither Morningstar nor its content providers are responsible for any damages or losses arising from any use of the content of this Report or any information contained in or derived from it. “Morningstar” and the Morningstar logo are registered marks of Morningstar, Inc. All other marks are the property of their respective owners.
For inquiries contact: [email protected] or [email protected]