alternative investments observer - morningstaradvisor.morningstar.com/uploaded/pdf/aio_june...
TRANSCRIPT

Morningstar digs deep into the substrategies and performance of the multialternative category.
Multialternative Fund Landscape Report
1 IntroductionI. Overview Key Takeaways History and Growth of the
Multialternative CategoryII. Breaking Down the Multialternative
CategoryIII. Performance Characteristics and
Benchmarking ConsiderationsIV. Morningstar's Approach to
Multialternative FundsV. Conclusion
Fund Profiles 22 Abbey Capital Futures Strategy25 AC Alternatives Income28 Cedar Ridge Unconstrained Credit31 Dreyfus Dynamic Total Return
34 Quarterly Data Review: Q4 2015
44 Hedge Fund Database Overview
Alternative InvestmentsJune 2016Observer
IntroductionThe U.S. multialternative Morningstar Category has been the fastest-growing alternative category during the past few years. In 2015, multialternative funds saw $17.6 billion in net new investor dollars.
With growth come challenges to fund evaluation and selection. The multialternative category is heterogeneous and performance is widely dispersed. Most funds have relatively short track records, while performance of longer-tenured funds has been largely disappointing. Some funds invest in hedge funds through managed accounts, a structure that decreases transparency into the sources of underlying performance. Moreover, multialternative funds can be difficult to benchmark given the wide range of strategies and the fact that many managers pursue absolute return objectives, and most are pricey.
For all of these reasons, we recommend relatively few of the multialternative funds we cover, reflecting our belief that most won’t outperform peers or a relevant benchmark over a full market cycle.
Nonetheless, it’s clear that multialternative funds remain an area of interest to investors and the advisors who represent them. Given that, this report aims to familiarize investors with multialternative funds as follows:
Chart the growth in the category and the reasons behind it. (See "History and Growth of the Category,” Page 3)
Identify the main substrategies available and their role for investors. (See "Breaking Down the Multialternative Category,” Page 6)
3
3

3
3
3
Morningstar Alternative Investments Observer June 2016Page 2 of 49
Describe the general performance characteristics of funds in the category. (See "Performance Characteristics and Benchmarking Considerations,” Page 8)
Suggest potential benchmarking approaches for multialternative funds. (See "Benchmarking Multialternatives," Page 11)
Detail the qualities that our analysts look for in a multialternative Morningstar Medalist and the factors that investors should consider when investing in a multialternative fund. (See "Morningstar's Approach to Multialternative Funds,” Page 14)
Discuss Morningstar's top picks across the major multialternative substrategies. (See "Our Top Picks,” Page 17)
3
3
3
3
EditorJosh Charlson
ContributorLinda Abu Mushrefova
Copy EditorEdward Cavanaugh
Data CollectionLinda Abu Mushrefova
Publisher/Director of Global Manager ResearchJeffrey Ptak
Director of Manager Research, North AmericaLaura Lutton
President of ResearchHaywood Kelly
AlternativeInvestmentsObserver

3
3
3
Morningstar Alternative Investments Observer June 2016Page 3 of 49
I. Overview
Key TakeawaysThere are now more than 150 distinct multialternative strategies, but few have long track records. What’s more, performance can vary quite a bit depending on the type of strategy and the manager’s execution. Accordingly, discerning manager selection is paramount. We recommend managers with significant demonstrated experience running the strategy (or a very similar version of it), ideally in a mutual fund format.
Buyer-beware is an appropriate mindset to apply to multialternative funds, most of which have been dogged by lackluster returns. Though some of the performance issues owe to macro and stylistic headwinds, many funds have been plagued by high fees and poor execution. Rather than seek home-run hitters, we recommend investors focus on funds that offer diversification and risk-reduction potential.
To successfully choose a multialternative strategy, it’s important to distinguish between the various types of approaches common in the category—multistrategy, global macro, and hedge fund replication.
Industry benchmarking of multialternatives has been inconsistent and confusing. We recommend using multiple benchmarks, including the category, substrategy peer groups, and custom or blended benchmarks.
We recommend that investors seek out the lowest-cost funds within a given substrategy that also meet other selection criteria. In most cases, we would not pay more than about 2.00% for a multistrategy fund, 1.50% for a global-macro fund, or 1.50% for a hedge fund replication strategy.
History and Growth of the Multialternative CategoryMorningstar defines a multialternative fund as one that encompasses multiple underlying alternative strategies. At least 50% of the portfolio should consist of those alternative strategies, and in general, the fund should exhibit other characteristics that investors expect from alternatives funds, such as fairly consistent gross short exposure of 20% or more and/or low beta and less correlation to traditional asset classes.
Morningstar established the multialternative category in 2011, recognizing the growth of multiasset alternative funds taking place at that time. Since then, the category has only expanded further, as detailed in Exhibit 1.
3
3
3
3
3

3
3
3
Morningstar Alternative Investments Observer June 2016Page 4 of 49
Exhibit 1 Multialternative Category Growth, 2007-15
10
20
30
40
50
60
20
40
60
80
100
120
140
160
180
201520142013201220112010200920082007
Number of Distinct FundsTotal Net Assets
Source: Morningstar.
Exhibit 2 Alternative Category Growth: 2015
Morningstar Category Total Net Assets (USD Bil) Estimated Net Flow (USD Mil) Organic Growth Rate (%) New Fund Count
Bear Market 3.2 –1,113 –24.51 0Long-Short Equity 47.6 –5,774 –10.44 33Managed Futures 23.7 8,764 56.83 4Market Neutral 23.6 –5,931 –19.69 10Multialternative 55.4 17,614 44.37 30Multicurrency 6.3 –2,164 –23.55 0Nontraditional Bond 134.5 –15,747 –10.18 18
Source: Morningstar.
Two main factors have been driving the category's growth—demand and supply. Investors have sought multialternative funds to gain easy access to a diversified set of alternative strategies in one fell swoop. Moreover, many investors have been attracted by the opportunity to get access to true hedge funds through multialternative funds.
Hedge funds have also sought to cash in on interest at the same time as intensified competition in the traditional hedge fund industry has made capital-raising more challenging. Some hedge fund firms (Goldman Sachs, J.P. Morgan, and so on) have even tapped existing capabilities and strategies, repackaging them as multialternative funds, while in other cases, traditional fund firms have acquired outside hedge fund talent (Franklin Templeton's acquisition of K2 Advisors, for example).

Morningstar Alternative Investments Observer June 2016Page 5 of 49
Exhibit 3 The 20 Largest Multialternative Funds
Name Ticker Net Assets (USD in Millions) Inception Date Morningstar Rating Overall
JHancock Global Absolute Ret Strats I JHAIX 9,233.3 12/16/11 QQQQBlackstone Alternative Multi-Strategy I BXMIX 4,278.4 6/16/14 —AQR Multi-Strategy Alternative I ASAIX 3,481.7 7/18/11 QQQQQNatixis ASG Global Alternatives A GAFAX 3,190.1 9/30/08 QQPrincipal Global Multi-Strategy A PMSAX 3,088.6 10/24/11 QQQ
AQR Style Premia Alternative I QSPIX 3,073.1 10/30/13 —GMO SGM Major Markets III GSMFX 2,687.2 10/3/11 QQQQWilliam Blair Macro Allocation I WMCIX 1,725.2 11/29/11 QQQQGoldman Sachs Multi-Manager Alts A GMAMX 1,410.7 4/30/13 —Dreyfus Dynamic Total Return A AVGAX 1,397.6 5/2/06 QQQQQ
Litman Gregory Masters Alt Strats Instl MASFX 1,367.6 9/30/11 QQQQPutnam Absolute Return 700 A PDMAX 1,348.5 12/23/08 QQQOppenheimer Fundamental Alternatives A QVOPX 1,241.2 1/3/89 QQQQFranklin K2 Alternative Strategies A FAAAX 1,216.1 10/11/13 —Putnam Absolute Return 500 A PJMDX 1,168.0 12/23/08 QQ
GMO Special Opportunities VI GSOFX 1,136.0 7/28/14 —Goldman Sachs Absolute Ret Trckr A GARTX 1,002.9 5/30/08 QQNeuberger Berman Abs Ret Multi-Mgr A NABAX 997.6 5/15/12 QQAbsolute Strategies I ASFIX 946.3 7/27/05 QQQQJHancock Alternative Asset Allc A JAAAX 890.4 12/31/08 QQ
Source: Morningstar. Data as of 3/31/16.

3
3
3
Morningstar Alternative Investments Observer June 2016Page 6 of 49
II. Breaking Down the Multialternative Category
Investors will have greater success choosing a multialternative strategy if they understand the types of funds that are available—multistrategy, global macro, and hedge fund replication. Identifying those substrategies isn't as straightforward as combing through prospectus language or making a classification based on holdings. Instead, it involves qualitatively assessing each fund. This paper's Appendix details how funds in the multialternative category break down by substrategy.
Multistrategy and hedge fund replication provide the broadest exposure via a range of underlying hedge fund strategies or factors to which they allocate assets; they can serve as core investments in an alternative-allocation sleeve. Global-macro funds are also diversified, but tend to be far more dynamic, at times making big bets in certain areas.
MultistrategyThe multistrategy approach is by far the most common in the category, representing about two thirds of funds. Multistrategy funds allocate to distinct alternative strategy sleeves, using a variety of techniques and structures. Although portfolio managers may alter their allocations to the sleeves over time, the allocations are generally fairly static or strategic in nature. Within the multistrategy bucket, there are several distinct subtypes. These distinctions are helpful for understanding structural differences between multistrategy funds that in turn can have an impact on performance drivers, management and team design, and fees. When it comes to establishing a peer group for performance comparisons, however, we recommend using the broader multistrategy group, as all of these funds ultimately have similar goals. Below are brief descriptions of each subtype and a table summarizing the pros and cons of each.
Multistrategy—Fund of Hedge Fund ManagersThese funds have taken advantage of the increasing numbers of hedge fund managers willing to offer versions of their strategies to mutual funds for a straight management fee, with no performance fee. We count roughly 40 funds that follow this approach. Typically, the mutual funds are structured through managed accounts, where the hedge fund managers' trades are disclosed to the advisor each day. ➢Multistrategy—Fund of Mutual FundsThere are also around 40 multistrategy funds that employ a traditional fund-of-funds structure. In these vehicles, the managers allocate to other 1940-Act Mutual funds to achieve the overall objectives of the fund. These funds do often incorporate an additional layer of fees, but on balance their all-in fees have been lower than those using hedge fund managers in separate accounts.

3
3
3
Morningstar Alternative Investments Observer June 2016Page 7 of 49
Multistrategy—Single ManagerSingle-manager multistrategy funds rely on the internal expertise of the asset manager to allocate across teams or strategy types within the firm. There are significantly fewer funds pursuing this approach (around 15), as few firms possess the breadth of expertise across multiple alternative strategies required to successfully execute it.
Exhibit 4 Summary of Pros and Cons of Multistrategy Subtypes
Substrategy Pros Cons
Fund of Hedge Fund Managers 3 Access to hedge fund managers3 Access to distinctive strategies
3 Highest fees of multistrategy groups3 Lack of transparency into attribution by
underlying subadvisors
Fund of Mutual Funds 3 Access to mix of hedge fund and mutual fund managers
3 Lower relative fees3 Better visibility into underlying manager
performance
3 Narrower set of hedge fund managers to access
3 Tend to contain more long-only managers
Single Manager 3 Lower relative fees3 Streamlined and highly coordinated
investment process
3 Few firms have sufficient internal resources
Source: Morningstar.
Global MacroGlobal-macro managers have the flexibility to invest long and short across global asset classes and markets. The managers base allocation decisions on a mix of macroeconomic factors (such as interest rates) and more-fundamental rationales (such as market valuations in one region versus another). Global-macro funds typically use liquid derivative instruments (such as futures and forward contracts) to implement their ideas. Currency trades are a typical component of global-macro strategies, and many rely extensively on pair trades (when long and short ideas on a set of securities within, say, a certain sector are matched). Global-macro strategies are tactically flexible, which allows them to attempt to respond to global trends and dislocations. Global-macro funds tend to be cheaper than the multialternative category norm, but they’re riskier given their propensity to make big bets and aren’t necessarily dependable diversifiers given sometimes-large exposures to stocks and bonds depending on conditions.
Hedge Fund ReplicationHedge fund replicators attempt to mimic the broader hedge fund market by building a portfolio that’s exposed to certain factors identified through sophisticated regression techniques. There is academic support for the efficacy of mimicking hedge fund factors, but the results have been fairly disappointing, in part because of the generally weak performance in recent years of the hedge fund indexes that such funds track. Additionally, some hedge fund strategies (such as merger arbitrage, event-driven, and statistical arbitrage) are difficult to replicate using a factor-based approach. That said, hedge fund replication mutual funds are among the cheapest multialternative strategies available.

3
3
3
Morningstar Alternative Investments Observer June 2016Page 8 of 49
III. Performance Characteristics and Benchmarking Considerations
There has been a wide gap between the stated objective of the typical multialternative fund and real-world returns. Many funds in the category have absolute return objectives (Libor plus 4% to 5% annually is a common goal) or aim to generate returns similar to a traditional 60/40 balanced portfolio with lower volatility and reduced correlations to traditional asset classes. These are indeed worthy objectives for a multiasset alternative portfolio; however, the average multialternative fund has fallen far short.
As noted in Exhibit 5, the multialternative category’s average annualized return during the past three years through January 2016 was a marginally positive 0.69%. That's better than the multicurrency and non-traditional-bond categories during the same period but trails the average market-neutral fund, which had a beta to the S&P 500 of close to zero while the multialternative category's was 0.28.
It's not surprising that the category would trail the S&P 500 (11.3%) by a significant margin, but given the category's beta relative to the index, the lag is greater than expected. Moreover, the multialternative category still slightly trails the conservative-allocation category and badly lags a blended 60/40 MSCI World/Barclays U.S. Aggregate Bond benchmark, albeit with lower volatility than either. Risk-adjusted returns are in general mixed, however. While a three-year beta of 0.28 and down-capture ratio of 42% to the S&P 500 show relatively robust diversification attributes, a Sharpe ratio of 0.07 indicates that the overall risk/reward trade-off has been limited.
Exhibit 5 Alternative Category 3-Year Performance Statistics
Category3-Yr Total
Return (%)3-Yr
Correlation 3-yr
Beta 3-Yr
Std Dev 3-Year
Sharpe Ratio Max
Drawdown (%) Down-Capture
Ratio (%)
Bear Market –17.46 –0.97 –1.45 16.40 –1.05 –47.78 –146.31Long-Short Equity 3.15 0.96 0.50 5.69 0.67 –7.43 61.04Managed Futures 2.89 0.05 0.03 6.30 0.63 –7.19 –1.20Market Neutral 1.21 0.73 0.09 1.32 0.64 –1.06 7.85Multialternative 0.69 0.88 0.28 3.51 0.07 –6.18 41.82Multicurrency –3.20 0.44 0.12 2.99 –0.77 –7.67 23.18Nontraditional Bond –0.32 0.69 0.13 2.06 –0.34 –3.94 23.67
BenchmarksBarclays US Agg Bond 2.15 –0.05 –0.01 2.96 0.68 –3.67 –4.85S&P 500 11.30 1.00 1.00 10.94 1.18 –8.36 100.00MSCI World 3.59 0.96 0.99 11.31 0.60 –12.20 122.83Conservative–Allocation Category 1.87 0.88 0.39 4.87 0.55 –6.16 52.6960/40 Blended Benchmark 4.73 0.93 0.59 6.94 1.00 –6.27 67.44
Source: Morningstar. *Data through 1/31/16. Correlation and beta are to the S&P 500.

3
3
3
Morningstar Alternative Investments Observer June 2016Page 9 of 49
There are some caveats. For one thing, the three-year data includes only 68 distinct funds, not even half of the funds currently in the category. For the five-year period, there are only 38 funds. Therefore, the historical returns may not adequately capture the forward-looking potential of the category, and in some cases, outliers may skew the averages. Moreover, there is significant dispersion within the category, as shown in Exhibit 6.
Exhibit 6 Multialternative Return Dispersion
2 4 6 8 10 12
-2
0
2
4
6
8
10
Total Return Annualized 3-Year (Month-End) %
3-Year Standard Deviation
Source: Morningstar. Data through 1/31/16.
Although it is difficult to generalize, there are at least a few factors contributing to this underperformance. At the macro level, for several years after the global financial crisis, the coordinated quantitative easing efforts of central banks led to lower volatility and higher correlations in asset classes, a hindrance for many multialternative strategies that thrive on dispersion between asset classes and dislocations in the markets. This pattern is observable in Exhibit 7, which looks at average monthly returns for two hedge fund indexes (Credit Suisse Global Macro Hedge Fund and Credit Suisse Multi-Strategy Hedge Fund) and the multialternative Morningstar Category relative to the MSCI World Index during different periods of volatility during the 10-year period from 2006 through 2015. Volatility was determined based on the monthly close of VIX, with medium-high and medium-low periods defined as those with prices within 30% of the period average of around 20. (Note that VIX prices are not evenly distributed during the period; there is a pronounced left-hand [lower-volatility] skew.) The table shows that the two indexes and the multialternative category outperform global equities in the medium-high and high-volatility regimes (with the largest deviation in the high-volatility period), while lagging the MSCI World in the medium-low and low-volatility periods. And since the heightened volatility around the euro crisis in mid-2011, VIX has trended lower, largely ranging between a level of 10 and 20 over the succeeding four years.

3
3
3
Morningstar Alternative Investments Observer June 2016Page 10 of 49
Exhibit 7 Monthly Excess Returns of Multialternative Strategies During Different Volatility Regimes
Average Monthly Excess Return %Relative to MSCI World
CS Global Macro
-1
0
1
2
3
4
Low Medium-lowMedium-highHigh
CS Multi-Strat Multialternative
Source: Morningstar. Data from 1/1/06 through 12/31/15.
Multistrategy funds have been further hampered by some of their allocation decisions, in particular their weightings to global equity and event-driven. Several funds in the category, for example, were overweight event-driven strategies relative to their neutral positions. The funds from Neuberger Berman, J.P. Morgan, Goldman Sachs, and Arden all had sizable exposures to event-driven strategies in 2014 and 2015. JPMorgan Multi-Manager Alternatives JMMAX had nearly a 30% allocation to event-driven strategies in mid-2015, for example. As noted in Exhibit 8, event-driven hedge fund indexes have endured a rough spell since 2014, when several big deals broke, while in 2015 many crowded trades in biotech and energy have gone south.
In addition to ill-advised strategy tilts, some funds also suffered from poor manager selection. Arden Alternative Strategies, for example, had an allocation to Whitebox Advisors, whose market-neutral strategy foundered in 2015. Similarly, BlackRock Multi-Manager Alternative Strategies BMMAX was stung by poor performance from one of its subadvisors, Loeb King Capital Management.
All the above factors, and more, have contributed to a general malaise in hedge fund returns, as reflected in the HFRX Global Hedge Fund Index’s three-year return of 1.89% through February 2016.

3
3
3
Morningstar Alternative Investments Observer June 2016Page 11 of 49
Exhibit 8 Recent Hedge Fund Strategy Index Total Returns
Name YTD (%) 1-Year (%) Annualized 2-Year (%)
Credit Suisse Equity Market Neutral –0.36 3.88 0.18Credit Suisse Event Driven –4.52 –11.92 –6.02Credit Suisse Fixed Income Arbitrage –1.22 –0.49 0.79Credit Suisse Long/Short Equity –3.85 –2.23 1.71Credit Suisse Global Macro –2.23 –6.25 0.80Credit Suisse Managed Futures 4.35 –3.67 13.07Credit Suisse Multi-Strategy –0.58 0.24 3.64
Source: Morningstar. Data through 03/31/16.
Ultimately, multialternative funds will need to provide better returns to maintain their value to investors, even with the diversification benefits they provide. That will likely require more-favorable macroeconomic conditions and improved strategy and manager selection by the funds' architects. More so than in many other fund categories, where the dispersion of returns is narrower, adept manager selection is critical when picking a multialternative fund.
Benchmarking MultialternativesAs mentioned earlier, benchmarking multialternative funds can be challenging given the category’s diversity and the absolute return (benchmark-agnostic) approach of many category constituents. Investors won’t get much help from the fund companies themselves, as evidenced by the wide variety of prospectus benchmarks that funds use, as shown in Exhibit 9.
Exhibit 9 Prospectus Benchmarks of Multialternative Funds
0
10
20
30
40
Barclays Global Agg
IQ Hedge Indexes
ST BondBarclays US Agg
MSCI WorldS&P 500Hedge Fund Indexes
Cash
34
27
15
9
4 3 31
Source: Morningstar.
We believe that using a combination of benchmarks is the best approach, as no single benchmark is typically effective in capturing the performance of a multialternative fund. Some commonly used

3
3
3
Morningstar Alternative Investments Observer June 2016Page 12 of 49
benchmarks are of little value, while others may be of moderate value depending on the particular structure and objective of a given fund (we review some pros and cons of typical benchmarks in Exhibit 10). Triangulating between several benchmarks is the most effective method, in our view, because it allows the analyst to consider performance through several lenses and make a holistic judgement about overall performance.
Exhibit 10 Pros and Cons of Common Multialternative Benchmarks
Benchmark Relevance Comments
Cash Limited Sets too low a bar. May be relevant for near market-neutral strategies, but those are rare in the multialternative category.
Equity Indexes Limited A mismatch considering the average beta in the multialternative category is around 30% that of the equity markets.
Hedge Fund Indexes Limited Beset by the known biases of hedge fund indexes, and mutual funds have different constraints than hedge funds. Some relevance for funds that specifically aim to produce hedge-fund-like returns, especially hedge fund replicators.
Category Moderate A Morningstar-defined peer group; broadly similar objectives across the category, but there can be meaningful differences by substrategy.
Substrategy Peer Group Moderate A more narrowly defined peer group, but not readily accessible for all investors.
Wilshire Liquid Alternative Indexes
Moderate Recently established indexes focused on liquid alternative funds. Historical returns beyond five years are unreliable because of small sample sizes.
Cash + Return Target Moderate Relevant for funds that have an absolute return mandate. It can take some digging to find actual return targets, however, for those that have them.
Allocation/Blended Moderate Can be useful because many multialternative funds espouse risk/return objectives similar to balanced funds but with greater diversification potential.
Source: Morningstar.
To give a specific example of how multiple benchmarking might work, take John Hancock Global Absolute Return Strategies JHAIX, a global-macro fund with an absolute return mandate. The fund does not explicitly state its return target in its prospectus or marketing materials, but in its institutional materials it discloses a return target of Libor plus 5% over a full market cycle. Thus, there are at least three relevant benchmarks/peer groups one might use: the multialternative category, the global-macro substrategy peer group, and the fund's cash plus 5% target. (For a list of the funds that we include in the global-macro peer group, please see the Appendix. Eventually we intend to include this subgroup and others within the Morningstar database.) Finally, for this example, we include a blended benchmark consisting of 60% MSCI World/40% Barclays U.S. Aggregate Bond, as many investors look to alternatives as a substitute for the traditional balanced portfolio.
As shown in Exhibit 11, all of these benchmarks but one put the fund in a favorable light, though to different degrees, using the period from the fund's first full month in operation through the end of December 2015. The fund handily outperforms the multialternative category as a whole, while more narrowly surpassing the global-macro subset. Finally, while the fund has fallen short of its absolute return target during the period, it has done so by only a small amount, and given the low volatility

3
3
3
Morningstar Alternative Investments Observer June 2016Page 13 of 49
and beta the fund has taken on during that period, we don’t think it should be penalized much. (Moreover, the fund has hit the 5% target over most rolling three-year periods.) The fund looks less successful next to the 60/40 benchmark, which it has trailed by about 2.4% annually. However, given that most of the balanced portfolio's risk comes from equities (to which it has a 0.93 correlation) while the John Hancock fund has only a 0.57 correlation, the deviation is less of a concern.
Thus, on balance all of the benchmark comparisons suggest that the fund has been a strong performer. This is something of a simplified example, of course, as the analyst would be assessing returns over varied and rolling periods and also integrating risk metrics. But in a case like this where a single market benchmark does not easily apply, an investor or analyst can build conviction (or raise doubt) by layering the signals of multiple benchmarks.
Exhibit 11 Benchmark Comparisons of John Hancock Global Absolute Return Strategies
BenchmarkAnnualized Total Return (%)
1/1/12 – 12/31/15
JHancock Global Absolute Ret Strats I 4.59Morningstar Multialternative Category 1.38Global Macro Subset 4.03Wilshire Liquid Alternatives Global Macro Index 0.88BofAML USD LIBID 1 Mon Average TR USD 0.10
Source: Morningstar.

3
3
3
Morningstar Alternative Investments Observer June 2016Page 14 of 49
IV. Morningstar's Approach to Multialternative Funds
Morningstar analysts assess funds based on five pillars that we believe predict the likelihood of future success: People, Process, Parent, Performance, and Price.
People PillarFor multistrategy funds, we look for management teams that, ideally, possess both significant asset-allocation experience and manager-selection expertise; if the fund allocates to hedge fund managers, we prefer to see a background in hedge fund due diligence. However, teams with more-traditional mutual fund multiasset experience can make up the gap by hiring people with hedge fund backgrounds into their teams or on a consultant basis. For global-macro strategies, a successful history of running similar strategies in either a private fund or public fund is critical; it is difficult to have high confidence in managers who do not have live histories executing such dynamic and multifaceted strategies. For all multialternative managers, stability of the management team and appropriate supporting staff are critical factors that we consider. A strategy that involves oversight of many underlying managers or multiple complex trades typically requires more than just a few analysts, for example. For multimanager strategies that use hedge funds, gaining insight to the people running the underlying strategies is important but often challenging. We encourage funds to provide as much detail as possible on the experience and track records of the underlying managers.
An example of a management team that earns a Positive rating for People is John Hancock Alternative Asset Allocation JAAIX, which features both experience and depth. The team is led by Bob Boyda, the head of John Hancock's portfolio solutions group. He’s a firm veteran who has been running manager-selection and asset-allocation teams at John Hancock for most of his tenure. (Another veteran, Steve Medina, ran the group with Boyda until he took a promotion in early 2016.) Two other comanagers are listed on the fund, and they are supported by 14 research analysts, a three-person derivatives team, and a two-person economic research team. John Hancock was an early adopter of using alternative strategies in its target-date and target-risk funds, so the team is no Johnny-come-lately to alternatives.
By contrast, the Neutral-rated management team at Absolute Strategies ASFIX, while experienced, is essentially a two-person operation of Jay Compson and Nathan Houser. And although the duo is very experienced and the portfolio is generally low-turnover, we have concerns about whether the fund has adequate resources to monitor a 10-12 subadvisor portfolio with an expansive hedge fund universe of potential replacements to consider, especially given the emphasis on less-known managers.
Process PillarWe assess the decision-making process behind a fund's allocation process as well as the rationale to changes made over time. Is there a logic and consistency to those decisions, or are they more ad hoc and reactive? We also look at the depth and thoroughness of an investment team's due-diligence process, and how well the structure of the team lends itself to implementation of the process. With hedge fund replication strategies, we want to understand the depth of the quantitative team's

3
3
3
Morningstar Alternative Investments Observer June 2016Page 15 of 49
research, the extent to which back-testing of models is not simply the result of data-mining, and the degree to which models and research are updated on an ongoing basis. For all multialternative funds, we look at the structure of risk management and oversight, preferring a combination of embedded and independent risk organizations, as well as multiple tools and measurements to identify strategy risks. In understanding the return drivers of a process, we want to gain confidence that there are intrinsic properties that will produce diversifying characteristics in the strategy. Finally, transparency of process is critical. Can and does management effectively communicate the exposures in a portfolio, how and why they have changed, and the attribution of different portfolio components?
Examples of funds boasting Positive Process ratings include Principal Global Multi-Strategy PSMIX and AQR Style Premia Alternative QSPIX. The Principal fund is a multimanager, multistrategy vehicle that’s well-diversified, reflecting management's reluctance to attempt to time hedge fund strategies. Indeed, management has rarely strayed from its target allocations to subadvisors, firing only one after a manager departure. In addition, the fund has been a pretty good diversifier, with low correlations to equities and bonds, thanks in part to its managed-futures and long-short credit allocations.
AQR Style Premia is a multistrategy, single-manager fund that operates a quantitative process. There are two elements of the process in particular that we like. One is the deep research foundation behind the risk premia that the fund targets, much of it conducted by AQR researchers, including firm founder Cliff Asness. While the edge conferred by any given factor may deteriorate over time, we derive confidence from the academic bias of AQR and the firm's ability to use its research to improve on or replace the premia it leverages. Second, the fund has a scrupulous risk-management system in place. The fund is structured to allocate to each asset class equally on a risk basis and to run at a specific volatility target; moreover, a separate risk-management function at AQR oversees the fund (and others in the lineup) and has the power to rein in the fund's risk budget when the market's risk levels are too high. Finally, the fund's approach of matching long and short trades in a market-neutral manner ensures extremely low correlations to stocks or bonds, and the diversification benefits are amplified by the fact that the selected factors have low correlations to one another.
On the other hand, we’re less enamored with the processes employed at Putnam Absolute Return 500 PJMDX and Putnam Absolute Return 700 PDMAX. The processes are highly tactical, and management has wide latitude to shift exposures and asset classes, making it more difficult to determine which aspects of the strategy are contributing most to returns and reducing visibility of future returns. In addition, while the funds' returns have been solid (though short of the stated objectives), much of the return contribution in recent years has come from long trades in equity and credit. While management does maintain a sleeve devoted to nondirectional trades (those that don't depend on the market), the recent reliance on more market-driven exposure raises some concerns.
Parent PillarWe examine the role of alternatives funds in the firm's overall strategy and platform. An important consideration is whether alternatives are part of a well-articulated design that leverages existing competencies at a firm, versus an attempt to latch on to market trends. A firm need not be solely

3
3
3
Morningstar Alternative Investments Observer June 2016Page 16 of 49
dedicated to alternatives to earn a Positive rating (though that is one successful model), but we want to understand how more-traditional asset managers have developed or acquired their alternative capabilities, and how well they are integrated into the overall firm culture. In addition, alternative funds have on average displayed lower manager ownership and higher fees than long-only funds, so firms that exhibit best practices in these areas garner an advantage.
An example of a newer entrant to alternative mutual funds that nevertheless garners a Positive Parent rating is Blackstone. The firm has a history of investing in hedge funds and building fund of hedge fund portfolios dating back to 1990. It has taken a thoughtful approach to building its mutual fund business: The same deep bench of portfolio managers, analysts, and risk personnel who oversee its hedge fund business also run the mutual fund, and the firm has focused on a single product modeled on its flagship hedge fund vehicle. Portfolio manager Stephen Sullens has invested more than $1 million in Blackstone Alternative Multi-Strategy BXMIX, a show of commitment alongside shareholders that's rare in the alternative fund world. Fees are the most glaring negative.
Performance PillarAs noted previously, many multialternative funds are new and, thus, lack long-term track records. For funds to earn a Positive rating for Performance, we generally like to see a long enough history to view performance through multiple market environments, including downturns. In some cases, we may supplement a fund’s public record with a separate track record for a clone or very closely related strategy that preceded it. We emphasize not simply a fund's absolute returns and returns relative to category peers, but also returns relative to substrategies as described earlier in this paper, relevant and self-described benchmarks (particularly in the case of "absolute return" strategies that claim cash-plus goals), and risk-adjusted metrics. Because alternatives should play a differentiated role in investor portfolios, we look for funds that can demonstrate strong downside resilience, low correlations to standard markets, and evidence of manager skill (alpha) beyond market exposure (beta).
The previous discussion of benchmarking in regard to John Hancock Global Absolute Return Strategies on Page 12 provides a good example of how a fund can end up with a Positive Performance rating. We do not currently rate the Performance Pillar of any covered multialternative funds Negative. A fund that receives a Neutral rating is hedge fund replicator Goldman Sachs Absolute Return Tracker GARTX. The fund's three-year annualized return through February 2016 of 1.62% (A shares) is well ahead of its benchmark, the HFRX Global Hedge Fund Index (negative 1.09% for the period). The fund also exceeds the multialternative category average during that period, but it falls in the middle of the three hedge fund replicators with three-year track records. However, longer-term returns since the fund's 2008 inception are middling, and the fund instituted a change to its models in 2013 that seems to have helped performance. Given the relatively short period during which the process change has been in place, the fund's Performance rating remains Neutral as we continue to monitor the efficacy and persistence of the revamped models.

3
3
3
Morningstar Alternative Investments Observer June 2016Page 17 of 49
Price PillarCosts remain high in the multialternative category, relative both to traditional categories and other alternative categories. The biggest culprits are multistrategy funds of hedge fund managers, which are afflicted by the typical 1% management fee paid to underlying subadvisors in addition to other fund operating and administrative fees (see Exhibit 12). Fund companies argue that highly specialized hedge fund managers do not come cheaply, but we believe that few funds can overcome such high fee hurdles, and thus far, most managers have not generated performance sufficient to justify the cost. For that reason, among others, our Morningstar Medalists have tended to be funds with lower-fee structures, such as global-macro and multistrategy single-manager funds that rely primarily on liquid futures to implement their strategies and don't have multiple layers of fees.
Although there are a number of aspects of Putnam Absolute Return 500 and 700 that we have reservations about, Price is not one of them. The funds, which have Morningstar Analyst Ratings of Neutral, have leveraged the efficiencies of a single team, a liquid trading strategy, and scale to create some of the lowest fees in the category. The A shares of Putnam Absolute Return 500 charge a prospectus net expense ratio of 1.13%. Neuberger Berman Absolute Return Multi-Manager
NABAX, on the other hand, bears the burden of the high fees paid to its hedge fund subadvisors, and underpinned by a management fee of 1.70%, the fund charges investors in its A share class an above-average 2.35%.
Exhibit 12 Multialternative Fees
Peer Group Average Net Prospectus Expense Ratio %
Multialternative Category 2.00Multistrategy Subgroup 2.01Global-Macro Subgroup 1.80Hedge Fund Replicator Subgroup 1.30
Source: Morningstar.
Our Top PicksAs noted in Exhibit 13, we cover 18 funds in the multialternative category, nine of which are Morningstar Medalists (all Bronze). Several pairs of funds represent very close versions of the same strategy.
Multistrategy Within the multistrategy subgroup, we recommend two multimanager funds, Litman Gregory Masters Alternative Strategies MASFX and John Hancock Alternative Asset Allocation JAAIX. Both are headed up by teams with extensive experience vetting managers and putting together portfolios across a variety of mutual fund strategies. Litman Gregory uses a fund of hedge fund managers structure, taking a fairly concentrated approach with only five subadvisors, several of whom use more-concentrated or specialized versions of well-known mutual fund strategies, including Steve Romick of FPA and Jeffrey Gundlach of DoubleLine.

3
3
3
Morningstar Alternative Investments Observer June 2016Page 18 of 49
John Hancock Alternative Asset Allocation uses a more diversified fund-of-fund structure, relying heavily on several third-party subadvised John Hancock mutual funds as well as a smattering of other specialized strategies from other providers. John Hancock switched the fund's mandate from more of a long-only allocation fund to one that incorporated diversifying alternative subadvisors in 2010, so it has seen more of the market cycle than most competitors. Both funds' fees are cheaper than the majority of multialternative category peers.
Of single-manager vehicles, we like AQR Style Premia Alternative QSPIX and its lower-volatility sibling QSLIX. This quantitatively run strategy takes well-established investment factors into which AQR has invested a great deal of research (such as momentum and carry) and uses them to invest long and short across four asset classes. Although the strategy is complex and relatively new, we put weight on AQR's long history of running alternative strategies and its rigorous risk management. The two funds target different levels of volatility (10% and 5%), which leads to different fee levels, with the lower-volatility version offering a better fee/volatility ratio. AQR is also sensitive to capacity, which led to these funds being closed to new investors in early 2016.
Global Macro John Hancock Global Absolute Return Strategies JHAIX, subadvised by Scotland-based Standard Life Investments, has become one of the largest alternative mutual funds—$9 billion in AUM in the United States but more than $75 billion across its worldwide vehicles. The flagship strategy has a record going back to 2008, and lead manager Guy Stern has been on the strategy since then, though the team has endured significant turnover. Stern is backed by a deep, 50-person analyst team that develops trade ideas designed to be profitable over a three-year period. A sophisticated risk-management process ensures diversification across trades in the portfolio, and while the fund has not reached its goal of cash plus 500 basis points over the most recent rolling period, in general it has demonstrated strong risk-adjusted and relative returns. Size could become an impediment to alpha, but the liquid markets that the fund trades in give it a greater (though not unlimited) capacity compared with other strategy types. Although global-macro funds are often driven by a couple of big bets and can be unpredictable as a result, John Hancock Global Absolute Return Strategies has several characteristics that increase our confidence that its performance can persist: a deep bench of analysts and researchers; a highly diversified portfolio of multiple trades rather than a concentrated portfolio; and a sophisticated risk-management monitoring program that is embedded in the way the team runs money.
MFS Global Alternative Strategy DVRAX offers an unusual twist on global-macro strategies. The main engine of the fund is the global-macro strategy run by the UBS global solutions team (which runs Neutral-rated UBS Dynamic Alpha BNAAX). This large and experienced team conducts tactical trades (either directional, market-neutral, or currency-pair trades) designed to generate 2%-4% absolute returns. In the case of the MFS fund, however, the global-macro strategy operates as an overlay on a static stock/bond portfolio run by MFS. Morningstar downgraded UBS Dynamic Alpha to Neutral from Bronze earlier in 2016 because of continued turnover within UBS portfolio management, but we consider stock-picking to be a strength at MFS that should continue to add value, and MFS Global Alternative Strategy has held its Bronze rating.

3
3
3
Morningstar Alternative Investments Observer June 2016Page 19 of 49
Hedge Fund Replicators Natixis ASG Global Alternatives GAFAX features at its head one of the leading academic researchers on hedge fund replication, Andrew Lo, who is also a co-founder of AlphaSimplex Group. The quantitative team running the fund seeks to replicate the asset-class exposures (or betas) of the hedge fund industry by regressing the returns from several major hedge fund databases. It constrains positions to achieve an 8% volatility target and employs a proprietary stop-loss system to manage downside risk. AlphaSimplex’s process of continually enhancing its research is a plus (over time the firm has made shifts such as increasing the model's emphasis on tactical shifts made by hedge fund managers and switching its managed-futures index), and fees are cheaper than the average multialternative fund, though on par with other hedge fund replication vehicles. In recent years, the fund has achieved relatively strong correlation with the Morningstar MSCI Asset-Weighted Hedge Fund Index.
Exhibit 13 Multialternative Funds With Morningstar Analyst Ratings
Pillars
Name Ticker Category SubsetMorningstar Analyst Rating People Process Performance Parent Price
AQR Multi-Strategy Alternative I ASAIX Multistrategy–Single Manager ´ ∞ ∞ ∞ ∞ §AQR Style Premia Alternative QSPIX Multistrategy–Single Manager ´ ∞ ∞ ¶ ∞ ¶AQR Style Premia Alternative LV QSLIX Multistrategy–Single Manager ´ ∞ ∞ ¶ ∞ ∞JHancock Alternative Asset Allc JAAAX Multistrategy–FOF ´ ∞ ¶ ¶ ¶ ∞JHancock Global Absolute Ret Strats JHAIX Global Macro ´ ¶ ∞ ∞ ¶ ∞Litman Gregory Masters Alt Strats MASFX Multistrategy–FOHF ´ ∞ ∞ ¶ ∞ ¶MFS Global Alternative Strategy DVRAX Global Macro ´ ¶ ∞ ∞ ∞ ∞Natixis ASG Global Alternatives GAFAX Hedge Fund Replicator ´ ∞ ¶ ∞ ¶ ∞WCM Alternatives Event-Driven WCEIX Miscellaneous (Event-Driven) ´ ∞ ∞ ∞ ∞ §Absolute Strategies I ASFIX Multistrategy–FOHF ˇ ¶ § ¶ ¶ §Blackstone Alternative Multi-Strategy I BXMIX Multistrategy–FOHF ˇ ∞ ∞ ¶ ∞ §Dunham Monthly Distribution DAMDX Miscellaneous (Event-Driven) ˇ ∞ ∞ ∞ § §Goldman Sachs Absolute Ret Trckr GARTX Hedge Fund Replicator ˇ § § ¶ ¶ ∞Neuberger Berman Abs Ret Multi-Mgr NABAX Multistrategy–FOHF ˇ ¶ ∞ ¶ ∞ §Principal Global Multi-Strategy PMSAX Multistrategy–FOF ˇ ¶ ∞ ∞ ¶ ¶Putnam Absolute Return 500 PJMDX Global Macro ˇ ¶ ¶ ¶ ¶ ∞Putnam Absolute Return 700 PDMAX Global Macro ˇ ¶ ¶ ¶ ¶ ∞UBS Dynamic Alpha BNAAX Global Macro ˇ § ¶ ∞ ¶ ∞
Source: Morningstar Direct, Morningstar Analysts. Data as of 1/31/16. ∞Positive ¶Neutral §Negative

Morningstar Alternative Investments Observer June 2016Page 20 of 49
ConclusionThe explosion in multialternative fund offerings has created a wide set of options for investors who wish to allocate to alternatives in funds that offer daily liquidity. Multialternatives can make sense because they give investors access to a diversified set of strategies that would require significant work to assemble on one's own, and sometimes they provide access to strategies difficult to access in a stand-alone format, such as distressed credit and event-driven. However, for investors considering a multialternative fund, there are reasons to hesitate: track records of many funds are slim, expenses tend to be high, performance has been underwhelming, and there is a wide variety of approaches in the category. At the broadest level, we recommend that investors use the following guidelines:
Select a management team that has significant experience executing the strategy, whether in the fund or another vehicle.Focus on funds that provide true diversification associated with alternatives: low correlations and betas to traditional asset classes. In addition, funds should be oriented toward and capable of providing strong downside protection.Understand the specifics of the process and make sure it aligns with your own objectives.Emphasize lower-fee funds relative to the category and subcategory peer groups.Use multiple benchmarks to assess performance.
Morningstar's coverage of multialternative funds will continue to evolve as the category grows. We aim to focus on funds demonstrating the greatest market interest and those we believe offer distinct properties and advantages for investors, while alerting investors to funds that do not present an attractive investment proposition. K
3
3
3
3
3
3
3
3

3
3
3
Morningstar Alternative Investments Observer June 2016Page 21 of 49
Appendix
Exhibit 14 Multialternative Category Subgroup Designations
Multistrategy Ticker Multistrategy Ticker Multistrategy Ticker
Multistrategy— Fund of Hedge Fund Managers
Multistrategy—Fund of Mutual Funds Global Macro
AB Multi-Manager Alternative Strats A ALATX Aberdeen Diversified Alternatives A GASAX 361 Macro Opportunity I AGMZX
Aberdeen Multi-Manager Alt Strats II Ins IARDX Alpha Defensive Alternatives I ACDEX ACR Multi-Strategy Quality Ret (MQR) A MQRAX
Absolute Credit Opportunities Instl AOFOX Alpha Opportunistic Alternatives I ACOPX All Terrain Opportunity A TERAX
Absolute Strategies I ASFIX Aspiration Flagship ASPFX AQR Global Macro I QGMIX
Active Port® Multi-Mgr Alt Strategies A CPASX ASTON/Lake Partners LASSO Alternatives I ALSOX Astor Macro Alternative I GBLMX
AIP Dynamic Alpha Capture A DAFAX Columbia Adaptive Alternatives A CLAAX BlackRock Macro Themes Investor A BTHAX
AIP Dynamic Alternative Strategies A DASAX Cornerstone Advisors Public Alts Instl CAALX Cane Alternative Strategies I CDMIX
Altegris Multi-Strategy Alternative A MULAX Deutsche Alternative Asset Allc C AAAPX Catalyst Macro Strategy A MCXAX
Arden Alternative Strategies I ARDNX Deutsche Select Alternative Allc A SELAX Context Macro Opportunities Instl CMOTX
Aurora Horizons A AHFAX Dreyfus Alternative Diversifier Strats A DRNAX Dreyfus Dynamic Total Return A AVGAX
BlackRock Multi-Manager Alt Strats Inv A BMMAX EAS Crow Point Alternatives A EASAX Dreyfus Global Real Return A DRRAX
Blackstone Alternative Multi-Mgr I BXMMX FundX Flexible Total Return TOTLX Dunham Dynamic Macro N DNAVX
Blackstone Alternative Multi-Strategy I BXMIX Grant Park Multi Alternative Strats A GPAAX GMO Special Opportunities VI GSOFX
BMO Alternative Strategies A BMATX Invesco Alternative Strategies A LQLAX Hartford Real Total Return A HABMX
Franklin K2 Alternative Strategies A FAAAX IQ Hedge Multi-Strategy Plus I IQHIX Invesco Global Targeted Returns A GLTAX
Goldman Sachs Multi-Manager Alts A GMAMX JHancock Alternative Asset Allc A JAAAX JHancock Global Absolute Ret Strats I JHAIX
Granite Harbor Alternative Investor GHAFX New Century Alternative Strategies NCHPX KCM Macro Trends R-1 KCMTX
Granite Harbor Tactical Investor GHTFX Newfound Total Return A NFBAX MFS Global Alternative Strategy A DVRAX
Hatteras Alpha Hedged Strategies ALPHX Pacific Funds Diversified Alts A PLALX Morgan Creek Tactical Allocation I MIGTX
Hatteras Alternative Multi-Manager Instl HHSIX Permal Alternative Core A LPTAX Morgan Stanley Inst Multi-Asst A MMPPX
JPMorgan Multi-Manager Alternatives A JMMAX PIMCO Multi-Strategy Alternative A PXAAX Natixis ASG Global Macro A GMFAX
Litman Gregory Masters Alt Strats Instl MASFX PSI Calendar Effects A FXCAX Nuveen Tactical Market Opportunities I FGTYX
LoCorr Multi-Strategy A LMUAX Quantified Alternative Investment Inv QALTX OnTrack Core Investor OTRFX
Neuberger Berman Abs Ret Multi-Mgr A NABAX Redmont Resolute II I RMRGX Prudential QMA Global Tactical Allc A PTALX
Neuberger Berman Abs Ret Multi-Mgr Instl NABIX SEI Multi Strategy Alternatives A (SIMT) SMSAX Putnam Absolute Return 500 A PJMDX
PACE Alternative Strategies A PASIX Transamerica Multi-Manager Alt Strat A IMUAX Putnam Absolute Return 700 A PDMAX
Palmer Square Absolute Return A PSQAX Victory CEMP Alternative Strategies A CAIAX Spouting Rock/Convex Dynm Glbl Mcr Instl CVXIX
Permal Alternative Select C PASLX Virtus Alternatives Diversifier A PDPAX Stadion Trilogy Alternative Return A STTGX
Principal Global Multi-Strategy A PMSAX UBS Dynamic Alpha A BNAAX
Rothschild Larch Lane Alternatives Instl RLLIX Multistrategy—Single Manager William Blair Macro Allocation I WMCIX
Russell Multi-Strategy Alternative A RMSAX AQR Multi-Strategy Alternative I ASAIX
Virtus Alternative Income Solution A VAIAX AQR Style Premia Alternative I QSPIX Hedge Fund Replicators
Virtus Alternative Inflation Solution A VSAIX AQR Style Premia Alternative LV I QSLIX Credit Suisse Multialternative Strat A CSQAX
Virtus Alternative Total Solution A VATAX Columbia Diversified Absolute Return A CDUAX Exceed Defined Shield Index Instl SHIIX
Vivaldi Orinda Macro Opportunities A OMOAX Dunham Monthly Distribution A DAMDX Goldman Sachs Absolute Ret Trckr A GARTX
Wells Fargo Alternative Strategies A WALTX Guggenheim Multi-Hedge Strategies A RYMQX Natixis ASG Global Alternatives A GAFAXWilliam Blair Directional Mltltntv I WDMIX Infinity Q Diversified Alpha Investor IQDAX SEI Long/Short Alternative A (SIMT) SNAAXWilmington Multi-Manager Alts A WRAAX JPMorgan Systematic Alpha A JSALX
Lazard Master Alternatives Institutional —Oppenheimer Fundamental Alternatives A QVOPX
Oppenheimer Global Multi Strategies A OARAXOppenheimer Global Multi-Alternatives A ODAAXTocqueville Alternative Strategies TALSX

3
3
3
Morningstar Alternative Investments Observer June 2016Page 22 of 49
Fund ProfileAbbey Capital Futures Strategy
By Josh Charlson
AdvisorAbbey Capital Limited
Advisor LocationDublin, Ireland
Assets Under Management$638 million
Inception DateJuly 1, 2014
Investment Type Mutual fund
Morningstar CategoryManaged futures
PurposeThis fund accesses a diversified group of managed-futures strategies through a manager-of-managers approach. Managed-futures strategies generally offer very low correlation to traditional asset classes and thus can be useful diversifiers in a portfolio.
PeopleAbbey Capital is a Dublin-based asset manager with a considerable history of running managed-futures strategies in private CTA structures. The managers here are Anthony Gannon (CEO), who founded the firm in 2000, and Mick Swift (director of research). Prior to joining Abbey Capital in 2002, Swift worked at a Dublin-based CTA and as a foreign-exchange and interest-rate trader. Gannon had previously founded another multimanager CTA, where he worked with Swift. The investment team at Abbey consists of 10 total researchers, with 50-plus total employees at the firm.
ProcessAbbey Capital has always used a multimanager approach and follows that model in its mutual fund. Whereas the fund's flagship hedge fund includes 21 managers, only nine are currently used in the mutual fund. Abbey does not use a total-return performance swap to access the returns of its managers and charges only a straight management fee. Unlike some managed-futures funds that are pure trend-followers, Abbey uses a mix of trend-following (approximately 60%) and non-trend-following (40%) subadvisors.
Management believes that diversifying across strategy types provides the fund with better ballast for periods when trend-following is out of favor. Another difference between the hedge fund and the mutual fund is the level of target volatility. In the mutual fund, Abbey targets 12% annualized standard deviation per manager and around 8%-9% overall volatility for the portfolio; the hedge fund's volatility is considerably higher. Although Abbey does not usually change subadvisors often, it did drop one (because of a manager departure) and add two (Trigon and Conquest) in 2015. The managers do not make tactical-allocation adjustments.
PortfolioThe fund is not a pure trend-following vehicle, as many managed-futures funds are. Instead, the managers split the portfolio between long-term trend-followers (about 60% of the portfolio as of March 31. 2016) and non-trend-followers (about 40% of the portfolio). The latter sleeve is split between short-term systematic, value, global-macro, and countertrend traders. At an asset-class level, the fund had exposure to currencies (30%), bonds (18%), interest rates (11%), equity indexes

3
3
3
Morningstar Alternative Investments Observer June 2016Page 23 of 49
(18%), metals (7%), energy (9%), and agriculture (7%). Those exposures are traded across more than 120 distinct contract types, and the underlying managers may be long or short the contract. The portfolio currently consists of nine underlying managers, including subadvisors such as Graham, Harmonic, Revolution, and Trigon. Abbey Capital takes a roughly equal-risk approach to its managers, but it may underweight a newer manager and allocate capital more gradually to that firm as it gains comfort. In some cases, it takes an existing trading program from a subadvisor, while in others, Abbey asks for customized mandates for use in the mutual fund. The Abbey managers do not have a bias toward large or small CTAs, but they do require that the firm have a minimum of two years in operation and five years’ trading experience. Abbey sets a maximum drawdown target that is specific to each manager, and if it breaches that level, it will automatically be removed from the portfolio.
PriceUnlike a number of managed-futures funds that use total-return swaps to capture performance of their underlying CTAs, and buried performance fees, Abbey Capital Futures Strategy came to market with no swaps and no performance fees. That mirrors the approach the firm has always taken with its hedge fund. However, fees are still relatively high. The fund charges 2.24% for its A shares and 1.99% for its institutional shares (where virtually all of the assets sit). Both are priced Above Average according to the Morningstar Fee Level for alternatives funds. The 1.99% expense ratio is slightly higher than the 1.96% average for the managed-futures Morningstar Category. K

Abbey Capital Futures Strategy A (USD) Standard Index Category Index Morningstar CatCredit Suisse MgdFutures Liquid TRUSD
Credit Suisse MgdFutures Liquid TRUSD
US OE ManagedFutures
Performance 05-31-2016Quarterly Returns 1st Qtr 2nd Qtr 3rd Qtr 4th Qtr Total %
2014 — — 8.35 9.36 —2015 8.77 -4.98 1.00 -0.52 3.852016 0.41 — — — -2.90
Trailing Returns 1 Yr 3 Yr 5 Yr 10 Yr Incept
Load-adj Mthly -10.79 — — — 4.90Std 03-31-2016 -9.64 — — — 7.68Total Return -5.35 — — — 8.50
+/- Std Index -3.54 — — — —+/- Cat Index -3.54 — — — —
% Rank Cat 50 — — —
No. in Cat 170 — — —
Subsidized Unsubsidized
7-day Yield — —30-day SEC Yield — —
Performance DisclosureThe Overall Morningstar Rating is based on risk-adjusted returns,derived from a weighted average of the three-, five-, and 10-year(if applicable) Morningstar metrics.The performance data quoted represents past performance anddoes not guarantee future results. The investment return andprincipal value of an investment will fluctuate; thus an investor'sshares, when sold or redeemed, may be worth more or less thantheir original cost.Current performance may be lower or higher than return dataquoted herein. For performance data current to the most recentmonth-end, please call 844-261-6484 or visitwww.abbeycapital.com.
Fees and ExpensesSales Charges
Front-End Load % 5.75Deferred Load % NA
Fund Expenses
Management Fees % 1.9712b1 Expense % 0.25Net Expense Ratio % 2.24Gross Expense Ratio % 2.71
Risk and Return Profile3 Yr 5 Yr 10 Yr
119 funds 42 funds —
Morningstar RatingTM — — —Morningstar Risk — — —Morningstar Return — — —
3 Yr 5 Yr 10 Yr
Standard Deviation — — —Mean — — —Sharpe Ratio — — —
MPT Statistics Standard Index Best Fit Index
Alpha — —Beta — —R-Squared — —
12-Month Yield —Potential Cap Gains Exp -2.56%
0 0 0 0 0 0 0 0 0 0 0 0— — — — — — — — — 0 36 44
4k
10k
20k
40k
60k80k100k
Investment StyleFixed-IncomeBond %
Growth of $10,000
Abbey Capital FuturesStrategy A11,949Category Average10,662Standard Index12,820
_ _ _ _ _ _ _ _ _ _ & _ Performance Quartile(within category)
2005 2006 2007 2008 2009 2010 2011 2012 2013 2014 2015 05-16 History
— — — — — — — — — 11.63 12.07 11.72 NAV/Price
— — — — — — — — — — 3.85 -2.90 Total Return %
— — — — — — — — — — 0.28 -5.12 +/- Standard Index
— — — — — — — — — — 0.28 -5.12 +/- Category Index
— — — — — — — — — — 14 — % Rank Cat
— — — — — — — — — — 171 186 No. of Funds in Cat
Portfolio Analysis 04-30-2016Asset Allocation % Net % Long % Short %
Cash -7.46 120.72 128.19US Stocks 10.42 10.53 0.10Non-US Stocks 13.02 19.14 6.13Bonds 77.93 136.74 58.81Other/Not Clsfd 6.09 21.19 15.09
Total 100.00 308.32 208.32
Equity Style
Value Blend Growth
LargeM
idSm
all
Portfolio Statistics PortAvg
RelIndex
RelCat
P/E Ratio TTM 16.5 — —P/C Ratio TTM 10.0 — —P/B Ratio TTM 1.9 — —Geo Avg Mkt Cap$mil
54520 — —
Fixed-Income Style
Ltd Mod Ext
HighM
edLow
Avg Eff Maturity —Avg Eff Duration —Avg Wtd Coupon —Avg Wtd Price —
Credit Quality Breakdown — Bond %
AAA —AA —A —
BBB —BB —B —
Below B —NR —
Regional Exposure Stock % Rel Std Index
Americas 55.2 —Greater Europe 38.4 —Greater Asia 6.5 —
Share Chgsince03-2016
ShareAmount
Holdings:0 Total Stocks , 59 Total Fixed-Income,0% Turnover Ratio
% NetAssets
T 1,221 Euro BUND Future June16 35.53
T 98 Mini 10 Year Japanese Government B 21.77
R 873 10 Year Goverment of Canada Bond J -15.25
R 2,255 Fed Funds 1-Mo Jun-16 14.76
R 2,255 Fed Funds 1-Mo Jul-16 -14.76
Y 1,144 Euro BOBL Future June16 13.45
Y 1,021 Australian 10 Year Treasury Bond F -12.22
Y 402 London Gilt 10-Yr Jun-16 11.05
Y 497 US 10 Year Note (CBT) June16 10.15
T 102 U.S. Treasury Bond June16 7.85
R 441 E-mini S&P 500 June16 7.13
T 1,028 Fed Funds 1-Mo Jan-17 -6.73
T 683 US 5 Year Note (CBT) June16 6.49
Y 483 Us Treasury 10-Yr (Option - Delta -4.96
T 2,381 Eurodollar 3-Mo (Option - Delta = -4.67
Sector Weightings Stocks % Rel Std Index
h Cyclical 36.6 —
r Basic Materials 5.0 —t Consumer Cyclical 13.6 —y Financial Services 15.0 —u Real Estate 3.0 —
j Sensitive 39.3 —
i Communication Services 5.3 —o Energy 5.6 —p Industrials 10.5 —a Technology 18.0 —
k Defensive 24.1 —
s Consumer Defensive 9.1 —d Healthcare 12.3 —f Utilities 2.8 —
Operations
Family: Abbey CapitalManager: MultipleTenure: 1.9 YearsObjective: Growth
Base Currency: USDTicker: ABYAXMinimum Initial Purchase: $2,500Purchase Constraints: —
Incept: 08-29-2014Type: MFTotal Assets: $641.71 mil
Release date 05-31-2016
©2016 Morningstar. All Rights Reserved. The information, data, analyses and opinions contained herein (1) include the confidential and proprietary information of Morningstar, (2) may include, or be derived from, accountinformation provided by your financial advisor which cannot be verified by Morningstar, (3) may not be copied or redistributed, (4) do not constitute investment advice offered by Morningstar, (5) are provided solely forinformational purposes and therefore are not an offer to buy or sell a security, and (6) are not warranted to be correct, complete or accurate. Except as otherwise required by law, Morningstar shall not be responsible for anytrading decisions, damages or other losses resulting from, or related to, this information, data, analyses or opinions or their use. This report is supplemental sales literature. If applicable it must be preceded or accompaniedby a prospectus, or equivalent, and disclosure statement.
ß®
Page 1 of 7
3
3
3
Morningstar Alternative Investments Observer June 2016Page 24 of 49

3
3
3
Morningstar Alternative Investments Observer June 2016Page 25 of 49
PurposeThis fund seeks to offer investors a consistent income source while limiting drawdowns. It can be used as a fixed-income alternative, particularly for high-yield debt. It uses a mix of fixed-income, equity, and alternative assets.
PeopleThe fund currently employs four subadvisors: Arrowpoint, Perella Weinberg Partners, Sankaty Advisors, and Good Hill Partners. The subadvisors are responsible for managing the four sleeves, which consist of global credit and fixed income, income-oriented equities, alternatives, and a hedging overlay, as well as seven substrategies within these sleeves. Good Hill Partners runs a structured credit strategy that accounts for 19% of assets under management; Sankaty Advisors runs a sub-investment-grade credit strategy that accounts for 38% of AUM; Perella Weinberg Partners runs three substrategies: master limited partnership, high-dividend equity, and hedging and overlay, which account for 4%, 12%, and 8%, respectively; and Arrowpoint Partners runs an opportunistic credit strategy accounting for 19%.
Perella Weinberg Partners is responsible for overseeing manager selection, asset allocation, and risk management. Specifically, Chris Bittman, Darren Myers, and Kent Muckel lead the effort. The current subadvisors are likely to change as the fund strategy evolves and as Perella Weinberg identifies attractive additions. One notable change that Perella made was removing Third Avenue Management as a subadvisor, citing concerns over firm instability. Third Avenue had previously managed the real estate substrategy, which accounted for 6% of the portfolio, and Perella Weinberg has not replaced that subadvisor. American Century’s role is to provide overall supervisory responsibilities and ensure that the fund and its constituents maintain compliance with fund objectives, policies, strategies, and restrictions.
ProcessThis fund employs a flexible mandate that incorporates fixed-income, equity, and alternative strategies and permits opportunistic strategic allocations based upon the current environment. It targets a volatility that is below high-yield debt with expected beta to the S&P 500 of between 0.4 and 0.7. The fund’s risk profile is actively managed and the allocation, on a risk-adjusted basis, is determined using bottom-up security selection in each of the sleeves.
Fund ProfileAC Alternatives Income
By Linda Abu Mushrefova
AdvisorAmerican Century Investment Management
Advisor LocationKansas City, Missouri
Assets Under Management$52 million
Inception DateJuly 31, 2015
Investment Type Mutual fund
Morningstar CategoryMultialternative

3
3
3
Morningstar Alternative Investments Observer June 2016Page 26 of 49
PortfolioThe portfolio allocations are adjusted based upon each subadvisors’ opportunity set and additions/omissions of subadvisors. The fund can invest between 50% and 95% in global credit and fixed income, 15% to 60% in income-oriented equities, 0% to 30% in alternatives, and 0% to 20% in a hedging overlay. Furthermore, the fund has a limit of 4% of AUM in any single position, no more than 25% in a single industry, assets rated below B- are limited to 25%, emerging and frontier markets are limited to 20%, and nondollar exposures are limited to 40%. The aforementioned restrictions apply to the combined portfolio of all subadvisors.
As of December 2015, global credit and fixed income constitute 57% of the portfolio, with alterna-tives accounting for 19%, income-oriented equities at 16%, and hedging and overlay at 8%. The portfolio skews toward niche areas of the fixed-income market, since American Century and Perella Weinberg Partners believe that security selection can produce the most alpha in these areas given market inefficiencies. As a result, they seek out subadvisors that run strategies in these specialized areas.
Perella Weinberg Partners adopts a tactical-allocation mindset that is aimed at exploiting the changing investment opportunities. For example, American Century reduced short exposure to 10% as of February 2016, citing improving prospects and thus, a lesser need of an aggressive hedge. Depending on the market environment, the fund will employ several different allocations such as, but not limited to, equities, MLPs, Treasury Inflation-Protected Securities, and utilities. As of December 2015, the fund was relatively overweight in fixed income and cash and underweight equities.
PriceThe bulk of the fund’s assets are in the Investor share class, which has a 2.03% prospectus net expense ratio. The multialternative Morningstar Category average is 2.00%. The institutional share class boasts a net expense ratio of 1.83%. The fund offers seven share classes in total; three of which have Morningstar Fee Levels of High relative to similarly distributed peers, and another three are Above Average. Five of the seven share classes have net prospectus expense ratios higher than the category average.
The institutional share class requires a minimum investment of $5 million, while the remaining share classes require $2,500. K

AC Alternatives™ Income Investor (USD) Standard Index Category Index Morningstar CatMorningstar ModTgt Risk TR USD
Morningstar ModTgt Risk TR USD
US OEMultialternative
Performance 05-31-2016Quarterly Returns 1st Qtr 2nd Qtr 3rd Qtr 4th Qtr Total %
2014 — — — — —2015 — — — -1.74 —2016 -0.32 — — — 2.46
Trailing Returns 1 Yr 3 Yr 5 Yr 10 Yr Incept
Load-adj Mthly — — — — -2.70Std 03-31-2016 — — — — -5.34Total Return — — — — -2.70
+/- Std Index — — — — —+/- Cat Index — — — — —
% Rank Cat — — — —
No. in Cat — — — —
Subsidized Unsubsidized
7-day Yield — —30-day SEC Yield 3.32 3.32
Performance DisclosureThe Overall Morningstar Rating is based on risk-adjusted returns,derived from a weighted average of the three-, five-, and 10-year(if applicable) Morningstar metrics.The performance data quoted represents past performance anddoes not guarantee future results. The investment return andprincipal value of an investment will fluctuate; thus an investor'sshares, when sold or redeemed, may be worth more or less thantheir original cost.Current performance may be lower or higher than return dataquoted herein. For performance data current to the most recentmonth-end, please call 800-345-2021 or visitwww.americancentury.com.
Fees and ExpensesSales Charges
Front-End Load % NADeferred Load % NA
Fund Expenses
Management Fees % 2.0012b1 Expense % NANet Expense Ratio % 2.05Gross Expense Ratio % 2.05
Risk and Return Profile3 Yr 5 Yr 10 Yr
250 funds 151 funds 43 funds
Morningstar RatingTM — — —Morningstar Risk — — —Morningstar Return — — —
3 Yr 5 Yr 10 Yr
Standard Deviation — — —Mean — — —Sharpe Ratio — — —
MPT Statistics Standard Index Best Fit Index
Alpha — —Beta — —R-Squared — —
12-Month Yield —Potential Cap Gains Exp -5.22%
0 0 0 0 0 0 0 0 0 0 0 0— — — — — — — — — — 64 64
4k
10k
20k
40k
60k80k100k
Investment StyleFixed-IncomeBond %
Growth of $10,000
AC Alternatives™ IncomeInvestor9,730Category Average9,606Standard Index10,047
_ _ _ _ _ _ _ _ _ _ _ _ Performance Quartile(within category)
2005 2006 2007 2008 2009 2010 2011 2012 2013 2014 2015 05-16 History
— — — — — — — — — — 9.34 9.57 NAV/Price
— — — — — — — — — — — 2.46 Total Return %
— — — — — — — — — — — -1.27 +/- Standard Index
— — — — — — — — — — — -1.27 +/- Category Index
— — — — — — — — — — — — % Rank Cat
— — — — — — — — — — — 510 No. of Funds in Cat
Portfolio Analysis 03-31-2016Asset Allocation % Net % Long % Short %
Cash 18.51 18.52 0.00US Stocks 13.48 13.48 0.00Non-US Stocks 0.30 0.30 0.00Bonds 66.72 71.31 4.58Other/Not Clsfd 0.98 7.83 6.85
Total 100.00 111.44 11.44
Equity Style
Value Blend Growth
LargeM
idSm
all
Portfolio Statistics PortAvg
RelIndex
RelCat
P/E Ratio TTM 18.4 1.03 0.96P/C Ratio TTM 10.4 1.08 1.07P/B Ratio TTM 3.0 1.53 1.45Geo Avg Mkt Cap$mil
30168 1.31 1.21
Fixed-Income Style
Ltd Mod Ext
HighM
edLow
Avg Eff Maturity —Avg Eff Duration —Avg Wtd Coupon 3.25Avg Wtd Price 86.88
Credit Quality Breakdown — Bond %
AAA —AA —A —
BBB —BB —B —
Below B —NR —
Regional Exposure Stock % Rel Std Index
Americas 97.8 1.35Greater Europe 2.2 0.15Greater Asia 0.0 0.00
Share Chgsince12-2015
ShareAmount
Holdings:72 Total Stocks , 1,236 Total Fixed-Income,23% Turnover Ratio
% NetAssets
T 4 mil Mlpx Trs Usd P V 01mlibor Mlpx Ind -6.85
T 9,627 Mlpx Trs Usd R E Mlpx Index 4.27
T 50,895 iShares US Preferred Stock 3.771 mil Invitation Homes Tr 2015-Sfr3 FRN 1.811 mil Venture Xvi Clo Ltd / Venture Xvi 1.62
750,000 Pinnacle Foods Fin Llc / Pinna 4.8 1.44
Y 742,386 Cpg Merger Sub Llc Term Loan 1.377,500 iShares iBoxx $ High Yield Corpora 1.16
Y 8 mil GNMA CMO 1.11750,000 Tpc Grp 144A 8.75% 1.00
500,000 Natl Cinemedia 6% 0.99500,000 Aercap Ireland Cap Limited 5% 0.98500,000 Level 3 Fing 5.625% 0.98
Y 494,955 Indigo Merger Sub I Inc First Lien 0.94500,000 Exeter Auto Recv Tr 2014-3 5.69% 0.93
Sector Weightings Stocks % Rel Std Index
h Cyclical 30.6 0.78
r Basic Materials 3.8 0.74t Consumer Cyclical 23.0 1.98y Financial Services 3.8 0.23u Real Estate 0.0 0.00
j Sensitive 29.2 0.81
i Communication Services 0.0 0.00o Energy 0.9 0.14p Industrials 10.6 0.87a Technology 17.7 1.30
k Defensive 40.2 1.62
s Consumer Defensive 17.3 1.83d Healthcare 9.7 0.88f Utilities 13.2 3.05
Operations
Family: American Century InvestmentsManager: MultipleTenure: 0.9 YearObjective: Income
Base Currency: USDTicker: ALNNXMinimum Initial Purchase: $2,500Purchase Constraints: —
Incept: 07-31-2015Type: MFTotal Assets: $53.55 mil
Release date 05-31-2016
©2016 Morningstar. All Rights Reserved. The information, data, analyses and opinions contained herein (1) include the confidential and proprietary information of Morningstar, (2) may include, or be derived from, accountinformation provided by your financial advisor which cannot be verified by Morningstar, (3) may not be copied or redistributed, (4) do not constitute investment advice offered by Morningstar, (5) are provided solely forinformational purposes and therefore are not an offer to buy or sell a security, and (6) are not warranted to be correct, complete or accurate. Except as otherwise required by law, Morningstar shall not be responsible for anytrading decisions, damages or other losses resulting from, or related to, this information, data, analyses or opinions or their use. This report is supplemental sales literature. If applicable it must be preceded or accompaniedby a prospectus, or equivalent, and disclosure statement.
ß®
Page 1 of 7
3
3
3
Morningstar Alternative Investments Observer June 2016Page 27 of 49

3
3
3
Morningstar Alternative Investments Observer June 2016Page 28 of 49
PurposeThis fund combines a relative value long-short credit strategy with a higher-yielding municipal-bond portfolio. It can be used by investors to diversify a fixed-income sleeve away from traditional core bond exposure.
PeopleThe members of the fund’s portfolio management team have considerable experience in credit and/or municipal-bond investing, the key components of the fund’s strategy. Alan Hart founded Cedar Ridge in 2004 and serves as chief investment officer. Guy Benstead has been with the firm since 2005 and has worked in credit and interest-rate markets at Bear, Stearns and Drexel Burnham Lambert. David Falk, the director of research, joined Cedar Ridge in 2009. Additional portfolio managers include Jeffrey Hudson, who prior to joining Cedar Ridge in 2006 worked at Lehman Brothers on the high-yield and distressed municipal desks, and Jeffrey Rosenkranz, who has been with the firm since 2013. The team previously ran this strategy as a subadvisor for a tactical long-short credit fund run by Forward from 2009-13. It also runs a limited partnership version of the strategy.
ProcessThis fund has wide latitude to seek total-return opportunities in fixed-income markets; its main areas of investment focus are long-short credit, interest-rate hedging, and municipal bonds (long only). Management begins its investment process by taking a macro, forward-looking view of rates, risk premiums, and credit spreads, which informs its allocation decisions to different asset classes and sectors available in its tool kit. Unlike some long-short credit managers, Cedar Ridge does not necessarily try to hedge out all interest-rate risk. Depending on their macro views and the shape of the yield curve, the managers will take on some duration exposure, though they typically engage in some interest-rate hedging. Within the credit-focused sleeve, management looks for long opportuni-ties with companies that may be out of favor due to factors like low commodity prices or unfavorable cyclical trends, but where there is a clear catalyst for improvement. On the short side, management’s aim is to generate returns through directional bets against individual companies. Cedar Ridge does not use hedges or capital structure arbitrage trades. The managers try to identify situations where secular trends run against the company’s business and where the company may have incentive to degrade its credit rating in favor of the stock price. With high-yield credit, the managers look for scenarios where the recovery rates on the credit will be low, because of either the capital structure or destructive management behavior.
By Josh Charlson
AdvisorCedar Ridge Partners
Advisor LocationGreenwich, Connecticut
Assets Under Management$59 million
Inception DateDecember 12, 2013
Investment Type Mutual fund
Morningstar CategoryLong-short credit
Fund ProfileCedar Ridge Unconstrained Credit

3
3
3
Morningstar Alternative Investments Observer June 2016Page 29 of 49
Municipal bonds are a somewhat unusual investment allocation for a long-short credit fund, but it’s a specialty borne of the management team’s specific expertise. The fund tends to focus on sectors in which management has a great deal of experience, such as tobacco settlement bonds, as well as transportation, bridge projects, and corporate-backed airline bonds.
PortfolioAs of Feb. 29, 2016, the fund’s largest allocation was to municipal bonds, at 101.6% (management can use the cash collateral from shorting to fund additional long investments). Its corporate credit sleeve was 31% long and 22% short. And the fund maintained a 33% short Treasury position, used to hedge interest rates. The fund has long maintained a significant weighting to tobacco settlement bonds, which maintain a stream of revenue stemming from tobacco-related legal settlements. Among the fund’s largest holdings were tobacco bonds from Iowa (4.7%), Ohio (3.5%), and San Diego (3.2%). The fund also had a nearly 12% allocation to Puerto Rico, including two issues from the Puerto Rico Electric Power Authority totaling about 6% of assets. The largest portfolio holdings were a 6.5% stake in a Chicago Board of Education bond and a 5% position in California Build America Bonds. In the short book, the fund’s biggest bets were on Whole Foods (1.9%), hotelier Wynn Las Vegas (1.8%), and retailer Kohl’s (1.8%).
PriceThis fund’s fees are high relative to the long-short credit Morningstar Category. It charges 1.39% for the institutional shares and 1.64% for the Investor shares; both are capped by a fee waiver currently in effect through March 2017. Both expense ratios have Morningstar Fee Levels of High. The Investor shares include an additional 25-basis-point distribution fee. North of 80% of assets, however, are in the institutional shares. K

Cedar Ridge Unconstrained Credit Inv(USD)
Standard Index Category Index Morningstar CatBarclays US AggBond TR USD
BofAML USDLIBOR 3 Mon CM
US OE Long-ShortCredit
Performance 05-31-2016Quarterly Returns 1st Qtr 2nd Qtr 3rd Qtr 4th Qtr Total %
2014 7.89 2.50 0.60 0.40 11.692015 0.55 -3.56 -0.64 2.53 -1.212016 0.86 — — — 2.30
Trailing Returns 1 Yr 3 Yr 5 Yr 10 Yr Incept
Load-adj Mthly 1.91 — — — 4.78Std 03-31-2016 -0.90 — — — 4.49Total Return 1.91 — — — 4.78
+/- Std Index -1.09 — — — —+/- Cat Index 1.53 — — — —
% Rank Cat 18 — — —
No. in Cat 80 — — —
Subsidized Unsubsidized
7-day Yield — —30-day SEC Yield — —
Performance DisclosureThe Overall Morningstar Rating is based on risk-adjusted returns,derived from a weighted average of the three-, five-, and 10-year(if applicable) Morningstar metrics.The performance data quoted represents past performance anddoes not guarantee future results. The investment return andprincipal value of an investment will fluctuate; thus an investor'sshares, when sold or redeemed, may be worth more or less thantheir original cost.Current performance may be lower or higher than return dataquoted herein. For performance data current to the most recentmonth-end, please call 855-550-5090.
Fees and ExpensesSales Charges
Front-End Load % NADeferred Load % NA
Fund Expenses
Management Fees % 1.0012b1 Expense % 0.25Net Expense Ratio % 1.65Gross Expense Ratio % 4.09
Risk and Return Profile3 Yr 5 Yr 10 Yr
35 funds 16 funds 1 funds
Morningstar RatingTM — — —Morningstar Risk — — —Morningstar Return — — —
3 Yr 5 Yr 10 Yr
Standard Deviation — — —Mean — — —Sharpe Ratio — — —
MPT Statistics Standard Index Best Fit Index
Alpha — —Beta — —R-Squared — —
12-Month Yield —Potential Cap Gains Exp -0.57%
0 0 0 0 0 0 0 0 0 0 0 0— — — — — — — — — 69 80 85
4k
10k
20k
40k
60k80k100k
Investment StyleFixed-IncomeBond %
Growth of $10,000
Cedar Ridge UnconstrainedCredit Inv11,288Category Average10,023Standard Index11,023
_ _ _ _ _ _ _ _ _ & * _ Performance Quartile(within category)
2005 2006 2007 2008 2009 2010 2011 2012 2013 2014 2015 05-16 History
— — — — — — — — 9.94 10.91 10.54 10.71 NAV/Price
— — — — — — — — — 11.69 -1.21 2.30 Total Return %
— — — — — — — — — 5.73 -1.76 -1.16 +/- Standard Index
— — — — — — — — — 11.46 -1.44 2.05 +/- Category Index
— — — — — — — — — 2 33 — % Rank Cat
— — — — — — — — — 61 80 85 No. of Funds in Cat
Portfolio Analysis 02-29-2016Asset Allocation % Net % Long % Short %
Cash 7.31 7.31 0.00US Stocks 1.10 1.10 0.00Non-US Stocks 0.00 0.00 0.00Bonds 76.70 132.24 55.54Other/Not Clsfd 14.90 14.90 0.00
Total 100.00 155.54 55.54
Equity Style
Value Blend Growth
LargeM
idSm
all
Portfolio Statistics PortAvg
RelIndex
RelCat
P/E Ratio TTM — — —P/C Ratio TTM — — —P/B Ratio TTM — — —Geo Avg Mkt Cap$mil
— — —
Fixed-Income Style
Ltd Mod Ext
HighM
edLow
Avg Eff Maturity —Avg Eff Duration —Avg Wtd Coupon —Avg Wtd Price 101.14
Credit Quality Breakdown — Bond %
AAA —AA —A —
BBB —BB —B —
Below B —NR —
Regional Exposure Stock % Rel Std Index
Americas 100.0 —Greater Europe 0.0 —Greater Asia 0.0 —
Share Chgsince11-2015
ShareAmount
Holdings:1 Total Stocks , 120 Total Fixed-Income,64% Turnover Ratio
% NetAssets
5 mil US Treasury Note 2.25% -9.96
R 4 mil Chicago Ill Brd Ed Ult Tax G 7% 6.52
Y 3 mil US Treasury Note 1.875% -5.87
R 3 mil US Treasury Bond 2.875% -5.01
R 2 mil California St Go Bds 7.55% 4.95
R 3 mil US Treasury Note 1.375% -4.80
R 3 mil US Treasury Note 0.875% -4.77
T 3 mil Tobacco Settlement Auth 5.625% 4.71
T 2 mil Buckeye Ohio Tob Settlement Fi To 3.51
R 2 mil San Diego Calif Tob Settlement To 3.27
T 3 mil Puerto Rico Elec Pwr Auth 5.25% 3.17
R 2 mil New Jersey St Transn Tr Fd Aut Tr 3.04
R 2 mil US Treasury Note 2.25% -2.992 mil Gap Inc Del 5.95% 2.972 mil Tobacco Settlement Fing Corp N As 2.87
Sector Weightings Stocks % Rel Std Index
h Cyclical 100.0 —
r Basic Materials 0.0 —t Consumer Cyclical 0.0 —y Financial Services 0.0 —u Real Estate 100.0 —
j Sensitive 0.0 —
i Communication Services 0.0 —o Energy 0.0 —p Industrials 0.0 —a Technology 0.0 —
k Defensive 0.0 —
s Consumer Defensive 0.0 —d Healthcare 0.0 —f Utilities 0.0 —
Operations
Family: Cedar RidgeManager: MultipleTenure: 2.5 YearsObjective: Growth and IncomeBase Currency: USD
Ticker: CRUPXMinimum Initial Purchase: $4,000Min Auto Investment Plan: $4,000Minimum IRA Purchase: $500Purchase Constraints: —
Incept: 12-12-2013Type: MFTotal Assets: $59.15 mil
Release date 05-31-2016
©2016 Morningstar. All Rights Reserved. The information, data, analyses and opinions contained herein (1) include the confidential and proprietary information of Morningstar, (2) may include, or be derived from, accountinformation provided by your financial advisor which cannot be verified by Morningstar, (3) may not be copied or redistributed, (4) do not constitute investment advice offered by Morningstar, (5) are provided solely forinformational purposes and therefore are not an offer to buy or sell a security, and (6) are not warranted to be correct, complete or accurate. Except as otherwise required by law, Morningstar shall not be responsible for anytrading decisions, damages or other losses resulting from, or related to, this information, data, analyses or opinions or their use. This report is supplemental sales literature. If applicable it must be preceded or accompaniedby a prospectus, or equivalent, and disclosure statement.
ß®
Page 1 of 7
3
3
3
Morningstar Alternative Investments Observer June 2016Page 30 of 49

3
3
3
Morningstar Alternative Investments Observer June 2016Page 31 of 49
PurposeAlthough in many ways akin to a global macro fund, this fund tends to take on higher directional equity exposure than many other multialternative peers. It’s intended to provide equitylike returns with lower volatility, but it may not be as strong a diversifier as less-correlated peers.
PeopleSubadvisor Mellon Capital has a large research team backing the fund and uses a team-based approach. Among the five named portfolio managers are Sinead Colton, head of investment strategy, Vassilis Dagioglu, head of asset allocation in the portfolio management group, and James Stavena, who is involved with implementation of the strategies. The managers also work closely with Mellon’s multiasset research group, headed by Anjun Zhou, as well as the global trading group, headed by Brett Thunstrom. The fund relies on eight investment strategists, 24 total multiasset researchers, and nine traders.
ProcessThis fund underwent a strategy shift after the financial crisis of 2008. The strategy (which has an institutional version that’s been running since 2006) had always used a multiasset, models-based, active allocation approach, but it was long-only. After significant losses in 2008, however, manage-ment decided to focus more on downside protection, implementing more alternative techniques. The fund targets a long-term volatility level of between 7% and 9% standard deviation, aiming to produce equitylike returns at lower risk levels. Mellon’s allocation process begins by developing forward-looking views for asset classes, generally at the country level. These forecasts are based on macroeconomic factors as well as fundamental valuation majors. A mean-variance optimization process is run daily to set the specific allocations, and the fund can invest both long and short in equities, bonds, real assets, and currencies. Management incorporates several metrics into its risk-management process, including a short-term risk model, a longer-term macro model designed to identify recessions risk, and scenario analysis. In addition, management incorporated a tail-risk hedging component in 2014, largely using out-of-the-money put options. Net exposure and volatility will generally be scaled back when expected risk rises, and the managers also have some discre-tionary input to the downside management.
PortfolioThis fund tends to take on greater market exposure than the typical multialternative Morningstar Category peer. The fund’s beta can range between 0.2 to 0.8, but during the past three years, it has exhibited a beta of around 0.6 to the MSCI World Index. But the fund’s dynamic risk-allocation
By Josh Charlson
AdvisorDreyfus
SubadvisorMellon Capital Management
Advisor LocationNew York, New York
Assets Under Management$1.4 billion
Inception DateMay 2, 2006
Investment Type Mutual fund
Morningstar CategoryMultialternative
Fund ProfileDreyfus Dynamic Total Return

3
3
3
Morningstar Alternative Investments Observer June 2016Page 32 of 49
process can lead to pronounced short-term moves. For instance, allocations to what the fund calls its growth bucket (which includes equities along with high-yield and emerging-markets bonds) declined from nearly 70% in November 2015 to around 43% in February 2016. At the same time, the fund’s defensive sleeve shifted from primarily sovereign bonds to a large slug of cash. More recently, the fund has become less defensive in its positioning. As of the end of March 2016, the fund’s growth sleeve was back up to a net 59% exposure, while net exposure to the defensive sleeve stood at 36%. That bucket is largely long U.S. Treasuries while maintaining a significant short on German bunds and the U.K. gilt; the models for bond allocations have been more quick-changing of late because of the low-yield environment in many countries. The fund generally uses highly liquid futures as the underlying instruments.
PriceThis fund has capitalized on its scale and use of relatively cost-efficient futures as its underlying instruments to produce competitive fees, relative to both the broad alternatives universe and the multialternative category. The bulk of assets are in the Y shares and I shares, split about evenly between them. The Y shares, with a 1.14% annual report net expense ratio, receive a Morningstar Feel Level of Low, while the Y shares, at 1.22%, are Below Average. The A shares cost 1.49% and have a Below Average fee level. K

Dreyfus Dynamic TotalReturn A (USD)
Overall Morningstar RatingTM Standard Index Category Index Morningstar CatQQQQ Morningstar Mod
Tgt Risk TR USDMorningstar ModTgt Risk TR USD
US OEMultialternative250 US OE Multialternative
Performance 05-31-2016Quarterly Returns 1st Qtr 2nd Qtr 3rd Qtr 4th Qtr Total %
2014 -0.60 4.96 0.67 3.04 8.222015 5.33 -1.65 -7.06 3.53 -0.322016 -2.51 — — — -0.84
Trailing Returns 1 Yr 3 Yr 5 Yr 10 Yr Incept
Load-adj Mthly -11.87 2.48 3.49 — 2.43Std 03-31-2016 -13.04 — 3.63 — 2.30Total Return -6.50 4.52 4.72 3.35 3.04
+/- Std Index -5.74 -0.19 -0.66 -2.34 —+/- Cat Index -5.74 -0.19 -0.66 -2.34 —
% Rank Cat 74 2 1 19
No. in Cat 449 250 151 43
Subsidized Unsubsidized
7-day Yield — —30-day SEC Yield — —
Performance DisclosureThe Overall Morningstar Rating is based on risk-adjusted returns,derived from a weighted average of the three-, five-, and 10-year(if applicable) Morningstar metrics.The performance data quoted represents past performance anddoes not guarantee future results. The investment return andprincipal value of an investment will fluctuate; thus an investor'sshares, when sold or redeemed, may be worth more or less thantheir original cost.Current performance may be lower or higher than return dataquoted herein. For performance data current to the most recentmonth-end, please call 800-373-9387 or visit www.dreyfus.com.
Fees and ExpensesSales Charges
Front-End Load % 5.75Deferred Load % NA
Fund Expenses
Management Fees % 1.1012b1 Expense % NANet Expense Ratio % 1.49Gross Expense Ratio % 1.49
Risk and Return Profile3 Yr 5 Yr 10 Yr
250 funds 151 funds 43 funds
Morningstar RatingTM 4Q 5Q 3WMorningstar Risk High High +AvgMorningstar Return +Avg High +Avg
3 Yr 5 Yr 10 Yr
Standard Deviation 7.88 8.55 12.17Mean 4.52 4.72 3.35Sharpe Ratio 0.59 0.57 0.25
MPT Statistics Standard Index Best Fit IndexMorningstar US
Large Growth TRUSD
Alpha 0.00 -2.77Beta 0.97 0.54R-Squared 77.27 79.44
12-Month Yield —Potential Cap Gains Exp -2.47%
0 0 0 0 0 0 0 0 0 0 0 6— 9 6 13 19 0 0 0 7 1 2 3
4k
10k
20k
40k
60k80k100k
Investment StyleFixed-IncomeBond %
Growth of $10,000
Dreyfus Dynamic Total ReturnA13,899Category Average11,010Standard Index17,381
_ _ ) ) & & & * & & & _ Performance Quartile(within category)
2005 2006 2007 2008 2009 2010 2011 2012 2013 2014 2015 05-16 History
— 13.47 13.06 8.26 10.30 11.65 11.66 12.64 14.41 15.58 15.53 15.40 NAV/Price
— — 0.17 -33.99 24.70 13.11 0.09 8.40 14.00 8.22 -0.32 -0.84 Total Return %
— — -8.46 -11.80 2.92 0.77 -0.51 -3.64 -0.30 3.33 1.47 -4.57 +/- Standard Index
— — -8.46 -11.80 2.92 0.77 -0.51 -3.64 -0.30 3.33 1.47 -4.57 +/- Category Index
— — 77 92 13 2 19 26 3 3 21 — % Rank Cat
— — 41 63 105 140 175 203 268 373 461 510 No. of Funds in Cat
Portfolio Analysis 04-30-2016Asset Allocation % Net % Long % Short %
Cash 90.84 185.36 94.52US Stocks 0.00 0.00 0.00Non-US Stocks 2.00 2.00 0.00Bonds 5.83 5.83 0.00Other/Not Clsfd 1.33 1.33 0.00
Total 100.00 194.52 94.52
Equity Style
Value Blend Growth
LargeM
idSm
all
Portfolio Statistics PortAvg
RelIndex
RelCat
P/E Ratio TTM — — —P/C Ratio TTM — — —P/B Ratio TTM — — —Geo Avg Mkt Cap$mil
— — —
Fixed-Income Style
Ltd Mod Ext
HighM
edLow
Avg Eff Maturity 1.62Avg Eff Duration 6.07Avg Wtd Coupon —Avg Wtd Price 102.57
Credit Quality Breakdown 04-30-2016 Bond %
AAA 50.00AA 0.00A 0.00
BBB 0.45BB 21.17B 20.89
Below B 7.49NR 0.00
Regional Exposure Stock % Rel Std Index
Americas — —Greater Europe — —Greater Asia — —
Share Chgsince03-2016
ShareAmount
Holdings:1 Total Stocks , 847 Total Fixed-Income,166% Turnover Ratio
% NetAssets
601,328 iShares TIPS Bond 2.94
T 2 mil SPDR® Barclays High Yield Bond ETF 2.9445 mil Spdr Barc High Bd Etf 12/15/16 Rtn 2.00
8 mil Us 10yr Fut Jun16c Exp5/20/16@118 0.00
Sector Weightings Stocks % Rel Std Index
h Cyclical — —
r Basic Materials — —t Consumer Cyclical — —y Financial Services — —u Real Estate — —
j Sensitive — —
i Communication Services — —o Energy — —p Industrials — —a Technology — —
k Defensive — —
s Consumer Defensive — —d Healthcare — —f Utilities — —
Operations
Family: DreyfusManager: MultipleTenure: 6.1 YearsObjective: Growth
Base Currency: USDTicker: AVGAXMinimum Initial Purchase: $1,000Minimum IRA Purchase: $750
Purchase Constraints: —Incept: 05-02-2006Type: MFTotal Assets: $1,411.18 mil
Release date 05-31-2016
©2016 Morningstar. All Rights Reserved. The information, data, analyses and opinions contained herein (1) include the confidential and proprietary information of Morningstar, (2) may include, or be derived from, accountinformation provided by your financial advisor which cannot be verified by Morningstar, (3) may not be copied or redistributed, (4) do not constitute investment advice offered by Morningstar, (5) are provided solely forinformational purposes and therefore are not an offer to buy or sell a security, and (6) are not warranted to be correct, complete or accurate. Except as otherwise required by law, Morningstar shall not be responsible for anytrading decisions, damages or other losses resulting from, or related to, this information, data, analyses or opinions or their use. This report is supplemental sales literature. If applicable it must be preceded or accompaniedby a prospectus, or equivalent, and disclosure statement.
ß®
Page 1 of 7
3
3
3
Morningstar Alternative Investments Observer June 2016Page 33 of 49
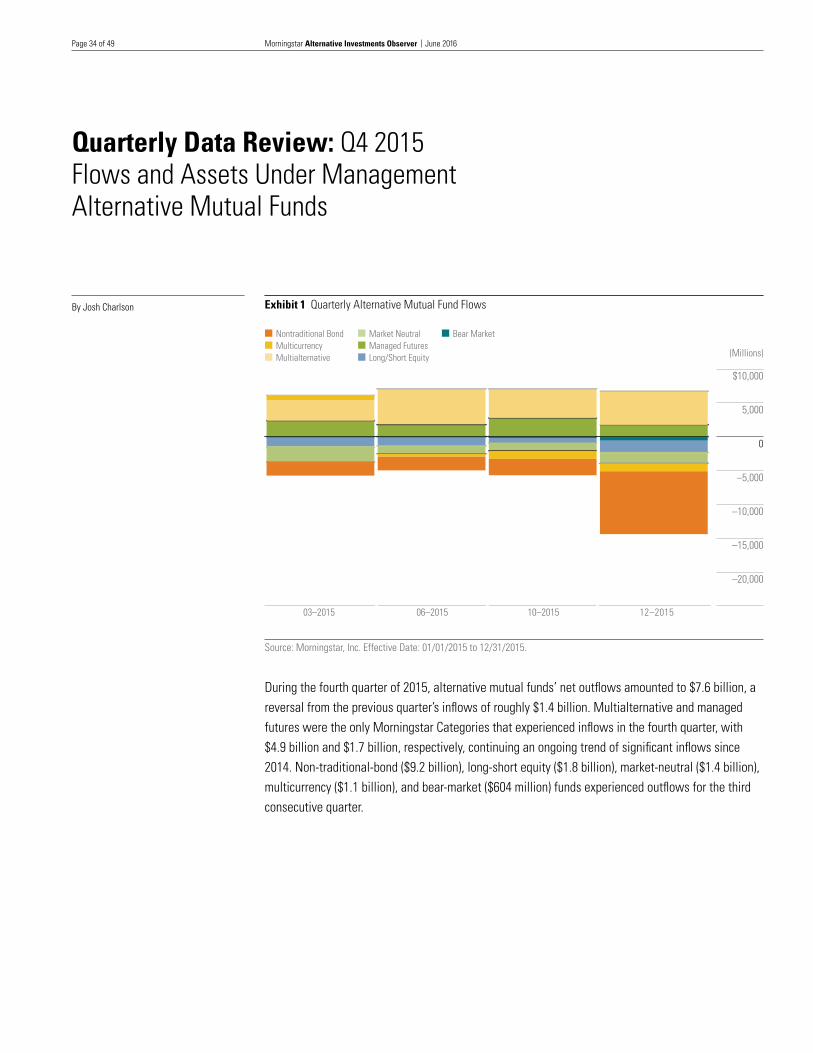
3
3
3
Morningstar Alternative Investments Observer June 2016Page 34 of 49
Exhibit 1 Quarterly Alternative Mutual Fund Flows
(Millions)
03–2015 06–2015 10–2015 12–2015
$10,000
5,000
–5,000
–10,000
–15,000
–20,000
0
Nontraditional BondMulticurrencyMultialternative
Market NeutralManaged FuturesLong/Short Equity
Bear Market
Source: Morningstar, Inc. Effective Date: 01/01/2015 to 12/31/2015.
During the fourth quarter of 2015, alternative mutual funds’ net outflows amounted to $7.6 billion, a reversal from the previous quarter’s inflows of roughly $1.4 billion. Multialternative and managed futures were the only Morningstar Categories that experienced inflows in the fourth quarter, with $4.9 billion and $1.7 billion, respectively, continuing an ongoing trend of significant inflows since 2014. Non-traditional-bond ($9.2 billion), long-short equity ($1.8 billion), market-neutral ($1.4 billion), multicurrency ($1.1 billion), and bear-market ($604 million) funds experienced outflows for the third consecutive quarter.
By Josh Charlson
Quarterly Data Review: Q4 2015Flows and Assets Under Management Alternative Mutual Funds

3
3
3
Morningstar Alternative Investments Observer June 2016Page 35 of 49
Exhibit 2 Quarterly Alternative Mutual Fund Organic Growth
Morningstar Category %
Bear Market –14.76
Long-Short Equity –3.34
Managed Futures 7.65
Market Neutral –5.92
Multialternative 9.79
Multicurrency –15.75
Nontraditional Bond –6.46
Source: Morningstar, Inc. Data as of 12/31/15.
In fourth quarter of 2015, the category with the strongest organic growth (that is, growth reflective of net inflows and excluding market appreciation) was the multialternative category, which grew 9.8%. Positive organic growth was also experienced by the managed-futures category, with a 7.6% growth rate. The five other categories experienced negative organic growth rates, including long-short equity (negative 3.3%), nontraditional bond (negative 6.5%), market neutral (negative 5.9%), and bear market (negative 14.8%).
Exhibit 3 Quarterly Alternative Mutual Fund Assets Under Management
(Millions)
03–2015 06–2015 10–2015 12–2015
$350,000
300,000
200,000
150,000
100,000
50,000
250,000
Nontraditional BondMulticurrencyMultialternative
Market NeutralManaged FuturesLong/Short Equity
Bear Market
Source: Morningstar, Inc. Data as of 12/31/15.
Assets under management for all alternative mutual funds decreased by 3.71% quarter over quarter, totaling $294 billion at the end of December 2015. Five of the seven alternative mutual fund categories decreased in assets in the fourth quarter. Bear-market and multicurrency funds experi-enced the largest percentage losses in assets quarter over quarter, losing 21.40% and 15.85%,
-20 -15 -10 -5 0 5 10

3
3
3
Morningstar Alternative Investments Observer June 2016Page 36 of 49
respectively. Long-short equity, market-neutral, and non-traditional-bond funds all also showed losses this quarter. Multialternative and managed futures fared well over the quarterly time frame, increasing assets 6.91% and 3.43%, respectively.
Exhibit 4 Quarter-End Alternative Mutual Fund Assets by Morningstar Category
Morningstar Category $ Billion
Bear Market 3.2
Long-Short Equity 47.5
Managed Futures 23.7
Market Neutral 23.5
Multialternative 55.4
Multicurrency 6.3
Nontraditional Bond 134.4
Source: Morningstar, Inc. Data as of 12/31/15.
At year-end 2015, the non-traditional-bond category captured 45% of alternative fund assets, with $134.4 billion. The second-largest category was multialternative at $55.4 billion, accounting for about 19% of the total. Long-short equity funds followed closely, with $47.5 billion representing 16% of the total. The managed-futures and market-neutral categories held similar assets, at $23.7 billion and $23.5 billion, respectively. Multicurrency and bear market were the smallest, at $6.3 billion and $3.2 billion, respectively.
Exhibit 5 Largest Mutual Fund Firms by Alternative Assets Under Management
Fund Family % of Total $ Billion
AQR Funds 10.04 16.4
Natixis Funds 9.03 14.8
PIMCO 7.06 11.5
John Hancock 7.00 11.4
Robeco Investment Funds 5.17 8.4
Blackstone 3.15 5.1
Merger 2.91 4.8
Diamond Hill Funds 2.74 4.5
Neuberger Berman 2.66 4.3
Calamos 2.35 3.8
Source: Morningstar, Inc. Data as of 12/31/15.
At year-end 2015, AQR ran the most money in alternative mutual fund assets, with 10% of the total, thanks in particular to the dominance of AQR Managed Futures in the managed-futures category. Natixis, which has seen significant growth in assets in the products run by affiliate AlphaSimplex
0 25 50 75 100 125 150
0 5 10 15 20

3
3
3
Morningstar Alternative Investments Observer June 2016Page 37 of 49
Group, ranked second with 9% of the total. Traditional fund companies PIMCO and John Hancock took the next two spots, at about 7% each, with their growing emphasis on alternative strategies bearing fruit. John Hancock Global Absolute Return Strategies, subadvised by Standard Life, is now one of the largest alternative mutual funds in the United States. Robeco, with its suite of long-short equity funds, followed with a 5.2% share, while relative newcomer Blackstone (though the firm has a long history in the hedge fund space) slipped into the sixth spot with a 3.2% share. K

3
3
3
Morningstar Alternative Investments Observer June 2016Page 38 of 49
Exhibit 6 Quarterly Estimated Hedge Fund Net Flow
(Millions)
03–2015 06–2015 09–2015 12–2015
$6,000
4,000
2,000
–2,000
0
Single Manager HF FlowsHedge Fund of Funds Flows
Source: Morningstar, Inc. Data as of 12/31/15.Morningstar no longer publishes proprietary hedge fund indexes. Morningstar now uses the Morningstar MSCI series of indexes, including the Morningstar MSCI Composite AW, a currency-hedged asset-weighted index of 1,000 hedge funds, or the applicable category averages.
Single-manager hedge funds in Morningstar’s database experienced inflows of $951 million, and funds of hedge funds recorded outflows of $1.1 billion during the fourth quarter of 2015. Multistrategy (single-manager) hedge funds experienced the highest inflows, with more than $1.9 billion. Systematic futures (single-manager) trailed with the second-highest inflows at $745 million, marking a fourth consecutive quarter of inflows. Event-driven, global macro, and long-short debt (single-manager) hedge funds demonstrated the largest outflows of $814 million, $775 million, and $701 million, respectively. For funds of hedge funds, no categories displayed positive flows in the fourth quarter. Event funds experienced the largest outflows ($459 million), followed by multistrategy funds ($432 million); both have posted outflows for the fourth quarter in a row.
Flows and Assets Under ManagementHedge Funds

3
3
3
Morningstar Alternative Investments Observer June 2016Page 39 of 49
Exhibit 7 Quarterly Hedge Fund Total Net Assets Under Management
(Millions)
03–2015 06–2015 09–2015 12–2015
$400,000
300,000
200,000
100,000
Single Manager HF FlowsHedge Fund of Funds Flows
Source: Morningstar, Inc. Data as of 12/31/15.
In the fourth quarter of 2015, assets under management for single-manager hedge funds in Morningstar’s database increased by 3.42% to $296 billion. Despite gains over the previous quarter, however, assets decreased by a total margin of 11.11% during 2015. Hedge funds of funds in Morningstar’s database, on the other hand, managed 12.51% fewer assets than in the prior quarter, with $39.7 billion in assets recorded as of Dec. 31, 2015. Assets under management of hedge fund of funds decreased 18.33% since January 2015. Overall, combined hedge fund assets increased by 1.24% in the fourth quarter and have declined 12.03% during 2015. K

3
3
3
Morningstar Alternative Investments Observer June 2016Page 40 of 49
Exhibit 8 Growth of a $10,000 Alternative Investment
US OE Market NeutralUS OE Managed FuturesUS OE Long-Short Equity
Morningstar MSCI Comp Hedge Fund (AW)MSCI World NR USDBarclays Global Aggregate TR USD
JulyAug Sept Oct Aug Sept Oct NovNov Dec Jan2015
Feb Mar April May June DecJuly2014
$12,000
10,500
11,000
11,500
10,000
9,500
Source: Morningstar, Inc. Data as of 12/31/15. Morningstar no longer publishes proprietary hedge fund indexes. Morningstar now uses the Morningstar MSCI series of indexes, including the Morningstar MSCI Composite AW, a currency-hedged asset-weighted index of 1,000 hedge funds, or the applicable category averages.
In the fourth quarter of 2015, bonds and managed futures, as represented by the Barclays Global Aggregate TR USD Index and the managed-futures category average, displayed the only negative performance, losing 0.92% and 0.99%, respectively. In contrast, global stocks experienced the sharpest gain this quarter, as measured by the MSCI World NR USD, rising 5.50%, rebounding from sharp third-quarter 2015 losses. Long-short equity, market-neutral, and hedge funds, as measured by the Morningstar MSCI Composite Hedge Fund Index, all experienced gains during the same time period. Over the three-year period ended Dec. 31, 2015, global equities, as measured by the MSCI World Index, had the largest annualized return, 9.63%. Hedge funds, as represented by the Morningstar MSCI Compositie Hedge Fund Index, had the next highest return of 5.48% annualized, followed by the long-short equity category’s 4.84%. Managed-futures funds were slightly positive over the period.
Alternative Investment Performance

3
3
3
Morningstar Alternative Investments Observer June 2016Page 41 of 49
Exhibit 9 Performance of Alternative Investments Over Time Total Returns: 2015-Q4 1-Year 3-Year (Annualized) 5-Year (Annualized)
Barclays Global Aggregate TR USD
Morningstar MSCI Composite AW
MSCI World NR USD
US OE Long-Short Equity
US OE Managed Futures
US OE Market Neutral
Source: Morningstar Direct. Data as of 12/31/15.
Alternative investments posted largely positive returns in the fourth quarter of 2015 but struggled over the trailing one-year period. Over longer periods of time, alternatives have looked slightly more attractive. Global stocks, as represented by the MSCI World NR Index, steadily outperformed all other alternative investments over the three-year and five-year time frames (ended Dec. 31) but had negative returns over the one-year period. Long-short equity funds displayed strong single-digit returns over the three- and five-year periods but lost more than 2.00% over the one-year period. Market-neutral funds posted low-single-digit returns over the trailing three- and five-year periods, with slightly negative returns during the past year. Managed-futures funds displayed somewhat worse one-year returns than market-neutral, at negative 0.94%. Global bonds, as represented by the Barclays Global Aggregate TR USD Index, showed the only negative returns over the three-year period. Over a five-year period, bonds have returned just under 1.00%. K
-5 0 5 10

3
3
3
Morningstar Alternative Investments Observer June 2016Page 42 of 49
Exhibit 10 Total Return % Q4 2015 by Category
%
Bear Market -9.72
Managed Futures -0.99
Multicurrency 1.71
Multialternative -0.09
Nontraditional Bond -0.35
Market Neutral 0.01
Long-Short 1.60
Barclays US Agg Bond -0.57
S&P 500 7.04
Source: Morningstar, Inc. Data as of 12/31/15.
Alternative mutual funds struggled in the fourth quarter of 2015, with multialternative, non-traditional- bond, managed-futures, and bear-market funds posting negative returns, losing 0.09%, 0.35%, 0.99%, and 9.72%, respectively. Multicurrency, long-short equity, and market neutral gained 1.71%, 1.60%, and 0.01%, respectively. The Barclays U.S. Aggregate Bond TR Index was negative at 0.57%, while the S&P 500 outperformed all of the alternative categories with returns of 7.04%. K
Fourth-Quarter 2015 Performance by Category
-10 -5 0 5 10

3
3
3
Morningstar Alternative Investments Observer June 2016Page 43 of 49
Exhibit 11 Three-Year Standard Deviation and Return
Market Neutral
Multicurrency
Multialternative
Long-Short Equity
Managed Futures
Bear Market
NontraditionalBond
Return %
10
5
–5
–10
–15
–20
0
4 8 12 160
Source: Morningstar, Inc. Data as of 12/31/15.
Of the seven alternative mutual fund category averages, five displayed positive returns over the three-year period ended Dec. 31, 2015. Long-short equity funds produced the highest three-year total returns with 4.84%, while bear-market and multicurrency funds had the lowest returns at negative 20.51% and negative 1.95%, respectively. Consequently, long-short equity funds also exhibited the best risk-adjusted return with a Sharpe ratio of 0.88, while bear-market and multicurrency funds displayed the lowest (negative 1.39 and negative 0.66). K
Risk Versus ReturnAlternative Mutual Funds

3
3
3
Morningstar Alternative Investments Observer June 2016Page 44 of 49
Exhibit 12 Net Fund Additions by Month
Month Added Removed
2014 October 50 62
November 129 277
December 95 106
2015 January 101 105
February 104 106
March 51 83
April 46 77
May 62 68
June 46 98
July 26 89
August 36 69
September 41 71
October 54 76
November 21 55
December 29 84
Source: Morningstar, Inc. Data as of 12/31/15.
In the fourth quarter of 2015, Morningstar’s hedge fund database experienced a net removal of 111 funds. During the quarter, the database saw 104 additions and 215 fund withdrawals. Funds drop out because they have liquidated or because they cease sharing performance data, typically because of poor performance. Fund additions occur as a result of new fund launches or a recent decision to supply data to Morningstar.
Morningstar Hedge Fund Database OverviewAs of 12-31-2015
0 50 100 150 200 250 300

3
3
3
Morningstar Alternative Investments Observer June 2016Page 45 of 49
Exhibit 13 Month-End Database Fund Levels
Month # of Funds
2014 October 5,566
November 5,560
December 5,513
2015 January 5,201
February 5,105
March 5,070
April 5,045
May 5,035
June 4,949
July 4,840
August 4,732
September 4,557
October 3,765
November 3,525
December 3.643
Source: Morningstar, Inc. Data as of 12/31/15.
As of Dec. 31, 2015, the Morningstar hedge fund database contained 3,643 funds that actively report performance and assets-under-management data.
Exhibit 14 Hedge Funds by Region# of Funds
North America/Caribbean 2,690
Africa 44
Asia/Australia 351
Europe 374
South America 0
Other 184
Total 3,643
Source: Morningstar, Inc. Data as of 12/31/15.
Approximately 77% of hedge funds in the Morningstar database are legally domiciled in the North American/Caribbean region, primarily in the Cayman Islands and United States. A large percentage of U.K. hedge funds are also domiciled in the Cayman Islands for tax and regulatory purposes. Roughly 11% of funds in Morningstar’s database are domiciled in Europe, including both European Union and non-EU jurisdictions, and about 10% of funds are domiciled in Asia and Australia, primarily in China. All figures are as of Dec. 31, 2015.
3,000 4,000 5,000 6,000

3
3
3
Morningstar Alternative Investments Observer June 2016Page 46 of 49
Exhibit 15 Hedge Funds by Location
North America / Caribbean 2,690Cayman Islands 1,084 United States 993 British Virgin Islands 218 Canada 201 Bermuda 150
Curaçao 34 Bahamas 9 Barbados 1 Anguilla —Panama —
St Kitts and Nevis — St. Vincent and the Grenadines —
Africa 44Mauritius 22 South Africa 20 United Arab Emirates 1Seychelles 1Swaziland —
Asia / Australia 351China 331 Australia 9 Hong Kong 2Isreal 2 Bahrain 2
Christmas Island 1Marshall Islands 1Vanuatu 1 Japan 1 India 1 Singapore —
Europe 374France 88Guernsey 78Italy 50Jersey 29 Luxembourg 26
United Kingdom 25 Netherlands 24Gibraltar 15 Malta 14 Germany 5
Austria 5Macedonia 4Switzerland 3 Channel Islands 3 Portugal 2
Ireland 1 Belgium 1Isle of Man 1 Sweden —Norway —
Liechtenstein — Spain —Finland —Andorra —Denmark —
Cyprus —
South America 0Brazil —Chile —
Source: Morningstar, Inc. Data as of 12/31/15.
Approximately 94% of the hedge funds in Morningstar's database are domiciled in the United States, the Cayman Islands, Asia, and Europe.

3
3
3
Morningstar Alternative Investments Observer June 2016Page 47 of 49
Exhibit 16 Top Ten Hedge Fund Service Providers
Type Rank Prime Broker % of Database
Prime Broker 1 Goldman Sachs 12.532 Morgan Stanley 12.423 Credit Suisse (Bahamas) Limited 9.464 UBS 8.105 J.P. Morgan 7.66
6 Deutche Bank 5.757 NewEdge (UK Branch) 4.518 Bank of America 2.719 Interactive Brokers LLC 2.32
10 Jefferies 2.12
Legal Counsel 1 Maples & Calder 9.612 Walkers 7.233 Seward & Kissel 5.084 Sidley Austin LLP 4.385 Ogier 3.75
6 Dechert LLC 3.607 Schulte Roth & Zabel 3.388 Akin Gump 2.529 Simmons & Simmons 2.30
10 Conyers Dill & Pearman 2.04
Auditor 1 PricewaterhouseCoopers 21.122 KPMG 19.143 Ernst & Young 18.704 Deloitte 10.715 Rothstein Kass 5.946 McGladrey LLP 3.517 BDO 2.838 Grant Thornton 1.719 Eisner Amper 1.60
10 Arthur Bell 1.36
Administrator 1 Citco 6.032 SS&C 3.763 BNY 2.984 Northern Trust 2.525 HSBC 2.20
6 State Street 2.027 Citi 1.958 Fund Partner Solutions 1.729 RBC 1.65
10 JP Funds Group 1.21
Source: Morningstar, Inc. Data as of 12/31/15.
Goldman Sachs, Morgan Stanley, and Credit Suisse are the largest prime brokerage-service providers to hedge funds in Morningstar’s database, serving a 34% share combined. The big four accounting firms are employed by approximately 70% of the hedge funds listed in Morningstar’s database, with PricewaterhouseCoopers leading the pack. Citco provides administration services to 6% of funds in Morningstar's database, while SS&C services about 4%. Maples & Calder, Walkers, and Seward & Kissel are the three largest legal-counsel providers to hedge funds in the database, with a combined market share of about 22%. This data is as of December 2015. K

3
3
3
Morningstar Alternative Investments Observer June 2016Page 48 of 49
Exhibit 17 Three-Year Correlations: Alternative Mutual Fund Categories
Category 1 2 3 4 5 6 7
Bear Market 1.00
Long-Short Equity –0.97 1.00
Managed Futures –0.02 0.06 1.00
Market Neutral –0.68 0.75 0.14 1.00
Multialternative –0.89 0.91 0.34 0.76 1.00
Multicurrency –0.47 0.38 –0.02 0.42 0.47 1.00
Nontraditional Bond –0.70 0.69 0.04 0.57 0.81 0.54 1.00
1.00 to 0.76 0.75 to 0.51 0.50 to 0.26 0.25 to 0.00
0.00 to –0.24 –0.25 to –0.49 –0.50 to –0.74 –0.75 to –1.00
Source: Morningstar Direct. Data as of 12/31/15.
Exhibit 18 Correlation of Alternative Mutual Funds to U.S. Stocks & Bonds
S&P 500 Correlation Barclays U.S. Aggregate Correlation
3 yr 5yr 10 yr 3 yr 5yr 10 yr
Bear Market –0.96 –0.96 –0.96 –0.04 0.13 –0.10Long-Short Equity 0.96 0.98 0.94 0.01 –0.19 0.02Managed Futures 0.14 0.11 — 0.48 0.26 —Market Neutral 0.73 0.64 0.20 0.18 0.02 –0.04Multialternative 0.87 0.89 0.92 0.33 0.08 0.19Multicurrency 0.47 0.68 0.46 0.29 0.08 0.08Nontraditional Bond 0.66 0.70 0.70 0.30 0.14 0.20
Source: Morningstar Direct. Data as of 12/31/15.
Alternative Mutual Fund Correlations

Morningstar Alternative Investments Observer June 2016Page 49 of 49
About Morningstar® Manager ResearchMorningstar Manager Research provides independent, fundamental analysis on managed investmentstrategies. Analyst views are expressed in the form of Analyst Ratings, which are derived throughresearch of five key pillars—Process, Performance, Parent, People, and Price. A global research teamissues detailed analyst reports on strategies that span vehicle, asset class, and geography.
For More [email protected]
22 West Washington StreetChicago, IL 60602 USA
©2016 Morningstar. All Rights Reserved. The information contained in the Alternative Investments Observer (“Report”): (1) is proprietary to Morningstar, Inc., and its affiliates (collectively, “Morningstar”) and/or their content providers; (2) may not be copied or distributed by any means; and (3) is not warranted to be accurate, complete, or timely. For certain types of investment vehicles (e.g., hedge funds) Morningstar depends on the investment vehicle itself to provide Morningstar with accurate and complete data. To the extent that one or more of these investment vehicles do not provide Morningstar with data or these data are deficient in any way, the data and statistics provided by Morningstar may be compromised. In addition, because the data contained in Morningstar’s database are primarily backward looking (i.e., they’re comprised of historical performance statistics), neither the data nor Morningstar’s analysis of them can be relied upon to predict or assess future performance—whether of an individual investment (each, a “Fund”), any particular Fund industry segment or the totality of all Funds in the industry. Unless otherwise specified, the data set out in this Report represent summary data for those reporting Funds comprising the applicable industry segment or the industry as a whole (to the extent included in Morningstar’s database). Please note that, as a general matter, any return or related statistics that are based upon a limited number of data points are considered statistically suspect and, therefore, may be of limited value. By making the Report available, Morningstar is not providing investment advice or acting as an investment advisor to anyone in any jurisdiction. All data, information and opinions are subject to change without notice and certain of these opinions may not be consistent across Morningstar. Neither Morningstar nor its content providers are responsible for any damages or losses arising from any use of the content of this Report or any information contained in or derived from it. “Morningstar” and the Morningstar logo are registered marks of Morningstar, Inc. All other marks are the property of their respective owners.