alternative fuel price report january 2008 to the january 2008 issue of the clean cities alternative...
TRANSCRIPT

Cleaan CCitiees Allternnativve FFuell Priice RRepoort
Jannuary 20088

CLEAN CITIES ALTERNATIVE FUEL PRICE REPORT JANUARY 2008
WELCOME!
Welcome to the January 2008 issue of the Clean Cities Alternative Fuel Price Report, a quarterly report designed to keep you up to date on the prices of alternative fuels and conventional fuels in the U.S. This issue summarizes prices that were collected between January 21, 2008 and January 31, 2008 from Clean Cities Coordinators, fuel providers, and other Clean Cities stakeholders.
METHODOLOGY
In order to collect price information for both alternative fuels and conventional fuels from areas across the country, Clean Cities Coordinators, fuel providers, and other key stakeholders were contacted to request that they provide prices for fuels in their area on a voluntary basis. Prices were collected on all major alternative fuels currently in widespread use (natural gas, propane, biodiesel, and ethanol), as well as prices for conventional fuels at stations that also sell alternative fuels (or stations nearby). Prices were collected from public and private refueling stations throughout the country, and were collected between January 21, 2008 and January 31, 2008. Prices were then averaged in order to determine regional price trends by fuel and variability in fuel price within regions (and among regions). Prices in this report are grouped by U.S. areas as defined by the Petroleum Administration for Defense Districts (PADD): the districts are illustrated in the map to the right.
The prices collected for this report represent retail, at-the-pump sales prices for each fuel, including Federal and state motor fuel taxes. In some cases, prices were collected from government or utility refueling facilities and these taxes were not included in the reported price. In these instances, although these users are not required to pay these taxes, the taxes were added to the reported price to provide a more representative basis for comparison of fuel prices for the purpose of this report. In some cases, states may charge a flat annual fee for motor fuel taxes (especially for gaseous fuels like CNG): these fees are not considered in the prices reported in these pages.
Page 2

CLEAN CITIES ALTERNATIVE FUEL PRICE REPORT JANUARY 2008 SUMMARY OF CURRENT REPORT INFORMATION
Overall nationwide average prices for Table 1. Overall Average Fuel Prices conventional and alternative fuels are shown in Table 1. 1 As this table illustrates, alternative fuel prices
Nationwide Nationwide Change in Price Units of Average Price for Average Price for This Report vs. Measurement Fuel This Report Fuel Last Report Last Report
relative to conventional fuels vary, Gasoline (Regular) $2.99 $2.76 $0.23 per gallon with some (100% biodiesel) higher and some (propane, E85 and CNG)
CNG $1.93 $1.77 $0.16 per GGE
Diesel $3.40 $3.11 $0.29 per gallon
lower. CNG is about a dollar less than gasoline on an energy-equivalent basis, while E85 is about 48 cents less
Ethanol (E85) $2.51 $2.40 $0.11 per gallon
Propane $3.12 $2.75 $0.37 per gallon per gallon than gasoline. Propane is about 13 cents per gallon more than gasoline. B2/B5 prices for low-level Biodiesel (B2-B5) $3.31 $2.99 $0.32 per gallon
blends are lower than regular diesel by about 9 cents, and B20 blends are the same as regular diesel. B99/B100 blends have a cost of about 29 cents per gallon more than regular diesel.
Biodiesel (B20) $3.37 $3.08 $0.29 per gallon
Biodiesel (B99-B100) $3.69 $3.38 $0.31 per gallon
Relative to the last report from October 2007, the average prices for all of the fuels included in this price report have increased, by as much as 37 cents. It should be noted that the price increases or decreases could be attributed both to an actual increase in price and to a slightly differing sample of prices (both location and quantity).
Prices in this report were collected and are reported in Table 2. January 2008 Overall Average Fuel Prices on the units in which they are typically sold (dollars per Energy-Equivalent Basis gallon or dollars per gasoline-gallon equivalent). Because of differing energy contents per gallon for these fuels, the price paid per unit of energy content can differ somewhat from the price paid per gallon. Table 2 illustrates the fuel prices from Table 1 for the current reporting period normalized to a price per gasoline-gallon equivalent, per diesel gallon
Nationwide Nationwide Nationwide Average Price in Average Price in Average Price in Gasoline Gallon Diesel Gallon Dollars per
Equivalents Equivalents Million Btu
CNG $1.93 $2.15 $16.72 equivalent, or per million Btu of energy. This calculation involves the use of nominal lower heating values in Btu per gallon of fuel which can be found in Propane $4.31 $4.80 $37.33 the Transportation Energy Data Book2. Note that prices for the alternative fuels in terms of cost per
Ethanol (E85) $3.55 $3.96 $30.79
Biodiesel (B20) $3.08 $3.43 $26.69
Biodiesel (B2-B5) $2.98 $3.32 $25.79 gallon equivalent are generally higher than their cost per gallon because of their lower energy content per gallon3. It has been seen, however, that consumer interest in alternative fuels increases as the price differential per gallon increases, even if that differential does not directly translate to savings on an energy-equivalent basis.
Biodiesel (B99-B100) $3.63 $4.05 $31.49
Gasoline $2.99 $3.33 $25.90
Diesel $3.05 $3.40 $26.40
1 A very small sample of hydrogen information was received (7 prices total): average price for hydrogen was $17.69 per gge in this report. 2 A listing of the conversion factors used appears as an appendix at the end of this report. 3 For ethanol flexible-fuel vehicles, the actual difference in energy cost per mile is somewhat less than would be calculated simply on the difference in energy content of the fuels, as some sources have noted many FFVs can achieve better energy efficiency (miles per unit of energy) on E85 than on gasoline. This effect is not currently included in these calculations as the magnitude of the effect varies by vehicle.
Page 3

CLEAN CITIES ALTERNATIVE FUEL PRICE REPORT JANUARY 2008 GASOLINE AND DIESEL PRICES
Average prices for gasoline Table 3. Average Gasoline and Diesel Prices by Region from Clean Cities Sources and diesel as collected by Clean Cities coordinators and other stakeholders (supplemented where necessary with other
Regular Gasoline Information Diesel Information Reported by Clean Cities ($/gal) Reported by Clean Cities ($/gal)
Average Price Number of Data Average Price Number of Data / Standard Points / Standard Points
Deviation of Price Deviation of Price
reference sources for New England $3.21 / 0.15 36 $3.60 / 0.12 30
Lower Atlantic $2.97 / 0.12 74 $3.36 / 0.12 60These prices were collected
conventional fuels) are illustrated in Table 3. Central Atlantic $3.11 / 0.16 40 $3.53 / 0.15 38
from refueling stations selling both conventional fuels and alternative fuels, and from conventional
Midwest $2.93 / 0.11 192 $3.37 / 0.32 109
Gulf Coast $2.89 / 0.05 43 $3.30 / 0.07 38
Rocky Mountain $2.88 / 0.13 35 $3.26 / 0.23 43
alternative fuel stations. About 500 price points
NATIONAL AVERAGE $2.99 / 0.17 501 $3.40 / 0.24 385
fuel refueling stations near West Coast $3.09 / 0.21 81 $3.47 / 0.18 67
were collected for gasoline and 385 for diesel, with average prices for gasoline ranging from a low of $2.88 per gallon in the Rocky Mountain region to a high of $3.21 per gallon in New England. Diesel prices ranged from $3.26 in the Rocky Mountain region to $3.60 in New England. Because prices for conventional fuels were collected from stations and regions providing alternative fuel price information, data collection was not uniform across the regions of the country. The information is, however, representative of refueling stations selling both alternative fuels and conventional fuels.
Table 4 illustrates average prices as provided by the DOE Table 4. EIA Gasoline and Diesel Price Averages Energy Information Administration (EIA) on the petroleum information section of its website (http://www.eia.doe.gov/oil_gas/petroleum/info_glance/pet roleum.html). These prices are averages of prices from a
Gasoline Average Diesel Average Price from EIA, Price from EIA,
Week of 1/21/08 Week of 1/21/08
New England $3.09 $3.59 selection of 800 retail fuel stations across the country. Note that the average nationwide price from EIA matches
Lower Atlantic $3.02 $3.26
Central Atlantic $3.11 $3.47
relatively closely with the averages from the station information collected from Clean Cities stakeholders. Given the relatively good match of averages calculated from Gulf Coast $2.90 $3.22 EIA and from Clean Cities data, comparisons in this document between conventional fuel prices and alternative fuel prices will be made using prices collected from Clean West Coast $3.16 $3.33
Cities representatives wherever possible, as these prices are most representative of stations selling both conventional and alternative fuels.
Midwest $2.96 $3.23
Rocky Mountain $2.93 $3.23
NATIONAL AVERAGE $3.02 $3.27
Page 4

CLEAN CITIES ALTERNATIVE FUEL PRICE REPORT JANUARY 2008 COMPRESSED NATURAL GAS (RELATIVE TO GASOLINE)
Average prices for Table 5. Compressed Natural Gas Average Prices by Region from Clean Cities Sources compressed natural gas for vehicle use are illustrated in Table 5, grouped by region. Information on prices for regular gasoline as provided by Clean New England $2.33 / 0.49 19 $3.21 / 0.15
Natural Gas (CNG) Information Regular Gasoline Information Reported by Clean Cities ($/gge) Reported by Clean Cities ($/gal)
Average Price Number of Data Average Price Number of Data / Standard Points / Standard Points
Deviation of Price Deviation of Price
36
Lower Atlantic $1.86 / 0.50 5 $2.97 / 0.12 74were collected from across
Cities representatives is also shown. These prices Central Atlantic $2.41 / 0.31 50 $3.11 / 0.16 40
the country from Clean Cities Coordinators, fuel providers, and other stakeholders on a
Midwest $1.78 / 0.35 20 $2.93 / 0.11 192
Gulf Coast $2.20 / 0.20 20 $2.89 / 0.05 43
Rocky Mountain $1.21 / 0.79 103 $2.88 / 0.13 35
voluntary basis. Just under West Coast $2.44 / 0.33 78 $3.09 / 0.21 81
three hundred CNG prices were collected in this report4.
NATIONAL AVERAGE $1.93 / 0.77 295 $2.99 / 0.17 501
As Table 5 illustrates by region, CNG has a lower price than gasoline for all regions of the country for which prices were obtained, with the largest difference ($1.67 per gge) being in the Rocky Mountain region. On average, CNG costs about $1.06 less than gasoline on a per gasoline gallon equivalent basis. Variability of CNG prices was higher (based on a standard deviation analysis) than variability of gasoline prices.
The map to the right illustrates some cost differentials by state for natural gas relative to gasoline, based on differentials between natural gas prices and gasoline prices for each state (versus the regional averages illustrated in Table 5). In this map, negative numbers represent costs for natural gas lower than costs for gasoline. States not highlighted with a color did not have any natural gas data points in the current report. As the map illustrates, CNG prices were favorable relative to gasoline for all of the states for which information was collected.
4 Prices for CNG were provided by the individual stakeholders in gasoline-gallon equivalents from the “price at the pump.” It should be noted that the internal conversion factor between the physical quantities of gas delivered and gge was not collected from each of the refueling stations. Regional differences in gas heat content relative to the internal pump conversion factor may change the price per gge: these differences were not determined for this report, however.
Page 5

CLEAN CITIES ALTERNATIVE FUEL PRICE REPORT JANUARY 2008 COMPRESSED NATURAL GAS (RELATIVE TO DIESEL)
Average prices for Table 6. Compressed Natural Gas Average Prices by Region from Clean Cities Sources compressed natural gas for vehicle use are illustrated in Table 6, grouped by region. Information on prices for conventional
Natural Gas (CNG) Information Diesel Information Reported by Clean Cities ($/dge) Reported by Clean Cities ($/gal)
Average Price Number of Data Average Price Number of Data / Standard Points / Standard Points
Deviation of Price Deviation of Price
diesel fuel as provided by New England $2.61 / 0.55 19 $3.60 / 0.12 30
Lower Atlantic $2.07 / 0.56 5 $3.36 / 0.12 60sources is also shown.
representatives from Clean Cities and supplemental Central Atlantic $2.69 / 0.35 50 $3.53 / 0.15 38
These prices were collected from across the country from Clean Cities Coordinators, fuel
Midwest $1.99 / 0.39 20 $3.37 / 0.32 109
Gulf Coast $2.45 / 0.22 20 $3.30 / 0.07 38
Rocky Mountain $1.35 / 0.88 103 $3.26 / 0.23 43
providers, and other West Coast $2.73 / 0.37 78 $3.47 / 0.18 67
the CNG prices in Table 6 are the same group of prices as for Table 5, but converted to a cost per diesel gallon equivalent basis, in order to compare directly with diesel prices.
As Table 6 illustrates by region, CNG has a lower price than diesel for all regions of the country, with the largest difference ($1.90 per dge) being in the Rocky Mountain region. On average, CNG costs about $1.25 less than diesel on a per diesel gallon equivalent basis. Based on standard deviation calculations, CNG appears to have had more variability in price during this time period relative to diesel fuel.
The map to the right illustrates some cost differentials by state for natural gas relative to diesel, based on differentials between natural gas prices and diesel prices for each state (versus the regional averages illustrated in Table 6). In this map, negative numbers represent costs for natural gas lower than costs for diesel. States not highlighted with a color did not have any natural gas data points in the current report. As with the comparison to gasoline, natural gas prices relative to diesel were also generally favorable, as the map shows.
stakeholders on a voluntary basis. Note that
NATIONAL AVERAGE $2.15 / 0.86 295 $3.40 / 0.24 385
Page 6

CLEAN CITIES ALTERNATIVE FUEL PRICE REPORT JANUARY 2008 ETHANOL (E85)
Table 7. Ethanol (E85) Average Prices by Region from Clean Cities Sources Average prices for ethanol in an 85% blend with 15% gasoline (E85) are illustrated in Table 7, grouped by region. Information on prices
New England $4.50 / -- 1 $3.21 / 0.15 36
Ethanol (E85) Information Regular Gasoline Information Reported by Clean Cities ($ per gal) Reported by Clean Cities ($ per gal)
Average Price Number of Data Average Price Number of Data / Standard Points / Standard Points
Deviation of Price Deviation of Price
for regular gasoline as provided by Clean Cities representatives is also shown. These prices were collected from
Central Atlantic $2.68 / 0.29 23 $3.11 / 0.16 40
Lower Atlantic $2.74 / 0.18 27 $2.97 / 0.12 74
Midwest $2.50 / 0.21 123 $2.93 / 0.11 192
across the country from Gulf Coast $2.61 / 0.14 10 $2.89 / 0.05 43
Clean Cities Coordinators, fuel providers, and other stakeholders on a voluntary basis. Over
Rocky Mountain $2.27 / 0.24 56 $2.88 / 0.13 35
West Coast $2.62 / 0.18 22 $3.09 / 0.21 81
NATIONAL AVERAGE $2.51 / 0.29 262 $2.99 / 0.17 501
250 prices for ethanol were collected in this data collection effort. Data collection was not uniform across regions of the country, but as the majority of operational ethanol stations are in the Midwest, data collection generally mirrored the density of refueling.
Note that E85 has a lower average price per gallon than regular gasoline in all regions except New England (see Table 7). On average, E85 is about 48 cents lower in price than regular gasoline on a per-gallon basis, with the largest average differential (60 cents) being found in the Rocky Mountain region. Based on the calculated standard deviations in this set of E85 price information, it can be seen that price variability for E85 was somewhat larger than the price variability for gasoline for the period.
The map to the right illustrates some cost differentials between E85 and regular gasoline by state, based on differentials between E85 prices and gasoline prices for each state (versus the regional averages illustrated in Table 7). In this map, negative numbers represent costs for E85 lower than for gasoline, and positive numbers represent costs for E85 higher than gasoline. States not highlighted with a color did not have any E85 data points in the current report. In the time period for this report, E85 cost less per gallon than gasoline for much of the area for which prices were available: the best pricing was in the upper Midwest, as would be generally expected.
Page 7

CLEAN CITIES ALTERNATIVE FUEL PRICE REPORT JANUARY 2008 PROPANE
Table 8. Propane Average Prices by Region from Clean Cities Sources Average prices for propane are illustrated in Table 8, grouped by region. Information on prices for regular gasoline as provided by
Propane Information Regular Gasoline Information Reported by Clean Cities ($ per gal) Reported by Clean Cities ($ per gal)
Average Price Number of Data Average Price Number of Data / Standard Points / Standard Points
Deviation of Price Deviation of Price
New England $2.99 / 0.24 2 $3.21 / 0.15 36 representatives from Clean Cities is also shown. These prices were collected from across the country from
Central Atlantic $3.82 / 0.77 22 $3.11 / 0.16 40
Lower Atlantic $3.04 / 0.81 16 $2.97 / 0.12 74
Midwest $2.99 / 0.43 13 $2.93 / 0.11 192
Clean Cities Gulf Coast $2.82 / 0.75 6 $2.89 / 0.05 43
Coordinators, fuel providers, and other stakeholders on a voluntary basis. Almost 100 propane prices were
Rocky Mountain $2.74 / 0.55 23 $2.88 / 0.13 35
West Coast $3.02 / 0.83 17 $3.09 / 0.21 81
NATIONAL AVERAGE $3.12 / 0.78 99 $2.99 / 0.17 501
collected in this reporting period.
As Table 8 illustrates regionally, propane prices are lower in some regions (New England, Gulf Coast, Rocky Mountain, and West Coast) and higher in the remainder. Overall, propane was about 13 cents per gallon more than gasoline. New England had the most favorable price situation in this report, with propane at 22 cents per gallon less than gasoline on average. Based on calculations of standard deviation in prices, it can be seen that propane prices for vehicle use seems to have varied more than gasoline prices during this sampling period.
The map to the right illustrates some cost differentials between propane and regular gasoline on a per-gallon basis, based on differentials between propane prices and gasoline prices for each state (versus the regional averages illustrated in Table 8). In this map, negative numbers represent costs for propane lower than costs for gasoline, and positive numbers represent propane prices higher than gasoline. States not highlighted with a color did not have any propane data points in the current report. Propane prices were generally favorable in Texas, California, Utah, and several East Coast states.
Page 8

CLEAN CITIES ALTERNATIVE FUEL PRICE REPORT JANUARY 2008 BIODIESEL BLENDS: B20
Table 9. Biodiesel (B20) Average Prices by Region from Clean Cities Sources Average prices for biodiesel in a 20% blend with 80% diesel (B20) are illustrated in Table 9, grouped by region. Information on prices
Biodiesel (B20) Information Diesel Information Reported by Clean Cities ($ per gal) Reported by Clean Cities ($ per gal)
Average Price Approximate Average Price Approximate Number / Standard Number of / Standard of Stations
Deviation of Price Stations Deviation of Price
New England $3.49 / 0.30 20 $3.60 / 0.12 30for regular diesel as provided by Clean Cities representatives is also shown. These prices were collected from
Central Atlantic $3.31 / 0.24 13 $3.53 / 0.15 38
Lower Atlantic $3.36 / 0.14 20 $3.36 / 0.12 60
Midwest $3.31 / 0.28 24 $3.37 / 0.32 109
across the country from Gulf Coast $3.37 / 0.12 5 $3.30 / 0.07 38
Clean Cities Coordinators, fuel providers, and other stakeholders on a voluntary basis. Just
Rocky Mountain $3.32 / 0.23 30 $3.26 / 0.23 43
West Coast $3.45 / 0.24 22 $3.47 / 0.18 67
NATIONAL AVERAGE $3.37 / 0.25 134 $3.40 / 0.24 385
over 100 prices were obtained for B20 across the country.
As Table 9 illustrates, biodiesel in a B20 blend has an average price per gallon that is generally close to conventional diesel fuel (ranging from 8 cents more to 22 cents less per gallon). Based on calculations of standard deviation on B20 prices, variability in B20 prices was relatively close to the variability in price of conventional diesel by region (as would probably be expected, given that 80% of the B20 blend is regular diesel fuel). On average in the U.S., biodiesel in a B20 blend costs about the same per gallon as conventional diesel fuel based on current information.
The map to the right illustrates some cost differentials between B20 and diesel on a per-gallon basis, based on differentials between biodiesel prices and gasoline prices for each state (versus the regional averages illustrated in Table 9). In this map, negative numbers represent costs for B20 lower than costs for diesel, and positive numbers represent B20 prices higher than diesel. States not highlighted with a color did not have any B20 data points in the current report. B20 had favorable pricing in Pennsylvania and New York in this time period.
Page 9
CLEAN CITIES ALTERNATIVE FUEL PRICE REPORT JANUARY 2008 BIODIESEL BLENDS: LOW-LEVEL (B2-B5)
Table 10. Biodiesel (B2-B5) Average Prices by Region from Clean Cities Sources Average prices for biodiesel in lower-level blends (2-5% biodiesel in diesel fuel) are illustrated in Table 10, grouped by region.
prices New England -- / -- - $3.60 / 0.12 30
Biodiesel (B2 B5) Information Diesel Information Reported by Clean Cities ($ per gal) Reported by Clean Cities ($ per gal)
Average Price Number of Data Average Price Number of Data / Standard Points / Standard Points
Deviation of Price Deviation of Price
Information on
representatives is also Midwest $3.30 / 0.11 17 $3.37 / 0.32 109 shown. These prices
were collected from Gulf Coast $3.19 / -- 1 $3.30 / 0.07 38
West Coast $3.38 / 0.08 7 $3.47 / 0.18 67 Coordinators, fuel providers, and other stakeholders on a voluntary basis. A total of 54 prices were obtained from areas offering low-level biodiesel blends.
NATIONAL AVERAGE $3.31 / 0.20 54 $3.40 / 0.24 385
As Table 10 illustrates regionally, average prices for low-level blends of biodiesel are relatively close to average diesel prices (from 15 cents more to 21 cents less than diesel per gallon). Differences in price between low-level biodiesel blends and regular diesel could be attributed to the relatively small sample size. The Central Atlantic region had the most favorable price structure for low-level biodiesel blends during this time period.
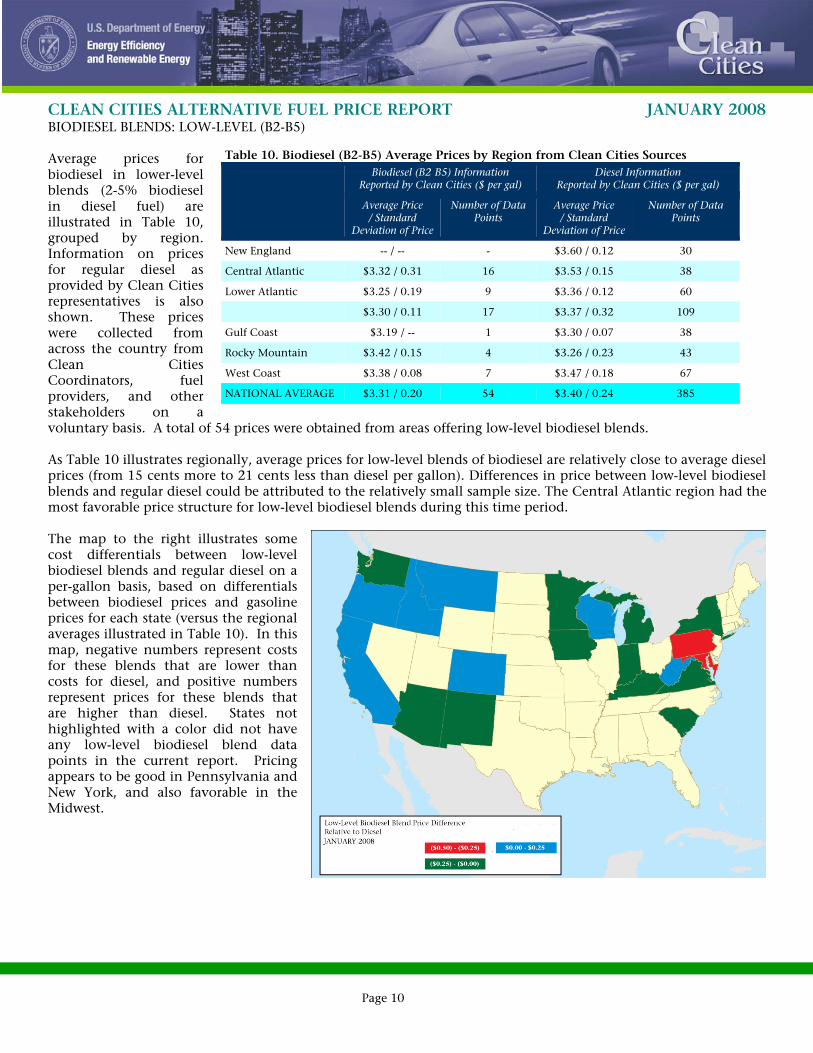
The map to the right illustrates some cost differentials between low-level biodiesel blends and regular diesel on a per-gallon basis, based on differentials between biodiesel prices and gasoline prices for each state (versus the regional averages illustrated in Table 10). In this map, negative numbers represent costs for these blends that are lower than costs for diesel, and positive numbers represent prices for these blends that are higher than diesel. States not highlighted with a color did not have any low-level biodiesel blend data points in the current report. Pricing appears to be good in Pennsylvania and New York, and also favorable in the Midwest.
for regular diesel as provided by Clean Cities
Central Atlantic $3.32 / 0.31 16 $3.53 / 0.15 38
Lower Atlantic $3.25 / 0.19 9 $3.36 / 0.12 60
across the country from Clean Cities
Rocky Mountain $3.42 / 0.15 4 $3.26 / 0.23 43
Page 10

CLEAN CITIES ALTERNATIVE FUEL PRICE REPORT JANUARY 2008 BIODIESEL BLENDS: B100/B99
Table 11. Biodiesel (B99-B100) Average Prices by Region from Clean Cities Sources Average prices for high-level blends of biodiesel (99% or 100% biodiesel with diesel fuel) are illustrated in Table 11, grouped by region.
prices New England -- / -- -- $3.60 / 0.12 30
Biodiesel (B99 B100) Information Diesel Information Reported by Clean Cities ($ per gal) Reported by Clean Cities ($ per gal)
Average Price Number of Data Average Price Number of Data / Standard Points / Standard Points
Deviation of Price Deviation of Price
Information on
representatives is also Midwest $3.54 / 0.43 4 $3.37 / 0.32 109 shown. These prices
were collected from Gulf Coast $3.19 / -- 1 $3.30 / 0.07 38
West Coast $3.66 /0.28 19 $3.47 / 0.18 67Coordinators, fuel providers, and other stakeholders on a voluntary basis. About 37 price points were collected from stations offering B99/B100 for sale across the country.
NATIONAL AVERAGE $3.69 / 0.39 37 $3.40 / 0.24 385
As Table 11 illustrates regionally, the cost of B99/B100 is higher than the cost of diesel fuel per gallon in the regions for which data were collected (except the Gulf Coast), with the highest differential being 58 cents in the Rocky Mountain region. On average across the nation, B99/B100 is about 29 cents per gallon higher than regular diesel. Based on standard deviation calculations on these price points, it appears that prices for B99/B100 varied more widely in this time period than regular diesel.
The map to the right illustrates some cost differentials between high-level biodiesel blends and regular diesel on a per-gallon basis, based on differentials between biodiesel prices and gasoline prices for each state (versus the regional averages illustrated in Table 11). In this map, negative numbers represent costs for these blends that are lower than costs for diesel, and positive numbers represent prices for these blends that are higher than diesel. States not highlighted with a color did not have any high-level biodiesel blend data points in the current report. Prices for B100 were generally higher than for diesel in the areas for which prices are available, save for Hawaii, Arizona, Oklahoma, Texas, and Florida.
for regular diesel as provided by Clean Cities
Central Atlantic $3.94 / 0.66 6 $3.53 / 0.15 38
Lower Atlantic $3.64 / 0.31 5 $3.36 / 0.12 60
across the country from Clean Cities
Rocky Mountain $3.85 / 0.35 2 $3.26 / 0.23 43
Page 11

CLEAN CITIES ALTERNATIVE FUEL PRICE REPORT JANUARY 2008 COMPARISON OF PRICES OF THIS REPORT VERSUS LAST REPORT
Table 12 below summarizes the average prices collected for this report by region, and compares them to prices collected in the Price Report from October 2007. Virtually all fuels increased in price somewhat in each region between October 2007 and January 2008. It should be noted that a portion of the price changes could be attributed to differing sample sizes and composition between the two reports.
Table 12. Comparison of Prices, Last Price Report versus Current Price Report
Price for January 2008 Period
Price for October 2007 Period
Price Differential January vs. October
Gasoline ($ per gallon) National Average $2.99 $2.76 $0.23 / 8%
New England $3.21 $2.84 $0.37 / 13%
Central Atlantic $3.11 $2.77 $0.34 / 12%
Lower Atlantic $2.97 $2.71 $0.26 / 9%
Midwest $2.93 $2.72 $0.21 / 8%
Gulf Coast $2.89 $2.69 $0.20 / 7%
Rocky Mountain $2.88 $2.84 $0.04 / 1%
West Coast $3.09 $2.92 $0.17 / 6%
Diesel ($ per gallon) National Average $3.40 $3.11 $0.29 / 9%
New England $3.60 $3.16 $0.44 / 14%
Central Atlantic $3.53 $3.13 $0.40 / 13%
Lower Atlantic $3.36 $3.01 $0.35 / 11%
Midwest $3.37 $3.09 $0.28 / 9%
Gulf Coast $3.30 $2.98 $0.32 / 11%
Rocky Mountain $3.26 $3.16 $0.10 / 3%
West Coast $3.47 $3.21 $0.26 / 8%
Compressed Natural Gas ($ per GGE) National Average $1.93 $1.77 $0.16 / 9%
New England $2.33 $2.30 $0.03 / 1%
Central Atlantic $2.41 $2.10 $0.31 / 15%
Lower Atlantic $1.86 $1.74 $0.12 / 7%
Midwest $1.78 $1.81 ($0.03) / (2%)
Gulf Coast $2.20 $2.21 ($0.01) / (1%)
Rocky Mountain $1.21 $1.06 $0.15 / 14%
West Coast $2.44 $2.33 $0.11 / 5%
Ethanol (E85) ($ per gallon) National Average $2.51 $2.40 $0.11 / 5%
New England $4.50 -- -
Central Atlantic $2.68 $2.49 $0.19 / 8%
Lower Atlantic $2.74 $2.49 $0.25 / 10%
Midwest $2.50 $2.29 $0.21 / 9%
Gulf Coast $2.61 $2.57 $0.04 / 2%
Rocky Mountain $2.27 $2.63 ($0.36) / (14%)
West Coast $2.62 $2.55 $0.07 / 3%
Page 12

CLEAN CITIES ALTERNATIVE FUEL PRICE REPORT JANUARY 2008 Table 12. Comparison of Prices, Last Price Report versus Current Price Report
Price for January 2008 Period
Price for October 2007 Period
Price Differential January vs. October
Propane ($ per gallon) National Average $3.12 $2.75 $0.37 / 13%
New England $2.99 $2.43 $0.56 / 23%
Central Atlantic $3.82 $3.53 $0.29 / 8%
Lower Atlantic $3.04 $2.73 $0.31 / 11%
Midwest $2.99 $2.66 $0.33 / 12%
Gulf Coast $2.82 $2.35 $0.47 / 20%
Rocky Mountain $2.74 $2.26 $0.48 / 21%
West Coast $3.02 $2.63 $0.39 / 15%
Biodiesel (B20) ($ per gallon) National Average $3.37 $3.08 $0.29 / 10%
New England $3.49 $3.10 $0.39 / 13%
Central Atlantic $3.31 $2.86 $0.45 / 16%
Lower Atlantic $3.36 $3.00 $0.36 / 12%
Midwest $3.31 $3.00 $0.31 / 10%
Gulf Coast $3.37 $2.96 $0.41 / 14%
Rocky Mountain $3.32 $3.30 $0.02 / 1%
West Coast $3.45 $3.34 $0.11 / 3%
Biodiesel (B2-B5) ($ per gallon) National Average $3.31 $2.99 $0.32 / 11%
New England -- $3.07 -
Central Atlantic $3.32 $3.10 $0.22 / 7%
Lower Atlantic $3.25 $2.96 $0.29 / 10%
Midwest $3.30 $2.99 $0.31 / 10%
Gulf Coast $3.19 $2.94 $0.25 / 9%
Rocky Mountain $3.42 $3.19 $0.23 / 7%
West Coast $3.38 $3.10 $0.28 / 9%
Biodiesel (B99-B100) ($ per gallon) National Average $3.69 $3.38 $0.31 / 9%
New England -- -- -
Central Atlantic $3.94 $3.54 $0.40 / 11%
Lower Atlantic $3.64 $3.38 $0.26 / 8%
Midwest $3.54 $3.07 $0.47 / 15%
Gulf Coast $3.19 $2.94 $0.25 / 9%
Rocky Mountain $3.85 - -
West Coast $3.66 $3.48 $0.18 / 5%
Page 13

CLEAN CITIES ALTERNATIVE FUEL PRICE REPORT JANUARY 2008 HISTORICAL ALTERNATIVE FUEL PRICES FROM PREVIOUS REPORTS
The graphs on this page illustrate the historical prices for the alternative fuels included in these reports (specifically natural gas, propane, ethanol, and biodiesel) relative to gasoline and diesel. These graphs include prices collected as part of the current Price Report activity, which began in September 2005. Natural gas (in GGE), propane, and ethanol have been graphed against gasoline prices, while natural gas (in DGE) and biodiesel have been graphed against diesel prices.
$1.50
$1.70
$1.90
$2.10
$2.30
$2.50
$2.70
$2.90
$3.10
$3.30
Sep
05
Oct
05
Nov
05
Dec
05
Jan
06
Feb
06
Mar
06
Apr
06
May
06
Jun
06
Jul 0
6
Aug
06
Sep
06
Oct
06
Nov
06
Dec
06
Jan
07
Feb
07
Mar
07
Apr
07
May
07
Jun
07
Jul 0
7
Aug
07
Sep
07
Oct
07
Nov
07
Dec
07
Jan
08
Price
per
Gallon
Gasoline
Natural Gas (GGE)
Propane
Ethanol (E85)
Alternative FuelPrices versus Gasoline
$1.50
$2.00
$2.50
$3.00
$3.50
$4.00
Sep
05
Oct
05
Nov
05
Dec
05
Jan
06
Feb
06
Mar
06
Apr
06
May
06
Jun
06
Jul 0
6
Aug
06
Sep
06
Oct
06
Nov
06
Dec
06
Jan
07
Feb
07
Mar
07
Apr
07
May
07
Jun
07
Jul 0
7
Aug
07
Sep
07
Oct
07
Nov
07
Dec
07
Jan
08
Price
per
Gallon
Diesel
Natural Gas (DGE)
Biodiesel (B20)
Biodiesel (B2/B5)
Biodiesel (B99/B100)
Alternative FuelPrices versus Diesel
Page 14

CLEAN CITIES ALTERNATIVE FUEL PRICE REPORT JANUARY 2008
ILLUSTRATION OF CONVERSION FACTORS FOR FUELS
The standard lower heating values for fuels from the Transportation Energy Databook 26 are listed below.
Lower Heating Value
Gasoline 115,400 BTU/gal
Diesel 128,700 BTU/gal
Compressed Natural Gas 960 BTU/cubic foot
Ethanol 75,670 BTU/gal
Propane 83,500 BTU/gal
Biodiesel 117,093 BTU/gal
Conversion factors to establish prices in dollars per gasoline equivalent gallon are illustrated below, and were developed using the lower heating values outlined above. The conversion factors are derived in the manner shown in the graphic to the right.
In the case of CNG, prices are provided to us in GGE, so no conversion is necessary (the representative heating value of CNG is provided above as a reference). To convert a price from dollars per gallon to dollars per gasoline equivalent gallon, multiply the price per gallon by the conversion factor.
Conversion factor to GGE
CNG 1.00
Ethanol (E85)
Propane
Biodiesel (B20)
Biodiesel (B2)
Biodiesel (B100)
1.41
1.38
0.91
0.90
0.99
Conversion factors to establish prices in dollars per diesel equivalent gallon are illustrated below, and were developed using the lower heating values outlined above. To convert a price from dollars per gallon to dollars per diesel equivalent gallon, multiply the price per gallon by the conversion factor.
Conversion factor to DGE
Ethanol (E85) 1.58
Propane 1.54
CNG (in GGE) 1.12
Biodiesel (B20) 1.02
Biodiesel (B2) 1.00
Biodiesel (B100) 1.10
Page 15

CLEAN CITIES ALTERNATIVE FUEL PRICE REPORT JANUARY 2008
ACKNOWLEDGEMENTS
The authors would like to acknowledge all of the contributors from the Clean Cities community who have provided prices for this report: we sincerely appreciate your continued dedication to the success of this report. The authors would also like to acknowledge the continued support of DOE for developing this report.
WOULD YOU LIKE TO PARTICIPATE?
If you would like to provide prices for alternative fuels in your region and be part of the data collection effort for this report, please contact:
Michael D. Laughlin New West Technologies, LLC 4351 Garden City Drive, Suite 600 Landover, MD 20785 (301) 429-1180 x26 (phone) (301) 429-1185 (FAX) [email protected]
DISCLAIMER
This document highlights work sponsored by agencies of the U.S. Government. Neither the U.S. Government nor any agency thereof, nor any of their employees, makes any warranty, express or implied, or assumes any legal liability or responsibility for the accuracy, completeness, or usefulness of any information, apparatus, product, or process disclosed, or represents that its use would not infringe privately owned rights. Reference herein to any specific commercial product, process, or service by trade name, trademark, manufacturer, or otherwise does not necessarily constitute or imply its endorsement, recommendation, or favoring by the U.S. Government or any agency thereof. The views and opinions of authors expressed herein do not necessarily state or reflect those of the U.S. Government or any agency thereof.
Page 16