also a thing of the past? - transportation.northwestern.edu · current truck market. ......
TRANSCRIPT
Is the Railroads’ “Renaissance” also a thing of the past?
NU/Sandhouse GangChicago
abh consultingXMAS, 2015

21st Century: the Railroad Renaissance
• Rails have well beaten the market 2001-2014• LTM – “Not So Much” (CP doing relatively well)• Earnings Power misunderstood: Rails beat
Street estimates – in the Boom, in the great Recession, and the tepid recovery
• Record margins & results despite the coal hit (and drought and lukewarm economy, etc….)
• Rails are still re-gaining market share from the highway
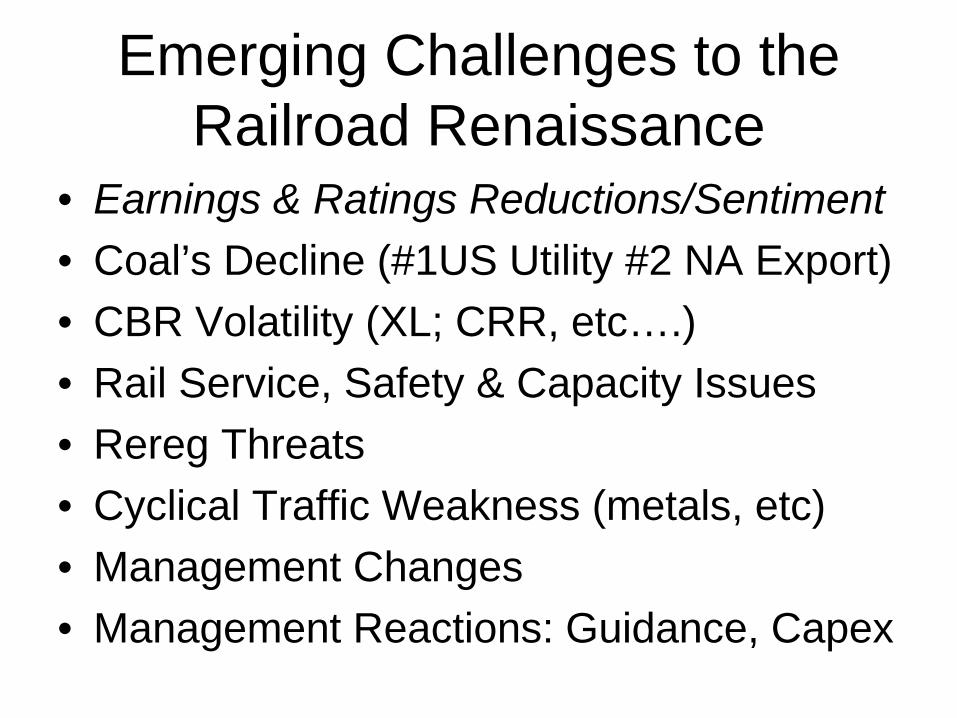
Emerging Challenges to the Railroad Renaissance
• Earnings & Ratings Reductions/Sentiment• Coal’s Decline (#1US Utility #2 NA Export)• CBR Volatility (XL; CRR, etc….)• Rail Service, Safety & Capacity Issues• Rereg Threats• Cyclical Traffic Weakness (metals, etc)• Management Changes• Management Reactions: Guidance, Capex

Silver Linings?
• Service Recovery Trend (Capex Pays Off)• Restoration of the “Grand Bargain” • Reduced (N/T) Political Pressure• Productivity (& volume?)Inflection• Coal “stabilization” (Part Two)??• 6/7 Report “wins” Q3/15;Pricing Power Remains• IM (etc) latent demand….Bi-Modal results• Industrial Buildout (SHIELD); Mexico,South• Revised MoW Capex (GTMs/Mix) frees CF/2016

Renaissance Discussion Points!
• Can Rails Survive – or even thrive – in the NOW?
• Or, can rails replace coal (ROI if not OR) with (domestic) intermodal (etc)?
• What is the future of industrial/merchandise railroading?
• What is the new standard for Capex?• Is M&A the answer?


7Experience / Expertise / Excellence www.plgconsulting.com
However Coal Volume LossStill Not Offset by Shale Products
0
200,000
400,000
600,000
800,000
1,000,000
1,200,000
1,400,000
1,600,000
1,800,000
U.S. QUARTERLY CARLOADS ORIGINATED
STCC 14413 - Industrial sand and gravel (includes frac sand)
STCC 131 - Crude Petroleum and Natural Gas
STCC 1121 - Bituminous coal
4 Qtr. Avg. 1,754,908
-288,724
+167,368
4 Qtr. Avg. 77,644
4 Qtr. Avg. 1,466,184
4 Qtr. Avg. 245,012
Despite dynamic shale-related growth, ~500k carloads/year net loss for
energy-related rail traffic

Rail Renaissance Phase Two• Rails will exit transitional period (faith)• CBR to continue longer term – as volatile as Ag?• Domestic Intermodal will achieve investable returns – the
big bet will pay off• Service Recovery – Politics, Productivity & Price• Market confusion – OR vs ROIC=opportunity (BNSF
example)• Industrial revival – the real energy advantage
(PLG&”SHIELD”); TPP (& NAFTA)• Risks: Service; Execution; Safety; Regulation• Risk: M&A??

Top 10 thoughts on possible CP-NS merger
1. Risk/Reward Ratio Unfavorable2. Diplomacy Required3. Shipper Support Required4. NS Approval Required5. STB/CTA (etc) Process Will Be
Long & Drawn-ouut

Top Ten NS/CP Continued
6. NS’ “Problems” Mostly Not of its Own Making7. NS is Advanced in Preparing for “Post-Coal” World8.New RR World to be Very High Service Focus9. CP-NS Could Stand alone (but would it?)10. Never Underestimate EHH (& Friends)

(11)
Future Growth Potential (Revised)
Specific targeted sectors
Secular stories (in order)….1. Intermodal – international and now domestic2. Chemicals/re-industrialization? Near-
sourcing/Mexico3. Cyclical recovery – housing, autos4. Grain & Food – the world’s breadbasket,
(un)predictable?5. Shale/oil/sand – problem and solution? 6. Other rail opportunities exist but in smaller
scale: for ex: The manifest/carload “problem”- Unitization- Industrial Products/MSW- Perishables

The “Grand Bargain”
• In return for higher prices (& ROI), rails spend, increase capacity & improve service (2005-2012) – The unstated “Grand Bargain”
• Rails gain pricing power (~2003) & F/S• Rails (re) Gain Market Share• Rails Spend Cash “Disproportionately” on Capex
(~18-20% of revenues)• Promotes “Virtuous Circle” – all stakeholders
benefit• Under challenge, perceived and real

Four Kinds of Growth/Location
• Cyclical (ex autos)• Secular (ex intermodal)• Episodic (Grain – 50 year drought then
record 7 record); coal?• New – brand new – CBR• Where? Low-density “Northern Tier” +
winter• Direction – some through Chicago• Remarkable adjustment to handle a brand new industry
and play a major role in America’s “energy revolution”

Q3/2015 – Inflection Point?
• Low expectations for rail (transport) quarterly earnings – Canadians beat expectations, US matched; outlook still gloomy
• Coal stabilizing?• Productivity/service turnaround?• Management confidence/guidance?• Waiting on “Big Decisions” on Capex, “stranded
assets”• The “Renaissance” thesis faces first real
challenges this century


2010-2020: New Energy world Shakes Up Freight Railroading
• Coal drops 20% 2010-2013, more to come?
• CBR increases from 4K cars (‘09) to 500K+ (2014) – Now What?
• Gi-normous RR Capital Spend• Targeted Business Spend – Chemicals,
fertilizers, steel, autos, Mexico• $100B in Gulf; $40B+ in Houston SMSA• Can rails handle it??

17Experience / Expertise / Excellence www.plgconsulting.com
New Energy Rail Growth Story -Crude and Frac Sand
0
20,000
40,000
60,000
80,000
100,000
120,000
140,000
U.S. QUARTERLY CARLOADS ORIGINATED
STCC 14413 - Industrial sand and gravel (includes frac sand) STCC 131 - Crude Petroleum and Natural Gas

18Experience / Expertise / Excellence www.plgconsulting.com
However Coal Volume LossStill Not Offset by Shale Products
0
200,000
400,000
600,000
800,000
1,000,000
1,200,000
1,400,000
1,600,000
1,800,000
U.S. QUARTERLY CARLOADS ORIGINATED
STCC 14413 - Industrial sand and gravel (includes frac sand)
STCC 131 - Crude Petroleum and Natural Gas
STCC 1121 - Bituminous coal
4 Qtr. Avg. 1,754,908
-288,724
+167,368
4 Qtr. Avg. 77,644
4 Qtr. Avg. 1,466,184
4 Qtr. Avg. 245,012
Despite dynamic shale-related growth, ~500k carloads/year net loss for
energy-related rail traffic

Intermodal Growth DriversDomestic and International
• Globalization• Trade• Railroad Cost Advantages• Fuel prices• Carbon footprint• Share Recovery from Highway• Infrastructure deficit & taxes• Truckload Issues; regulatory
issues, driver issues

2015/16 Will (Continue to be) Be Very Interesting – Q&A
• State of the Economy• End of the “Railroad Renaissance”?? • Is (somehow)the Impact of Lower Oil Prices now a Bad
Thing? Will Lower Oil Prices Continue?• When will we stop “transitioning” in coal?• Service Recovery/Productivity Inflection?• Will US’ “NGA” (natural gas advantage) Continue to
drive manufacturing Rebound?• Will Consumers Again Come to the Rescue?• Issues in FX; FS; Activists and M&A?• Will Governments Play a Deregulatory (EPA?) or Re-
regulatory (STB? CTA?)?

Intermodal Growth DriversDomestic and International
• Globalization• Trade• Railroad Cost Advantages• Fuel prices• Carbon footprint• Share Recovery from Highway• Infrastructure deficit & taxes• Truckload Issues; regulatory
issues, driver issues
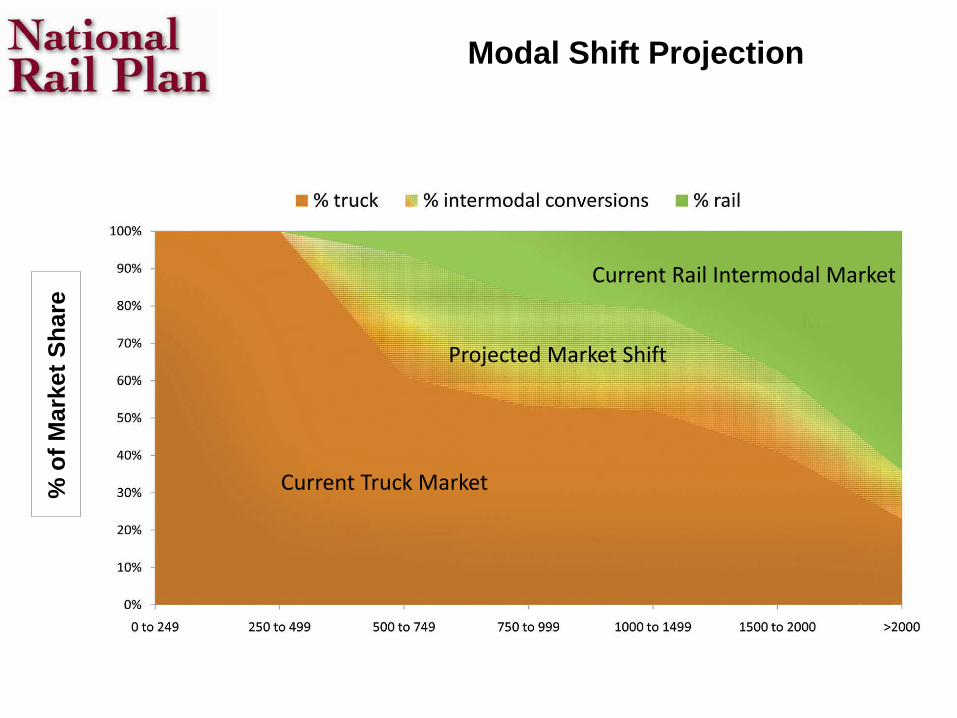
Modal Shift Projection %
of M
arke
t Sha
re
Current Truck Market
Current Rail Intermodal Market
Projected Market Shift

Intermodal 2015+ • More balanced growth (all about +5%) between
domestic & international than expected• Service issues (Hub, JBHT earnings) & Recovery• West Coast Port Issue Drag – ILWU, Chassis, Regs• Demand is there – IM gains overall share from ~17% to
~18.5% (FTR)• Domestic rates still trail TL price gains, less so in 2015• UPS/FDX achieve Xmas targets (98%)• Driver Turnover Continues - hits ~100% Q4/14: at 86%
z’allright??• Planning Issues: Canals; Slow Steaming (ocean service
& ROI); Alliances; Fuel Prices, Politics

Phase 2 IM Revolution
• Translate Domestic Growth into ROI (see BNSF/International ~2005)
• Prove service consistency/add capacity• Ease Bi-modal partnership frictions• Raise rates!• Provide reliable service (Grand Bargain)• Restructure International supply Chain• Wean Wall Street from “The Cult of O/R”

Re-industrialization?
• Near-Sourcing: Mexico, C/A• Natural Gas effect round two:
– CHEMICAL INDUSTRY (see PLG)– Fertilizers
• Steel/Aluminum/Autos/White Goods etc.• Northeast, etc. back “in play”?• Subject of future research

Emerging Petrochemical Boom
• See coming work from PLG Consulting; $130B+ planned capex in Gulf (ACC, SWARS, etc)
• NA Chems & plastics production to double by 2020; US exports to rise 45% to over $30B
• NG Prices (down 30%+2014) still advantaged….• USA inflected from importer 2011 to exporter
last year ($3B)• Shale-related investments alone to generate
$67B in related shipments

27Experience / Expertise / Excellence www.plgconsulting.com
Shale Supply Chainand Downstream Impacts
Feedstock (Ethane)
Byproduct (Condensate)
Home Heating (Propane)
Other Fuels
Other Fuels
Gasoline
Gas
NGLs
Crude
Proppants
OCTG
Chemicals
Water
Cement
Generation
Process Feedstocks
All Manufacturing
Steel
Fertilizer (Ammonia)
Methanol
Chemicals
Petroleum Products
Petro-chemicals
Inputs Wellhead Direct Output Thermal Fuels Raw Materials
THE NEXT WAVEManufacturing renaissance in the US based on
abundant, low cost energy and feedstocks
IMPACTS TO-DATE INCLUDEDramatic reduction in crude imports, lower electricity costs, lower gasoline prices, increased refined products exports
Downstream Products

28Experience / Expertise / Excellence www.plgconsulting.com
THE CHANGING LANDSCAPE FOR ENERGY: SHALE OIL & GAS OUTLOOK
SHIELD
Shale gas Industrial Expansion Logistics Database (SHIELD) is the first comprehensive, searchable database that provides detailed project information on all the announced shale gas industrial expansion projects. Additionally, PLG’s petrochemical industry experts provide SHIELD’s subscribers with projected logistics volumes by mode for each project.
Features include: User-friendly, interactive database with mapping to display
facility locations
Advanced search and query functionality
Real time alerts on project updates per subscriber preference
Sample product categories include: Ammonia and derivatives
Ethylene and Propylene
Methanol
Polymers and resins
Beta version will be released November 16 with over 150 projects included
Representative Sample
Sample of searchable fields

Chicago
• Once again, as in the “Roaring 20s” or ‘68, the nation looks at Chicago as dangerous
• What is new about these traffic flows?• Should (could) this have been foreseen? • How can one match 30-50 year assets and
incomplete demand forecasts?• What is being done about it?• CREATE? CTC)? The League of Extraordinary
Gentlemen!!• M&A????

ASSOCIATION OF AMERICAN RAILROADS
SLIDE 30
Close Correlation Between RR ROI and Reinvestments
4%5%6%7%8%9%
10%11%12%13%14%15%
'04 '05 '06 '07 '08 '09 '10 '11 '12 '13$15$16$17$18$19$20$21$22$23$24$25$26
Reinvestments* (right scale, $ bil)
*Capital spending + maintenance expense. **Net railway operating income / average net investment in transportation property. Data are for Class I railroads. Source: AAR
RR ROI** (left scale)

Railroad Capital ExpendituresClass I Railroads
$0
$5
$10
$15
$20
80 82 84 86 88 90 92 94 96 98 00 02 04 06 08 10 12 14
Billions
Source: RRFacts & Analysis of Class I RRs, AAR; abh estimates
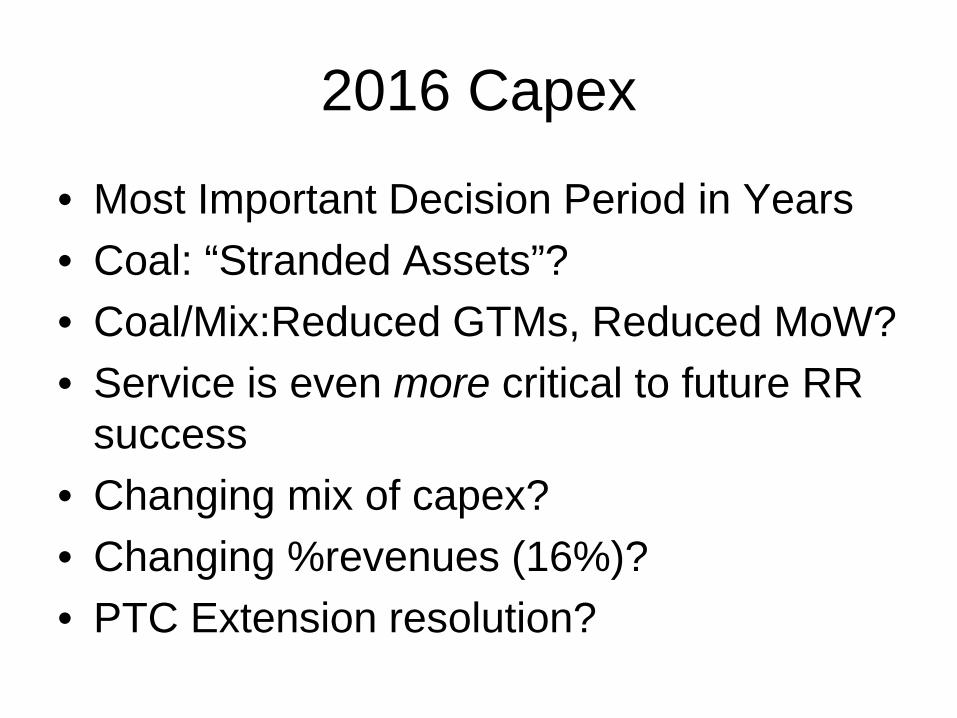
2016 Capex
• Most Important Decision Period in Years• Coal: “Stranded Assets”?• Coal/Mix:Reduced GTMs, Reduced MoW?• Service is even more critical to future RR
success• Changing mix of capex?• Changing %revenues (16%)?• PTC Extension resolution?

2016 Capex (Continued)
• Guidance from Railway Interchange, RTA, RailTrends, NRC – then Q4 (January)
• Shareholders’ demands – buybacks & DPS vs. ROIC
• Regulatory Demands (and false claims)• Safety Demands (CBR, etc)• Shipper Demands (service, service,
service!)

Railroad Cost of Capital vs. Regulatory Return on Investment
0%
2%
4%
6%
8%
10%
12%
14%
16%
18%
20%
81 82 83 84 85 86 87 88 89 90 91 92 93 94 95 96 97 98 99 00 01 02 03 04 05 06 07 08 09 10 11 12 13
Cost of Capital Return on Investment
Source: Surface Transportation Board Note: Cost of equity estimation method changed by Board effective 2006 and 2008.

Rails Have Room to Improve in ROI

NA & Down Under
• New Zealand and Wisconsin Central• GWR and GWR again!• Watco• Canadian Infrastructure interest
(Brookfield)• NA Investor interest (AZJ)

37Experience / Expertise / Excellence www.plgconsulting.com
Experience Delivering value to over
200 clients since 2001 Real-world, industry
veterans Logistics, engineering &
supply chain experts with operational experience
Core Expertise Bulk Logistics Freight Rail Logistics Infrastructure
Design Energy & Chemical
Markets Investment Advisory and
Corporate Development
Partial Client List
Services Diagnostic assessments &
optimization Supply chain design &
operational improvement Investment strategy, target
identification, due diligence, post-transactional support
Crude by rail (CBR) and rail tank car (RTC) forecasts
Independent technology assessment & implementation
Hazmat training, auditing & risk assessment
About PLG Consulting

Deregulation - & Vertical Integration – Works!

www.abhatchconsulting.comABH Consulting/www.abhatchconsulting.com
Anthony B. Hatch155 W. 68th StreetNew York, NY 10023(212) [email protected]
www.railtrends.com