alpha bank fy 2012 results · alpha bank 2012 update ... of modern times ... jan-13 opap baupost...
TRANSCRIPT

27 March 2013
Alpha Bank FY 2012 Results

Alpha Bank 2012 Update
After 5 years of recession, Greek economy is showing certain signs of recovery,
delivering on targets and return to growth expected by 2014
Returning confidence to the banking sector which has rapidly consolidated in 2012
Emporiki acquisition strengthens capital base, provides positive impact on liquidity
and further upside; pro-forma Tangible Equity at €2.1bn
Full year 2012 results affected by multiple headwinds, but positive outlook mainly
related to significant NII improvement
Recent upheaval in Cyprus, where uninsured deposits of banks under resolution
were bailed-in, may increase market uncertainty but should also make depositors
more conscious in selecting the banking relationships
Agenda
1. Macroeconomic Update: First Signs of Stabilisation and FDI
2. Consolidated Banking Sector and Returning Confidence
3. Emporiki Acquisition Bringing Significant Benefits
4. Solid 2012 Performance Despite Multiple Headwinds and Technical Effects
3.5%
(0.2%)
(3.1%) (4.9%)
(7.1%) (6.0%)
(4.2%)
0.6%
2.9% 3.7%
2007 2008 2009 2010 2011 2012E 2013E 2014E 2015E 2016E
4
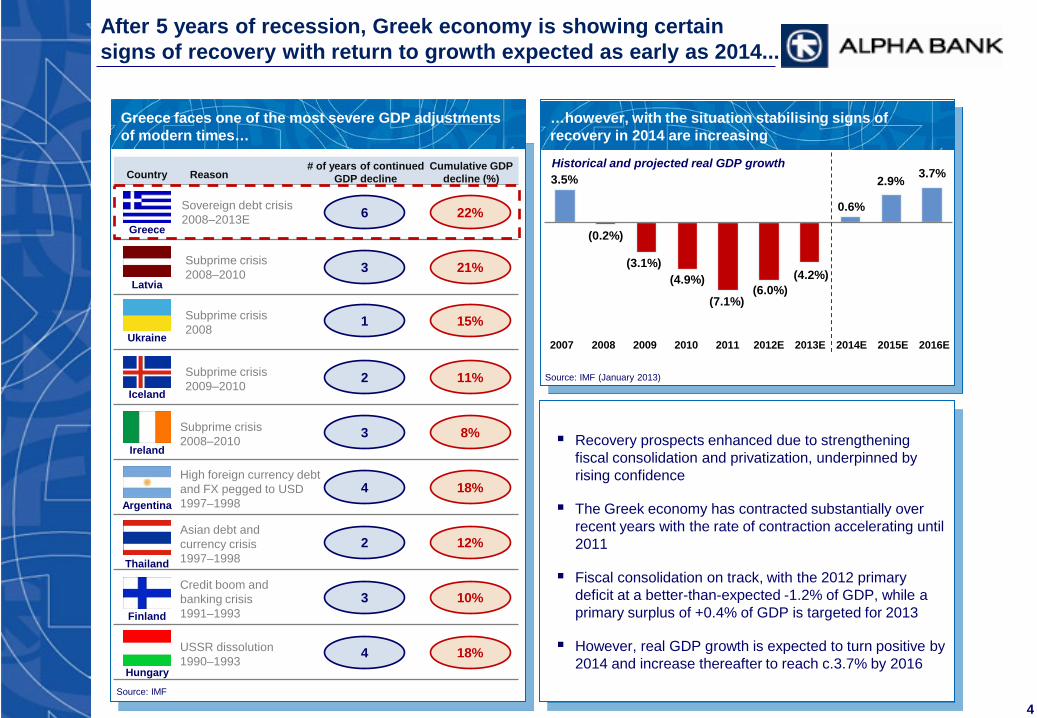
After 5 years of recession, Greek economy is showing certain signs of recovery with return to growth expected as early as 2014...
Greece faces one of the most severe GDP adjustments of modern times…
Recovery prospects enhanced due to strengthening fiscal consolidation and privatization, underpinned by rising confidence
The Greek economy has contracted substantially over recent years with the rate of contraction accelerating until 2011
Fiscal consolidation on track, with the 2012 primary deficit at a better-than-expected -1.2% of GDP, while a primary surplus of +0.4% of GDP is targeted for 2013
However, real GDP growth is expected to turn positive by 2014 and increase thereafter to reach c.3.7% by 2016
Source: IMF (January 2013)
…however, with the situation stabilising signs of recovery in 2014 are increasing
Historical and projected real GDP growth
Source: IMF
Greece
Country Reason # of years of continued
GDP decline Cumulative GDP
decline (%)
Sovereign debt crisis 2008–2013E 6 22%
Latvia
Subprime crisis 2008–2010 3 21%
Iceland
Subprime crisis 2009–2010
2 11%
Ireland
Argentina
3 8%
Thailand
Finland
2 12%
4 18%
3 10%
4 18%
Asian debt and currency crisis 1997–1998
Credit boom and banking crisis 1991–1993
High foreign currency debt and FX pegged to USD 1997–1998
Subprime crisis 2008–2010
Hungary
USSR dissolution 1990–1993
Ukraine
Subprime crisis 2008
1 15%
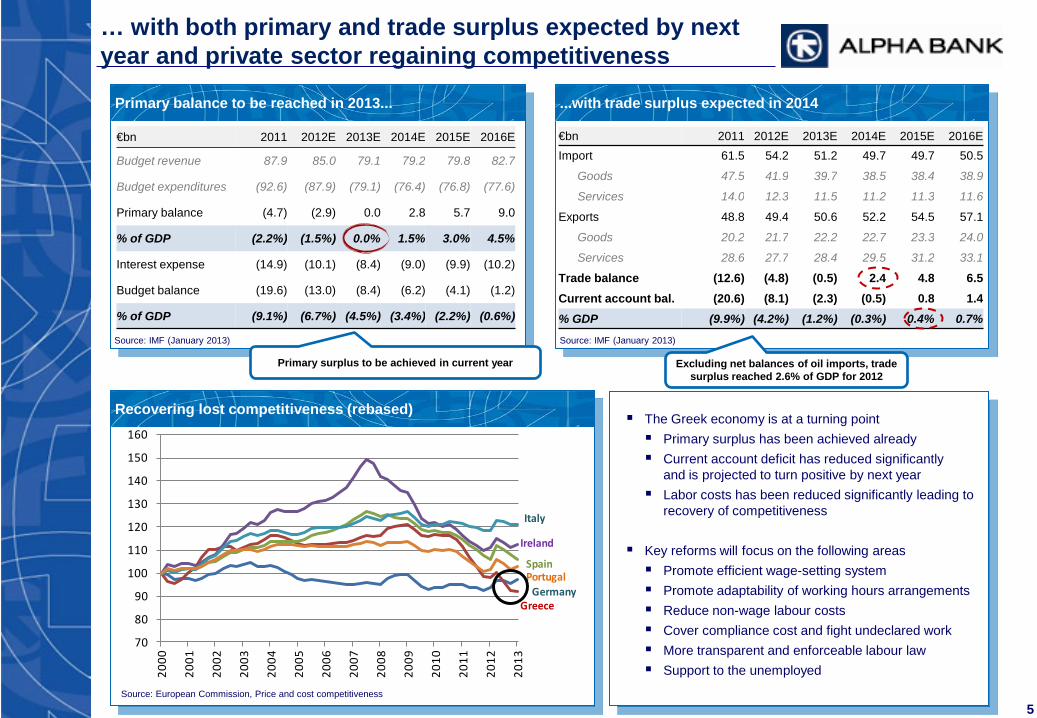
€bn 2011 2012E 2013E 2014E 2015E 2016E
Budget revenue 87.9 85.0 79.1 79.2 79.8 82.7
Budget expenditures (92.6) (87.9) (79.1) (76.4) (76.8) (77.6)
Primary balance (4.7) (2.9) 0.0 2.8 5.7 9.0
% of GDP (2.2%) (1.5%) 0.0% 1.5% 3.0% 4.5%
Interest expense (14.9) (10.1) (8.4) (9.0) (9.9) (10.2)
Budget balance (19.6) (13.0) (8.4) (6.2) (4.1) (1.2)
% of GDP (9.1%) (6.7%) (4.5%) (3.4%) (2.2%) (0.6%)
€bn 2011 2012E 2013E 2014E 2015E 2016E Import 61.5 54.2 51.2 49.7 49.7 50.5
Goods 47.5 41.9 39.7 38.5 38.4 38.9
Services 14.0 12.3 11.5 11.2 11.3 11.6
Exports 48.8 49.4 50.6 52.2 54.5 57.1
Goods 20.2 21.7 22.2 22.7 23.3 24.0
Services 28.6 27.7 28.4 29.5 31.2 33.1
Trade balance (12.6) (4.8) (0.5) 2.4 4.8 6.5 Current account bal. (20.6) (8.1) (2.3) (0.5) 0.8 1.4 % GDP (9.9%) (4.2%) (1.2%) (0.3%) 0.4% 0.7%
5
… with both primary and trade surplus expected by next year and private sector regaining competitiveness
Primary balance to be reached in 2013... ...with trade surplus expected in 2014
The Greek economy is at a turning point Primary surplus has been achieved already Current account deficit has reduced significantly
and is projected to turn positive by next year Labor costs has been reduced significantly leading to
recovery of competitiveness
Key reforms will focus on the following areas Promote efficient wage-setting system Promote adaptability of working hours arrangements Reduce non-wage labour costs Cover compliance cost and fight undeclared work More transparent and enforceable labour law Support to the unemployed
Excluding net balances of oil imports, trade surplus reached 2.6% of GDP for 2012
Primary surplus to be achieved in current year
Source: IMF (January 2013) Source: IMF (January 2013)
70
80
90
100
110
120
130
140
150
160
2000
2001
2002
2003
2004
2005
2006
2007
2008
2009
2010
2011
2012
2013
Germany
Italy
Ireland
SpainPortugal
Greece
Source: European Commission, Price and cost competitiveness
Recovering lost competitiveness (rebased)

Date Target Foreign investor Deal value
(€mm) Sale considerations Sector
Pending DEPA Gazprom, Sintez n.d. Sale expected during H1’13 Energy (Gas and Pipeline networks)
Pending OPAP Fosun, German Operators ~700 Sale of 33% stake, current mkt cap. €2.2bn Football Prognostics Organization
Mar-13 Dolphin Third Point, Monarch ~74 Backstopped Convertible Bonds Real estate developer
Feb-13 Kassiopi/Corfu NCH Capital 100¹ Privatization sale by HRADF of concession rights for 99 years Real estate development plan in Corfu
Feb-13 M.J. Maillis Grace Bay Holdings c.10 Share capital increase International packaging operator
Jan-13 Opap Baupost Group 106² Stake building of 5.2% Greek lottery under privatization
Jan-13 Eurodrip Paine & Partners 70 Completed MTO Irrigation and farming management
Jan-13 S&B Rhône Capital 115 Tender offer for 39% of the capital Mining
Dec-12 Folli follie TPG Axon 43 c.6.8% stake acquired from Piraeus Semi-luxury retailer
Oct-12 Dolphin nina Third Point 45 Share capital increase Real estate developer
Oct-12 Folli follie Dufry group 500 51% stake in Hellenic Durty Free shop Greek duty free shops
6
Improving fundamentals are already attracting certain international investment into selected sectors …
Recent pick up in activity demonstrated also by Hewlett-Packard (HP) and
Chinese shipping company Cosco agreement to distribute regional
supplies through the Greek port of Piraeus which would become its
European regional hub
Piraeus Port, the next European hub?
Recent completed transactions with foreign investments inflows
Visible pick up in tourism activity
(23.0%)
9.5%
(5.2%)
7.0%
2009 2010 2011 2012
Visitor exports real growth (%)
Source: WTTC Travel & Tourism Economic Impact 2013
Source: Company information, Press Releases, Factiva

7
Greek issuers have also re-accessed the international markets, albeit at expensive re-entering levels
Benchmark bond yield compared to Portugal Recent bond issues in Greece
0
5
10
15
20
25
30
35
Jan-11 May-11 Sep-11 Jan-12 May-12 Sep-12 Jan-13
Greece
Portugal
10.8%
Greek debt swap Second bail-out
package approved
6.1%
Greece and Portugal benchmark 10 year bond yield evolution
10 42 51
99 76
19
53
102
2007 2008 2009 2010 2011¹ 2012
Eurosystem funding reliance of Greek banks
ELA (€bn)
ECB (€bn)
Company 1 Company 2 Company 3
Date Dec-12 Jan-13 Jan-13
Amount US$250mm €200mm €700mm
Term 8 years 4 years 5 years
Yield (%) 9.875% 8.75% 7.875%
130 122
Limited in crease in absolute terms of Eurosystem funding reliance since 2010, negative
impact due to mix effect Source: Dataquery
Source: Company information, Factiva
Source: Bank of Greece ¹ For 2011 ELA includes NFA
Portugal and Greece benchmark bond yields both peaked towards mid-2012 on the back of the increased sovereign concerns
Recent easing on sovereign risk has lead to a significant decrease in sovereign bond yields
However, Greek yields still at c.4.5% spread vs. Portuguese

8
Greek debt is consolidated in the official sector which acknowledges the wide ranging set of reforms that the country has implemented
Projections for Greek public debt Eurogroup statement on conditional further support
Greek debt composition (FY 2012 estimate)
Eurogroup statement on Greece “The Eurogroup in particular welcomes the updated assessment of the Troika that Greece has implemented in a satisfactory manner a wide ranging set of reforms, as well as the budget for 2013 and an ambitious medium term fiscal strategy 2013-16.(…) Euro area Member States will consider further measures and assistance, including inter alia lower co-financing in structural funds and/or further interest rate reduction of the Greek Loan Facility, if necessary, for achieving a further credible and sustainable reduction of Greek debt-to-GDP ratio (…) As was stated by the Eurogroup on 21 February 2012, we are committed to providing adequate support to Greece during the life of the programme and beyond until it has regained market access, provided that Greece fully complies with the requirements and objectives of the adjustment programme.”
November 27, 2012
Source: IMF; ¹ Includes subsector debt net of intra-government holdings
90
110
130
150
170
190
210 20
02
2003
20
04
2005
20
06
2007
20
08
2009
20
10
2011
20
12
2013
20
14
2015
20
16
2017
20
18
2019
20
20
2021
20
22
Historical evolution November 2012 agreement (latest projections)
March 2012 programme April 2010 programme
Post debt buy-back 2012
% GDP
IMF estimate €bn % total General government (State) 307.2 100% Tbills 18.4 6% Official sector 183.6 60% IMF 22.3 7% European Commission 161.3 53% Exchanged bonds 29.9 10% Non-exchanged bonds 56.3 18% Loans 18.0 6% Other¹ 1.0 0%
175% 124% <110% Eurogroup targets
Greece’s current debt maturities
5.3 3.5
1.3 3.0
10.3 7.4
2.5
Q2 Q3 Q4 Q1 Q2 Q3 Q4
Quarterly (€bn)
2013 2014
Source: European Commission
Source: European Commission
Source: IMF, Bank of Greece, European Commission
Agenda
1. Macroeconomic Update: First Signs of Stabilisation and FDI
2. Consolidated Banking Sector and Returning Confidence
3. Emporiki Acquisition Bringing Significant Benefits
4. Solid 2012 Performance Despite Multiple Headwinds and Technical Effects
36%
32%
23%
3%
2% 1% 1% 1% 1%
10
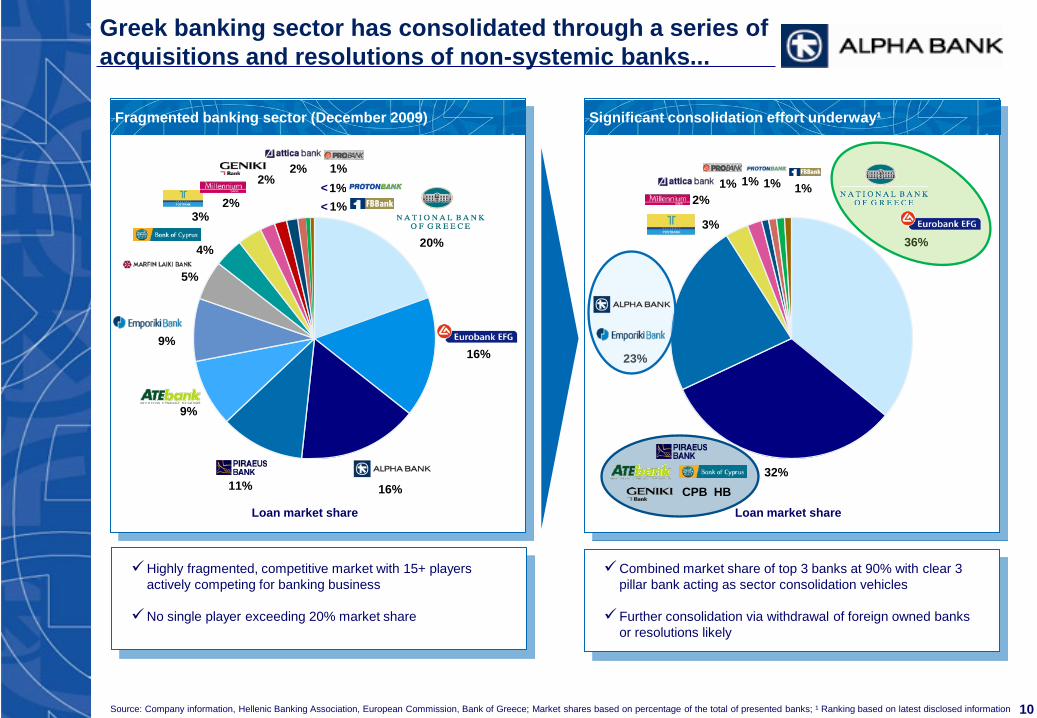
Greek banking sector has consolidated through a series of acquisitions and resolutions of non-systemic banks...
Fragmented banking sector (December 2009) Significant consolidation effort underway¹
Source: Company information, Hellenic Banking Association, European Commission, Bank of Greece; Market shares based on percentage of the total of presented banks; ¹ Ranking based on latest disclosed information
Combined market share of top 3 banks at 90% with clear 3 pillar bank acting as sector consolidation vehicles
Further consolidation via withdrawal of foreign owned banks or resolutions likely
20%
16%
16%
11%
9%
9%
5%
4%
3%
2%
2%
2%
1% 1% 1%
< <
CPB HB
Loan market share Loan market share
Highly fragmented, competitive market with 15+ players actively competing for banking business
No single player exceeding 20% market share

11
... which is expected to lead to improved deposit margins
Greek System Deposits (Bank of Greece)
160 175 198
228 238 210
174 165 151 154 161 161
Dec-05 Dec-06 Dec-07 Dec-08 Dec-09 Dec-10 Dec-11 Mar-12 Jun-12 Sep-12 Dec-12 Jan-13
(€ bn)
7%
Deposits in Greece decreased significantly between Dec-09
and mid ’12
However, reversal of deposit trends following June elections
with Alpha Bank outperforming the market by more than
10%, a testament to the returning confidence to the Greek
banking sector overall and Alpha Bank in particular
Time deposit pricing levels
Consolidation and regained access to Eurosystem
liquidity improved the situation towards the end of 2012
Market is expected to normalise further with a gradual
easing of margin pressure further 2013 and beyond
Consolidation of banking sector expected to lead to
improved deposit pricing
0.0%
1.0%
2.0%
3.0%
4.0%
5.0%
6.0%
Dec-09 Apr-10 Aug-10 Dec-10 Apr-11 Aug-11 Dec-11 Apr-12 Aug-12 Dec-12
Average interest rate on new euro-denominated time deposits
Source: Bank of Greece, Bloomberg
1.2%
3.4%
4.4% 4.2%
Up to 130bps deposit cost increase between mid-2010 and mid-2011 as competition for funding increased
Retail Corporate
4.7%
5.0%
3.7%
2.1%
Source: Bank of Greece
(37%)
Deposits/Nominal GDP
Eurozone: 115%
Greece: 83% Compared to +18%
for Alpha Bank
0.2% 0.7%
1.6%
Euribor 3M

360 150 118 43
240
50 76 7
600
200 194 50
12
Furthermore, consolidator banks are projected to realise significant synergies, further improving the profitability of the sector
Key measures announced by the newly formed groups:
Cost synergies
o Footprint optimisation (branch network, ATMs, etc.)
o Reduction in central functions
o Business units realignment (streamline centralised functions, IT and operations, procurement)
Funding and revenue synergies
o Lower funding costs through re-pricing of deposit base and mix
o Recovery improvement through additional client base attraction
o New cross-selling and up-selling opportunities
o Increase of fee-based business for corporate customers
Source: Company information, Investor Presentations ¹ Based on Company information (Eurobank and NBG based on Greece segement for 9M’12 annualized, Emporiki and Alpha based on Investor Presentation disclosure, Piraeus based on LTM Mar-12 figures, ATEbank based on 9M’11 annualized figures, Geniki implied cost base FY’11 based on Piraeus Investor Presentation)
Announced synergies
Announced combined synergies for recent Greek bank mergers amount to €1bn
Cost synergies represent the largest part of the announced savings, amounting to a total of c.€0.7bn or c.65% of total synergies
Funding and revenue synergies amount to c.€370mm or c.35% of total synergies
Pre-tax, fully phased synergies per annum (€mm)
Funding and revenue synergies
Cost synergies
18%
Cost synergies, % combined cost base
12% 12% 4%
€ 2.0bn € 1.2bn € 1.0bn € 1.1bn
Combined cost base¹
Key announced measures
Agenda
1. Macroeconomic Update: First Signs of Stabilisation and FDI
2. Consolidated Banking Sector and Returning Confidence
3. Emporiki Acquisition Bringing Significant Benefits
4. Solid 2012 Performance Despite Multiple Headwinds and Technical Effects

0.9
2.3
2.9
(1.5)
Dec-11 share capital
CASA capital injection
FY12 losses
Emporiki Equity
14
Emporiki transaction has significantly enhanced Alpha Bank’s capital position
Emporiki capital position (€bn) Credit Agricole capital increases of Emporiki (€mm)
850 989
2,000
2,905
2009 2010 2011 2012
5,019 Stock of provisions
Emporiki transaction brings a net benefit of €2.3bn to Alpha Bank as of December 2012
Significant capital buffer created by Credit Agricole reflected in strong provision buffer
Stock of balance sheet provisions close to €5bn, exceeding 25% of the total gross loan book
€bn
Cash
0.6
Due from banks
1.3
Securities
0.4
Net loans to customers
14.8
Other
1.1
Total assets
18.2
Central Bank deposits (incl. ECB)
1.7
Eurosystem funding
1.2
Customers’ deposits
12.9
Time deposits
8.9
Sight and Savings deposits
4.0
Other liabilities
1.3
Total equity
2.3
Net Loan / deposit
114.1%
Deposit / total assets
71.0%
Central Bank deposits / total assets
9.4%
15
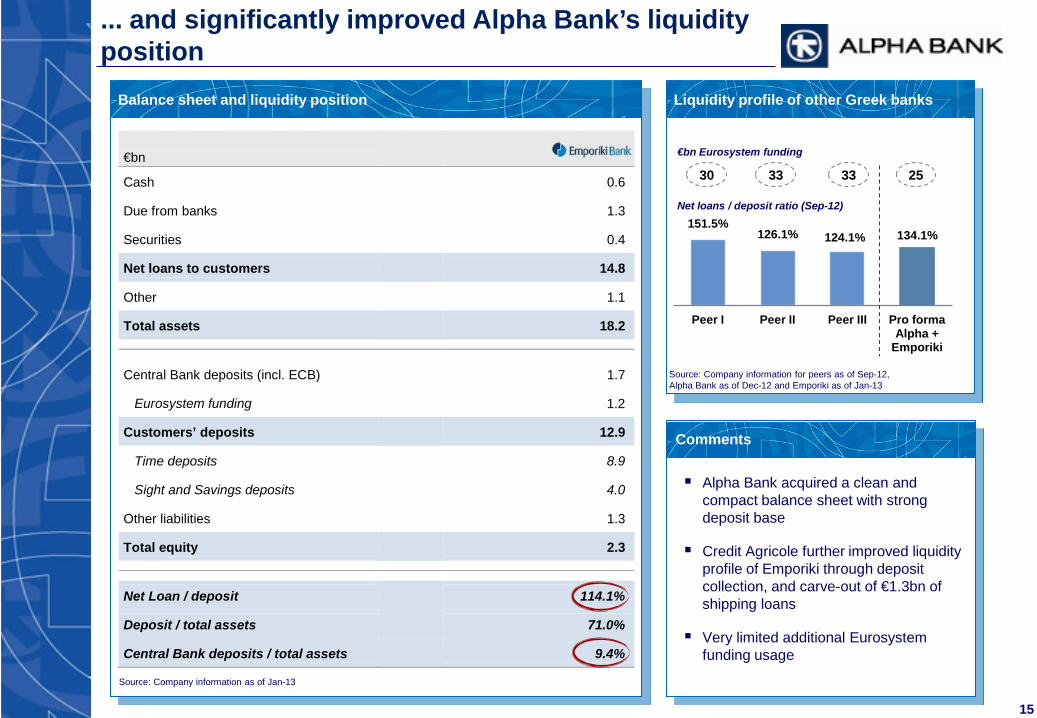
... and significantly improved Alpha Bank’s liquidity position
Balance sheet and liquidity position
Source: Company information as of Jan-13
Liquidity profile of other Greek banks
151.5% 126.1% 124.1% 134.1%
Peer I Peer II Peer III Pro forma Alpha +
Emporiki
Net loans / deposit ratio (Sep-12)
30 33 33
€bn Eurosystem funding
Alpha Bank acquired a clean and compact balance sheet with strong deposit base
Credit Agricole further improved liquidity profile of Emporiki through deposit collection, and carve-out of €1.3bn of shipping loans
Very limited additional Eurosystem funding usage
25
Source: Company information for peers as of Sep-12, Alpha Bank as of Dec-12 and Emporiki as of Jan-13
Comments

16
Emporiki’s loan portfolio is well provided for with NPLs covered by 61%
Greece 96%
Cyprus 4%
Consumer 10.7%
Total gross loans: €19.8bn
Business 52.0%
Mortgage 37.3%
Emporiki loan book
By type
By country
Emporiki NPLs and provision coverage by type (Dec-12)
Coverage of non-performing loans exceeding 60%
NPL ratio as of December 2012 of 41.8% which compares to Alpha Bank NPL of 22.8% with a 45% cash coverage
Well diversified loan book
Greece accounting for 97% of total gross loan portfolio with Cyprus representing 3%
€mm Gross loans Provisions Net loans NPL ratio Coverage
ratio
Business Loans 10,279 2,995 7,284 38.4% 76.0%
Mortgages 7,384 1,088 6,295 40.4% 36.4%
Consumer 2,123 936 1,187 63.6% 69.3%
Total 19,785 5,019 14,766 41.8% 60.6%
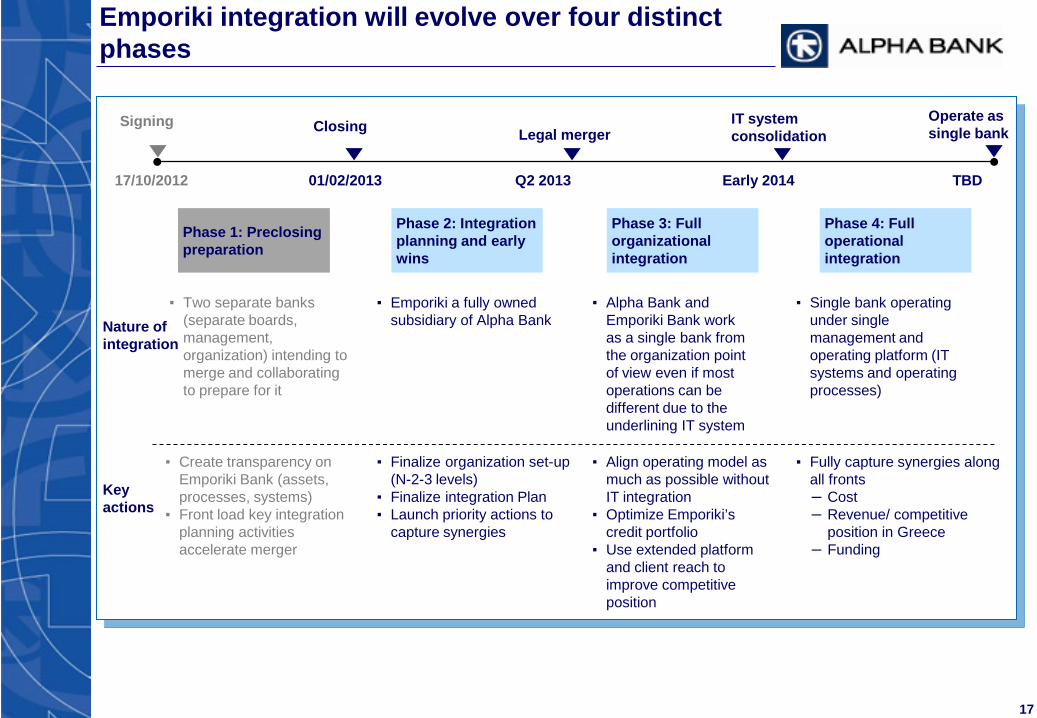
Emporiki integration will evolve over four distinct phases
▪ Two separate banks (separate boards, management, organization) intending to merge and collaborating to prepare for it
▪ Single bank operating under single management and operating platform (IT systems and operating processes)
▪ Emporiki a fully owned subsidiary of Alpha Bank Nature of
integration
Phase 1: Preclosing preparation
Phase 2: Integration planning and early wins
Phase 3: Full organizational integration
Phase 4: Full operational integration
Legal merger IT system consolidation
Operate as single bank
▪ Alpha Bank and Emporiki Bank work as a single bank from the organization point of view even if most operations can be different due to the underlining IT system
▪ Create transparency on Emporiki Bank (assets, processes, systems)
▪ Front load key integration planning activities accelerate merger
▪ Fully capture synergies along all fronts – Cost – Revenue/ competitive
position in Greece – Funding
▪ Finalize organization set-up (N-2-3 levels)
▪ Finalize integration Plan ▪ Launch priority actions to
capture synergies
Key actions
▪ Align operating model as much as possible without IT integration
▪ Optimize Emporiki’s credit portfolio
▪ Use extended platform and client reach to improve competitive position
17/10/2012 01/02/2013 Q2 2013 Early 2014 TBD
Signing Closing
17

Estimate of synergies raised to €265mn as integration progresses successfully
Total
100-140
Network re-organization/ rebranding
10-15
IT integration
30-35
Platform rightsizing
60-90
Year 3 (2015)
165-195
Year 2 (2014)
130-150
Year 1 (2013)
20-30
Total estimate Phasing
0
Year 3 (2015) Year 2 (2014)
70-95
Year 1 (2013)
30-45
Cost synergies fully phased-in in year 3
Note: Synergies and integration costs are pre tax 18
(€ million)
Year 3 (2015)
75-95
Year 2 (2014)
50-65
Year 1 (2013)
20-25
Cost synergies
Funding and revenue
synergies
Integration costs
Total
165-195
Non-branch related
130-150
Branch related
35-45
Total
75-95
Revenue synergies
45-55
Funding synergies
30-40
Agenda
1. Macroeconomic Update: First Signs of Stabilisation and FDI
2. Consolidated Banking Sector and Returning Confidence
3. Emporiki Acquisition Bringing Significant Benefits
4. Solid 2012 Performance Despite Multiple Headwinds and Technical Effects

Key Developments and Results Highlights for FY 2012
EBA CTI at 12.8%, pro-forma for €4.6bn recapitalization and the €150mn convertible bond issued by
Alpha Bank and subscribed by CASA. Including Emporiki, EBA CTI stands at pro-forma 13.7%.
Reversal of negative trend in deposits with inflows of €2.2bn in Q4 2012, and further increasing by
€1.2bn in the first two months of 2013
Central Banks funding decreased by €1.7bn for the quarter and further by €4.5bn at the end of February
2013
NPLs at 22.8%, backed by €4.6bn of on-balance sheet provisions, yielding 45% cash coverage or 123%
inclusive of collaterals
FY2012 impairments rise to €1.7bn from €1.1bn, up 47.6% yoy to address asset quality deterioration
Net losses at €1.1bn, including extraordinary costs of €125.1mn and the pre-tax trading loss of €288.3mn
from the recognition of the new GGBs at their market value at the transaction date
20

21
FY 2012 Performance Highlights
Romania
Pro forma FY 12 with Emporiki 31.01.2013 FY 12 FY 11 Change %
(€ billion)
Net Loans 55.5 40.5 44.9 (9.8%)
Deposits 41.3 28.5 29.4 (3.2%)
Accumulated Provisions 9.6 4.6 2.9 60.9%
Common Shareholders’ Tangible Equity 2.1 (0.5) 0.3 n.m.
Assets 76.5 58.4 59.1 (1.3%)
(€ million)
Operating Income 1,502.7 2,283.8 (34.2%)
Operating Expenses1 (1,053.6) (1,096.3) (3.9%)
Pre-Provision Income2 681.4 1,045.2 (34.8%)
Impairment Losses on credit risk (1,668.9) (1,130.3) 47.6%
Profit/ (Loss) after tax excluding trading losses from new GGBs and impairment on PSI eligible portfolio1,3 (747.1) 21.4 …
Impairment Losses on PSI 0.0 (3,831.4) …
Profit / (Loss) after tax attributable to Shareholders (1,086.3) (3,810.2) (71.5%)
1 Excluding extraordinary costs of €125.1mn 2 Excluding trading result and extraordinary costs 3 Adjusted for the trading loss of €288.3mn resulting from the recognition of new GGBs at their market value at the transaction date

22
Capital Adequacy of Alpha Bank – Emporiki
Alpha Emporiki
Group RWAs development Alpha – Emporiki Total CAD Built up
14.5% 14.4% 13.7% (€ billion)
EBA Core Tier I Build up
5.2 (4.1)
0.3 (0.9) 0.15
4.6 5.3
2.6
7.9
EBA Core Tier I 31/03/2011
PSI losses LME Period losses Convertible bond
HFSF EBA Core Tier I Emporiki contribution
EBA Core Tier I 31/12/2012
Alpha
10.9% 12.8%
13.7% (€ billion)
(1) Emporiki’s total contribution as of 31.01.2013
(1)
12.8% 14.5% 13.7%
0.4% 0.3% 0.5% 0.4%
Alpha Emporiki Group
Core Tier I (EBA) Tier I Total CAD
37.8
57.6
0.6 3.2
15.0 0 1.0
Credit Market Operational Credit Market Operational Total Group RWA

23
Operating performance impacted by higher funding cost and cost of deposits
Central Bank Funding Average Balances and Cost
(€mm)
(€bn)
Pre-Provision Income Build-up (excl. Trading and OPEX one-offs)
(€mm)
1,045
(386)
(22)
1 43 681
FY 11 Δ NII Δ Fees Δ Other Δ OPEX FY 12
Net Interest Income Movement
1Excluding Fees
13.7 13.5 12.2 5.2 0.6
5.8 9.6 11.1 19.1 24.2
19.5 23.2 23.3 24.3 24.8
1.90% 1.83% 1.96% 2.36%
2.70%
Q4 11 Q1 12 Q2 12 Q3 12 Q4 12
ELA
ECB
Funding Cost
1
1,784 83
(122)
(353)
6 1,397
FY 11 Loans Deposits Funding Cost
Bonds & Other
FY 12
(386mn)
Repricing and overall portfolio focus led to increased interest income from loans, but more than outweighted by rising funding and deposit costs, particularly in the second half of the year
Net interest income decline in FY12 mainly due to higher funding costs (up €353mm from FY11) and increased cost of deposits (up €122mm from FY11)
Underlying trends specific to 2012 adverse macroeconomic situation and banking sector consolidation; some of those trends have already reversed in 2013
Comments

24
Net interest income expected to improve significantly over the medium term
Improved funding mix Capital increase supporting NII
Positive base effect in NII from substitution of wholesale funding from ELA to ECB (c.2% of ELA base)
Normalisation of time deposit pricing: min 0.5% on €20bn curve gain on loans
Yield on capital raise (on the remaining capital bridge of €1,629mn on top of two tranches which have been received over the last year)
Improving time deposit pricing
13.5 13.3
8.4
23.7 5.9
2011 2012 Feb-13
1,900
1,042
1,629
1st HFSF Recap Tranche
(28/5/12)
2nd HFSF Recap Tranche
(21/12/12)
Remaining amount for full recapitalisation
14.1
27.2
41.3
2012
(159)
(197) (228)
(256) (287) (350)
(300)
(250)
(200)
(150)
(100)
(50)
0 Q4 Q1 Q2 Q3 Q4
Time deposits spreads-Greece
Eurosystem funding evolution (€ billion)
€21.9bn €23.7bn
ELA funding (+NFA for 2011) ECB funding
Additional NII support from remaining €1.6bn capital increase following two
HFSF advances in 2012
(€ million)
Greek deposits (€billion) Pro forma for Emporiki
Time
Sight & Saving
2011 2012 2013
bps
Comments
€19.2bn
Buffer w/o Emporiki
7.7
12.7
Buffer incl. Emporiki
358 328 318
133 137 138
495 467 459
FY 10 FY 11 FY 12 Greece SE Europe
25
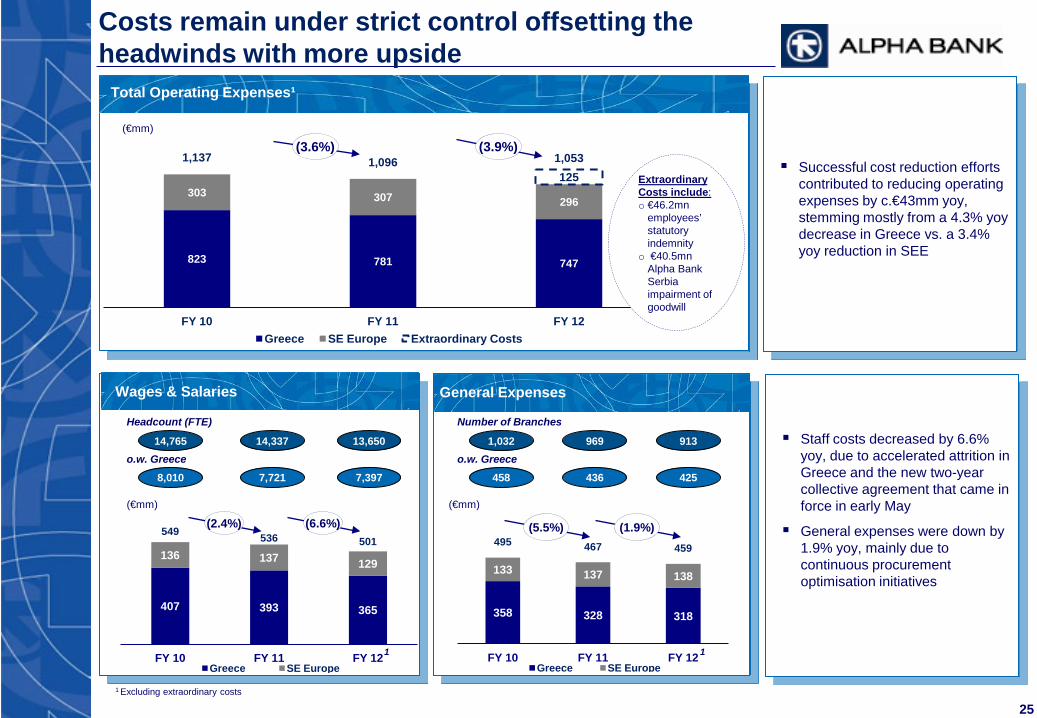
Total Operating Expenses¹
Wages & Salaries General Expenses
Costs remain under strict control offsetting the headwinds with more upside
823 781 747
303 307 296
125 1,137 1,096 1,053
FY 10 FY 11 FY 12 Greece SE Europe Extraordinary Costs
407 393 365
136 137 129
549 536 501
FY 10 FY 11 FY 12 Greece SE Europe
(1.9%)
(3.9%) (€mm)
(€mm)
(6.6%)
1
1 Excluding extraordinary costs
Successful cost reduction efforts contributed to reducing operating expenses by c.€43mm yoy, stemming mostly from a 4.3% yoy decrease in Greece vs. a 3.4% yoy reduction in SEE
Staff costs decreased by 6.6% yoy, due to accelerated attrition in Greece and the new two-year collective agreement that came in force in early May
General expenses were down by 1.9% yoy, mainly due to continuous procurement optimisation initiatives
(3.6%)
(2.4%) (5.5%)
Headcount (FTE)
14,765 14,337 13,650
Number of Branches
1,032 969 913
8,010 7,721 7,397 458 436 425 o.w. Greece o.w. Greece
(€mm)
1
Extraordinary Costs include: o €46.2mn
employees’ statutory indemnity
o €40.5mn Alpha Bank Serbia impairment of goodwill

Stabilizing economic environment led to a decreased NPL formation of 190bps in Q4
Coverage increased to 45% or 123% when including collaterals
NPL formation
Stabilizing Economic Environment led to a Decreased NPL Formation in Q4, while Increasing Coverage at 45%
26
90 100 130
200 200
250 270
190
Q1 11 Q2 11 Q3 11 Q4 11 Q1 12 Q2 12 Q3 12 Q4 12
(bps)
NPL ratio 22.8%2
1 Adjusted for the PSI+ impact on state guaranteed loans 2 NPL ratio at 28.6% pro forma with Emporiki
1 1
1
Group NPLs and Coverage (without Emporiki)
6.4
3.0
2.7
0.7
1.2
0.9
10.3
4.6
NPLs Impairment Allowances Collateral
Business Loans Mortgages Consumer Credit
78%
45%
123% (€bn)
Coverage
186 204 215 235 250 275
345 392
440
Q4 10 Q1 11 Q2 11 Q3 11 Q4 11 Q1 12 Q2 12 Q3 12 Q4 12
(bps)
1 1
1
Loan Loss Provisions
Pre-crisis (2004-2008) 5Y Average: 91bps
Comments

Agenda
Appendix
SEE Operations Overview
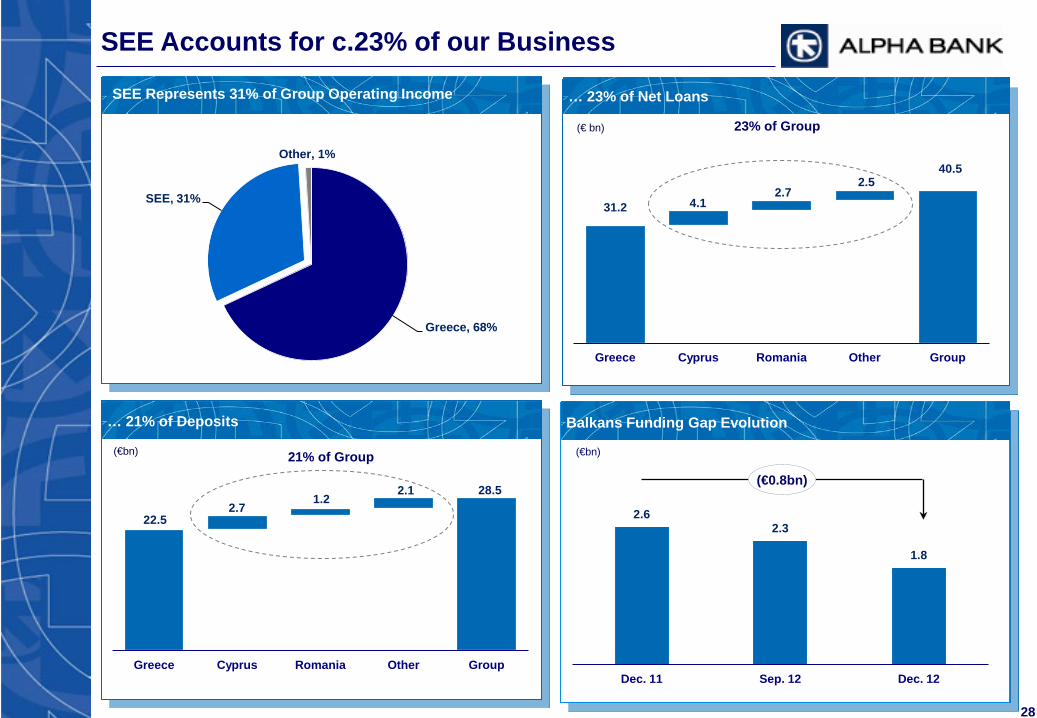
Greece, 68%
SEE, 31%
Other, 1%
31.2 4.1 2.7
2.5 40.5
Greece Cyprus Romania Other Group
22.5 2.7
1.2 2.1 28.5
Greece Cyprus Romania Other Group
28
SEE Accounts for c.23% of our Business
… 23% of Net Loans
… 21% of Deposits
(€ bn) 23% of Group
SEE Represents 31% of Group Operating Income
Balkans Funding Gap Evolution
2.6 2.3
1.8
Dec. 11 Sep. 12 Dec. 12
(€bn) 21% of Group (€bn)
(€0.8bn)

29
Loans 4,578 0.4% 3,025 (7.9%) 742 (12.6%) 780 (11.5%) 375 (5.2%) 69 (5.3%) 9,681 (4.6%)
Mortgages 2,112 (0.1%) 903 3.3% 160 (1.2%) 199 1.6% 102 (8.1%) 16 (5.9%) 3,501 0.6%
Consumer Credit
257 (8.9%) 204 (10.3%) 68 (9.9%) 158 (18.4%) 7 (14.2%) 25 (15.9%) 781 (11.4%)
Businesses 2,208 2.1% 1,918 (12.2%) 513 (16.0%) 423 (14.0%) 266 (3.8%) 28 6.7% 5,399 (6.7%)
Deposits 2,658 (0.3%) 1,241 7.0% 341 (5.5%) 585 2.3% 468 5.4% 69 8.8% 5,421 2.1%
Cyprus Bulgaria Romania Serbia Albania FYROM TOTAL Δ% Δ% Δ% Δ% Δ% Δ% Δ% (€mm)
Dec. 2012 yoy yoy yoy yoy yoy yoy yoy
SEE: Deleveraging in Progress

30
Operating Income 174.2 (12.5%) 152.6 (14.7%) 49.4 26.8% 41.1 (9.1%) 20.8 7.8% 4.2 (26.6%) 462.6 (8.2%)
Operating Expenses (pre-O/H allocation)
63.7 3.6% 85.6 (7.4%) 33.6 (1.4%) 40.4 (8.3%) 14.3 (5.4%) 8.2 0.3% 260.0 (2.9%)
Impairment Losses
164.8 25.9% 88.9 19.5% 38.3 40.6% 15.7 44.3% 4.6 (46.2%) 0.2 (81.6%) 314.2 23.7%
Profit Before Tax (pre- O/H allocation)
(54.3) … (21.9) … (22.5) 0.9% (15.0) 54.6% 1.9 … (4.1) 22.1% (111.6) …
Loan Market Share
6.4% 6.2% 2.8% 4.5% 9.4% 1.9%
NPL Ratio 23.6% 13.8% 21.7% 17.2% 16.5% 30.4% 19.4% +695bps
Branches 31 150 88 134 42 19 487 -45
Employees 833 2,123 819 1,433 385 242 6,190 -360
(€mm) Cyprus Bulgaria Romania Serbia Albania FYROM SE Europe Δ% Δ% Δ% Δ% Δ% Δ% Δ%
Dec. 2012 yoy yoy yoy yoy yoy yoy yoy
SEE: Performance Affected by Deleveraging and Impairments
Agenda
Appendix
Greece macro economy overview

The Green k Shoots Of Recovery
70
80
90
100
110
120
130
140
150
160
2000
2001
2002
2003
2004
2005
2006
2007
2008
2009
2010
2011
2012
2013
Germany
Italy
Ireland
SpainPortugal
Greece
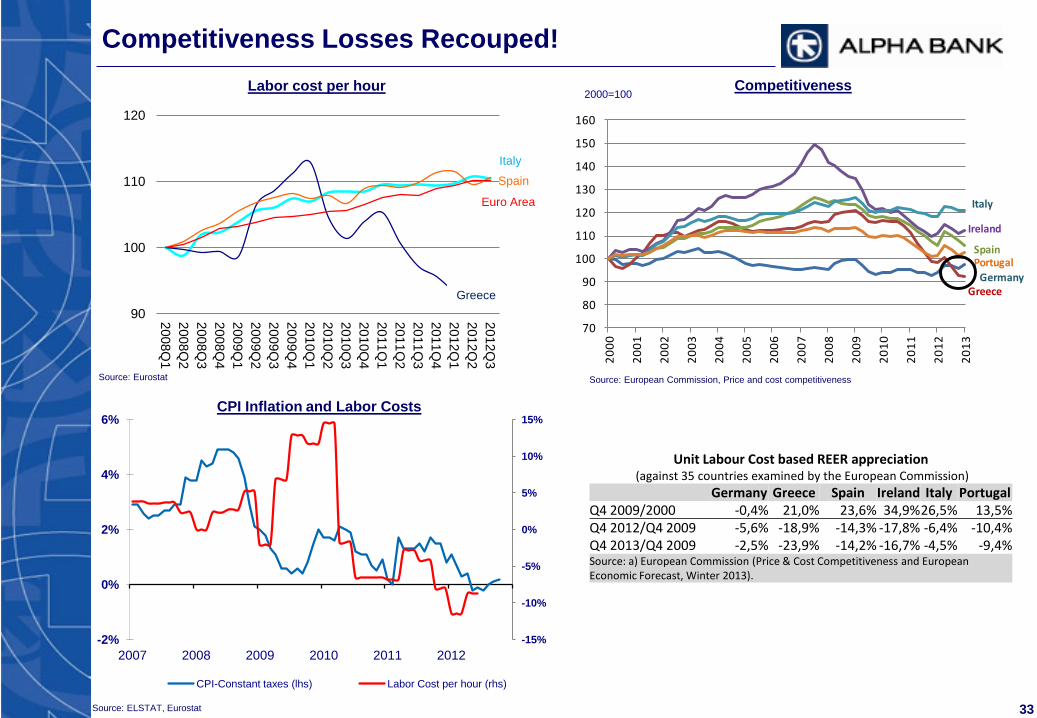
Competitiveness Losses Recouped! Labor cost per hour Competitiveness
Source: Eurostat
2000=100
Source: European Commission, Price and cost competitiveness
90
100
110
120
2008Q1
2008Q2
2008Q3
2008Q4
2009Q1
2009Q2
2009Q3
2009Q4
2010Q1
2010Q2
2010Q3
2010Q4
2011Q1
2011Q2
2011Q3
2011Q4
2012Q1
2012Q2
2012Q3
Greece
Spain
Euro Area
Italy
Unit Labour Cost based REER appreciation (against 35 countries examined by the European Commission)
Germany Greece Spain Ireland Italy Portugal Q4 2009/2000 -0,4% 21,0% 23,6% 34,9% 26,5% 13,5% Q4 2012/Q4 2009 -5,6% -18,9% -14,3% -17,8% -6,4% -10,4% Q4 2013/Q4 2009 -2,5% -23,9% -14,2% -16,7% -4,5% -9,4% Source: a) European Commission (Price & Cost Competitiveness and European Economic Forecast, Winter 2013).
-15%
-10%
-5%
0%
5%
10%
15%
-2%
0%
2%
4%
6%
2007 2008 2009 2010 2011 2012
CPI-Constant taxes (lhs) Labor Cost per hour (rhs)
CPI Inflation and Labor Costs
Source: ELSTAT, Eurostat 33

External Balance Restored!
External Balance
60
80
100
120
140
160
2007 2008 2009 2010 2011 2012
Value of Exports of Goods Greece
Value of Imports of Goods Greece
Value of Exports of Goods EuroArea
2007=100
Source: Bank of Greece
15,4 14,1 13,3
9,6 10,5 10,0
12,2 14,0 14,6
13,617,3 17,6
31,8 30,124,1
Non-OilExports
Shipping
Tourism
OilImports
2011 2012
Non-Oil Imports
2010
2010 2011 2012 Exports of goods and services as % of GDP 20.5% 23.4% 25.4% yoy % change 7.7% 7.2% 0.6% Non-oil Imports of goods and services as % of GDP 21.2% 21.2% 18.8% yoy % change -5.5% -6.1% -17.6% Imports of oil as % of GDP 6.1% 8.3% 9.0% Current Account Deficit* in € bn 20.4 18.8 3.3 as % of GDP 9.2% 8.6% 1.7% Source: Bank of Greece, ELSTAT * including capital tranfers
-4%
-2%
0%
2%
4%
6%
8%
10%
2007 2008 2009 2010 2011 2012 2013 Industrial Goods Services
Tradables vs Non-Tradables Inflation
* Net of EU transfers and Income Balance
(In € bn)
34
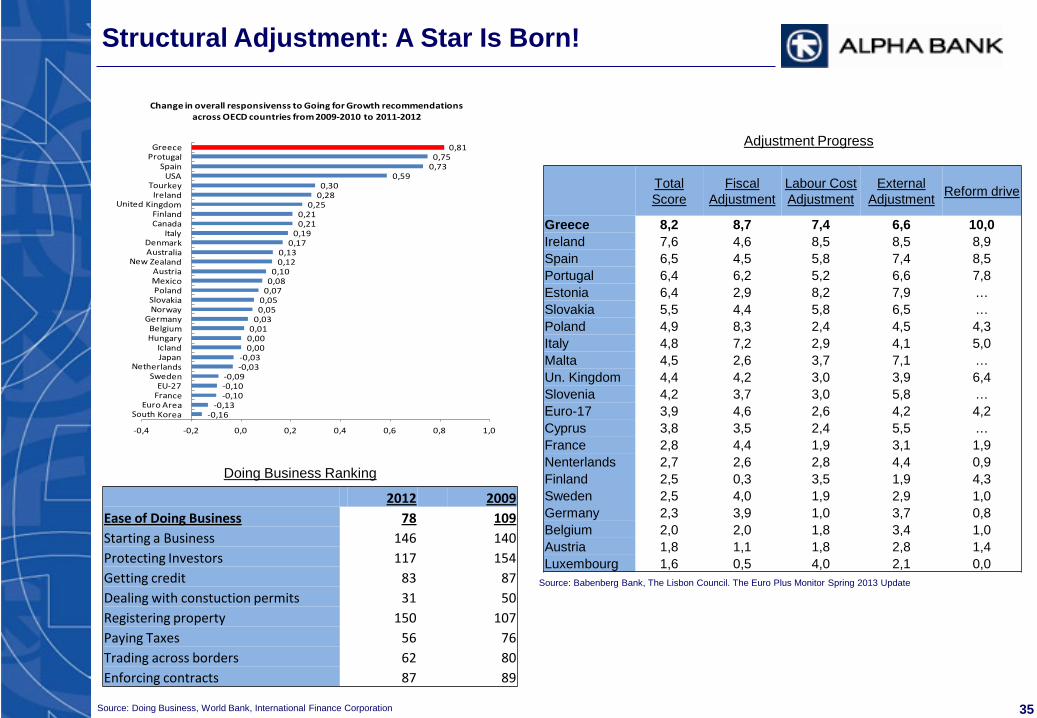
Structural Adjustment: A Star Is Born!
Doing Business Ranking
Source: Doing Business, World Bank, International Finance Corporation
Source: OECD, Going for Growth, 2013
Adjustment Progress
Source: Babenberg Bank, The Lisbon Council. The Euro Plus Monitor Spring 2013 Update
-0,16-0,13
-0,10-0,10-0,09
-0,03-0,03
0,000,000,010,030,050,050,070,080,10
0,120,13
0,170,19
0,210,21
0,250,280,30
0,590,730,75
0,81
-0,4 -0,2 0,0 0,2 0,4 0,6 0,8 1,0
Change in overall responsivenss to Going for Growth recommendations across OECD countries from 2009-2010 to 2011-2012
2012 2009 Ease of Doing Business 78 109 Starting a Business 146 140 Protecting Investors 117 154 Getting credit 83 87 Dealing with constuction permits 31 50 Registering property 150 107 Paying Taxes 56 76 Trading across borders 62 80 Enforcing contracts 87 89
Total Score
Fiscal Adjustment
Labour Cost Adjustment
External Adjustment Reform drive
Greece 8,2 8,7 7,4 6,6 10,0 Ireland 7,6 4,6 8,5 8,5 8,9 Spain 6,5 4,5 5,8 7,4 8,5 Portugal 6,4 6,2 5,2 6,6 7,8 Estonia 6,4 2,9 8,2 7,9 … Slovakia 5,5 4,4 5,8 6,5 … Poland 4,9 8,3 2,4 4,5 4,3 Italy 4,8 7,2 2,9 4,1 5,0 Malta 4,5 2,6 3,7 7,1 … Un. Kingdom 4,4 4,2 3,0 3,9 6,4 Slovenia 4,2 3,7 3,0 5,8 … Εuro-17 3,9 4,6 2,6 4,2 4,2 Cyprus 3,8 3,5 2,4 5,5 … France 2,8 4,4 1,9 3,1 1,9 Nenterlands 2,7 2,6 2,8 4,4 0,9 Finland 2,5 0,3 3,5 1,9 4,3 Sweden 2,5 4,0 1,9 2,9 1,0 Germany 2,3 3,9 1,0 3,7 0,8 Belgium 2,0 2,0 1,8 3,4 1,0 Austria 1,8 1,1 1,8 2,8 1,4 Luxembourg 1,6 0,5 4,0 2,1 0,0
35
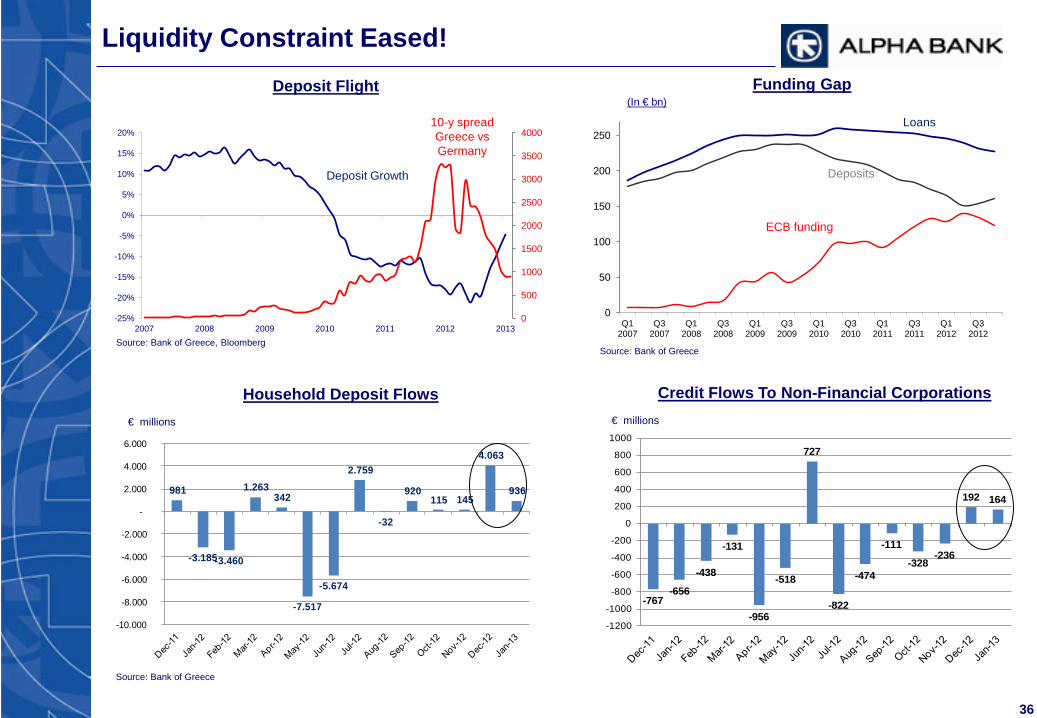
Liquidity Constraint Eased! Deposit Flight Funding Gap
0
500
1000
1500
2000
2500
3000
3500
4000
-25%
-20%
-15%
-10%
-5%
0%
5%
10%
15%
20%
2007 2008 2009 2010 2011 2012 2013
Deposit Growth
10-y spread Greece vs Germany
(In € bn)
Source: Bank of Greece Source: Bank of Greece, Bloomberg
ECB funding
0
50
100
150
200
250
Q1 2007
Q3 2007
Q1 2008
Q3 2008
Q1 2009
Q3 2009
Q1 2010
Q3 2010
Q1 2011
Q3 2011
Q1 2012
Q3 2012
Deposits
Loans
981
-3.185 -3.460
1.263 342
-7.517
-5.674
2.759
-32
920 115 145
4.063
936
-10.000
-8.000
-6.000
-4.000
-2.000
-
2.000
4.000
6.000
Household Deposit Flows € millions
Source: Bank of Greece
-767-656
-438
-131
-956
-518
727
-822
-474
-111
-328-236
192 164
-1200
-1000
-800
-600
-400
-200
0
200
400
600
800
1000
€ millions
Credit Flows To Non-Financial Corporations
36
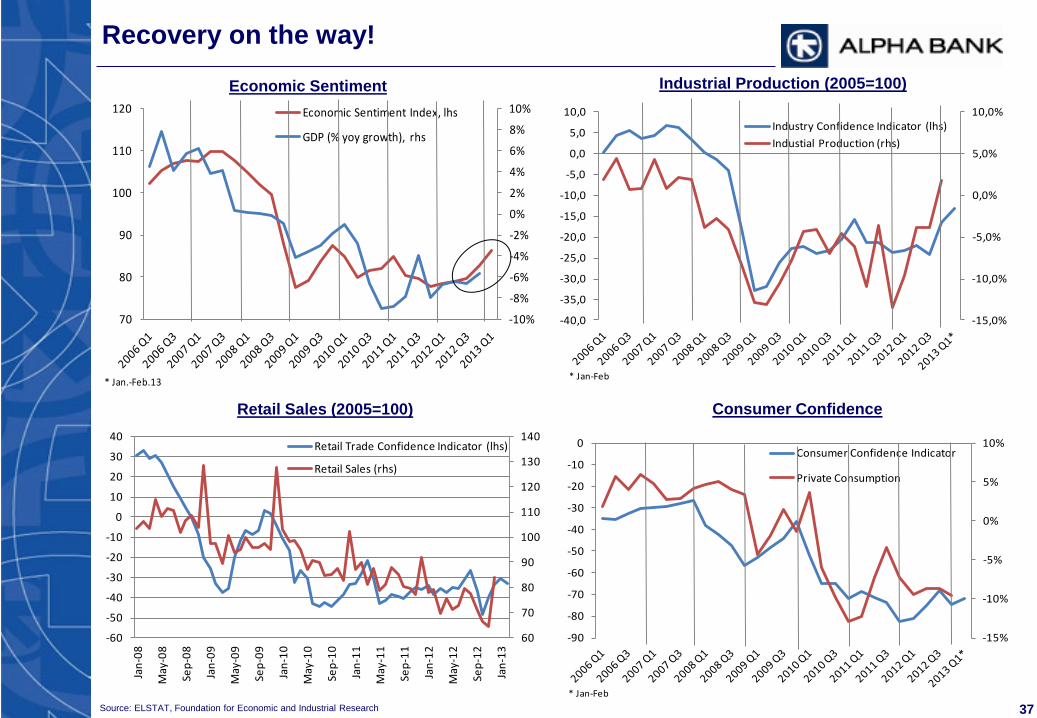
Recovery on the way!
Source: ELSTAT, Foundation for Economic and Industrial Research
-10%
-8%
-6%
-4%
-2%
0%
2%
4%
6%
8%
10%
70
80
90
100
110
120 Economic Sentiment Index, lhs
GDP (% yoy growth), rhs
* Jan.-Feb.13
Economic Sentiment
-15,0%
-10,0%
-5,0%
0,0%
5,0%
10,0%
-40,0
-35,0
-30,0
-25,0
-20,0
-15,0
-10,0
-5,0
0,0
5,0
10,0Industry Confidence Indicator (lhs)
Industial Production (rhs)
* Jan-Feb
Industrial Production (2005=100)
60
70
80
90
100
110
120
130
140
-60
-50
-40
-30
-20
-10
0
10
20
30
40
Jan-
08
May
-08
Sep-
08
Jan-
09
May
-09
Sep-
09
Jan-
10
May
-10
Sep-
10
Jan-
11
May
-11
Sep-
11
Jan-
12
May
-12
Sep-
12
Jan-
13
Retail Trade Confidence Indicator (lhs)
Retail Sales (rhs)
Retail Sales (2005=100) Consumer Confidence
-15%
-10%
-5%
0%
5%
10%
-90
-80
-70
-60
-50
-40
-30
-20
-10
0Consumer Confidence Indicator
Private Consumption
* Jan-Feb
37
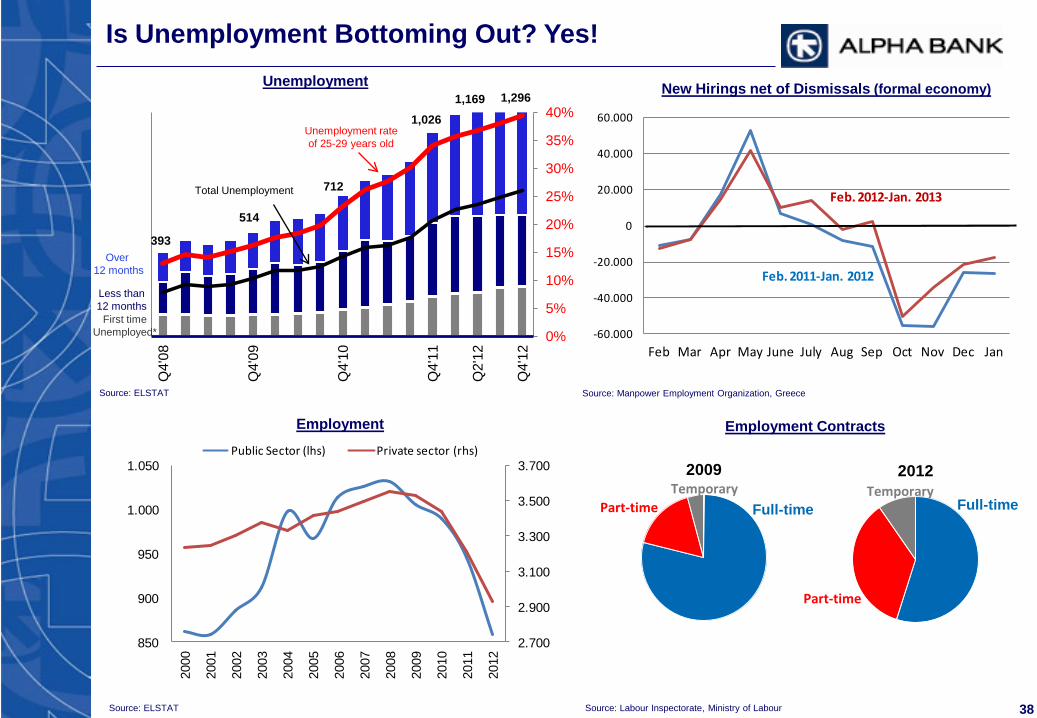
Is Unemployment Bottoming Out? Yes!
0%
5%
10%
15%
20%
25%
30%
35%
40%
0.0
100.0
200.0
300.0
400.0
500.0
600.0
700.0
800.0
900.0
1,000.0
1,100.0
1,200.0
1,300.0
1,400.0
Q4'
08
Q4'
09
Q4'
10
Q4'
11
Q2'
12
Q4'
12
Unemployment rate of 25-29 years old
Total Unemployment
Less than 12 months
First time Unemployed*
Over 12 months
393
514
712
1,026 1,169
Unemployment New Hirings net of Dismissals (formal economy)
Source: ELSTAT Source: Manpower Employment Organization, Greece
1,296
-60.000
-40.000
-20.000
0
20.000
40.000
60.000
Feb Mar Apr May June July Aug Sep Oct Nov Dec Jan
Feb. 2012-Jan. 2013
Feb. 2011-Jan. 2012
2.700
2.900
3.100
3.300
3.500
3.700
850
900
950
1.000
1.050
2000
2001
2002
2003
2004
2005
2006
2007
2008
2009
2010
2011
2012
Public Sector (lhs) Private sector (rhs)
Source: ELSTAT
2009
Full-time Temporary
Part-time
2012
Full-time Temporary
Part-time
Employment Employment Contracts
Source: Labour Inspectorate, Ministry of Labour 38
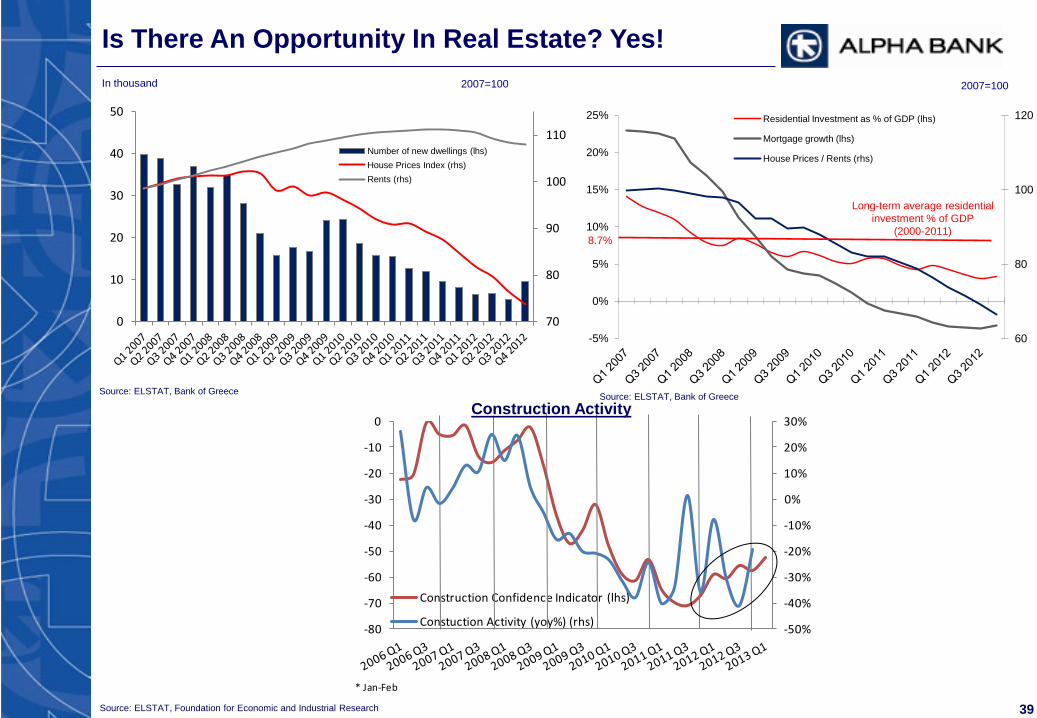
Is There An Opportunity In Real Estate? Yes!
60
80
100
120
-5%
0%
5%
10%
15%
20%
25% Residential Investment as % of GDP (lhs)
Mortgage growth (lhs)
House Prices / Rents (rhs)
Long-term average residential investment % of GDP
(2000-2011)
In thousand 2007=100
Source: ELSTAT, Bank of Greece Source: ELSTAT, Bank of Greece
2007=100
8.7%
70
80
90
100
110
0
10
20
30
40
50
Number of new dwellings (lhs) House Prices Index (rhs) Rents (rhs)
Source: ELSTAT, Foundation for Economic and Industrial Research
-50%
-40%
-30%
-20%
-10%
0%
10%
20%
30%
-80
-70
-60
-50
-40
-30
-20
-10
0
Construction Confidence Indicator (lhs)
Constuction Activity (yoy%) (rhs)
* Jan-Feb
Construction Activity
39
Agenda
Appendix
Financial Review

41
Solid Loan Contribution to NII Continues...
NII – Loans Contribution Volumes1 and Spreads
Gross Balances at quarter end
(bps)
Lending Spreads
Deleveraging Re-pricing/ Benchmark Rate
1 Net loans balances 2 Emporiki data as of 31/01/2013
Loans Spreads - Group
(bps)
44,876 40,495
55,459
Dec. 11 Dec. 12 Pro forma Alpha-Emporiki
972 996 1,005 972
999
818 843 856 884 882
395 379 380
384
411
310 325 386
395
405
232 251 253 256 255
Q4 11 Q1 12 Q2 12 Q3 12 Q4 12
Consumer Credit - Greece
Small Business Loans - Greece
SE Europe
Medium & Large Business - Greece
Mortgages - Greece
490 493 510 504 506
Q4 11 Q1 12 Q2 12 Q3 12 Q4 12
383 427
FY 11 FY 12
370 375 379 387 390 401 430 436 444
Q4 10 Q1 11 Q2 11 Q3 11 Q4 11 Q1 12 Q2 12 Q3 12 Q4 12
+20bps
+54bps
€49.7bn €45.1bn
(€mm) +€16mn
(9.8%)
(€mm) (bps)
+44bps
2
42
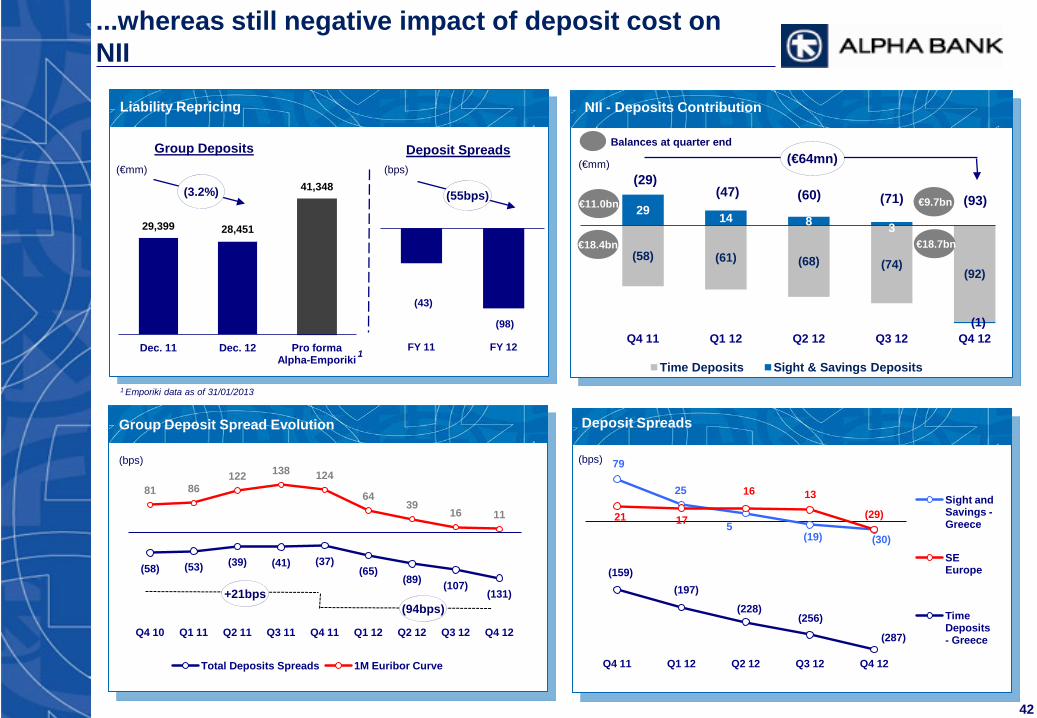
...whereas still negative impact of deposit cost on NII
NII - Deposits Contribution
Balances at quarter end
Deposit Spreads
Liability Repricing
(55bps)
Group Deposit Spread Evolution
29,399 28,451
41,348
Dec. 11 Dec. 12 Pro forma Alpha-Emporiki
(bps) (bps)
(€mm) Group Deposits Deposit Spreads
(€mm) (bps)
(3.2%)
(58) (61) (68) (74) (92)
29 14 8 3
(1) Q4 11 Q1 12 Q2 12 Q3 12 Q4 12
Time Deposits Sight & Savings Deposits
(43)
(98)
FY 11 FY 12
(58) (53) (39) (41) (37) (65)
(89) (107) (131)
81 86 122 138 124
64 39
16 11
Q4 10 Q1 11 Q2 11 Q3 11 Q4 11 Q1 12 Q2 12 Q3 12 Q4 12
Total Deposits Spreads 1M Euribor Curve
€11.0bn
€18.4bn
€9.7bn
€18.7bn
+21bps (94bps)
(€64mn)
(93) (29)
(71) (60) (47)
79
25
5 (19) (30)
21 17
16 13
(29)
(159) (197)
(228) (256)
(287)
Q4 11 Q1 12 Q2 12 Q3 12 Q4 12
Sight and Savings - Greece
SE Europe
Time Deposits - Greece
1
1 Emporiki data as of 31/01/2013
43
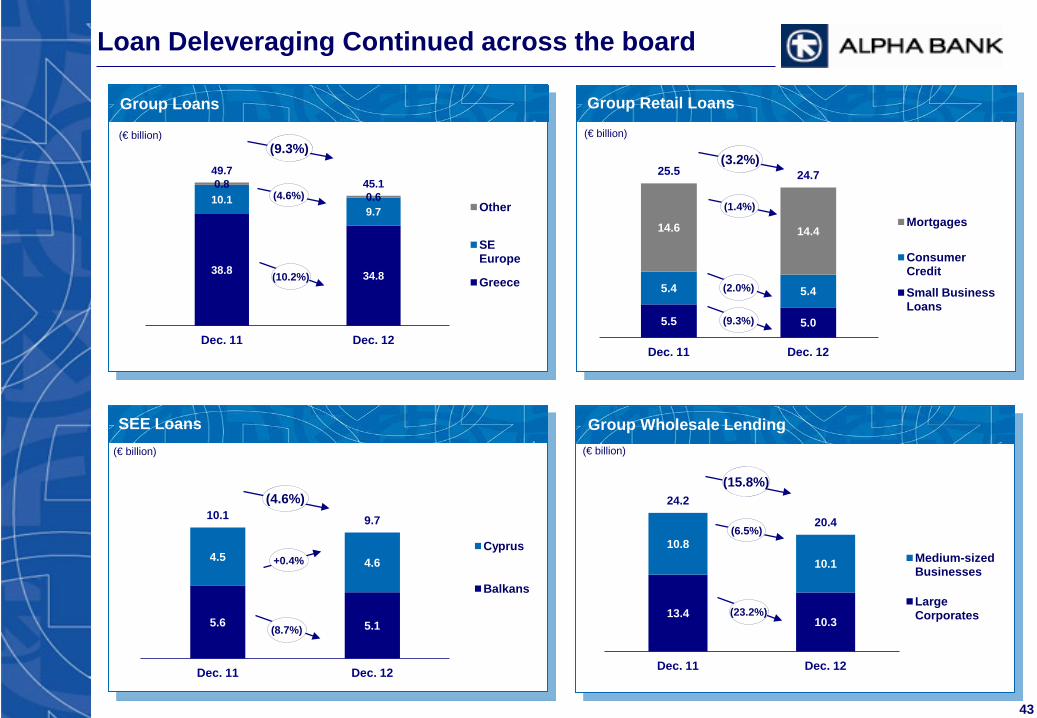
Group Wholesale Lending
(€ billion)
(€ billion)
(€ billion)
Loan Deleveraging Continued across the board
Group Loans Group Retail Loans
SEE Loans (€ billion)
38.8 34.8
10.1 9.7
0.8 0.6
49.7 45.1
Dec. 11 Dec. 12
Other
SE Europe
Greece
5.5 5.0
5.4 5.4
14.6 14.4
25.5 24.7
Dec. 11 Dec. 12
Mortgages
Consumer Credit
Small Business Loans
5.6 5.1
4.5 4.6
10.1 9.7
Dec. 11 Dec. 12
Cyprus
Balkans
13.4 10.3
10.8 10.1
24.2
20.4
Dec. 11 Dec. 12
Medium-sized Businesses
Large Corporates
(9.3%)
(10.2%)
(4.6%)
(3.2%)
(2.0%)
(1.4%)
(4.6%)
(8.7%)
+0.4%
(9.3%)
(15.8%)
(23.2%)
(6.5%)

44
Deposit inflows continued in the first months of 2013
Reversal of deposit trends in Greece following June elections with Alpha Bank outperforming the market
Stability of deposits abroad, despite negative developments in Greece
Alpha Bank deposit trends broadly in line with Greek system’s deposit evolution
Evolution of Alpha Bank Deposits
22.1
(2.3)
19.8
0.7
20.5
2.0
22.5
1.2
5.8 5.8 5.8
0.2
6.0
27.9 25.6 26.3
28.5
Mar. 12 Δ Q2 2012 Jun. 12 Δ Q3 2012 Sep. 12 Δ Q4 2012 Dec. 12 Δ Jan. & Feb. 13
Abroad
Greece
(€bn) (8.1%) qoq +2.6% qoq +8.3% qoq
Comments

45
Customer Assets
Deposit Evolution Breakdown
(€ billion) (€ million)
Core Deposits
Time Deposits:
Deposits Evolution – Group
10,996
(1,002) (421) (48)
194 9,719
Dec. 11 Q1 12 Q2 12 Q3 12 Q4 12 Dec. 12
18,403
(545) (1,832)
725 1,981 18,732
Dec. 11 Q1 12 Q2 12 Q3 12 Q4 12 Dec. 12
On Balance Sheet
Sight & Savings Deposits
Time Deposits Money Morket Mutual Funds
Other Mutual Funds
Private Banking
11.0 9.7
18.4 18.7
0.1 0.1
0.7 0.8
1.5 1.6
Dec.11 Dec. 12
Investment Balances
30.9 31.7
Liquidity
Transaction Balances
(2.5%)
(11.6%)
+1.8%

46
NII Impacted by Higher Funding Cost and Cost of Deposits
(€ million)
(€ million)
Group Net Interest Income
Net Fee & Commission Income Trading Income
Group NII decomposition (€ million)
429 450 451 453 414 365 334 284
Q1 11 Q2 11 Q3 11 Q4 11 Q1 12 Q2 12 Q3 12 Q4 12
(50) (34) (35) (29) (47) (60) (71) (93)
474 478 490 490 493 510 504 506
2.6% 2.8% 2.9% 3.0% 2.8% 2.6% 2.3% 2.0%
Q1 11 Q2 11 Q3 11 Q4 11 Q1 12 Q2 12 Q3 12 Q4 12
Loans
Deposits
NIM
1 Adjusted for the trading loss of €288.3mn resulting from the recognition of new GGBs at their market value at the transaction date
1
261.3 248.5
23.5 17.4
9.4 6.9
294.2 272.8
FY 11 FY 12 Investment Banking & Brokerage Asset Management Commercial & Corporate Banking
31.0 32.5
111.3
23.4
142.3
55.9
FY 11 FY 12
Foreign Exchange Bonds & Other
(21.7%)
1,784 1,397
(€ million) (7.3%)

47
(€ million) (€ million)
Mortgage Balances - Greece
Retail Lending
Consumer Credit Balances - Greece
Small Business Lending Balances - Greece
(€ million)
(€ million)
(€ million)
Stricter underwriting caused housing loans rejection rate to increase to 56% from 48% a year ago
New production mortgages LTV at 40%, total book average LTV at 54%
Consumer loan rejection rate at 71% from 69% a year ago
Comments
11,106 10,878
Dec. 11 Dec. 12
3,248 3,285
1,324 1,281
4,572 4,566
Dec. 11 Dec. 12
Credit cards
Consumer loans
1,970 1,695
2,659 2,520
4,629 4,215
Dec. 11 Dec. 12
Credit limits from € 150.000 to € 1 mn
Credit limits up to € 150.000
(0.1%)
(3.3%)
(8.9%)
(13.9%)
(5.2%)
(2.1%)
+1.1%
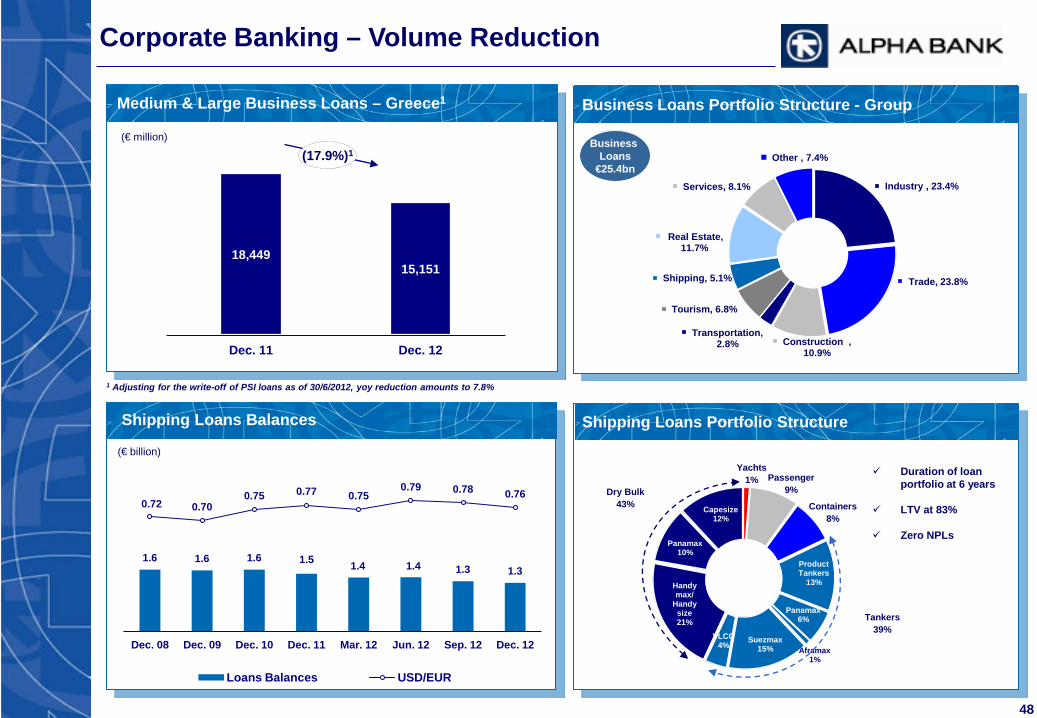
Product Tankers
13%
Panamax 6%
Aframax 1%
Suezmax 15%
VLCC 4%
Handy max/
Handy size 21%
Panamax 10%
Capesize 12%
Industry , 23.4%
Trade, 23.8%
Construction , 10.9%
Transportation, 2.8%
Tourism, 6.8%
Shipping, 5.1%
Real Estate, 11.7%
Services, 8.1%
Other , 7.4%
18,449 15,151
Dec. 11 Dec. 12
48
(€ million)
Medium & Large Business Loans – Greece1
Corporate Banking – Volume Reduction
(€ billion)
Business Loans Portfolio Structure - Group
Business Loans
€25.4bn
Duration of loan portfolio at 6 years
LTV at 83%
Zero NPLs
Shipping Loans Balances
Tankers 39%
Dry Bulk 43%
Shipping Loans Portfolio Structure
Yachts 1% Passenger
9%
Containers 8%
1.6 1.6 1.6 1.5 1.4 1.4 1.3 1.3
0.72 0.70 0.75 0.77 0.75
0.79 0.78 0.76
Dec. 08 Dec. 09 Dec. 10 Dec. 11 Mar. 12 Jun. 12 Sep. 12 Dec. 12
Loans Balances USD/EUR
1 Adjusting for the write-off of PSI loans as of 30/6/2012, yoy reduction amounts to 7.8%
(17.9%)1
49
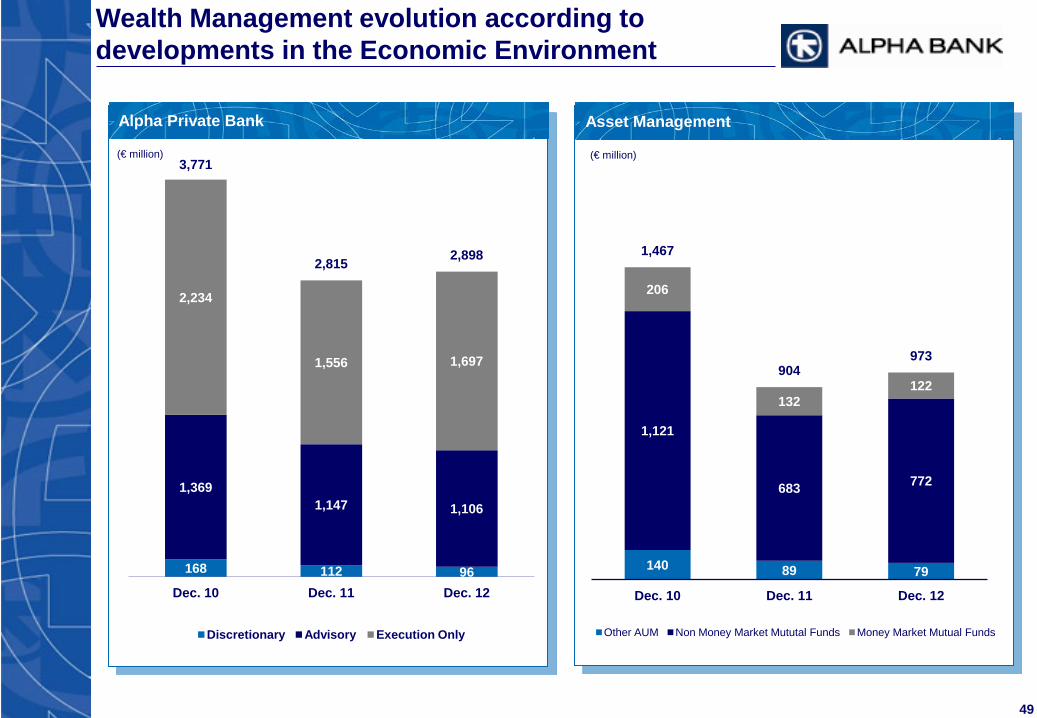
Wealth Management evolution according to developments in the Economic Environment
Asset Management Alpha Private Bank
(€ million) (€ million)
168 112 96
1,369 1,147 1,106
2,234
1,556 1,697
3,771
2,815 2,898
Dec. 10 Dec. 11 Dec. 12
Discretionary Advisory Execution Only
140 89 79
1,121
683 772
206
132 122
1,467
904 973
Dec. 10 Dec. 11 Dec. 12
Other AUM Non Money Market Mututal Funds Money Market Mutual Funds

Agenda
Appendix
Group Profit & Loss & Business Unit Financials
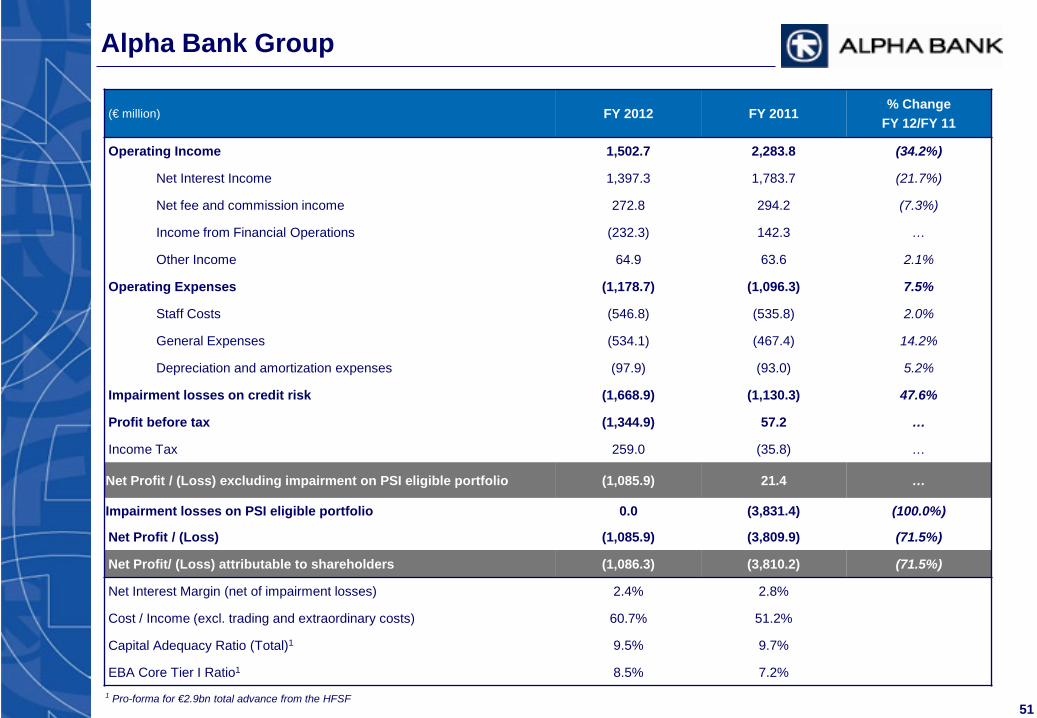
51
(€ million) FY 2012 FY 2011 % Change
FY 12/FY 11
Operating Income 1,502.7 2,283.8 (34.2%)
Net Interest Income 1,397.3 1,783.7 (21.7%)
Net fee and commission income 272.8 294.2 (7.3%)
Income from Financial Operations (232.3) 142.3 …
Other Income 64.9 63.6 2.1%
Operating Expenses (1,178.7) (1,096.3) 7.5%
Staff Costs (546.8) (535.8) 2.0%
General Expenses (534.1) (467.4) 14.2%
Depreciation and amortization expenses (97.9) (93.0) 5.2%
Impairment losses on credit risk (1,668.9) (1,130.3) 47.6%
Profit before tax (1,344.9) 57.2 …
Income Tax 259.0 (35.8) …
Net Profit / (Loss) excluding impairment on PSI eligible portfolio (1,085.9) 21.4 …
Impairment losses on PSI eligible portfolio 0.0 (3,831.4) (100.0%)
Net Profit / (Loss) (1,085.9) (3,809.9) (71.5%)
Net Profit/ (Loss) attributable to shareholders (1,086.3) (3,810.2) (71.5%)
Net Interest Margin (net of impairment losses) 2.4% 2.8%
Cost / Income (excl. trading and extraordinary costs) 60.7% 51.2%
Capital Adequacy Ratio (Total)1 9.5% 9.7%
EBA Core Tier I Ratio1 8.5% 7.2%
Alpha Bank Group
1 Pro-forma for €2.9bn total advance from the HFSF

52
(€ million) Q4 2012 Q3 2012 Q2 2012 Q1 2012 Q4 2011 Q3 2011 Q2 2011 Q1 2011
Operating Income 433.1 407.4 453.8 208.3 553.3 614.4 564.0 552.0
Net Interest Income 284.5 333.7 364.7 414.5 453.1 451.3 450.0 429.4
Net fee and commission income 74.6 64.8 68.8 64.5 77.7 72.2 74.4 69.9
Income from Financial Operations 56.5 (12.7) 6.0 (282.2) 10.2 76.0 20.1 35.9
Other Income 17.6 21.6 14.3 11.5 12.3 14.9 19.5 16.9
Operating Expenses (392.9) (259.2) (261.7) (264.8) (264.4) (275.6) (282.4) (273.9)
Staff Costs (167.0) (121.0) (127.8) (130.9) (132.0) (133.2) (137.0) (133.5)
General Expenses (197.1) (114.9) (111.0) (111.0) (109.0) (118.9) (122.7) (116.9)
Depreciation and amortization expenses (28.8) (23.3) (22.9) (22.9) (23.3) (23.5) (22.7) (23.5)
Impairment losses on credit risk (498.4) (450.0) (399.7) (320.7) (302.9) (295.2) (271.9) (260.3)
Profit before tax (458.2) (301.8) (207.6) (377.2) (13.9) 43.5 9.7 17.9
Income Tax 84.0 52.5 59.4 63.0 (6.3) (15.9) (6.3) (7.3)
Net Profit / (Loss) excluding impairment on PSI eligible portfolio (374.2) (249.3) (148.2) (314.2) (20.2) 27.6 3.4 10.5
Impairment losses on PSI eligible portfolio 0.0 0.0 0.0 0.0 (3,223.3) (69.4) (538.6) 0.0
Net Profit / (Loss) (374.2) (249.3) (148.2) (314.2) (3,243.5) (41.8) (535.2) 10.5
Net Profit / (Loss) attributable to shareholders (374.5) (249.3) (148.2) (314.2) (3,243.5) (41.9) (535.3) 10.5
Net Interest Margin (net of impairment losses) 2.0% 2.3% 2.6% 2.8% 3.0% 2.9% 2.8% 2.6%
Cost / Income (excluding trading and extraordinary costs) 71.1% 61.7% 58.4% 54.0% 48.7% 51.2% 51.9% 53.1%
Alpha Bank Group

53
(€ million) Retail Commercial &
Corporate SE Europe Investment Banking & Treasury
Asset Management Other Group
Jan-Dec Jan-Dec Jan-Dec Jan-Dec Jan-Dec Jan-Dec Jan-Dec 2012 2011 2012 2011 2012 2011 2012 2011 2012 2011 2012 2011 2012 2011
Operating Income 946.8 1,006.4 631.4 566.1 462.6 503.7 (246.3) 129.9 37.9 47.5 (329.7) 30.2 1,502.7 2,283.8
Net Interest Income 829.2 881.1 521.1 475.4 377.1 408.4 (343.4) 1.3 11.7 15.5 1.6 2.0 1,397.3 1,783.7
Net fee and Commission Income 106.3 117.7 97.0 84.1 49.0 62.0 (1.3) 1.9 22.1 28.8 (0.2) (0.4) 272.7 294.2
Income from Financial Operations 6.3 6.4 10.4 5.5 15.9 19.3 91.5 120.1 3.9 2.4 (360.3) (11.5) (232.3) 142.3
Other Income 5.0 1.1 3.0 1.1 20.6 13.9 6.9 6.7 0.3 0.7 29.1 40.1 64.9 63.6
Operating Expenses (524.1) (544.1) (129.2) (130.8) (296.6) (307.0) (20.8) (26.9) (27.2) (30.6) (180.7) (56.8) (1,178.7) (1,096.3)
Staff Costs (245.1) (261.4) (81.9) (88.8) (129.3) (137.4) (11.6) (13.6) (14.8) (15.5) (64.1) (19.1) (546.8) (535.8)
General Expenses (241.2) (245.3) (31.9) (31.3) (137.8) (137.1) (2.1) (3.2) (10.6) (13.0) (104.7) (28.7) (534.1) (467.4)
Depreciation (37.9) (37.4) (15.4) (10.7) (29.6) (32.5) (1.3) (1.4) (1.9) (2.1) (11.9) (9.0) (97.9) (93.0)
Impairment Losses (773.1) (466.3) (581.5) (410.0) (314.2) (254.1) 0.0 0.0 0.0 0.0 0.0 (4,788.9) (1,668.8) (5,919.2)
Profit / (Loss) before tax (350.5) (4.1) (79.3) 25.4 (148.3) (57.4) (267.1) 103.0 10.7 16.9 (510.4) (4,815.5) (1,344.9) (4,731.7)
Risk Adjusted Return on 8% Regulatory Capital (33%) 0% (6%) 2% (22%) (8%) (77%) 26% 16% 24% … … (43%) (92%)
Cost / Income Ratio (excl. trading and extraordinary costs) 56% 54% 20% 23% 66% 63% (6%) 273% 80% 68% 193% 136% 68% 51%
Group Results by Business Unit
54
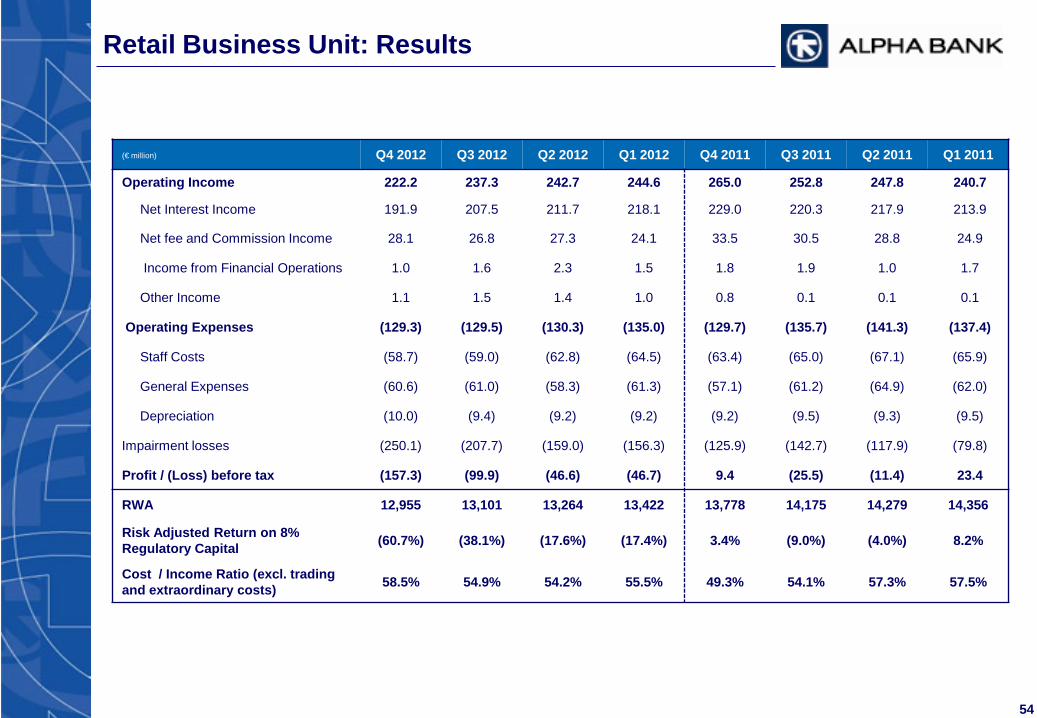
Retail Business Unit: Results
(€ million) Q4 2012 Q3 2012 Q2 2012 Q1 2012 Q4 2011 Q3 2011 Q2 2011 Q1 2011
Operating Income 222.2 237.3 242.7 244.6 265.0 252.8 247.8 240.7
Net Interest Income 191.9 207.5 211.7 218.1 229.0 220.3 217.9 213.9
Net fee and Commission Income 28.1 26.8 27.3 24.1 33.5 30.5 28.8 24.9
Income from Financial Operations 1.0 1.6 2.3 1.5 1.8 1.9 1.0 1.7
Other Income 1.1 1.5 1.4 1.0 0.8 0.1 0.1 0.1
Operating Expenses (129.3) (129.5) (130.3) (135.0) (129.7) (135.7) (141.3) (137.4)
Staff Costs (58.7) (59.0) (62.8) (64.5) (63.4) (65.0) (67.1) (65.9)
General Expenses (60.6) (61.0) (58.3) (61.3) (57.1) (61.2) (64.9) (62.0)
Depreciation (10.0) (9.4) (9.2) (9.2) (9.2) (9.5) (9.3) (9.5)
Impairment losses (250.1) (207.7) (159.0) (156.3) (125.9) (142.7) (117.9) (79.8)
Profit / (Loss) before tax (157.3) (99.9) (46.6) (46.7) 9.4 (25.5) (11.4) 23.4
RWA 12,955 13,101 13,264 13,422 13,778 14,175 14,279 14,356
Risk Adjusted Return on 8% Regulatory Capital (60.7%) (38.1%) (17.6%) (17.4%) 3.4% (9.0%) (4.0%) 8.2%
Cost / Income Ratio (excl. trading and extraordinary costs) 58.5% 54.9% 54.2% 55.5% 49.3% 54.1% 57.3% 57.5%
55
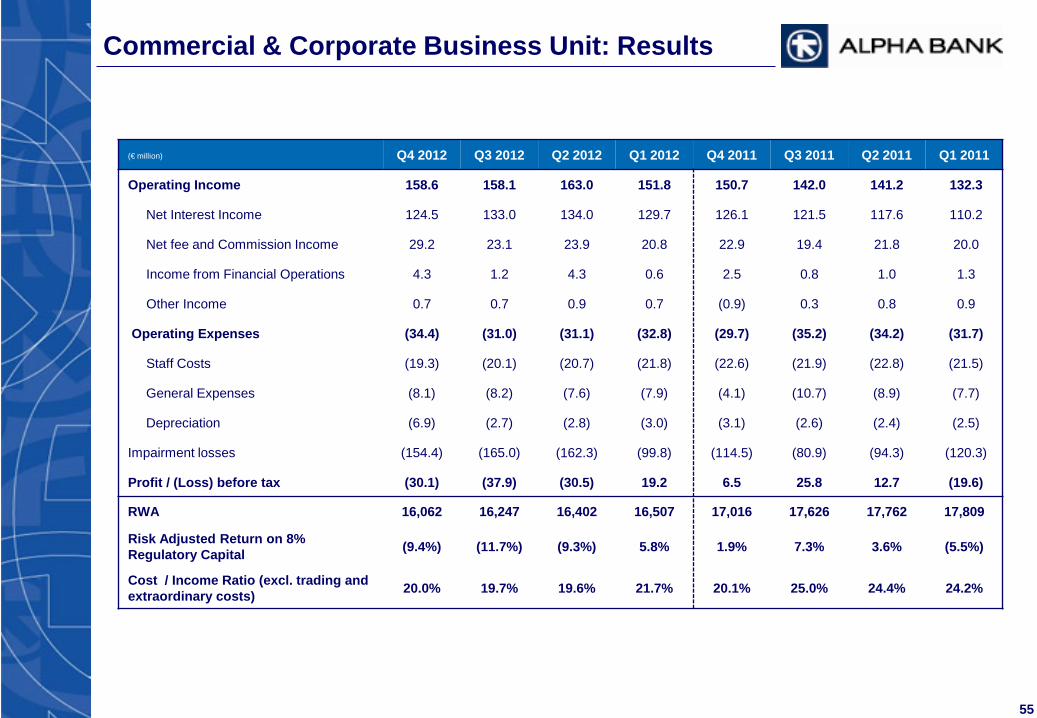
Commercial & Corporate Business Unit: Results
(€ million) Q4 2012 Q3 2012 Q2 2012 Q1 2012 Q4 2011 Q3 2011 Q2 2011 Q1 2011
Operating Income 158.6 158.1 163.0 151.8 150.7 142.0 141.2 132.3
Net Interest Income 124.5 133.0 134.0 129.7 126.1 121.5 117.6 110.2
Net fee and Commission Income 29.2 23.1 23.9 20.8 22.9 19.4 21.8 20.0
Income from Financial Operations 4.3 1.2 4.3 0.6 2.5 0.8 1.0 1.3
Other Income 0.7 0.7 0.9 0.7 (0.9) 0.3 0.8 0.9
Operating Expenses (34.4) (31.0) (31.1) (32.8) (29.7) (35.2) (34.2) (31.7)
Staff Costs (19.3) (20.1) (20.7) (21.8) (22.6) (21.9) (22.8) (21.5)
General Expenses (8.1) (8.2) (7.6) (7.9) (4.1) (10.7) (8.9) (7.7)
Depreciation (6.9) (2.7) (2.8) (3.0) (3.1) (2.6) (2.4) (2.5)
Impairment losses (154.4) (165.0) (162.3) (99.8) (114.5) (80.9) (94.3) (120.3)
Profit / (Loss) before tax (30.1) (37.9) (30.5) 19.2 6.5 25.8 12.7 (19.6)
RWA 16,062 16,247 16,402 16,507 17,016 17,626 17,762 17,809
Risk Adjusted Return on 8% Regulatory Capital (9.4%) (11.7%) (9.3%) 5.8% 1.9% 7.3% 3.6% (5.5%)
Cost / Income Ratio (excl. trading and extraordinary costs) 20.0% 19.7% 19.6% 21.7% 20.1% 25.0% 24.4% 24.2%
56
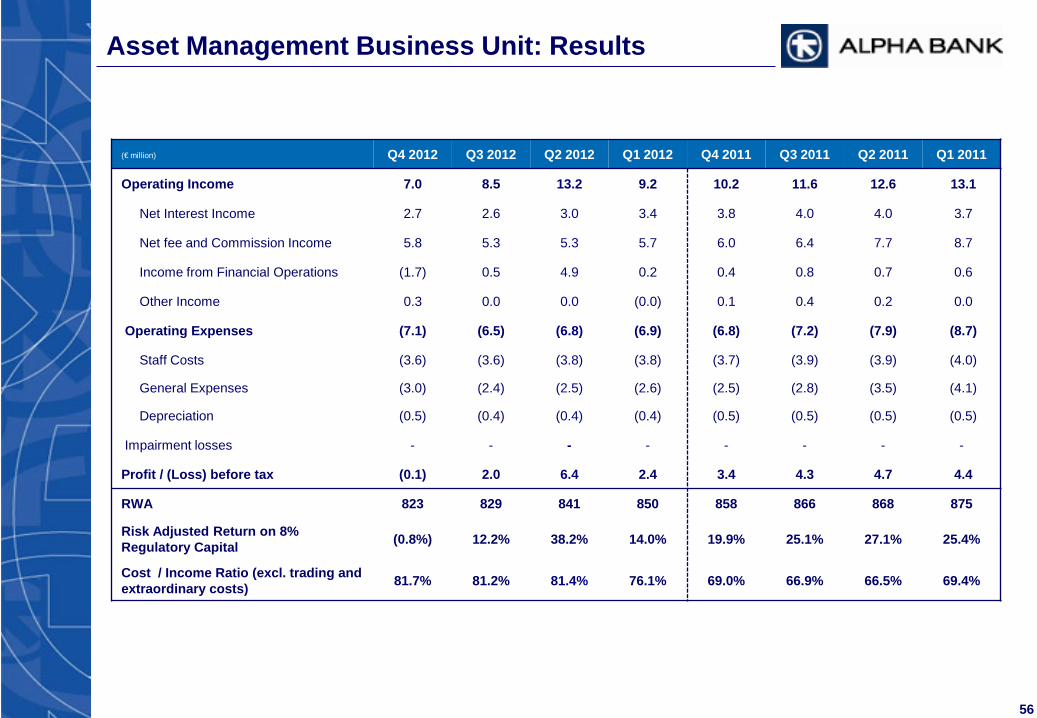
Asset Management Business Unit: Results
(€ million) Q4 2012 Q3 2012 Q2 2012 Q1 2012 Q4 2011 Q3 2011 Q2 2011 Q1 2011
Operating Income 7.0 8.5 13.2 9.2 10.2 11.6 12.6 13.1
Net Interest Income 2.7 2.6 3.0 3.4 3.8 4.0 4.0 3.7
Net fee and Commission Income 5.8 5.3 5.3 5.7 6.0 6.4 7.7 8.7
Income from Financial Operations (1.7) 0.5 4.9 0.2 0.4 0.8 0.7 0.6
Other Income 0.3 0.0 0.0 (0.0) 0.1 0.4 0.2 0.0
Operating Expenses (7.1) (6.5) (6.8) (6.9) (6.8) (7.2) (7.9) (8.7)
Staff Costs (3.6) (3.6) (3.8) (3.8) (3.7) (3.9) (3.9) (4.0)
General Expenses (3.0) (2.4) (2.5) (2.6) (2.5) (2.8) (3.5) (4.1)
Depreciation (0.5) (0.4) (0.4) (0.4) (0.5) (0.5) (0.5) (0.5)
Impairment losses - - - - - - - -
Profit / (Loss) before tax (0.1) 2.0 6.4 2.4 3.4 4.3 4.7 4.4
RWA 823 829 841 850 858 866 868 875
Risk Adjusted Return on 8% Regulatory Capital (0.8%) 12.2% 38.2% 14.0% 19.9% 25.1% 27.1% 25.4%
Cost / Income Ratio (excl. trading and extraordinary costs) 81.7% 81.2% 81.4% 76.1% 69.0% 66.9% 66.5% 69.4%
57
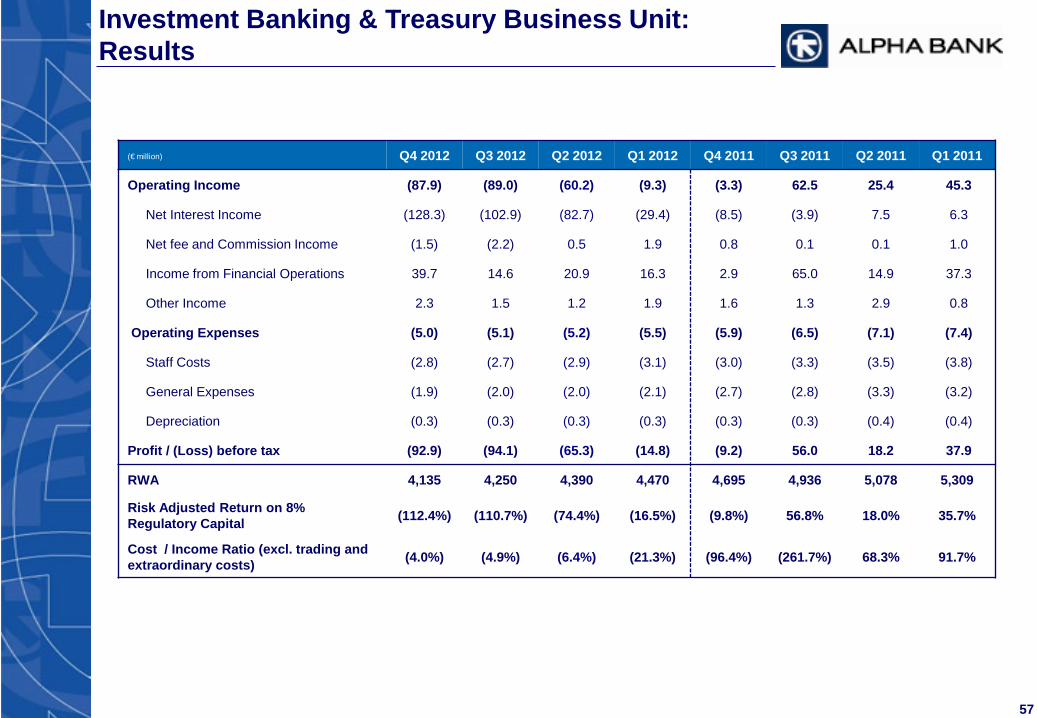
Investment Banking & Treasury Business Unit: Results
(€ million) Q4 2012 Q3 2012 Q2 2012 Q1 2012 Q4 2011 Q3 2011 Q2 2011 Q1 2011
Operating Income (87.9) (89.0) (60.2) (9.3) (3.3) 62.5 25.4 45.3
Net Interest Income (128.3) (102.9) (82.7) (29.4) (8.5) (3.9) 7.5 6.3
Net fee and Commission Income (1.5) (2.2) 0.5 1.9 0.8 0.1 0.1 1.0
Income from Financial Operations 39.7 14.6 20.9 16.3 2.9 65.0 14.9 37.3
Other Income 2.3 1.5 1.2 1.9 1.6 1.3 2.9 0.8
Operating Expenses (5.0) (5.1) (5.2) (5.5) (5.9) (6.5) (7.1) (7.4)
Staff Costs (2.8) (2.7) (2.9) (3.1) (3.0) (3.3) (3.5) (3.8)
General Expenses (1.9) (2.0) (2.0) (2.1) (2.7) (2.8) (3.3) (3.2)
Depreciation (0.3) (0.3) (0.3) (0.3) (0.3) (0.3) (0.4) (0.4)
Profit / (Loss) before tax (92.9) (94.1) (65.3) (14.8) (9.2) 56.0 18.2 37.9
RWA 4,135 4,250 4,390 4,470 4,695 4,936 5,078 5,309
Risk Adjusted Return on 8% Regulatory Capital (112.4%) (110.7%) (74.4%) (16.5%) (9.8%) 56.8% 18.0% 35.7%
Cost / Income Ratio (excl. trading and extraordinary costs) (4.0%) (4.9%) (6.4%) (21.3%) (96.4%) (261.7%) 68.3% 91.7%
58
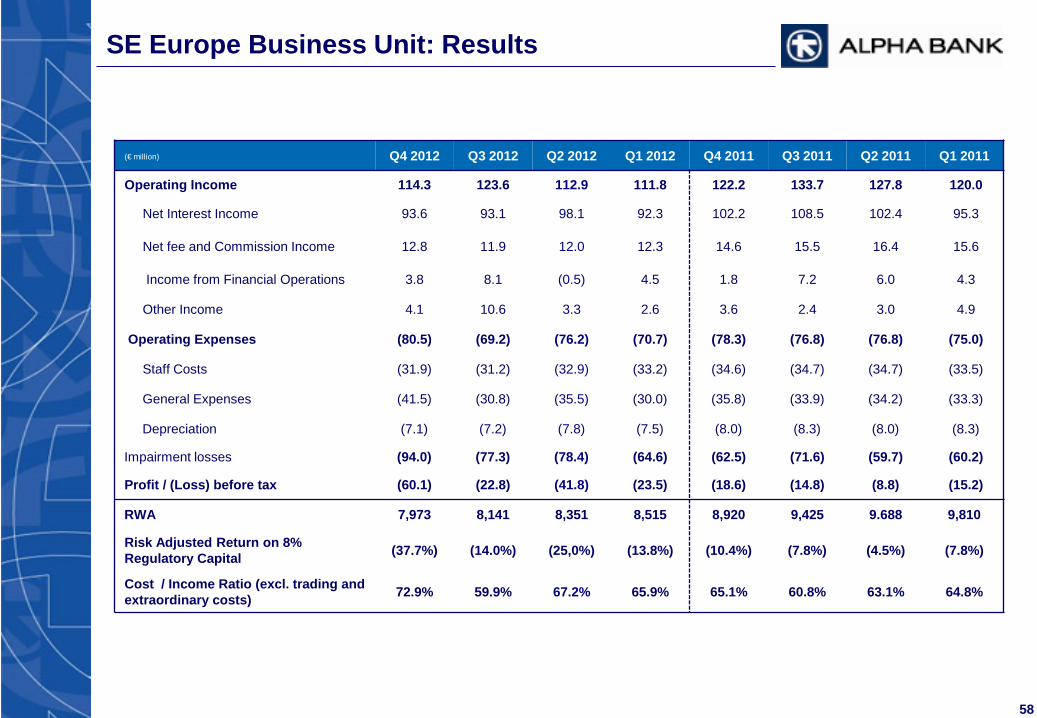
SE Europe Business Unit: Results
(€ million) Q4 2012 Q3 2012 Q2 2012 Q1 2012 Q4 2011 Q3 2011 Q2 2011 Q1 2011
Operating Income 114.3 123.6 112.9 111.8 122.2 133.7 127.8 120.0
Net Interest Income 93.6 93.1 98.1 92.3 102.2 108.5 102.4 95.3
Net fee and Commission Income 12.8 11.9 12.0 12.3 14.6 15.5 16.4 15.6
Income from Financial Operations 3.8 8.1 (0.5) 4.5 1.8 7.2 6.0 4.3
Other Income 4.1 10.6 3.3 2.6 3.6 2.4 3.0 4.9
Operating Expenses (80.5) (69.2) (76.2) (70.7) (78.3) (76.8) (76.8) (75.0)
Staff Costs (31.9) (31.2) (32.9) (33.2) (34.6) (34.7) (34.7) (33.5)
General Expenses (41.5) (30.8) (35.5) (30.0) (35.8) (33.9) (34.2) (33.3)
Depreciation (7.1) (7.2) (7.8) (7.5) (8.0) (8.3) (8.0) (8.3)
Impairment losses (94.0) (77.3) (78.4) (64.6) (62.5) (71.6) (59.7) (60.2)
Profit / (Loss) before tax (60.1) (22.8) (41.8) (23.5) (18.6) (14.8) (8.8) (15.2)
RWA 7,973 8,141 8,351 8,515 8,920 9,425 9.688 9,810
Risk Adjusted Return on 8% Regulatory Capital (37.7%) (14.0%) (25,0%) (13.8%) (10.4%) (7.8%) (4.5%) (7.8%)
Cost / Income Ratio (excl. trading and extraordinary costs) 72.9% 59.9% 67.2% 65.9% 65.1% 60.8% 63.1% 64.8%
59
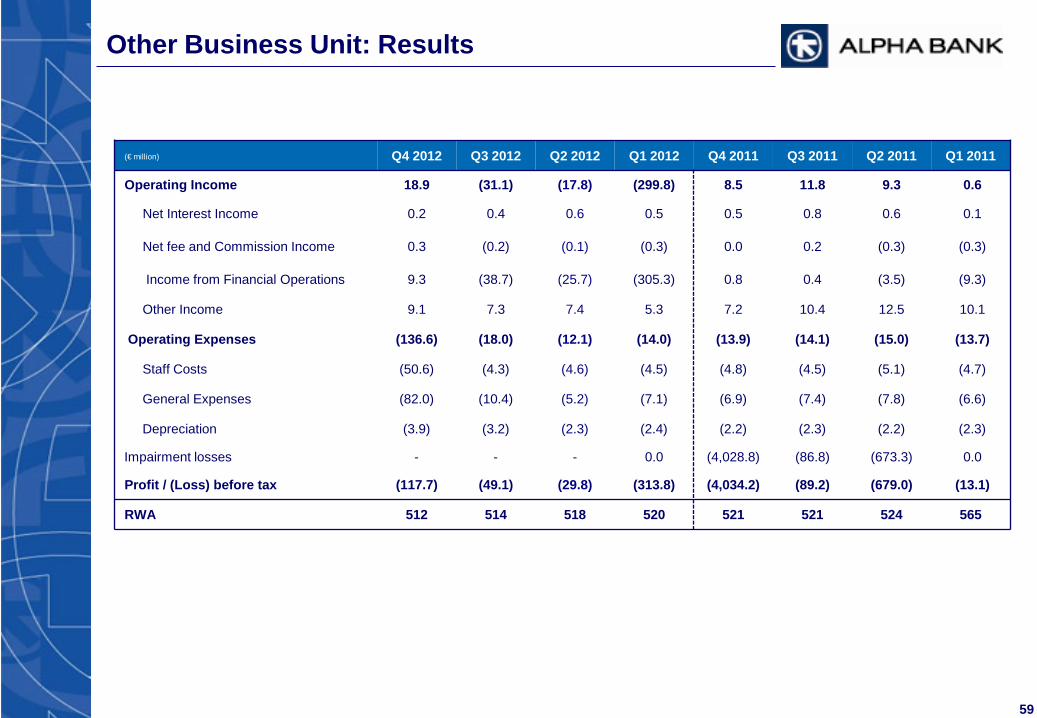
Other Business Unit: Results
(€ million) Q4 2012 Q3 2012 Q2 2012 Q1 2012 Q4 2011 Q3 2011 Q2 2011 Q1 2011
Operating Income 18.9 (31.1) (17.8) (299.8) 8.5 11.8 9.3 0.6
Net Interest Income 0.2 0.4 0.6 0.5 0.5 0.8 0.6 0.1
Net fee and Commission Income 0.3 (0.2) (0.1) (0.3) 0.0 0.2 (0.3) (0.3)
Income from Financial Operations 9.3 (38.7) (25.7) (305.3) 0.8 0.4 (3.5) (9.3)
Other Income 9.1 7.3 7.4 5.3 7.2 10.4 12.5 10.1
Operating Expenses (136.6) (18.0) (12.1) (14.0) (13.9) (14.1) (15.0) (13.7)
Staff Costs (50.6) (4.3) (4.6) (4.5) (4.8) (4.5) (5.1) (4.7)
General Expenses (82.0) (10.4) (5.2) (7.1) (6.9) (7.4) (7.8) (6.6)
Depreciation (3.9) (3.2) (2.3) (2.4) (2.2) (2.3) (2.2) (2.3)
Impairment losses - - - 0.0 (4,028.8) (86.8) (673.3) 0.0
Profit / (Loss) before tax (117.7) (49.1) (29.8) (313.8) (4,034.2) (89.2) (679.0) (13.1)
RWA 512 514 518 520 521 521 524 565
60
ALPHA BANK 40, Stadiou Street, 102 52 Athens, Greece Internet : www.alpha.gr Reuters : ACBr.AT Bloomberg : ALPHA GA
Mr. Michael Massourakis Senior Manager Economic Research Division +30210 326 2828 [email protected] Mr. Dimitrios Maroulis Manager Economic Research Division +30210 326 2832 [email protected]
Investor Relations Contacts Mr. Vassilios Psaltis General Manager and CFO +30210 326 4009 [email protected] Mr. Dimitrios Kostopoulos Manager Investor Relations Division +30210 326 4195 [email protected] Ms. Elena Katopodi Assistant Manager Investor Relations Division +30210 326 4184 [email protected] Ms. Stella Traka Investor Relations Officer +30210 326 4182 [email protected]