almost finished draft
DESCRIPTION
ÂTRANSCRIPT


TABLE OF CONTENTS
1. WHAT IS SUSTAINABILITY?
80% BY 2050
REGIONAL TRANSPORTATION AT A GLANCE
WHY THIS IS A PROBLEM
HOW TO BE MORE SUSTAINABLE
INNOVATION
EFFICIENCY
DESIGN
PRICING
DECISION MAKING
ACTIONS YOU CAN TAKE
2.
4.
6.
8.
10.
12.
14.
16.
18.
20.

WHAT IS SUSTAINABILITY?01“Sustainable development is development that meets the needs of the present without compromising the ability of future generations to meet their own needs.” To put it simply the resources needed in the future should be just as available as they are today.” - The Brundtland Report
A SUSTAINABLE TRANSPORTATION SYSTEM:
Is EQUITABLE through access ensuring affordability and availability to all ages, races and sexual orientations throughout the entire Greater Philadelphia Region.
Is SAFE by ensuring continued maintenance in every aspect of the transportation system striving towards goals outlined in Vision Zero.
Is INNOVATIVE by incorporating recent technological advancements across all modes of the transportation system as well as allowing for new modes to emerge.
Is EFFICIENT through improving operations in existing transportation facilities as well as increasing capacity for higher ridership.
Is GREEN by incorporating alternative fuel sources such as electricity into transit thus reducing the direct impacts of GHGs synonymous with air and water quality.
Is COMPATIBLE by promoting compact development patterns that are conducive to increased transit service as well as higher levels of active transportation such as cycling and walking.
Is COMPETITIVE through strategic investments that save both time and money.
Is RESILIENT by eliminating the chance of degrading infrastructure due to climate change through efficient maintenance and replacement.
Is MULTI-MODAL through creating distinct multi-modal transit facilities incorporated into all existing transportation centers in order to provide at least 2 means of transport.
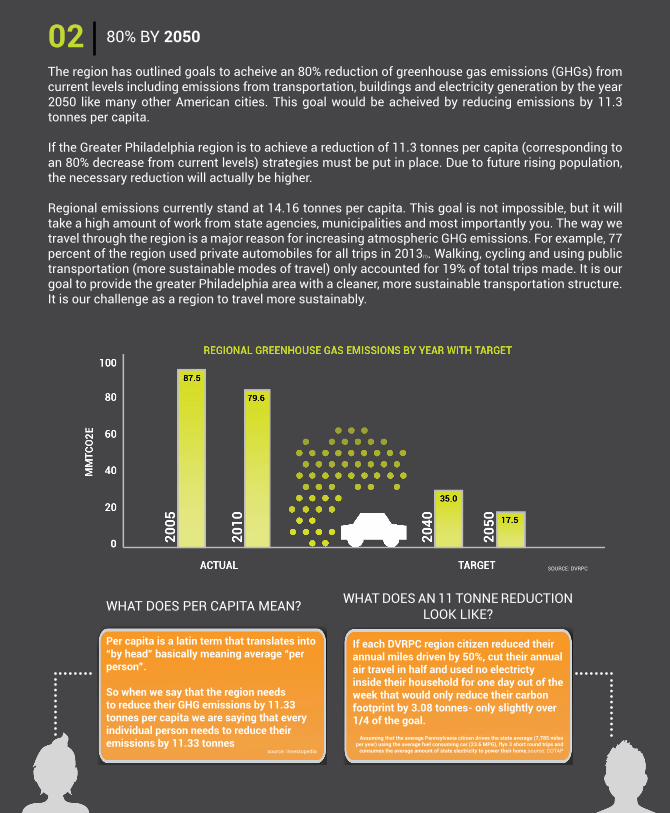
80% BY 205002The region has outlined goals to acheive an 80% reduction of greenhouse gas emissions (GHGs) from current levels including emissions from transportation, buildings and electricity generation by the year 2050 like many other American cities. This goal would be acheived by reducing emissions by 11.3 tonnes per capita.
If the Greater Philadelphia region is to achieve a reduction of 11.3 tonnes per capita (corresponding to an 80% decrease from current levels) strategies must be put in place. Due to future rising population, the necessary reduction will actually be higher.
Regional emissions currently stand at 14.16 tonnes per capita. This goal is not impossible, but it will take a high amount of work from state agencies, municipalities and most importantly you. The way we travel through the region is a major reason for increasing atmospheric GHG emissions. For example, 77 percent of the region used private automobiles for all trips in 2013(1). Walking, cycling and using public transportation (more sustainable modes of travel) only accounted for 19% of total trips made. It is our goal to provide the greater Philadelphia area with a cleaner, more sustainable transportation structure. It is our challenge as a region to travel more sustainably.
SOURCE: DVRPC
WHAT DOES PER CAPITA MEAN?
Per capita is a latin term that translates into “by head” basically meaning average “per person”.
So when we say that the region needs to reduce their GHG emissions by 11.33 tonnes per capita we are saying that every individual person needs to reduce their emissions by 11.33 tonnes
source: investopedia
WHAT DOES AN 11 TONNE REDUCTION LOOK LIKE?
If each DVRPC region citizen reduced their annual miles driven by 50%, cut their annual air travel in half and used no electricty inside their household for one day out of the week that would only reduce their carbon footprint by 3.08 tonnes- only slightly over 1/4 of the goal.
Assuming that the average Pennsylvania citizen drives the state average (7,785 miles per year) using the average fuel consuming car (23.6 MPG), flys 3 short round trips and
consumes the average amount of state electricity to power their home.source: COTAP

80% BY 2050
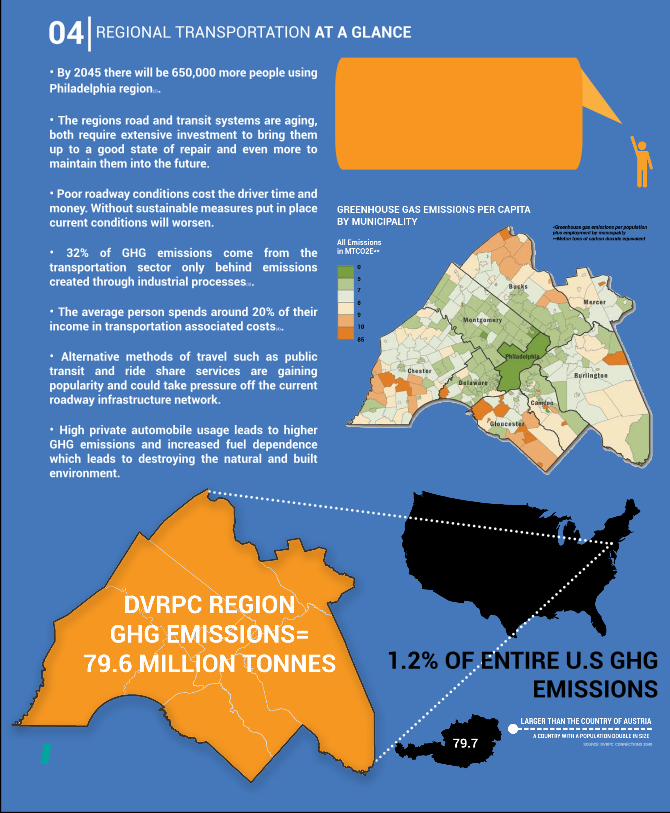
04 REGIONAL TRANSPORTATION AT A GLANCE
• By 2045 there will be 650,000 more people using Philadelphia region(2).
• The regions road and transit systems are aging, both require extensive investment to bring them up to a good state of repair and even more to maintain them into the future.
• Poor roadway conditions cost the driver time and money. Without sustainable measures put in place current conditions will worsen.
• 32% of GHG emissions come from the transportation sector only behind emissions created through industrial processes(3).
• The average person spends around 20% of their income in transportation associated costs(4).
• Alternative methods of travel such as public transit and ride share services are gaining popularity and could take pressure off the current roadway infrastructure network.
• High private automobile usage leads to higher GHG emissions and increased fuel dependence which leads to destroying the natural and built environment.
1.2% OF ENTIRE U.S GHG EMISSIONS
SOURCE: DVRPC: CONNECTIONS 2040
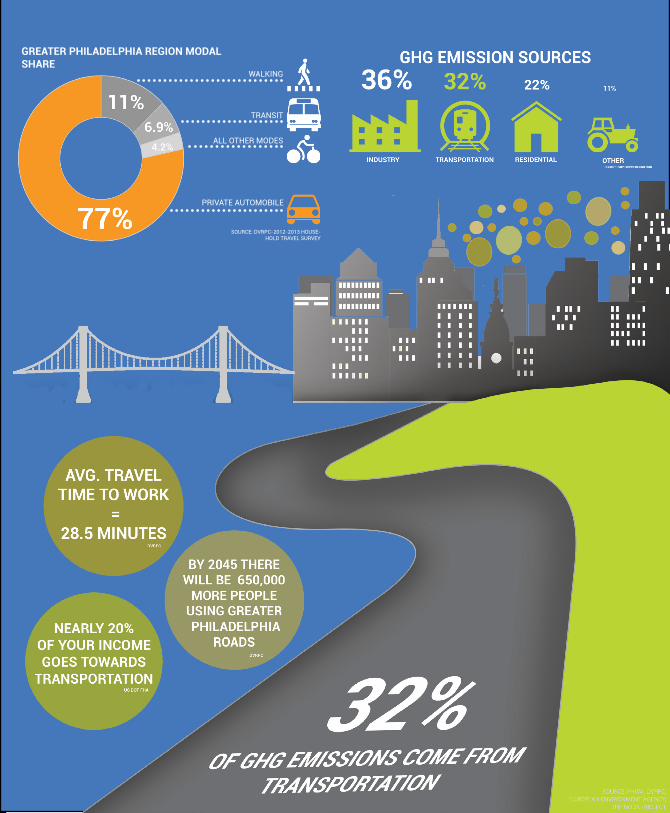
PRIVATE AUTOMOBILE
SOURCE: DVRPC-2012-2013 HOUSE-HOLD TRAVEL SURVEY
WALKING
TRANSIT
ALL OTHER MODES
GREATER PHILADELPHIA REGION MODAL SHARE
SOURCE: DVRPC: CONNECTIONS 2040
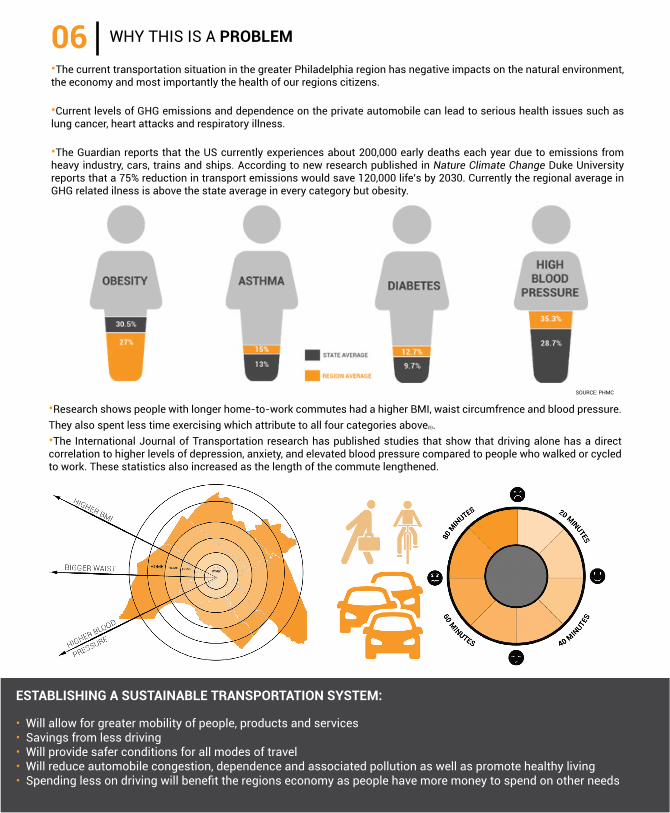
WHY THIS IS A PROBLEM06•The current transportation situation in the greater Philadelphia region has negative impacts on the natural environment, the economy and most importantly the health of our regions citizens.
•Current levels of GHG emissions and dependence on the private automobile can lead to serious health issues such as lung cancer, heart attacks and respiratory illness.
•The Guardian reports that the US currently experiences about 200,000 early deaths each year due to emissions from heavy industry, cars, trains and ships. According to new research published in Nature Climate Change Duke University reports that a 75% reduction in transport emissions would save 120,000 life’s by 2030. Currently the regional average in GHG related ilness is above the state average in every category but obesity.
•Research shows people with longer home-to-work commutes had a higher BMI, waist circumfrence and blood pressure. They also spent less time exercising which attribute to all four categories above(5).•The International Journal of Transportation research has published studies that show that driving alone has a direct correlation to higher levels of depression, anxiety, and elevated blood pressure compared to people who walked or cycled to work. These statistics also increased as the length of the commute lengthened.
ESTABLISHING A SUSTAINABLE TRANSPORTATION SYSTEM:
• Will allow for greater mobility of people, products and services• Savings from less driving• Will provide safer conditions for all modes of travel• Will reduce automobile congestion, dependence and associated pollution as well as promote healthy living• Spending less on driving will benefit the regions economy as people have more money to spend on other needs
SOURCE: PHMC

WHY THIS IS A PROBLEM

HOW TO BE MORE SUSTAINABLE08

HOW TO BE MORE SUSTAINABLE
INNOVATION
EFFICIENCY
DESIGN
PRICING
DECISION MAKING

HOW TO BE MORE SUSTAINABLEINNOVATION
10
• The next major shift in transportation will be defined as the “digitization of mobility” with an embrace of vehicle and transit sharing. “Car-sharing” refers to a specific type of service that offers members short-term vehicle access. Zip Car is an example of a company that offers this service in the Philadelphia region. According to the California Environmental Protection Agency-Air Resources Board, car sharing can reduce carbon emissions up to 34.5% and prevent between 150,000 and 225,000 metric tons of greenhouse gas emissions per year.
• Recent innovation in handheld technology has allowed for this market to expand. Companies like uber and lyft offer “ride hailing” services where an individual can electronically contact a driver for a taxi-like service to his or her destination for a calculated fee. The Rockefeller foundation has reported that 46% of vehicle owners would seriously consider giving up their car if they could rely on different options to get around and 54% of millennial respondents added they would consider moving to a different city if it had more and better transportation options.
•

•Technological innovation in mass transit is a large effort that takes a significant amount of time and money due to the sheer size of the system. Once a concept is approved it can take years before actual implementation.
•Throw your tokens and magnetic stripe cards away because SEPTA has entered the digital age. New technology allows the user to own 1 reloadable, contactless chip card to use for transit fare, parking and the possibility of using the card to make non-transit purchases.
•This technological innovation allows riders to not only use their SEPTA key card, but also use bank issued debit or credit cards that utilize the chip format.
•Differentiated photo ID key cards will be issued to individuals who qualify for Riders with Disabilities, CCT customers, and Senior Citizen programs
SEPTA HAS A NEW TRANSIT PAYMENT METHOD: DIGITAL KEY CARDS
REAL-TIME TRANSIT INFORMATIONTransit ridership in Tampa has increased 2.2% on weekday trips as a result of real-time transit information. In New York City there has been a 2.3% increase on every single line as well. Real-time transit informs the rider when the bus or train will be arriving, whether or not to expect delays, if a bike is available at the nearby bike share station and even the cheapest or healthiest mode of traveling for any given trip.
SMART PARKINGSmart parking technology allows for users to pay for what the spot actually costs hinging on factors such as congestion and time of day. This will save drivers money over time as well as reduce the number of people “parking spot shopping” which further reduces traffic thus GHG emissions. Technology allows the user to see what spots are available and in real time see how much that space will cost and for how long.
ELECTRONIC PAYMENTElectronic payment and virtual ticketing make it easier for the rider to commute by enabling the user to skip wait times at the counter and pay via smartphone through a connected bank account. This technology has been recently implemented in Philadelphia with the introduction of the new contactless chip card for SEPTA transportation systems.
MULTI-MODAL APPSIntegrating different modes of
transportation into existing transit systems will be a hallmark of sustrainable transportation systems for years to come.
New apps are being developed to coordinate the entire transit system in any
given city seamlessly. These apps help people evaluate different modes based on
price, time, traffic and even health outcomes. This significantly expands the facilitation of transit, walking and cycling.
SHARED MOBILITY SERVICESPurcashing mobility as a service rather
than owning a personal vehicle is becoming increasingly popular. Mobile
communication devices allow individuals to obtain real-time information to hail a
ride-sourcing service such as Uber or Lyft for more convenient and possibly more-eco friendly ways of travel.
Especially if users share rides, vehicles used are fuel efficient and trips are taken
in moderation.
SYSTEM EFFICIENCYBeyond direct TNC operations, there are
software and apps that can improve system efficiency. Waze offers
crowdsourced real-time travel conditions, maps, routing, and more. The Pennsylvania
Department of Transportation operates a 5-1-1 system that provides
travel information about incident locations, construction, weather and even current
road speeds.
“There is no aspect of travel that is not being transformed by information technology.” - Digital-Age Transportation: The Future of Urban Mobility
•
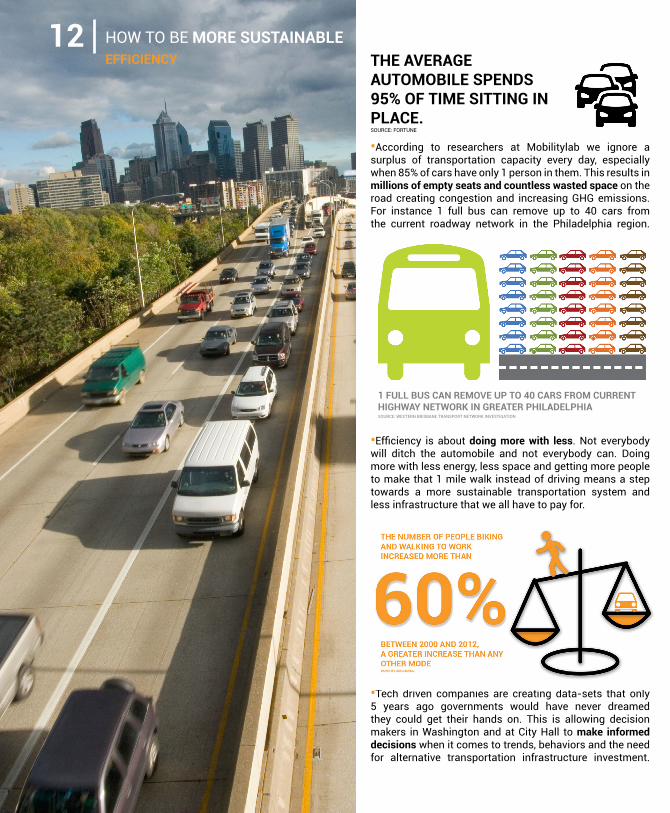
•According to researchers at Mobilitylab we ignore a surplus of transportation capacity every day, especially when 85% of cars have only 1 person in them. This results in millions of empty seats and countless wasted space on the road creating congestion and increasing GHG emissions. For instance 1 full bus can remove up to 40 cars from the current roadway network in the Philadelphia region.
•Efficiency is about doing more with less. Not everybody will ditch the automobile and not everybody can. Doing more with less energy, less space and getting more people to make that 1 mile walk instead of driving means a step towards a more sustainable transportation system and less infrastructure that we all have to pay for.
12 HOW TO BE MORE SUSTAINABLE
1 FULL BUS CAN REMOVE UP TO 40 CARS FROM CURRENT HIGHWAY NETWORK IN GREATER PHILADELPHIASOURCE: WESTERN BRISBANE TRANSPORT NETWORK INVESTIGATION
•Tech driven companies are creating data-sets that only 5 years ago governments would have never dreamed they could get their hands on. This is allowing decision makers in Washington and at City Hall to make informed decisions when it comes to trends, behaviors and the need for alternative transportation infrastructure investment. • Transit has also seen a recent increase in ridership.
EFFICIENCY THE AVERAGE AUTOMOBILE SPENDS 95% OF TIME SITTING IN PLACE.SOURCE: FORTUNE

• If these alternative methods of travel can increase the average amount of vehicle occupancy we can see dramatic reductions in GHG emissions in the region.
•Transit ridership has increased 9.8% in the past decade throughout the Delaware Valley region(3). Public transit is simply more sustainable due to sheer occupancy of space. As illustrated above trains and subways can fit more people in a given amount of space than the same number of people each sitting in their own private automobile.
CARPOOLING IS A GREAT WAY TO “FILL THE SEATS” SAVING GHG EMISSIONS AND FUEL COSTS
SOURCE: NATIONAL HOUSEHOLD TRAVEL SURVEY, DVRPC HOUSEHOLD TRAVEL SURVEY 2013

HOW TO BE MORE SUSTAINABLEDESIGN
14
• A complete street is a response to automobile dominated roads. Complete streets are for everyone! In fact, these types of streets put an emphasis on the pedestrian allowing for people to travel safely on foot, bicycle and even public transit. Vehicles are of course included, however, complete streets make active modes of transportation more attractive, convenient and most importantly efficient. Because let’s face it, a large majority of the population will not ditch the private automobile until other modes become more effective.
Have you ever crossed a street and felt threatened for your life?
Do you feel as if you are a secondary citizen to cars when trying to cross that same street?
• There is not one design for a complete street, each one is unique and is tailored to community context. A complete street can be both rural and urban in nature, allowing all users to travel safely, no matter what environment, is the trademark of a “complete” street. Complete streets reward short trips and de-incentivizes long trips creating place and reducing GHG emissions. According to Smart Growth America, design characteristics that are often associated with complete streets include:
How do we get complete streets? It all starts with us, the region citizens. Advocacy and working with neighbors, policymakers and governmental staff is the quickest way to let our regions leaders know that we will not accept dangerous, archaic streets any longer. Smart Growth America, a leading advocate for complete streets urges you to:
•Talk to policy makers about particularly problematic and unsafe streets•Mention schools and other major pedestrian areas that don’t have sidewalks•Point out bus stops that aren’t wheelchair accessible•Recommend where crosswalks should be located•Make your case and show examples of what your street could look like!
10-12 FT. 4 FT. 7 FT. 4 FT.
72 FT.
8 FT. 8 FT. 5 FT. 4 FT. 10-12 FT.8 FT.
ACCESSIBLE BIKELANES
ON-STREET PARKING
AS BUFFER
STREET FURNITURESTREET TREESPEDESTRIAN MEDIAN
RAISED WALKWAYSWIDE SIDEWALKS
CURB EXTENSION/DEDICATED BUS LANE
2/3OF AMERICANS SAY THEY WANT MORE TRANSPORTATION OPTIONSSOURCE: GOVERNING.COM

PRIORITIZE MODESupport design that favors pedestrians and bicyclists. Active transit leads to fewer GHG emissions, fewer accidents and healthier lifestyles. The built environment has a strong influence in how we live our lives.
PRIORITIZE PEOPLEAchieving a “complete street” is not about balance it is about priority. When creating a street, people should be as visible as automobiles. This involves designing for people of all ages and mobility levels.
PRIORITIZE PLACESupport design that does not create a physical and social barrier. Transportation design should connect communities rather than segment. Sustainable transportation aims to reconnect places, and make them more accessible through a variety of modes.
PROPOSED SCHUYLKILL RAILYARDSOURCE: SHOP ARCHITECTS
SOURCE: GOVERNING.COM

HOW TO BE MORE SUSTAINABLEPRICING
16Free parking is not a birth right. Don’t turn the page! Read about the reasons why free parking can actually be harmful.
Good business practice tells you that offering a free service leads to people demanding more of it. This is no different than parking in the United States. Parking provided free of charge:
• “Smart parking” is a metering system that allows prices to fluctuate depending on time of day, level of congestion, type of vehicle and even number of occupants. Smart parking 1) free’s parking spots within the city that previously wouldn’t have been available 2) potentially saves drivers money by parking during alternative time periods and 3) reduces GHG emissions by increasing the efficiency of the transportation system by reducing the number of people “cruising” for parking.
• Further research is being conducted in sensor controlled management systems. This radar-based parking space detection system will monitor parking areas and ideally report free spaces in public spaces such as streets and alleys. Initital testing is currently underway on public streets in Germany.
Is costly - taxpayer money only covers about 50 percent of the cost to build and maintain public parking.
Leads to shortages makingit difficult for drivers to park during peak times.
Leads to urban sprawl consuming some of the most valuable land in the region.
P
P
P
WASTED SEARCHING FOR PARKING 100 HOURS
OF TRAFFIC IN CITY CENTERS
CAUSE OF 1/3
1
2
3
INFORMATION SOURCE: DONALD SHOUP

• Minimum parking requirements leads to building more parking than is needed. The space we devote to parking could be put to higher and better uses. Less parking can reduce what we pay for rent, for nights out on the town, and for everything we buy, as the cost of parking is hid in everything we purchase.
PARK
THERE ARE MULTIPLE WAYS PRICING CAN REDUCE CARBON EMISSIONS:
A possible substitute for the gas tax. Drivers are taxed by the mile. This can reduce driving by 12 to 15 percent.
Assessed as a tax to fossil fuel distributors, not a per gallon charge to drivers. Revenues funnel directly towards low carbon transportation infrastructure.
Pay-as-you-drive insurance incentiv-izes car owners to drive less. Pricing insurance is estimated to reduce VMT by 8 percent nationwide.
Plentiful parking in urban centers has shown to increase automobile travel. Varying parking prices by demand can emphasize the fiscal benefits of using sustainable travel modes.
VMT POLLUTION INSURANCE PARKING
MINIMUMUM PARKING REQUIREMENTS
20 F
T.
11 FT.220 FT. SQ.
1 PARKING SPOT
1 CAR 10 BIKES 1 SMALL STUDIO
SOURCE: INSTITUTE FOR TRANSPORTATION AND DEVELOPMENT POLICY

HOW TO BE MORE SUSTAINABLEDECISION MAKING
18
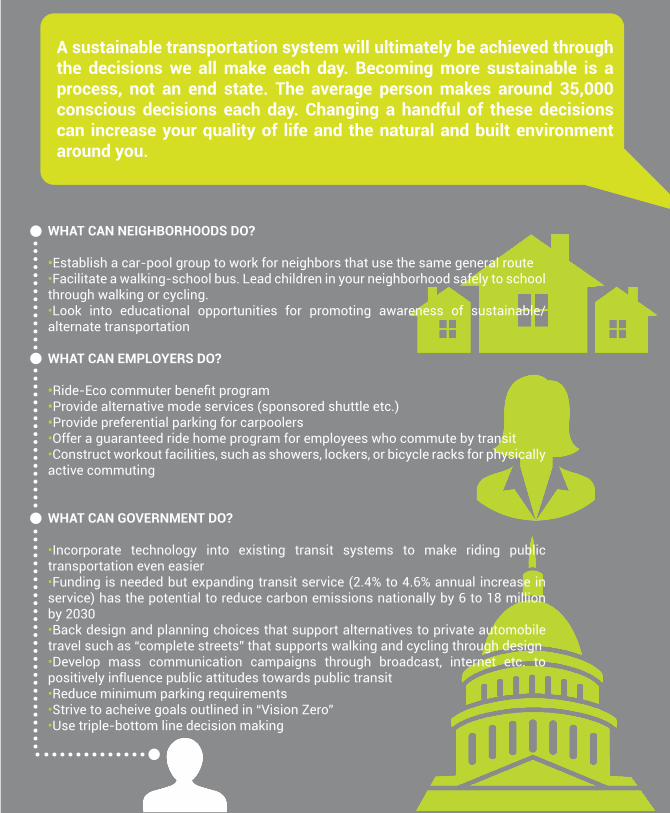
A sustainable transportation system will ultimately be achieved through the decisions we all make each day. Becoming more sustainable is a process, not an end state. The average person makes around 35,000 conscious decisions each day. Changing a handful of these decisions can increase your quality of life and the natural and built environment around you.
WHAT CAN NEIGHBORHOODS DO?
•Establish a car-pool group to work for neighbors that use the same general route•Facilitate a walking-school bus. Lead children in your neighborhood safely to school through walking or cycling.•Look into educational opportunities for promoting awareness of sustainable/alternate transportation
WHAT CAN EMPLOYERS DO?
•Ride-Eco commuter benefit program•Provide alternative mode services (sponsored shuttle etc.)•Provide preferential parking for carpoolers•Offer a guaranteed ride home program for employees who commute by transit•Construct workout facilities, such as showers, lockers, or bicycle racks for physically active commuting
WHAT CAN GOVERNMENT DO?
•Incorporate technology into existing transit systems to make riding public transportation even easier•Funding is needed but expanding transit service (2.4% to 4.6% annual increase in service) has the potential to reduce carbon emissions nationally by 6 to 18 million by 2030•Back design and planning choices that support alternatives to private automobile travel such as “complete streets” that supports walking and cycling through design•Develop mass communication campaigns through broadcast, internet etc. to positively influence public attitudes towards public transit•Reduce minimum parking requirements•Strive to acheive goals outlined in “Vision Zero”•Use triple-bottom line decision making
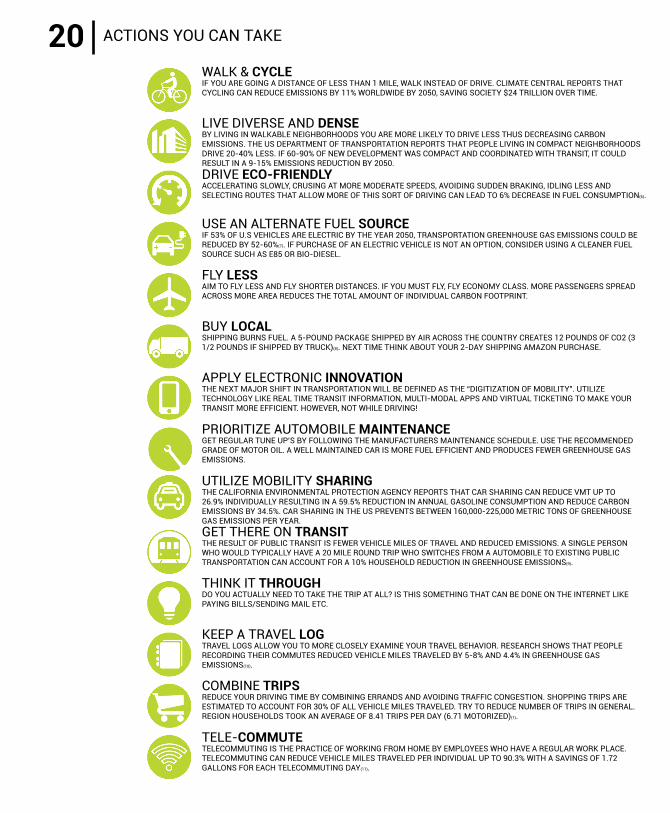
WALK & CYCLEIF YOU ARE GOING A DISTANCE OF LESS THAN 1 MILE, WALK INSTEAD OF DRIVE. CLIMATE CENTRAL REPORTS THAT CYCLING CAN REDUCE EMISSIONS BY 11% WORLDWIDE BY 2050, SAVING SOCIETY $24 TRILLION OVER TIME.
LIVE DIVERSE AND DENSEBY LIVING IN WALKABLE NEIGHBORHOODS YOU ARE MORE LIKELY TO DRIVE LESS THUS DECREASING CARBON EMISSIONS. THE US DEPARTMENT OF TRANSPORTATION REPORTS THAT PEOPLE LIVING IN COMPACT NEIGHBORHOODS DRIVE 20-40% LESS. IF 60-90% OF NEW DEVELOPMENT WAS COMPACT AND COORDINATED WITH TRANSIT, IT COULD RESULT IN A 9-15% EMISSIONS REDUCTION BY 2050.DRIVE ECO-FRIENDLYACCELERATING SLOWLY, CRUSING AT MORE MODERATE SPEEDS, AVOIDING SUDDEN BRAKING, IDLING LESS AND SELECTING ROUTES THAT ALLOW MORE OF THIS SORT OF DRIVING CAN LEAD TO 6% DECREASE IN FUEL CONSUMPTION(6).
USE AN ALTERNATE FUEL SOURCEIF 53% OF U.S VEHICLES ARE ELECTRIC BY THE YEAR 2050, TRANSPORTATION GREENHOUSE GAS EMISSIONS COULD BE REDUCED BY 52-60%(7). IF PURCHASE OF AN ELECTRIC VEHICLE IS NOT AN OPTION, CONSIDER USING A CLEANER FUEL SOURCE SUCH AS E85 OR BIO-DIESEL.
FLY LESSAIM TO FLY LESS AND FLY SHORTER DISTANCES. IF YOU MUST FLY, FLY ECONOMY CLASS. MORE PASSENGERS SPREAD ACROSS MORE AREA REDUCES THE TOTAL AMOUNT OF INDIVIDUAL CARBON FOOTPRINT.
BUY LOCALSHIPPING BURNS FUEL. A 5-POUND PACKAGE SHIPPED BY AIR ACROSS THE COUNTRY CREATES 12 POUNDS OF CO2 (3 1/2 POUNDS IF SHIPPED BY TRUCK)(8). NEXT TIME THINK ABOUT YOUR 2-DAY SHIPPING AMAZON PURCHASE.
APPLY ELECTRONIC INNOVATIONTHE NEXT MAJOR SHIFT IN TRANSPORTATION WILL BE DEFINED AS THE “DIGITIZATION OF MOBILITY”. UTILIZE TECHNOLOGY LIKE REAL TIME TRANSIT INFORMATION, MULTI-MODAL APPS AND VIRTUAL TICKETING TO MAKE YOUR TRANSIT MORE EFFICIENT. HOWEVER, NOT WHILE DRIVING!
PRIORITIZE AUTOMOBILE MAINTENANCEGET REGULAR TUNE UP’S BY FOLLOWING THE MANUFACTURERS MAINTENANCE SCHEDULE. USE THE RECOMMENDED GRADE OF MOTOR OIL. A WELL MAINTAINED CAR IS MORE FUEL EFFICIENT AND PRODUCES FEWER GREENHOUSE GAS EMISSIONS.
UTILIZE MOBILITY SHARINGTHE CALIFORNIA ENVIRONMENTAL PROTECTION AGENCY REPORTS THAT CAR SHARING CAN REDUCE VMT UP TO 26.9% INDIVIDUALLY RESULTING IN A 59.5% REDUCTION IN ANNUAL GASOLINE CONSUMPTION AND REDUCE CARBON EMISSIONS BY 34.5%. CAR SHARING IN THE US PREVENTS BETWEEN 160,000-225,000 METRIC TONS OF GREENHOUSE GAS EMISSIONS PER YEAR.GET THERE ON TRANSITTHE RESULT OF PUBLIC TRANSIT IS FEWER VEHICLE MILES OF TRAVEL AND REDUCED EMISSIONS. A SINGLE PERSON WHO WOULD TYPICALLY HAVE A 20 MILE ROUND TRIP WHO SWITCHES FROM A AUTOMOBILE TO EXISTING PUBLIC TRANSPORTATION CAN ACCOUNT FOR A 10% HOUSEHOLD REDUCTION IN GREENHOUSE EMISSIONS(9).
THINK IT THROUGHDO YOU ACTUALLY NEED TO TAKE THE TRIP AT ALL? IS THIS SOMETHING THAT CAN BE DONE ON THE INTERNET LIKE PAYING BILLS/SENDING MAIL ETC.
KEEP A TRAVEL LOGTRAVEL LOGS ALLOW YOU TO MORE CLOSELY EXAMINE YOUR TRAVEL BEHAVIOR. RESEARCH SHOWS THAT PEOPLE RECORDING THEIR COMMUTES REDUCED VEHICLE MILES TRAVELED BY 5-8% AND 4.4% IN GREENHOUSE GAS EMISSIONS(10).
COMBINE TRIPSREDUCE YOUR DRIVING TIME BY COMBINING ERRANDS AND AVOIDING TRAFFIC CONGESTION. SHOPPING TRIPS ARE ESTIMATED TO ACCOUNT FOR 30% OF ALL VEHICLE MILES TRAVELED. TRY TO REDUCE NUMBER OF TRIPS IN GENERAL. REGION HOUSEHOLDS TOOK AN AVERAGE OF 8.41 TRIPS PER DAY (6.71 MOTORIZED)(1).
TELE-COMMUTETELECOMMUTING IS THE PRACTICE OF WORKING FROM HOME BY EMPLOYEES WHO HAVE A REGULAR WORK PLACE. TELECOMMUTING CAN REDUCE VEHICLE MILES TRAVELED PER INDIVIDUAL UP TO 90.3% WITH A SAVINGS OF 1.72 GALLONS FOR EACH TELECOMMUTING DAY(11).
ACTIONS YOU CAN TAKE20
ACTIONS YOU CAN TAKEREFERENCES:(1) DVRPC. HOUSEHOLD TRAVEL SURVEY FOR THE DELAWARE VALLEY REGION. PHILADELPHIA, PA. 2013.(2) DVRPC. POPULATION FORECAST. PHILADELPHIA, PA. 2016.(3) DVRPC. CONNECTIONS 2040: PLAN FOR GREATER PHILADELPHIA-REGIONAL INDICATORS. PHILADELPHIA, PA. 2013.(4) US DEPARTMENT OF TRANSPORTATION - FEDERAL HIGHWAY ADMIN-ISTRATION. “TRANSPORTATION AND HOUSING COSTS.” OCTOBER 20,2015. ACCESSED JUNE 29, 2016. HTTP://WWW.FHWA.DOT.GOV/LIVABILITY/FACT_SHEETS_TRANSANDHOUSING.CFM.(5) “LONG COMMUTES LINKED TO LARGER WAISTLINES.” NY DAILY NEWS. ACCESSED JUNE 24, 2016. HTTP://WWW.NYDAILYNEWS.COM/LIFE-STYLE/HEALTH/LONG-DISTANCE-WORK-GAIN-WEIGHT-LEADS-REDUCTION-ENER-GY-EXPENDITURE-ARTICLE-1.1075191.(6) “FUEL EFFICIENT DRIVING.” EARTH EASY. ACCESSED JUNE 30, 2016. HTTP://EARTHEASY.COM/MOVE_FUEL_EFFICIENT-DRIVING.HTML.(7) TONACHEL, LUKE. “STUDY: ELECTRIC VEHICLES CAN DRAMATICALLY REDUCE CARBON POLLUTION FROM TRANSPORTATION, AND IMPROVE AIR QUALITY.” SEPTERMBER 17,2015. ACCESSED JUNE 21, 2016. HTTPS://WWW.NRDC.ORG/EXPERTS/LUKE-TONACHEL/STUDY-ELECTRIC-VEHICLES-CAN-DRAMATICALLY-REDUCE-CARBON-POLLUTION.(8) “WHAT YOU CAN DO.” CLIMATE CHANGE. FEBRUARY 23, 2016. ACCESSED JUNE 14, 2016. HTTPS://WWW3.EPA.GOV/CLIMATECHANGE/WYCD/.(9) “PUBLIC TRANSPORTATION REDUCES GREENHOUSE GASES AND CON-SERVES ENERGY”. THE BENEFITS OF PUBLIC TRANSPORTATION. ACCESSED JUNE 2, 2016. HTTP://WWW.APTA.COM/RESOURCES.REPORTSANDPUBLICA-TIONS/DOCUMENTS/GREENHOUSE_BROCHURE.PDF(10) KENNETH, SMALL. “A STUDY TO EVALUATE THE EFFECT OF REDUCED GREENHOUSE GAS EMISSIONS ON VEHICLE MILES TRAVELED.” ARB FINAL REPORT. MARCH 2005. ACCESSED JUNE 1, 2016. HTTP://WWW.SOCSCI.UCI.EDU/-KSMALL/CARBFINALREPORT.PDF.(11) HANDY, SUSAN. “POLICY BRIEF ON THE IMPACTS OF TELECOMMUT-ING BASED ON A REVIEW OF THE EMPIRICAL LITERATURE.” IMPACTS OF TELECOMMUTING. DECEMBER 16, 2010. ACCESSED JUNE 14, 2016. HTTP://WWW.ARB.CA.GOV/CC/SB375/POLICIES/TELECOMMUTING/TELECOMMUT-ING_BRIEF.PDF.
