alma mater studiorum università di bologna dottorato di … · production (ip) in the brazilian...
TRANSCRIPT

Alma Mater Studiorum – Università di Bologna
DOTTORATO DI RICERCA IN
SCIENZE E TECNOLOGIE AGRARIE, AMBIENTALI E
ALIMENTARI
Ciclo XXVIII
Settore Concorsuale di afferenza: 07/A1
Settore Scientifico disciplinare: AGR/01
“PRODUCERS’ PERCEPTIONS AND CONSUMERS’ BEHAVIOR
TOWARD CERTIFIED BEANS FROM INTEGRATED
PRODUCTION (IP) IN THE BRAZILIAN CENTRAL REGION”
Presentata da: Aluisio Goulart Silva
Coordinatore Dottorato
Relatore
Prof. Giovanni Dinelli Prof. Maurizio Canavari
Esame finale anno 2016
i
ABSTRACT
Brazil, as a predominantly agricultural country, has played an increasingly important role in global
food supply and food security over the last decades. Besides ensuring quality food for its domestic
market, Brazilian agriculture has been preparing itself to meet the minimum required food quality
standard in order to maintain its levels of export worldwide. The Brazilian government has
encouraged the Integrated Production (IP) system so as to mitigate the negative environmental impact
of intensive dry bean production in irrigated areas of the Brazilian savanna in the center of the
country, called Cerrado. In addition, by ensuring food-safety production and the use of sustainable
agricultural practices associated with IP systems may strengthen the national agriculture
competitiveness. From the consumer point of view, they are ensured of a healthier diet by reducing
the intake of residue pesticides on food. The IP had its legal framework established in 2010. Since
then, specific IP'S labels are available to several IP food produce, including dry common beans,
despite the fact that this product is not yet commercially available. Regardless the government efforts
to establish IP system in the main agricultural regions and among the largest food growers, only few
have slowly adopted it. One reason may be that growers prefer well-established certification
schemes, which are globally accepted for export. Or else, the growers may rely on market
recommendations because they lack information on consumer preferences for certified products. In
the present study, a number of critical factors that may influence the adoption of IP by dry common
bean growers as well as their willingness to adopt it as a production system were identified.
Moreover, this study evaluated consumer perception and eagerness to purchase IP certified dry
common beans if they were commercially available. The present work comprises four sections: (1)
a literature review; (2) a quantitative research based on the Technology Acceptance Model (TAM)
with the purpose of identifying growers’ intention in adopting IP; (3) a choice experiment applied to
identify the consumer preferences and willingness-to-pay (WTP) for IP label; (4) a quantitative
research based on the Theory of Planned Behavior (TPB) with the purpose of identifying the
consumer perception to IP certified dry beans. This research contributes with valuable information
to the dry common bean supply chain, providing insights to growers, retailers and other actors of this
production chain. Results show that dry bean growers are positive in adopting IP in their units of
production, but further studies are needed in order to identify additional constraints related to the
effective IP adoption. Local consumers are willing to pay a premium price for IP labelled dry beans
over conventional ones and have a positive attitude toward IP labelled dry beans. Implications for
marketing decision makers and government sector are discussed in the conclusion section.
Keywords: consumers’ behaviour; technology adoption; integrated production; TAM; TPB; WTP;
common beans.
ii
ACKNOWLEDGEMENTS
The process of earning a doctorate and writing a thesis is a process of hard working and resignation.
Thus, it is fundamental to thank! First, thank you, God! Thank you, God, for giving me the
inestimable gift that is the delight of work. Thank you, God, for having guided my steps during my
trajectory of study, giving me patience and wisdom in difficult times. Thank you for giving me
physical and mental health to endure the long hours of study.
I want to thank, with the same intensity, my family. Thank you my parents Aldo and Maria
Bernadete; thank you my sisters Adriana e Eliana; thank you my second mother, "Bata". Thank you
my little Maria’s, you are the most beautiful flowers in our garden! Each one of you made me
understand that to succeed in life, one must have defined goal, extra effort, exact thinking, self-
discipline, higher mind, faith, nice personality, personal initiative, enthusiasm, attention controlled,
creative vision, and resilience! Without my family’s constant support, encouragement, and
understanding, it would not have been possible for me to achieve my professional goals.
I would like to express my sincere gratitude to my advisor Prof. Maurizio Canavari for the continuous
support of my Ph.D. study and related research, for his patience, motivation, and expertise. I would
like to thank the rest of my thesis committee for their insightful comments and encouragement. I
would also like to thank the other members and colleagues of the UNIBO’s Agricultural Economics
Department. Their insight, feedback, and advice were influential and essential throughout my
walking during my 4 years in Italy.
Besides the UNIBO’s advisor, I would certainly be remiss to not mention and sincerely thank Dr.
Alcido E. Wander, my academic advisor in Embrapa, my professor, tutor, and friend. Without his
help, advices, expertise, and encouragement, this research would not have happened. Not less
important, my sincere thanks also go to Dra. Maria José Del Peloso and Dr. Flavio Breseghello who,
as my Directors, provided me an opportunity to join their team as colleague, and who gave me the
opportunity to have this fantastic experience in Europe. On their behalf I would like to thank the
other Directors, Researchers and Colleagues from Embrapa who vibrate to my win and success.
A special note of gratitude to Embrapa and the Ministry of Agriculture that had a fundamental role
in this experience by sponsoring my studies during this period in Italy.
Another very special note of thanks to agronomists, farmers, consumers, Embrapa’s interns, and
others that helped me with the field research. Without their attention, dedication, and readiness I
would not have developed my data collection.
Last but not the least, I would like to thank all my relatives, my Brazilian friends from Bologna (or
would be my family in Bologna) and others who in one way or another shared their support, either
morally, physically, emotionally, thank you all!
iii
EXECUTIVE SUMMARY
Brazil, as a predominantly agricultural country, has played an increasingly important role in
global food supply and food security over the last decades. A prior study published by the
Brazilian Strategic Management Office of Ministry of Agriculture, Livestock and Food
Supply – AGE/MAPA (BRASIL, 2010) indicates that Brazilian Agribusiness has a great
potential for growth in the coming years due to the significant increase in the domestic
consumption for most agricultural products, as well as in the consumption in countries such
as China and India.
However, one of the challenges of Brazilian agriculture is to comply with the current quality
standards demanded by international markets, and to ensure the quality of the products
offered to those markets, as well as the domestic one. In this context, international trading
partners have regarded food quality certification schemes as an important tool to protect and
promote health for its consumers.
The integrated production (IP) system has been the certification scheme chosen by the
Brazilian government that aims to attend the minimum quality requirements of food produce.
The concept of IP as a production system is relatively new in Brazil (no older than two
decades) and started with fruit crops in 2001. The project “Integrated Production of Fruit -
PIF” has achieved excellent results and was the main responsible for turning the IP into a
strategic priority for the Ministry of Agriculture (MAPA). From this experience, MAPA
proposed a project that could embrace several other crops, called Agricultural System of
Integrated Production (SAPI), based on the principles of IP according to IOBC/WPRS,
which culminated in its legal framework established in 2010 by the Normative Instruction
Nº 27 of 30/08/10 (BRASIL, 2010).
The IP standards for grain crops and livestock produced its first results in the mid-2009. One
of them was a project entitled “Integrated Production System for Common Beans -
PIFeijão”, proposed by the Brazilian Ministry of Agriculture, Livestock and Food Supply –
MAPA in order to reduce the negative environmental impacts of intensive dry bean
production in the irrigated areas of the Cerrado, grown during winter´s crop. The main
objective of the project was to develop a sustainable production system focused on quality
and certification, and elaborate the standards of production for common beans (Barbosa, et
al., Sistema de produção integrada do feijoeiro comum na região central brasileira, 2009).
Additionally, the development of the “PIFeijão” aimed to create a culture of producing
common beans with better quality and safe to human consumption.
Although the Agricultural Census, 2006, (IBGE, 2006) demonstrates that almost 80% of the
Brazilian bean growers (responsible for 42% of the total production) do not use pesticides,
a number of non-compliances were still found according to the “Food Pesticide Residues
Analysis Program – FPRAP” report, coordinated by the Brazilian Health Surveillance
Agency – ANVISA. ANVISA has recommended and emphasized the necessity of
elucidating and training farmers on the subject with the collaboration of several institutions
that comprises the common bean supply chain. Moreover, the Agency supports that
iv
consumers would prefer certified foods to motivate the producer's engagement with quality
and Good Agricultural Practices (GAP) and consequently stimulate new programs for food
quality production with traceability such as IP. The present research was prompted by part
of these recommendations, among other elements that are presented in the next section.
Regardless the government efforts to establish IP system in the main agricultural regions and
among the largest food growers, only few have slowly adopted it. One reason may be that
growers prefer well-established and globally accepted certification schemes, such as
GlobalGap, which competes with the IP as an alternative for sustainable and safe food
produce. Or else, the growers may rely on market recommendations because they lack
information on consumer preferences for certified products. In the present study, a number
of critical factors that may influence the adoption of IP by dry common bean growers as well
as their willingness to adopt it as a production system were identified.
The objectives of this work are to identify the critical factors that can influence the adoption
of IP by dry common bean growers; to evaluate the willingness of dry common bean growers
in adopting IP as a production system; and, to assess the willingness-to-pay a price premium
for IP labelled beans by consumers.
This study provides basic information on consumer behaviour toward IP certified products
to policy makers and to the stakeholders of this supply chain for future strategies to spread
the IP system more rapidly among producers and consumers, respectively. Overall, the
results of the present study intend to contribute to improving the quality of food produced in
Brazilian agriculture, enhancing production practices that respect the environment and
ensure the health of consumers.
The present work comprises four sections: (1) a literature review; (2) a quantitative research
based on the Technology Acceptance Model (TAM) with the purpose of identifying
growers’ intention in adopting IP; (3) a choice experiment applied to identify the consumer
preferences and willingness-to-pay (WTP) for IP label; (4) a quantitative research based on
the Theory of Planned Behaviour (TPB) with the purpose of identifying the consumer
perception to IP certified dry beans.
The section 1 is an overview of the Brazilian agriculture based on a literature review, in
which statistical data, such as grain production and long-term planted areas, helps understand
the magnitude of the Brazilian agriculture. Additionally, information on bean production and
consumption in Brazil was provided, evidencing the two species of beans grown in Brazil,
Vigna unguiculata (L.) Walp, known as “cow pea” that is grown and consumed mainly in
the Northeast, and Phaseolus vulgaris L., known as “common beans” (or simply “beans”)
that is widely grown throughout the country and represents the national preference. The
literature review provides an insight into the differences between bean crops and levels of
technology applied, highlights the most relevant production areas, including where this
research was undertaken, and shows the characteristics of the bean supply chain. Finally,
there is a review of Integrated Production; why and how this production system became one
of the official certification schemes to improve food quality with environmental
responsibility and safe food concerns.
v
The second section sought evidence of the intention of adopting integrated production (IP)
as a bundle of technologies by bean growers in one the most relevant areas of bean
production in the Brazilian Central Region where the conventional farming still dominates.
The results show that respondents are positively intentioned in adopting IP and they see it as
a useful solution to solve part of their production problems, especially those concern
environmental and social issues. IP is useful to provide more benefits to employees,
reinforcing one of the principles of IP, the social responsibility. Perceived usefulness has a
positive impact on behavioural intention to use integrated production, as expected. Further
studies need to be conducted in order to identify additional constraints related to the effective
adoption of IP.
The third section deals with the consumer perception and willingness to pay a premium price
for IP labelled beans over conventional ones. The average consumer is ready to accepting
labelled products from integrated production, i.e., products with sustainable and safe food
claims. The findings suggest that profitable market opportunities may exist for operators
interested in trading IP certified beans, but a considerable amount of effort to give
information is required. Compared with unlabelled or conventionally produced beans, a
premium price may be charged on the grounds of sustainability and health label claims, such
as an IP label. The positive WTP values and positive consumer’s behavior toward certified
beans could influence positively bean growers to adopt IP in order to offer certified beans as
alternative to conventional ones.
The fourth and last section analyses the consumer attitude toward IP labelled beans. The
results of this study reveal that the interviewees have a positive attitude toward purchasing
IP certified beans, although this product has not yet been made commercially available. Clear
and reliable information on the certification label may favor the process of retailing certified
beans since the consumer would have easy access to the IP label information. Choice and
decision to purchase certified beans seems to be directly related to the price that will be
practiced in the market. If the premium price of the certified beans is greater than the
consumer expectations, the consumer probably may opt for the conventional beans, as an
alternative.
The results indicate that the theoretical model based on the TPB used to explain the
intentional behavior of purchasing certified beans resulted in reasonable fit indices, but only
some of the relations between constructs was consistent with the theory. Thus, the results
showed that the proposed model was adequate to explain the consumer behavior toward the
IP certified bean purchase. As exceptions, one can refer the constructs subjective norms and
perceived behavioral control toward the intention of purchasing.
The subjective norms, in this study, were not significant in the model, indicating that the
opinion of others is not a decision-making factor for the intention of buying certified beans,
from the point of view of the surveyed consumers. This study brings up important
contributions of the application of TPB in the field of certified food products from integrated
production, in the Brazilian context.
This study significantly advances our understanding of IP adoption by using established
adoption theory and focusing on individual perceptions as important drivers to the adoption

vi
decision-making. The findings offer elements to suggest a new approach of technology
transfer aiming the process of IP adoption by taking into account the actors' perceptions
toward the studied technology. The findings suggest also opportunities for development of
new solutions.
Another contribution of this study is targeted to the several actors of the Brazilian bean
supply chain. The results show that there is a considerable opportunity in the market for
those who wish to invest in the certified product industry with sustainable and food-safety
claims by some key-actors to support the IP usage. Implications for market decision makers
and government sector were discussed in the conclusion section.
vii
CONTENTS
1 INTRODUCTION 1
1.1 Background 1
1.1.1 Brazilian Agriculture: an overview 1
1.1.2 Beans production and consumption in Brazil: a summary 2
1.1.3 Brazilian bean’s supply chain 8
1.1.4 Integrated Production (IP) in Brazil 10
1.2 Motivation 14
1.3 Research Objectives 15
2 THE INTENTION OF COMMON BEANS’ GROWERS IN ADOPTING
INTEGRATED PRODUCTION IN THE BRAZILIAN CENTRAL REGION: AN
ANALYSIS USING THE TECHNOLOGY ACCEPTANCE MODEL (TAM) 16
2.1 INTRODUCTION 16
2.1.1 Technology, Adoption and Diffusion 17
2.1.2 Factors influencing technology adoption in agriculture 19
2.1.3 Other variables that can influence adoption of integrated production 21
2.2 METHODOLOGY 22
2.2.1 Theoretical Model 22
2.3 RESULTS AND DISCUSSION 35
2.3.1 Respondents’ and Farms’ Characteristics 35
2.3.2 Respondents’ perceptions toward adopting Integrated Production 35
2.3.3 Measure properties 38
2.3.4 Hypotheses test 42
2.4 CONCLUSIONS AND RECOMMENDATIONS 45
3 CONSUMER PREFERENCES AND WILLINGNESS-TO-PAY FOR
INTEGRATED PRODUCTION (IP) CERTIFICATION ON COMMON BEANS: AN EX-
ANTE ANALYSIS. 49
3.1 INTRODUCTION 49
3.2 METHODOLOGY 54
3.2.1 Theoretical Model 54
3.2.2 Econometric Models 56
3.2.3 Empirical Model 59
3.2.4 Data Collection and Survey Procedures 61
3.2.5 Model Specification and Statistical Procedures 63

viii
3.3 RESULTS AND DISCUSSION 65
3.3.1 Consumers Characteristics and Consumption Habits 65
3.3.2 Consumers’ Preferences and Willingness-to-Pay (WTP) 69
3.3.3 “What-if” Scenarios using MNL results 71
3.4 CONCLUSIONS AND RECOMMENDATIONS 73
4 CONSUMERS’ INTENTION TOWARD PURCHASING IP CERTIFIED BEANS:
AN ANALYSIS USING THE THEORY OF PLANNED BEHAVIOUR (TPB). 75
4.1 INTRODUCTION 75
4.2 METHODOLOGY 78
4.2.1 Theoretical Model 78
4.2.2 Theory of Planned Behaviour 78
4.2.3 Empirical Framework, and Hypotheses 80
4.2.4 Data collection and survey procedures 82
4.2.5 Statistical Procedures 84
4.3 RESULTS AND DISCUSSION 87
4.3.1 Consumers Characteristics and Consumption Habits 87
4.3.2 Consumers’ intentions toward purchasing IP certified beans 91
4.3.3 Measurements of Constructs and testing the structural model 93
4.4 CONCLUSIONS AND RECOMMENDATIONS 99
5 SUMMARY AND CONCLUDING REMARKS 101
6 REFERENCES 105
7 APPENDIX 113
ix
LIST OF FIGURES
Figure 1-1 Projections of planted area and production of grains in Brazil - 2014/15 to
2024/25 .................................................................................................................................. 1
Figure 1-2 Density off common bean production, Brazil, 2010 ............................................ 4
Figure 1-3- Land use and distribution of central-pivot, Cristalina (GO) - Brazil ................. 4
Figure 1-4 Beans’ harvest time distribution in the major production regions of Brazil ........ 6
Figure 1-5- Evolution of dry beans consumption, Brazil, 1990-2011, (kg/inh./year) ........... 7
Figure 1-6- Production and consumption of beans (mil tons), Brazil, 1997/1998 to 2012/2013
............................................................................................................................................... 7
Figure 1-7 Common bean’s production chain in Brazil ........................................................ 9
Figure 1-8- Integrated Production certification label, Brazil .............................................. 11
Figure 2-1- Technology Acceptance Model (TAM) by Davis (1989). ............................... 23
Figure 2-2– Proposed structural model and path analysis ................................................... 26
Figure 2-3 – Modified structural model and path analysis .................................................. 40
Figure 2-4– Hypothetical SEM model ................................................................................ 40
Figure 3-1– Brazilian logo for Integrated Production produce. .......................................... 51
Figure 3-2– Choice task example. ...................................................................................... 62
Figure 3-3– Set of resources used on CE. ........................................................................... 63
Figure 3-4– Consumers habits of beans purchasing. ........................................................... 67
Figure 3-5– Beans’ quality attributes reported by respondents ........................................... 68
Figure 3-6– Additional labelling information considered important by respondents. ........ 69
Figure 3-7– Scenario 01: choice probabilities for beans alternatives in the market............ 73
Figure 4-1– Brazilian logo for Integrated Production produce. .......................................... 78
Figure 4-2– Theory of Planned Behavior. ........................................................................... 79
Figure 4-3- Proposed structural model ................................................................................ 82
Figure 4-4– Summary of Survey Results: SDC characteristics (N=160) ............................ 90
Figure 4-5– Additional labelling information considered important by respondents. ........ 91
Figure 4-6- Means of Intention ........................................................................................... 91
Figure 4-7- Means of attitudes toward buying certified beans. .......................................... 92
Figure 4-8- Means of subjective norms .............................................................................. 92
Figure 4-9- Means of perceived behavioral control ........................................................... 93
Figure 4-10– Results of SEM Analysis (standardized). ...................................................... 98

x
LIST OF TABLES
Table 2-1– Pilot-version and final-version Cronbach’s Alpha ............................................ 31
Table 2-2– Item’s descriptive statistics ............................................................................... 36
Table 2-3– Remaining items of the tested model ................................................................ 39
Table 2-4- Model fit summary............................................................................................. 41
Table 2-5- Standardized Residual Covariances Matrix ....................................................... 42
Table 2-6– Structural Model and Hypothesis testing .......................................................... 42
Table 2-7– Standardized Regression Weights ..................................................................... 44
Table 3-1- Attributes and levels of common beans ............................................................. 60
Table 3-2- Choice set example. ........................................................................................... 61
Table 3-3– Summary of Survey Results: SDC characteristics (N=160) ............................. 66
Table 3-4- MNL and RPL estimates.................................................................................... 70
Table 4-1– Summary of Survey Results: SDC characteristics (N=160) ............................. 89
Table 4-2- Results for the measurement model. .................................................................. 94
Table 4-3– Model fit summary ............................................................................................ 95
Table 4-4- Standardized residual covariances matrix.......................................................... 96
Table 4-5– Structural Model and Hypothesis testing .......................................................... 97
1
1 INTRODUCTION
1.1 Background
1.1.1 Brazilian Agriculture: an overview
Brazil is well known as predominantly an agricultural country. Besides ensuring quality food
for the domestic market, Brazilian agriculture plays an increasingly important role in global
food supplies and food security in the next decades.
Data from the Brazilian National Supply Company - CONAB show that in 2013/14 the
National production of grains was around 193.62 million tons, in 57.06 million hectares of
planted area; for 2014/2015, the estimative is something around 206.4 million tons of grains
in 57.5 million hectares of cultivated area (CONAB, 2015).
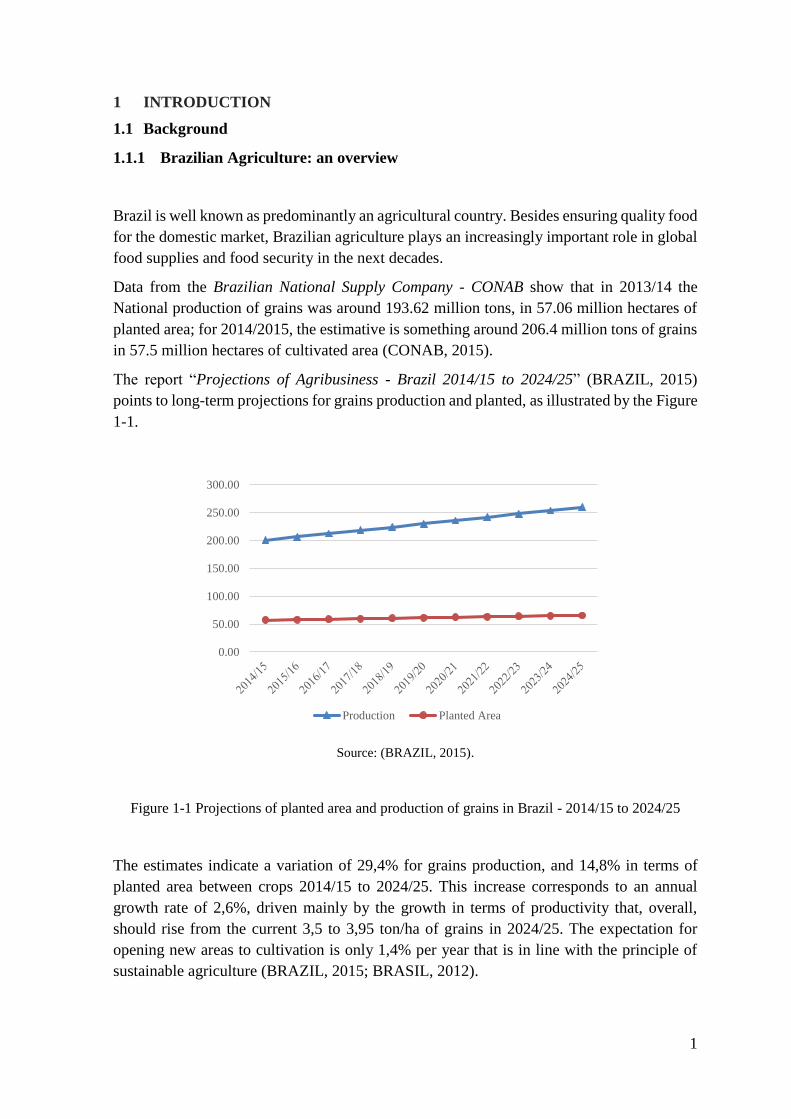
The report “Projections of Agribusiness - Brazil 2014/15 to 2024/25” (BRAZIL, 2015)
points to long-term projections for grains production and planted, as illustrated by the Figure
1-1.
Source: (BRAZIL, 2015).
Figure 1-1 Projections of planted area and production of grains in Brazil - 2014/15 to 2024/25
The estimates indicate a variation of 29,4% for grains production, and 14,8% in terms of
planted area between crops 2014/15 to 2024/25. This increase corresponds to an annual
growth rate of 2,6%, driven mainly by the growth in terms of productivity that, overall,
should rise from the current 3,5 to 3,95 ton/ha of grains in 2024/25. The expectation for
opening new areas to cultivation is only 1,4% per year that is in line with the principle of
sustainable agriculture (BRAZIL, 2015; BRASIL, 2012).
0.00
50.00
100.00
150.00
200.00
250.00
300.00
Production Planted Area

2
A prior study published by the Brazilian Strategic Management Office of Ministry of
Agriculture, Livestock and Food Supply – AGE/MAPA (BRASIL, 2010) indicates that
Brazilian Agribusiness has a great potential for growth in the coming years due to the
significant increase in the domestic consumption for most agricultural products, as well as,
the strong growth of consumption in countries such as China and India. These countries have
practically exhausted their potential areas for food production, and now, they need to rely on
countries like Brazil that has great potential of food production, and available technologies
for supplying food worldwide.
Beyond having appropriate technologies and enough natural resources to attend the growing
demand for agro-foods, one of the biggest challenges of Brazilian agriculture refers to
comply with the current quality standards demanded by international markets, and ensure
the quality of the products offered for those markets and the domestic one, as well.
In this context, food quality certification schemes have been pointed as an important
instrument by international trading partners to protect and promote the health of its
consumers. As a result, more and more, exporting countries like Brazil must be prepared to
apply strict standards within food supply chain to maintain its levels of exports worldwide
and guaranteeing the same level of quality and food safety to the domestic consumers.
1.1.2 Beans production and consumption in Brazil: a summary
Beans and rice are considered the Brazilian staple food. Besides its nutritional significance,
beans are also important from the economic, social and cultural point of view.
Basically, there are two species of beans grown in Brazil: Vigna unguiculata (L.) Walp,
known as “cow pea” that is grown and consumed principally in the Northeast region; and,
Phaseolus vulgaris L., known as “common beans” (or simply “beans”) that is widely spread
throughout the country and represent the nacional preference, absolutly. Two basic
categories belong the latter species of beans: "black beans", and "colored beans" that include
several beans’ market classes such as “carioca”, “roxinho”, “jalo”, “vermelho”, and others
(IBGE, 2006).
The present study was developed considering only common beans data, specifically,
“carioca” beans, since it is the most known and consumed by people (Silva & Wander,
2013). Despite the wide distribution of beans crop throughout the country, the South of
Brazil is the most important beans’ producer, followed by Southeast, Northeast, Midwest
and Northeast regions. Taking as reference the Brazilian states, the rank of importance in
terms of total production is: Paraná (29,8%), Minas Gerais (21,3%), Goiás (11,3%), São
Paulo (10,1%) e Bahia (6,1%) (Embrapa Arroz e Feijão, 2012).
One of the most important aggregated geographical areas in terms of beans production is
known as “Brazilian Central Region - BCR” that comprises the following States and
Regions: Espírito Santo (ES), Rio de Janeiro (RJ), São Paulo (SP) and Minas Gerais (MG)
– Southeast Region; Goiás (GO), Mato Grosso (MT) and Mato Grosso do Sul (MS), and

3
Distrito Federal (DF) - Central-West Region; additionally, Tocantins (TO), Acre (AC) and
Rondônia (RO) - North; and, the Western of Bahia (BA) – Northeast (Posse, Riva-Souza,
Silva, & Rocha, 2010). In this region, beans are grown during three seasons in the year
comprising more than 85% of its counties, and represent an important source of income for
farmers and rural workers from those areas (Moreira & Gonzaga, 2012).
According to Posse et al. (2010), in 2008, BCR accounted 53% of the national’s beans
production in 38% of the total planted area; in 2010, this share increased to almost 60% of
the production and 59,58% of the planted area (Silva O. F., 2011). The Table 1-1 shows the
top five largest Brazilian municipalities bean’s producers in 2010, and the Figure 1-2
illustrates where they are located in the map of Brazil. All of them are comprised in the BCR.
Tabela 1-1 The top five largest Brazilian municipalities beans' producers, 2010
# City State Production
(ton)
Crop area
(ha)
Average productivity
(kg/ha)
1 Unaí MG 127.500 48.000 2.656
2 Cristalina GO 71.880 28.500 2.522
3 Luziânia GO 53.150 18.500 2.873
4 Paracatu MG 51.500 19.000 2.711
5 Brasília DF 49.007 17.189 2.851
Source: (Silva & Wander, 2013).
Diagnosis of BCR's farms made by Barbosa et al., (2009) shows that in Cristalina (GO)
concentrates the largest area under central-pivot irrigation in Latin America, with over 500
central-pivots, accounting more than 44.700 ha of varied farming (Figure 1-3).
According to the diagnosis, in this region beans are usually grown in crop rotation with corn
(Zea mays), rice (Oryza sativa), soybean (Glycine max), maize or grass + grass, which
consequently provides technically differentiated conditions which are favorable for the crop
development. The most usual bean’s cultivars planted in the farms were: BRS Perola
(colored bean, market class "carioca") and BRS Valente (black bean).
During the last ten years, the total of beans produced in Brazil has been fluctuated between
2.9 and 3.7 million tons, in more than 2.0 million ha of harvested area (Silva & Wander,
2013). The production is dominated by small-scale agriculture; sixty two per cent of the total
production comes from the called “familiar agriculture”, defined according to the art. 3 of
the Law Nº 11.326, 24/07/2006 (BRASIL, 2006).

4
Source: (Silva & Wander, 2013). Figure courtesy by Alcido Wander.
Figure 1-2 Density off common bean production, Brazil, 2010
Source: http://thematicmap.blogspot.it/2010/12/mapa-de-uso-do-solo-em-relacao-ao.html
Figure 1-3- Land use and distribution of central-pivot, Cristalina (GO) - Brazil
Less than 1 ton/Km2
From 1 to 5 tons/Km2
From 5 to 10 tons/Km2
From 10 to 15 tons/Km2
More than 15 tons/Km2
Top 5 common
beans producers
5
The vast majority of the growers (> 99%) has areas up to 50 ha. On the other hand, the large-
scale agriculture, represented by the “agribusiness sector”, accounts 38% of the entire
production. Goiás State is the largest producer in this category, with yields averaged 1.953
Kg.ha-1 (Silva & Wander, 2013).
Different farming systems are employed to produce beans, depending on the Brazilian
region. In general, growers from small-scale agriculture prefer “associated cultivation”,
while those from large-scale agriculture like better the “single cultivation”, normally in
irrigated areas located, commonly, in the Cerrado, a kind of tropical savanna ecoregion in
the central region of Brazil (EMBRAPA, 2013).
The vast Brazilian territorial dimension allows the cultivation of beans crop during three
different seasons within the year, with different levels of technology as stated by Posse,
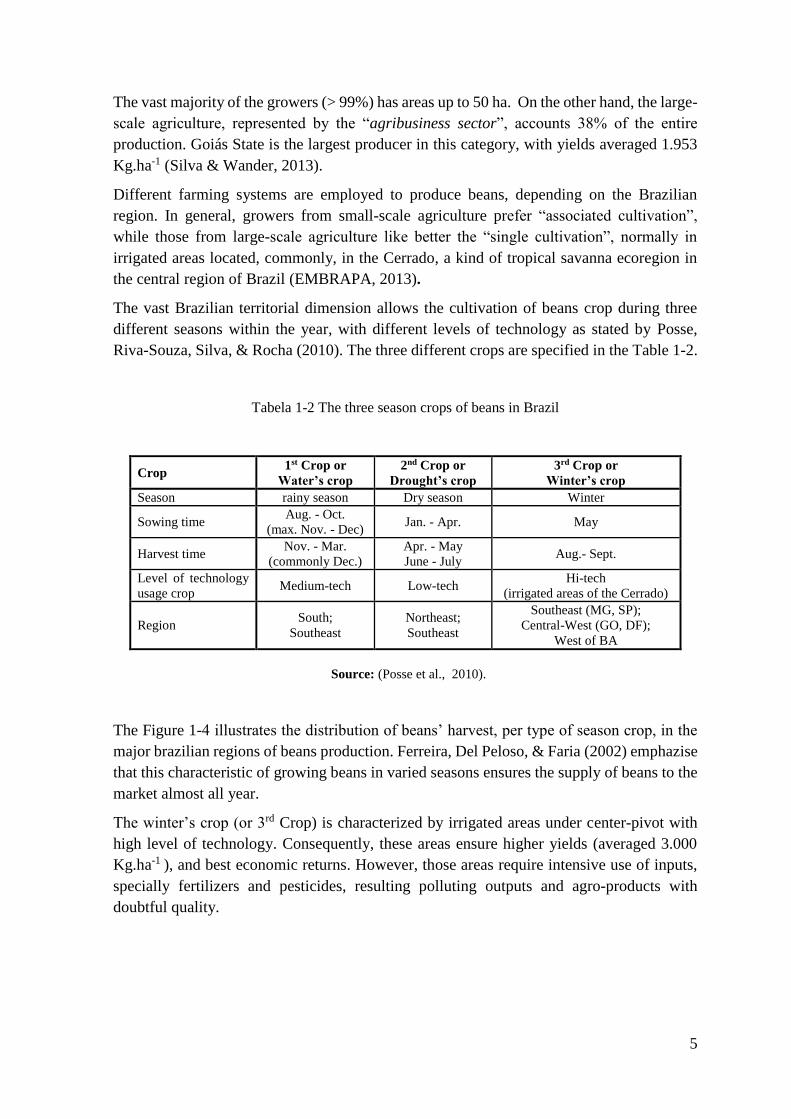
Riva-Souza, Silva, & Rocha (2010). The three different crops are specified in the Table 1-2.
Tabela 1-2 The three season crops of beans in Brazil
Crop 1st Crop or
Water’s crop
2nd Crop or
Drought’s crop
3rd Crop or
Winter’s crop
Season rainy season Dry season Winter
Sowing time Aug. - Oct.
(max. Nov. - Dec) Jan. - Apr. May
Harvest time Nov. - Mar.
(commonly Dec.)
Apr. - May
June - July Aug.- Sept.
Level of technology
usage crop Medium-tech Low-tech
Hi-tech
(irrigated areas of the Cerrado)
Region South;
Southeast
Northeast;
Southeast
Southeast (MG, SP);
Central-West (GO, DF);
West of BA
Source: (Posse et al., 2010).
The Figure 1-4 illustrates the distribution of beans’ harvest, per type of season crop, in the
major brazilian regions of beans production. Ferreira, Del Peloso, & Faria (2002) emphazise
that this characteristic of growing beans in varied seasons ensures the supply of beans to the
market almost all year.
The winter’s crop (or 3rd Crop) is characterized by irrigated areas under center-pivot with
high level of technology. Consequently, these areas ensure higher yields (averaged 3.000
Kg.ha-1 ), and best economic returns. However, those areas require intensive use of inputs,
specially fertilizers and pesticides, resulting polluting outputs and agro-products with
doubtful quality.

6
Figure 1-4 Beans’ harvest time distribution in the major production regions of Brazil
State Harvest time and Indication of Crop (1st, 2nd and 3rd crops)
Jan Feb Mar Apr May June July Aug Sept Oct Nov Dec
RS
SC
PR
SP
MG
BA
GO
MT
MS
RO
NE**
Source: (Posse et al., 2010).
Legend:
1st Crop or “Water`s Crop”
2nd Crop or “Drought`s Crop”
3rd Crop or Winter`s Crop
NE** Northeast region, except Bahia State
In terms of consumption, beans are consumed in the entire country with some regional
preferences, and because of this, a very small share of Brazilian producers offer beans to
foreign markets. The average self-consumption is 27,64% of the total Brazilian production
(Silva & Wander, 2013).
According to (IBGE, 2014), beans are one of the most consumed foods in Brasil. In its report,
IBGE points that 71,9% of people consume beans regularly (5 or more days a week) and
women consume this legume less than men. People with lower levels of education tend to
consume more beans than those with college degrees.
Although in recent years there are some rumors about an apparent decline in terms of beans
consumption on the domestic market, Wander & Chaves (2011) do not confirm this
hypothesis. Instead, the authors consider that the last 21 years (1990-2011) the trend shows
an increase in apparent per capita consumption, exceeding 17 kg/year in 2006/2007 (figure
1-5).
In the recent years, Brazil has been a net importer of beans to complete the demand of the
domestic market and to ensure food security. In 2006/2007, the level of imports was around
100.000 tons/year, while in 2011/2012 this amount was more than twice (CONAB, 2012),
possibly due to a production decrease in that year. However, the domestic production and
consumption of bean is very adjusted, as shown in figure 1-6 (Silva & Wander, 2013).

7
Source: (Wander & Chaves, 2011).
Figure 1-5- Evolution of dry beans consumption, Brazil, 1990-2011, (kg/inh./year)
Source: (Silva & Wander, 2013)
Figure 1-6- Production and consumption of beans (mil tons), Brazil, 1997/1998 to 2012/2013
For 2021/2022, projections of the Federation of the Industries of the State of São Paulo
(FIESP, 2012) indicate 25% increase in production, and 2,55% of planted area. The same
report indicates an increase in per capita consumption up to 22 kg/year, as well; finally, the
report suggests that Brazil will continue assuming the role as importer of beans, with
forecasting almost 114 thousand tons of imported beans to 2021/2022.
y = 0.2121x + 13.006R² = 0.8831
12.00
13.00
14.00
15.00
16.00
17.00
18.00
199
0
199
1
199
2
199
3
199
4
199
5
199
6
199
7
199
8
199
9
200
0
200
1
200
2
200
3
200
4
200
5
200
6
200
7
200
8
200
9
201
0
201
1
kg
/in
h/y
ear
"Apparent" per capita consumption of dry beans, 1990 -
2011

8
Another report published by AGE/MAPA brings very similar data. According to that, it is
expected that beans production can increase at an annual rate of 1,3%, and the consumption,
1,1% per year, during the decade. During the same period, imports average can arrive near
to 150.000 and 250.000 tons. The imports expansion can be justified by annual population
growth (BRASIL, 2012).
Finally, the literature demonstrates that the consumption of beans has a positive income
elasticity of consumption only for the lower income strata of the population, indicating that
increasing income, increases consumption of beans. However, Hoffmann (2007) shows that
the average income elasticity of consumption (for all strata) is negative (-0.072). It means
that increasing income, the consumption of beans decrease.
1.1.3 Brazilian bean’s supply chain
Considering the wide distribution of the production all over the country and its various
regional particularities, it becomes very complicated to understand the dynamics of beans’
supply chain. The ample variety of types and classes of beans produced and marketed in
several regions, impede, in some way, the development of the chain because it hinders
standardization, product classification and consequent formation of market prices (Moreira
& Gonzaga, 2012).
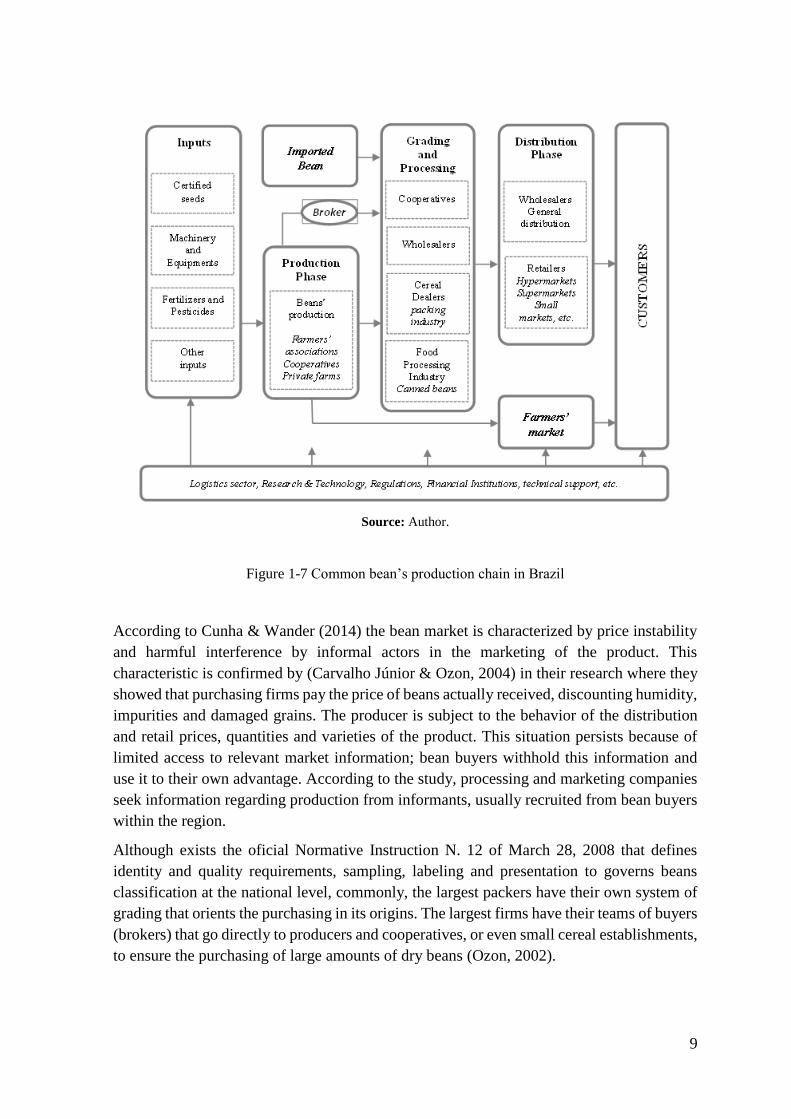
The Brazilian bean’s supply chain is basically composed of four main segments that precede
the ultimate consumers: (1) inputs industry; (2) production phase; (3) grading and processing
sector or agroindustry, basically comprised of “cereal1” packers and few processing
industries; finally, (4) the distribution phase, dominated by wholesalers and supermarkets;
farmer’s market is less important in the context of beans’ distribution. Imported grains are
basically absorbed by processing sector before reaching the final consumer (figure 1-7).
The principal segment is the grading and processing, represented by the cereal industry and
packers. This is the main point in terms of adding value to the product. Food industries
dedicated to producing products ready-to-eat with beans as principal ingredient, still
represents a very small parcel in this context.
The economic agents involved in the dry bean chain behave as follows: producers sell to
packagers and/or processors, who then distribute to the retailers (Cunha & Wander, 2014).
Normally, producers sell dry beans to processors in bags of 60 Kg. Once processed, the bean
is sold in packs of 1kg (in bales of 30 kg) identified with their respective processor brands.
The same cereal industry or packing has different brands for each type of product in terms
of quality (Ozon, 2002).
The way in which beans are marketed appears to be a detrimental factor in the development
of the activity, considered as one of the main bottlenecks in the production chain (Leitão,
Brisola, & Thomé, 2010)
1 Although bean is legume, in Brazil, the commercialization is done by cereal dealers/industry.
9
Source: Author.
Figure 1-7 Common bean’s production chain in Brazil
According to Cunha & Wander (2014) the bean market is characterized by price instability
and harmful interference by informal actors in the marketing of the product. This
characteristic is confirmed by (Carvalho Júnior & Ozon, 2004) in their research where they
showed that purchasing firms pay the price of beans actually received, discounting humidity,
impurities and damaged grains. The producer is subject to the behavior of the distribution
and retail prices, quantities and varieties of the product. This situation persists because of
limited access to relevant market information; bean buyers withhold this information and
use it to their own advantage. According to the study, processing and marketing companies
seek information regarding production from informants, usually recruited from bean buyers
within the region.
Although exists the oficial Normative Instruction N. 12 of March 28, 2008 that defines
identity and quality requirements, sampling, labeling and presentation to governs beans
classification at the national level, commonly, the largest packers have their own system of
grading that orients the purchasing in its origins. The largest firms have their teams of buyers
(brokers) that go directly to producers and cooperatives, or even small cereal establishments,
to ensure the purchasing of large amounts of dry beans (Ozon, 2002).

10
The marketing/distribution strategy is considerably varied, with a predominance of a small
group of wholesalers and supermarkets that concentrate the distribution channel, influencing
directly the price formation paid to the producer (Moreira & Gonzaga, 2012).
Several studies show the increasing importance of the supermarkets in the retail; others
distribution channels such as the farmers' markets, for instance, become less and less
important, specifically for beans (Ferreira, Del Peloso, & Faria, 2002; Ozon, 2002; Carneiro
& Parré, 2005). Silva & Wander (2013), based on data from IBGE, show the main
destinations of beans production, sold or given to third parties. According to the authors,
24,1% of producers sell directly to brokers (56% of production), 7,4% sell directly to the
final consumer (6,8% of production), 2,6% sell or deliver to cooperatives (9,1 % of
production) and 0,8% sell directly to processing industries (8,4% of production). The lack
of information for trading is one of the main flashpoints in the beans supply chain.
Ferreira, Del Peloso, & Faria (2002) mention the information asymmetry as one of the
bottlenecks of the beans agribusiness, where the seller usually has more information about
the quality and safety of the product in comparison to the buyer, resulting in opportunistic
transactions. However, nowadays, with the development of information systems via internet
producers have access to market information in real time, enabling better marketing
possibilities, and thus, greater generation income (Moreira & Gonzaga, 2012).
Ozon (2002) afirms that do not exist long-term contractual relationships in the bean supply
chain. In his study on the beans’ production chain in the major producer of the country
(Embrapa Arroz e Feijão, 2012), Paraná State, the author identified some interesting
opportunities for adding value in the beans’ production chain; for instance, payment of an
price premium for differentiated lots of beans based on quality and quantity criterias.
Moreover, the author suggests that regional food industries are interested on developing new
processed bean products (ready-to-eat); there is an opportunity for creating quality brands
aiming markets niches or collective trademarks. Organic beans and beans with certification
of origin are also cited by the author as great market opportunities. Then, the certified
integrated bean, object of this study, fits some of these criterias.
1.1.4 Integrated Production (IP) in Brazil
The concept of Integrated Production (IP) as a production system is relatively new in Brazil,
with no more than two decades. The IP had its legal framework established in 2010 by the
Normative Instruction Nº 27 of 30/08/10 (BRASIL, 2010).The distinctive signal (label) for
IP certification is illustrated by figure 1-8.
One of the first experiences with IP, in Brazil, was with fruit crops, in 2001. The project
“Integrated Production of Fruit - PIF” has achieved excellent results and was the great driver
for IP becaming a strategic priority of the Ministry of Agriculture (MAPA). The PIF has
played an important role in consolidating the competitiveness of the national fruit sector.

11
The model chosen in order to disseminate the PIF in the country's main fruit production areas
was through implementation of specific pilot-areas for each species of fruit plants. The pilot-
areas’ implementation were coordinated by the MAPA with financial support from the
National Scientific and Technological Development Council (CNPq).
Source: (INMETRO, 2010).
Figure 1-8- Integrated Production certification label, Brazil
Based on the experience with fruits, the MAPA has proposed something that could embrace
several other crops. Then, the Agricultural System of Integrated Production (SAPI) was
designed based on the principles of IP according to IOBC/WPRS. According to Boller,
Avilla, Joerg, Malavolta, Wijnands, & Esbjerg (2011) Integrated Production (IP) is:
“a concept of sustainable agriculture based on the use of natural resources and regulating
mechanisms to replace potencially polluting inputs. The agronomic preventive measures and
biological/physical/chemical methods are carefully selected and balanced, taking into
account the protection of health of both farmers and consumers and of the environment.
Emphasis is placed on a holistic systems approach involving the entire farm as the basic
unit, on the central role of agro-ecosystems, on balanced mutrient cycles, and on the welfare
of all species in animal husbandry. IPM (Integrated Pest Management) is the part of IP
focusing on pest, disease and weed management.”
Thus, the subsequent IP projects counted with a multidisciplinary team of technical support
that focused on applying best agricultural practices in the pilot-areas aiming at rational use
of agrochemicals, the monitoring of water, soil, environment, culture, post-harvest and
adoption of sampling routines (water, soil, leaf, fruit), and records on agronomic activities
and postharvest in all activities performed in order to obtain traceability at all stages of the
production process.
The specific technical guidelines (for each specific crop) on IP were drawn up in accordance
with official research centers, universities, agricultural development and extension agencies,
producer’s associations, rural entrepreneurs, technicians, and representatives of the various
productive chain.
Then, following the same PIF model, the IP projects were proposed for grain and animal
production in the middle of 2009, when more than 22 projects with 21 agricultural products,
in 14 States of Brazil, were developed (BRASIL, 2009).

12
One of them was the project named “Integrated Production System for Common beans -
PIFeijão”. It was proposed by the Brazilian Ministry of Agriculture, Livestock and Food
Supply – MAPA in order to reduce the negative environmental impacts of intensive beans’
production in irrigated areas of the Cerrado, grown during winter’s crop. Actually, the
project was coordenated by the Brazilian Agricultural Research Corporation – EMBRAPA,
particularly by Embrapa Rice & Beans, located in Goiás.
Embrapa Rice and Beans was designated to coordinate the project due to the vast experience
of its team of researchers on Integrated Pest Management (IPM), one of the principals of
IP. IPM is an effective and environmentally sensitive approah to pest control that can reduce
growers’ reliance on a chemical-based approach; more than a simple pest control method,
IPM is an agricultural management strategy based on monitoring and identifying pests,
practicing prevention, and implementing appropriate controls such as biological control and
bio-rational pesticides, and the judicious use of chemical pesticides when needed (U.S.
Environment Protection Agency, 2011).
The project “PIFeijão” was conducted in Goiás and part of the West of Minas Gerais, in the
BCR that represents one of the most important brazilian regions in terms of beans
production. Have participated several partners such as universities, public and private
companies of technical assistance, cooperatives and farmers. The main objective of the
project were develop a sustainable production system focused on quality and certification,
and elaborate the standards of production for common beans (Barbosa, et al., Sistema de
produção integrada do feijoeiro comum na região central brasileira, 2009). Additionally, the
development of the “PIFeijão” aimed to create a culture of producing beans with better
quality and safe to human consumption.
Although the Agricultural Census, 2006, (IBGE, 2006) demonstrates that almost 80% of the
Brazilian bean growers (responsible for 42% of the total production) don’t use pesticides,
some non-compliances were still verified according to the report “Food Pesticide Residues
Analysis Program - FPRAP”, coordenated by the Brazilian Heath Surveillance Agency –
ANVISA. The main objective of the FPRAP is control the level of pesticides residues in
foods in natura in order to guarantee the public health.
The FPRAP, in its report, shows that 3,0% of dry beans samples, in 2009, were considered
with some level of contamination because there were evidences of non-permited (NP)
pesticides for bean's crop. In 2010, the total of contaminated sample was 6,5%, with 5,2%
NP and 1,3% (>MRL). In both years, there were no cases of samples with pesticides residues
above Maximum Residue Limits (MRL) not even above MRL and NP. The NP active
ingredients for beans crop identified in the samples were: methomil, fenitrothion,
cyproconazole and myclobutanyl (ANVISA, 2010).
As recommendations, ANVISA has emphasized the necessity of clearing up and training
farmers with the collaboration of several institutions such as Technical Assistance and Rural
Extension Company - EMATER (the public rural extension service), agrochemicals
companies and National Rural Training Service – SENAR (entity specialized in training for
rural development). Additionally, highlighted the necessity of even more monitoring
industries and retailers of pesticides, and the establishment of new regulations on

13
certification of origin for in natura agro-foods produced for domestic market (ANVISA,
2010; (ANVISA, 2011).
The ANVISA also avocates in its report that consumers should prefer foods with certified
origin to motivate the producer's engagement with quality and Good Agricultural Practise
(GAP) and thus, incentivating new programs aiming food quality production with
traceability. The importance of food quality certification schemes is evident to inform
consumers about the food’s origin offered and to minimize the risk of contamination.
The present research is motivated on some of this recommendations, among other elements
that are presented in the next section. We believe that IP offers the most elements to improve
and ensure the quality of the beans produced in Brazil.

14
1.2 Motivation
As shown in our introduction, the Brazilian agriculture will play an increasingly and
important role in global food supplies and food security during the next decades. Ensuring
that Brazilian agriculture, in fact, might be recognized as a global agro-food supplier will
depend on a solid production structure based on sustainable agricultural practices and safe
food production.
For instance, the European Union (EU), one of the most important Brazil's trade partners,
have a strict food policy that require high standards of quality in order to guarantee food
safety for all consumers. The White Paper for Food Safety pinpoints that the rules worth for
all food suppliers, the Members of EU and non-members such as Brazil (European
Commission, 2000).
Implementing effective standards of production such as IP, for instance, can be helpful to
assert this important role. Besides ensuring agro-food product quality, the Integrated
Production System (IP) makes certain that the process of production is in compliance with
the standards of sustainable production, resulting on a certificated produce. Hence, IP could
be vital to strengthen the sector image towards domestic and foreign markets.
Andrigueto, et al., (2009) have observed that IP is an important instrument to support the
production sector since it aims of raising the standards of quality and competitiveness of
Brazilian agricultural products. In addition, IP can be considered an evolution of traditional
public regulations toward the standardization and certification of production processes of
agricultural products. The author pinpoints that there are clear evidences that IP has
advantages over conventional production: (a) IP practices rationalize the use of pesticides,
fertilizers and water; (b) rationalize the most of farming practices; (c) reduces losses of soil
nutrients; and (d) improve the technological level of the producers. On the other hand, some
pointed drawbacks were: its slow diffusion, additional costs (in sampling analysis,
monitoring and certification), and technical imperfections of some IP regulations.
Despite the government’s effort to establish the IP in the principal agricultural regions, to
the most important agro-food products, a small amount of growers has been adopted, and
slowly. Maybe because there are others certification schemes more established and accepted
in the global market, for instance, GlobalGap, that compete with the IP as alternative for
producing sustainable and safe agro-foods; maybe because growers are driven by market
signs and they do not have yet enough information on the consumer’s preferences toward
certified products.
In this context, we address some questions that prompted this research considering either the
growers’ and consumers’ viewpoints: (a) on the production side: although the Government
have been investing lots of money and efforts so as to stimulate a greater production of
quality/safe foods, why the greater parcel of farmers do not adopt the IP? Which factors are
contributing for this undesirable situation? Do growers willing to adopt IP for producing
beans? (b) on the consumers side: would consumers prepared to purchase certified agro-food
products with sustainable and safe food claims? Would credence attributes (such as

15
sustainably produce and pesticide-free residues) be important to consumers when they are
choosing beans? Are consumers willing to pay a premium price for IP labeled beans?
Overall, the Brazilian IP experiences, concluded and those in progress, have been generated
consistent results of the technical and economic point of view, however, the assessment of
this last component has not been emphasized in most projects. Practically, there are not
studies on IP with economic focus in Brazil, and we propose the present study to fulfill this
gap.
1.3 Research Objectives
The main objectives of this research are:
to identify the critical factors that can influence the adoption of IP by beans’ growers;
to measure the intention of beans’ growers in adopting IP as production system;
to verify the consumers’ perception for credence attributes on beans such as
"sustainably produced" and "free of pesticide residues";
to measure the willingness-to-pay a price premium for IP labeled beans.
The secondary objectives are:
to provide policy makers with basic information on consumer behavior toward IP
certified products aiming to establish future strategies to spread the IP more rapidly
among producers.
to provide stakeholders of supply chain with basic information on consumer behavior
toward IP certified products aiming to establish future strategies to disseminate IP
produce more efficiently among consumers.
Overall, contribute to improving the quality of food produced in Brazilian agriculture,
enhancing production practices that respect the environment and ensure the health of
consumers.
16
2 THE INTENTION OF COMMON BEANS’ GROWERS IN ADOPTING
INTEGRATED PRODUCTION IN THE BRAZILIAN CENTRAL REGION: AN
ANALYSIS USING THE TECHNOLOGY ACCEPTANCE MODEL (TAM)
Abstract
Economic models do not fully explain farmer behaviour with regards to technology adoption. The
technology Acceptance Model (TAM) proposes that user's acceptance and usage of a technology is
determined by two attitudinal components: perceived usefulness (PU) and perceived ease of use
(PEOU). A new hybrid model including two factors from Innovation Diffusion Theory (IDT) was
proposed in a tentative of produce results more comprehensive. However, the sample limitation does
not permit running the hybrid model, and only the TAM model was tested. Thus, this study sought
to determine whether the TAM model could adequately explain the adoption and use of integrated
production (IP) by common beans growers from one of the most important regions of beans'
production in Brazil. 93 interviews were applied during Dec./14 and Feb./15 in the research boundary
area. The technique of Structural Equation Modelling (SEM) was used to proceed with the
confirmatory factor analysis (CFA) to identify the relationship between the factors and their
measurement variables. The findings suggest that the respondents have positive perceptions toward
adopting integrated production. However, the proposed model does not explain completely the
intention of IP adoption by the interviewees. Only perceived usefulness has a positive impact on
attitude, and attitude on behavioural intention. One can conclude that, overall, the application of
TAM model does not work well with small samples and needs to be carefully structured to explain
human’s behaviour.
Keywords: Integrated Production; TAM; technology transfer; common beans.
2.1 INTRODUCTION
Despite considerable advances in agricultural research over the last decades in order to
deliver new technologies and systems of production to promote the agriculture sector
competitiveness, many technologies are transferred to the producers taking in account only
agronomic and/or economic advantages.
Besides those benefits, many of these new technologies and/or systems of production aim to
guarantee a high standard of quality of agricultural products with particular attributes; for
instance, the Integrated Production (IP) charges agronomic, economic, social and
environmental advantages.
IP produce have to respect specific standards of production to be delivered to the market
with a label of certification. The label is the distinctive signal used to inform the agents of
the production chain, including final customers, the value-added expressed by the product’s
attributes of quality.
The IP have been promoted by the Brazilian Government throughout its official research,
development, and extension agencies as a way of encouraging growth through increasing

17
agricultural production, based on the protection of the base of natural resources, and the
protection of consumer’s health (BRASIL, 2015).
The problem is that few targeted communities of producers participate in this kind of project
at the ideal rates and intensity or for the expected length of time. Some reasons that explain
this scenario could be some regional differences in terms of natural resources, inequality
among agricultural segments (familiar agriculture vs. agribusiness sector), and crop interest
due to some of them are target to export and others to the domestic market (Souza Filho,
Buainain, Jardim da Silveira, & Vinholis, 2011).
Then, studying the process of technology adoption became an important issue to elucidate
or to predict possible problems that could affect the adoption and afterwards the diffusion of
the offered technologies available.
The primary aim of the present study was to determine whether the Technology Acceptance
Model (TAM) could provide an adequate explanation of adoption and use of integrated
production by common beans farmers. An additional aim was to determine the extent to
which some economic, social, technical, environmental, and market factors influence
decision making of bean’s growers, technology adoption and use.
For the purposes of the present study, the TAM model was tested with integrated production
(IP) understood as a technology.
2.1.1 Technology, Adoption and Diffusion
An effective farm management and improvement is directly related to the process of
technology transfer and adoption of appropriate new technologies (Flett, Alpass, Humphries,
Massey, Morriss, & Long, 2004).
Parvan (2011) in his literature review about agricultural technology adoption mentions
different definitions of technology. According to the author:
“technology is assumed to mean a new, scientifically derived, often complex input supplied
to farmers by organizations with deep technical expertise…. Is simply the application of
scientific knowledge for a certain end.”
Additionally, he cites the definition by Gershon and Umali’s2, as well:
“technology is a factor that changes the production function and regarding which there
exists some uncertainty, whether perceived or objective (or both). The uncertainty diminishes
over time through the acquisition of experience and information, and the production function
itself may change as adopters become more efficient in the application of the technology”.
2 Gershon Feder and Dina L. Umali, “The Adoption of Agricultural Innovations: A Review” in Technological Forecasting
and Social Change, (Iss. 43, 1993), pg 215-239.
18
Parvan’s observation is that mostly studies on agricultural technology adoption is focused
on Green Revolution (GR) technologies such as irrigation and high-yield varieties (HYV)
and the inputs to make them productive, i.e., chemical fertilizers, pesticides, and so on.
That’s the reason the findings are concentrated on a “high-tech” definition of agricultural
technology.
In terms of types of adoption, the literature considers basically three types: (i) individual vs.
aggregate adoption; (ii) singular vs. packets of technologies; and (iii) divisible vs. non-
divisible technologies (Feder, Just and Zilberman3 cited by Parvan, 2011).
Individual adoption is related to the degree of use in the long run, while aggregate adoption
refers to the aggregate level of use of a particular technology among certain group of
producers or in one specific area.
The second type, singular vs. packets of technologies, is related to others complementary
agricultural practices or inputs that should be introduced together, in bundles, with the main
technology, in order to make it works as designed.
Finally, some technologies cannot be divisible. That is the case of integrated production (IP).
Although IP can be considered a bundle of sustainable practices focused on safe food
production, the adoption of this kind of production system by itself cannot be considered
divisible due to its concepts and principles in the context of a certification scheme (IOBC,
2004). Thus, producers have to adopt the entire technology or not at all.
According to Rogers (1983), diffusion of technology is the process by which an innovation
is communicated through certain channels over time among the members of a social system;
diffusion is a special type of communication concerned with the spread of messages that are
perceived as new ideas. Rogers, in his book highlights the four key-elements to the process
of technology diffusion: the innovation, communication channels, time, and the social
system (context).
An innovation, simply put, is “an idea perceived as new by the individual”. Communication
is the process by which participants create and share information with one another in order
to reach a mutual understanding.
A communication channel is the means by which messages get from one individual to
another. For instance, mass media channels can be more effective in creating knowledge of
innovations, while interpersonal channels are more effective in forming and changing
attitudes toward a new idea, and thus in influencing the decision to adopt or reject a new
idea.
The time dimension is involved in diffusion in three different ways (Rogers, 1995). Firstly,
the innovation decision process is the mental process through which certain decision making
unit or individual passes from first knowledge of an innovation to forming an attitude toward
the innovation, to a decision to adopt or reject, to implementation of the new idea, and to
3 Gershon Feder, Richard E. Just and David Zilberman. Adoption of Agricultural Innovation in Developing Countries: A
Survey. World Bank: Staff Working Papers No. 542, 1982, pg 3.
19
confirmation of this decision. This process is characterized by five steps: knowledge,
persuasion, decision, implementation, and confirmation.
The innovativeness is the second way in which time is involved in diffusion. Innovativeness
is the degree to which an individual or other unit of adoption is relatively earlier in adopting
new ideas than other members of a social system. There are five adopter categories:
innovators, early adopters, early majority, late majority, and laggards.
The rate of adoption is the third way in which time is involved in diffusion. The rate of
adoption is the relative speed with which an innovation is adopted by members of a social
system that adopt the innovation in a given time period.
Finally, the social system is the fourth main element stated by Rogers, in the process of
diffusion of new ideas. A social system is defined as a set of interrelated units that are
engaged in joint problem-solving to accomplish a common goal. Individuals, informal
groups, organizations, and/or subsystems are examples of members or units of a social
system.
When enough individuals have adopted an innovation at the point that the innovation’s rate
of adoption becomes self-sustaining, we have a final decisive concept in understanding the
nature of the diffusion process, called critical mass.
2.1.2 Factors influencing technology adoption in agriculture
Around the world, many researchers have conducted analyses and surveys aiming to
understand the individual decision making process of adoption and the diffusion patterns in
different groups of producers. Since the principal interest of farmers is maximizing
production and profit, as consequence, mostly of these studies is conducted focusing on
economic concerns influencing decision making and technology adoption (Gasson, Crow,
Errington, Hutson, Marsden, & Winter, 1988). Nevertheless, in many cases, the full
complexity of producers’ behavior and motivation towards the technology adoption cannot
be captured by using neatly economic models (Flett, Alpass, Humphries, Massey, Morriss,
& Long, 2004).
According to Sinden & King (1990) when the innovation is easy to adopt with clear
economic advantages, with low complexity, and without other intervening considerations,
then economic models adequately explain producer’s behavior with regards to technology
adoption. However, in the real-life, a situation where these prerequisites conditions are
favorable to facilitate the process of adoption of modern technological innovation is not
easily found. Thus, even though there are economic evidences motivating farmers to adopt
certain innovation, they probably won’t (Flett, Alpass, Humphries, Massey, Morriss, &
Long, 2004).
The process of technology adoption and its patterns of diffusion is a multi-factorial problem
that is normally linked to the adopter’s characteristics and the context of technology
applicability.
20
Parvan (2011) stresses the most common factors used to explain the variability seen in
agricultural technology adoption: farm size, human capital, labour availability, risk exposure
and capacity to bear risk, tenure, credit constraints, and access to commodity markets. For
the purposes of this study, we have considered some of these factors.
According to Parvan, some studies, in which the author has analysed farm size in the context
of technology adoption, show that the effects of farm size vary depending on the type of
technology being introduced. Moreover, farm size has the expected positive association with
propensity to adopt the agricultural technology. The author mentions that while larger farms
adopt lumpy (non-divisible) and divisible technologies faster than smaller farms, the latter
adopt the divisible technology more intensively, and may eventually adopt the lumpy
technology. Simply put, there is a positive relationship between farm size and likelihood to
adopt.
Other important factor used to explain the variability seen in agricultural technology
adoption is human capital. This variable is comprised of individual or community
characteristics such as education, human health indicators, age and gender demographics.
Farmers with higher education possess higher specific abilities and are able to adjust faster
to farm and market conditions. Parvan (2011) mentions that human’s capital is positively
correlated with innovators or early adopters. Farmers with higher levels of education adopt
new technology more rapidly than farmers with lower level of education. Laggards are
associated with lower education. Furthermore, the author mentions that farmers’ assessments
of the relevance of technology are more important than contact with the technology or with
extension workers in the adoption process.
Regarding the factor "labour", the labour market affects technology adoption differently
depending on the labour availability (shortage or surplus) on the area targeted with the
technology; higher labour supply is associated with higher rates of adoption of labour-
intensive technologies; the inverse is also true. The seasonal availability is also important.
Additionally, it is important consider how much laborious the proposed technology is
(labour-saving or labour-intensive). How the present study comprises only producers from
agribusiness (large farms), the number of family components possibly is not important,
considering that they do not represent effective labour force.
Lee, Hsieh, & Hsu (2011) notes that increased access to credit sources can help farmers
overcome short-run liquidity constraints and increase technology adoption. There are
evidences that credit constraint is an indicator which manifests itself in other factors. Souza
Filho et al. (2011) mention that producers that have credit access are more likely to adopt
new technologies due to their ability in managing the risk regarding the production and
commodity prices.
Risk exposure and capacity to bear risk, whatever the risk, like subjective risk related to
uncertainty in outcomes from unfamiliar techniques that could result uncertainty over yield,
or objective risks linked to climate variations in rainfall, for instance, and occurrence of
pests, diseases and other blights, and the timely access to critical inputs, as well, are crucial
factors of aversion on adopting high-technologies (Moser & Barrett, 2003).

21
Access to inputs and commodity markets is another essential factor. If farmers are not secure
in their access to the basic resources (fertilizers, pesticides and so on) and the markets that
provide them, or uncertainty over the product price applied by the commodity market, the
adoption process could be negatively influenced.
Studies suggest the likelihood that a farmer will continue using an agricultural technology is
related to the frequency of contact with trained extension workers, especially for technically
complex technologies. Moreover, contact with neighbouring farmers who possess
knowledge of the proposed technology also increases the likelihood of adoption (Moser &
Barrett, 2003).
2.1.3 Other variables that can influence adoption of integrated production
Several prior studies include other important variables that can influence integrated
production adoption such as demographic variables. Normally, level of education, age,
farming experience, income, and gender are variables that have direct effect on technology
adoption. We included some of these in this study considering that it is impossible to
contemplate all the variables on the same structure model.
Rogers (1995) shows that early adopters of technology have higher education levels than
later adopters. Hussain, Zia, & Saboor (2011); Adrian, Norwood, & Mask (2005); Daberkow
& McBride (2003); and Souza Filho H. M., Buainain, Jardim da Silveira, & Vinholis (2011)
reinforce this hypothesis saying that higher the growers age, lower the intention of
technology adoption. The same authors consider also the level of farmer’s education as
fundamental; higher the growers’ level of education, higher the intention of technology
adoption.
Complementary, Adrian, Norwood and Mask (2005) and Daberkow and McBride (2003)
have identified the negative influence of farming experience (in terms of number of years
working with agriculture) on the adoption process. Higher the farming experience, lower the
intention of technology adoption. Contrary, Souza Filho, et al. (2011) state that farming
experience is a relevant factor for adopting sustainable practices (including tools and
certification schemes focused on environmental management and food safety). Then, higher
the farming experience, higher the intention of technology adoption; growers with more
experience would learn easily how to apply the new technology. In this study, we will
assume this positive relation.
Several studies (Hussain, Zia e Saboor, 2011; Parvan, 2011; and Daberkow and McBride,
2003) have indicated that larger the farm, more likely to be adopt certain technology. Adrian,
Norwood and Mask (2005) details this statement saying that larger farmers are more likely
to be able to invest capital, time and learning in order to use the technologies than smaller
farmers. Li, et al. (2013) have reported in their study entitled “Factors Influencing Adoption
of Integrated Pest Management in Northeast Greenhouse and Nursery Production” that larger
farms tend to exhibit higher levels of IP adoption. The size of the farm was measured by the
number of full-time workers. We will use the same indicator in the current research.
22
Other variables considered in this study are farm type and incentives. Li, et al. (2013) suggest
the diversity of crops produced is a kind of factors that influence IPM adoption. Considering
the Brazilian reality, where livestock is a very common rural activity, we will investigate if
the presence of livestock could affect the intention to adopt IP negatively.
Finally, incentives such as access to specific credit lines for applying sustainable practices,
and other public policies to minimize negative effects of price fluctuation on the certified
beans, for instance, even the lack of price premium for IP beans will be investigated as
factors that influence the intention of adoption as suggested by Sterns & Codron (2001).
2.2 METHODOLOGY
2.2.1 Theoretical Model
Many fields of knowledge have been studying how new ideas or technologies diffuse or
spread among social systems. Several models and methods have been proposed to explain
the factors that promote or hinder the acceptance of certain technology.
Parvan (2011) mentions three of these methods used by researchers to understand the factors
that determine the adoption of technology across time and space. The first one, called time
series analysis, is applied to determine the rate of technology adoption within the time, but
does not explain the main reasons for adoption. The second method, known as cross-
sectional analysis, can be applied in two different forms: “snapshot” that associates farmer
characteristics with likelihoods of adoption; “recall” that links characteristics with the time
at which adoption occurred. Finally, the panel data analysis (PDA) is less common due to
the difficulty in collecting and manipulating data. PDA brings together the other two
methods in order to explain the adoption process and the characteristics associated with it.
Everett Rogers’s Diffusion of Innovations is possibly one of the most influential models; the
author is considered as the pioneer of technology adoption research. However, for the
purposes of the present study, an innovative method was chosen to permit capture some
important psychological elements that influence producers in adopting or not the technology.
That is the Technology Acceptance Model (TAM) by Davis (1989).
In order to present a strong theoretical basis for investigating the major factors of agricultural
technology adoption behaviour, specifically the integrated production, the chosen model
integrates the TAM model and part of the Innovation Diffusion Theory – IDT by Rogers
(1995). Both are two important theories in the literature and have been widely used to predict
behavioral intention, principally the TAM model.
2.2.1.1 Technology Acceptance Model (TAM) and the Innovation Diffusion Theory
(IDT)

23
Technology Acceptance Model (TAM) is a methodological framework proposed by Davis
(1989) for investigating the intention to adopt information technology (Figure 2-1). The
TAM has been used to explain both short-term (acceptance and adoption) behaviours and
long-term (usage) behaviours (Morris & Venkatesh, 2000).
Davis has based TAM on the Theory of Reason Action (TRA) by defining perceived
usefulness (PU) and perceived ease of use (PEOU) as constructs that predict behaviour
intention (BI) and usage of technologies. The Theory of Reasoned Action (TRA) is a
psychological model that proposes a person’s attitudes toward a technology play an
important role in determining their behaviour towards it (Ajzen & Fishbein, 1980).
Figure 2-1- Technology Acceptance Model (TAM) by Davis (1989).
Davis defines Perceived Usefulness (PU) from the word ‘useful’ that means "capable of
being used advantageously"; PU means "the degree to which a person believes that using a
particular system would enhance his/her job performance within an organization context".
Perceived Ease of Use (PEOU) follows the definition of ‘ease’ that means "freedom from
difficulty or great effort"; PEOU is defined as "the degree to which a person believes that
using a particular system would be free of physical and mental efforts".
Davis (1989) highlights the importance of both salient beliefs - PU and PEOU - as
determinants of user behaviour, citing several studies, for instance, Schultz and Slevin
(1975) and Robey (1979) who have theorized that “a system that does not help people
perform their jobs is not likely to be received favourably in spite of careful implementation
efforts”.
Both PU and PEOU are distinct psychological constructs that exert direct effects on
technology acceptance and usage behaviour, with PU having the greater effect. However,
PEOU can operate via PU; that is; a perception of ease of adoption and use can effectively
make a technology more useful (Davis, 1989). Nevertheless, the direct influence of PEOU
on adoption and usage behaviour is believed to be more important than its indirect effect
(Davis, 1989).
Besides, the TAM defines attitude toward using (A) as “an individual's positive or negative
feeling about performing the target behaviour”, and behavioural intention (BI) as “the degree
External
Variables
Perceived
Usefulness
(PU)
Perceived
Ease of Use
(PEOU)
Attitude
Toward
Using (A)
Behavioral
Intention to
Use (BI)
Actual
System Use
24
to which a person has formulated conscious plans to perform or not perform some specified
future behaviour”.
Davis (1989) mentions that there are some divergences among theorists with regard to the
relationship between A and BI. According to the author, Fishbein and Ajzen (1975) consider
the behaviour influenced by the beliefs only via their indirect influence on attitudes; Triandis
(1977) argues that beliefs and attitudes are co-determinants of behavioural intentions; and
Weiner (1986) considers attitudes as antecedents of beliefs. In addition, Davis (1989) also
cites Davis (1986); and Bagozzi and Warshaw (1989) that consider attitudes do not fully
mediate the effect of perceived usefulness and perceived ease of use on behaviour.
Prior empirical studies, for instance, Aubert, Schroeder and Grimaudo (2012), and Lee,
Hsieh and Hsu (2011) recommend integrating TAM with the Innovation Diffusion Theory
– IDT by Rogers (1995). While the TAM perspective focuses on behavioural attitudes
towards a technology, the IDT perspective focuses on perceived characteristics of an
innovation (Aubert, Schroeder, & Grimaudo, 2012). Results from other studies integrated
both theories have provided good results, for instance, Sigala et al., 2000 and Chen et al.,
2002 cited by Lee, Hsieh and Hsu (2011).
IDT theory argues that “potential users make decisions to adopt or reject an innovation based
on beliefs that they form about the innovation” (Agarwal, 2000). IDT includes five factors
that shape the rate and likelihood of adoption:
(1) the relative advantage: defined as “the degree to which an innovation is considered as
being better than the idea it replaced”. Increased performance, cheaper costs, increased
social standing, or even a wow factor may all contribute to the sense or relative advantage.
This construct is found to be one of the best predictors of the adoption of an innovation;
(2) the compatibility refers to “the degree to which innovation is regarded as being consistent
with the potential end-users’ existing values, prior experiences, and needs.” This
compatibility may be of a technical basis and should not cross one’s value or belief system;
(3) the complexity is “the end-users’ perceived level of difficulty in understanding
innovations and their ease of use”. The less complex something is to use, the more likely an
individual is to accept it; a potential user must also understand why the innovation is
appropriate or beneficial;
(4) the trialability “refers to the degree to which innovations can be tested on a limited basis.”
This factor is related to the opportunity that potential users get the chance to try the
technology without having to fully commit to purchasing or adopting it, by opportunities
such as demonstration units, and simulations;
(5) the observability is “the degree to which the results of innovations can be visible by other
people.” This factor is one of the most critical factors; for a person do adopt a technology,
seeing, hearing about, or otherwise knowing that other individuals are using that technology
dramatically encourages adoption.
Both theories, TAM and IDT, assign some key constructs, and can be considered
complementary to explain the adoption process, although, theoretically, the diffusion of an
innovation doesn’t have any direct relation with the TAM (Lee, Hsieh, & Hsu, 2011).

25
Basically, in IDT, the relative advantage and complexity constructs capture, respectively,
the PU and the PEOU idea in TAM, although the sign of this later is the opposite.
Moreover, TAM and IDT propose that, in terms of the complexity construct, the formation
of users’ intention is partially determined by how difficult the innovation is to understand or
use; then, the less complex something is to use, the more likely the end-user is to accept it
(Davis, Bagozzi and Warshaw 1989; Rogers 1995).
According to Lee, Hsieh and Hsu (2011) that developed a new hybrid technology acceptance
model by combining TAM and IDT, the innovative characteristics from IDT had significant
effects on the behavioural intention. The authors cite other research findings (Chang & Tung,
2008; Wu & Wang, 2005; Hardgrave et al., 2003) that support strong relationships among
the five IDT innovative characteristics and the behavioural intention. In addition, consider
this complementary characteristic can provide an even robust model to explain the adoption
process supported in other studies such as Wu & Wang (2005); Chen, Gillenson, & Sherrell
(2002).
Considering our research purposes, we were taken from IDT only two constructs of
innovative characteristics, relative advantages and complexity, as additional research
constructs thinking to increase the overall results of the study. Some results of our qualitative
research support the choice of these two constructs. Tornatzky and Klein (1982) cited by
Davis (1989) affirm that compatibility, relative advantage and complexity have the most
consistent significant relationships across a broad range of innovation types.
As relative advantages and complexity variables, we have considered some items consistent
with other studies (Li, Gómez, Rickard, & Margaret, 2013) that are basically the most
frequent items verified within the answers from the explorative survey, part of the current
research (which the respondents were asked to indicate the advantages/disadvantages of
using IP, and the most difficult IP’s practices perceived by them, and even the reasons to
adopt or not this farming system as a technology).
Particularly, in the current study, relative advantages include the perceived net benefit of
using IP over current conventional agricultural practices with consideration of technical and
economic viewpoints. Curiously, most of the potential advantages listed from the results of
the explorative research were similar to those reported by Sawyer (1994); Olson (1998); and
Intarapapong et al. (2003) cited by Adrian, Norwood and Mask (2005) on the field of
precision agriculture: reducing production costs, increasing yields, protecting environment,
and, the most cited, providing massive amounts of information to help management.
2.2.1.2 Empirical Framework and Hypotheses
The present study focuses on farmers’ perceptions of usefulness and ease of use toward using
IP to produce common beans. Overall, Figure 2-2 shows the structural research framework
combining elements from both TAM and IDT. In addition, other variables from previous
studies are also included in the model. With the inclusion of the new variables we expected
to extend the model capabilities in predicting farmer’s intention, to be more comprehensive.
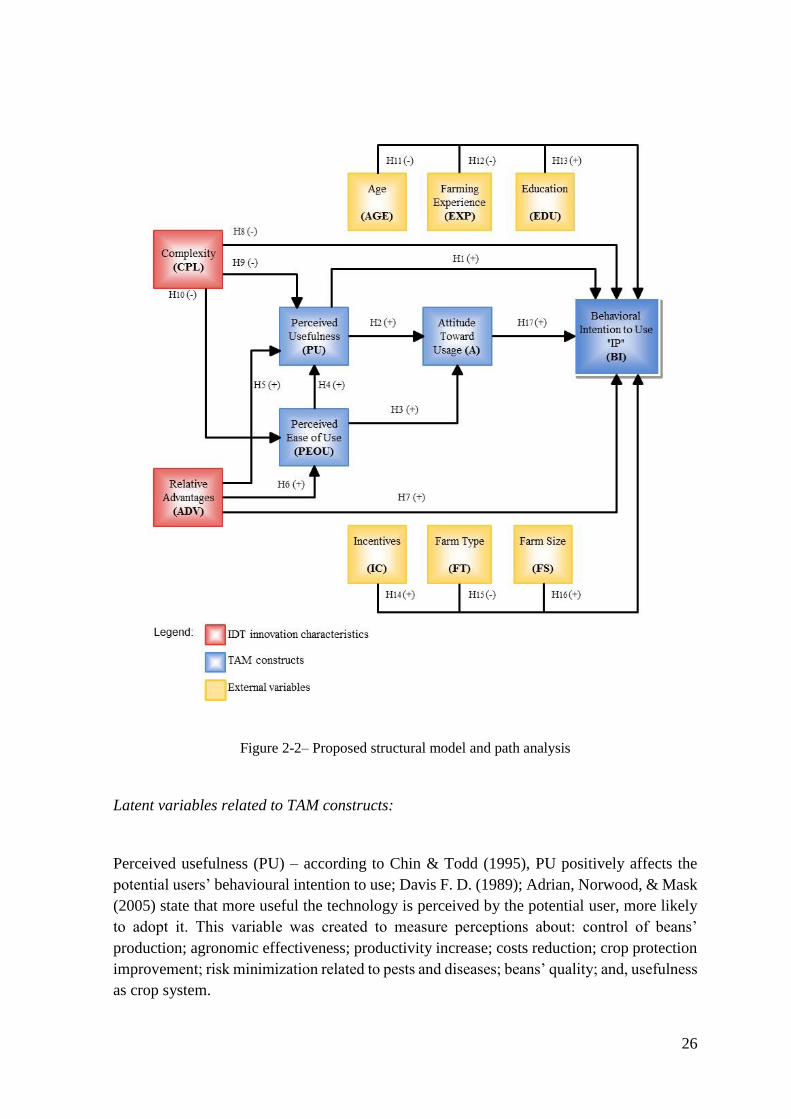
26
Figure 2-2– Proposed structural model and path analysis
Latent variables related to TAM constructs:
Perceived usefulness (PU) – according to Chin & Todd (1995), PU positively affects the
potential users’ behavioural intention to use; Davis F. D. (1989); Adrian, Norwood, & Mask
(2005) state that more useful the technology is perceived by the potential user, more likely
to adopt it. This variable was created to measure perceptions about: control of beans’
production; agronomic effectiveness; productivity increase; costs reduction; crop protection
improvement; risk minimization related to pests and diseases; beans’ quality; and, usefulness
as crop system.

27
Perceived ease of use (PEOU) - Chin & Todd (1995) state that PEOU has a positive effect
on the end-users’ behavioural intention; Davis F. D. (1989) affirms that PEOU has a positive
effect on the end-users’ PU, and a positive effect on attitude. This variable was included to
measure perceptions about IP regarding: facility to learn and apply the IP practices; facility
in understand and apply the IP standards; facility to use IP with the available technical
support services; facility to use IP considering the available biological control agents and
other IPM supplies; ability in using IP practices without an intensive technical support
around; and, facility to use IP for producing common beans.
Attitude toward usage (A) - Davis F. D. (1989); and Fishbein & Ajzen (1975) state that
attitude toward usage has a positive effect on intention to use IP system. This variable, in
turn, was related to the overall producers’ opinion about IP system; if producers like or
dislike the idea of using IP for producing common beans; if the choice of using IP is
advantageous or not; and, if the decision of using IP is something positive or negative.
Latent variables related to IDT innovations characteristics:
Complexity (CPL) - Shih (2007); Lee (2007); Lin (2006) cited by Lee, Hsieh and Hsu (2011)
affirm that complexity has a significantly negative effect on the intention to use; Hardgrave,
et al. (2003) cited by Lee, Hsieh and Hsu (2011) state that complexity has a significant
negative effect on PU; and Lee, Hsieh and Hsu (2011) points that this variable a significant
negative effect on PEOU. For the purposes of the present study we have considered the
following elements to be measured: the facility in applying IP practices such as Integrated
Pest Management (IPM); facility in learning some IP strategies such as chemicals'
application decision and water management; facility in learning and applying the procedures
of recording and documentation required by IP protocol; facility in applying the mandatory
regulations; facility to have a good and well-trained operational staff for running IP; and, the
complexity itself in implementing and using IP on the farm context.
Relative advantages (ADV) - Lee, Hsieh and Hsu (2011) states that perceived relative
advantages positively affect the users’ intention to use, affect positively the level of
usefulness, and have significant positive impacts on PEOU. Behind these variables we seek
to measure the effectiveness of IP in enhancing the value of the production due to the
certification; the capacity of IP to lead more benefits to employees; the effectiveness in
optimizing plant treatment and producing better quality of beans; the improvement of the
access of a large portion of the commodity market due to IP produce; the capacity of IP
produce to provide consumers with a higher level of quality and safety/confidence; and,
finally, if IP brings more benefits to the environment than the conventional system.
External variables:
28
Hussain, Zia, & Saboor (2011); Daberkow & McBride (2003); and Adrian, Norwood, &
Mask (2005) state that higher the growers age, lower the intention of adoption; and higher
the growers level of education, higher the intention of adoption. Souza Filho, Buainain,
Jardim da Silveira, & Vinholis (2011) affirm that higher the farming experience, higher the
intention of adoption. Hussain, Zia, & Saboor (2011); Parvan A. (2011); Daberkow &
McBride (2003); Adrian, Norwood, & Mask (2005); and Li J., Gómez, Rickard, & Margaret
(2013) point out that larger farms (measured by the number of full-time workers) tend to
exhibit higher levels of adoption. Ascough II, Hoag, Frasier, & McMaster (1999) highlights
that farm type (ownership of livestock) influences the intention to adopt. We will assume
that the presence of livestock activity will affect the IP adoption negatively in the context of
this research. Clear incentives and official policies such as access to credit for adopting
technology; receiving a premium price for IP certified beans; receiving subsides to acquire
IP’s supplies such as biological control agents can influence positively the intention to adopt
(Sterns & Codron, 2001).
The hypotheses considered in the research model, its relationships and path construction are:
H1 (PU BI): Perceived usefulness has a positive effect on behavioural intention to use
integrated production system.
H2 (PU A): Perceived usefulness has a positive effect on attitude to use integrated
production system.
H3 (PEOU A): Perceived ease of use has a positive effect on attitude to use integrated
production system.
H4 (PEOU PU): Perceived ease of use has a positive effect on perceived usefulness of
the integrated production system.
H5 (ADV PU): Relative advantages have a positive effect on perceived usefulness of the
integrated production system.
H6 (ADV PEOU): Relative advantages have a positive effect on perceived ease of
use of the integrated production system.
H7 (ADV BI): Relative advantages have a positive effect on behavioural intention
to use integrated production system.
H8 (CPL BI): Complexity negatively affects behavioural intention to use integrated
production system.
H9 (CPL PU): Complexity negatively affects perceived usefulness of the integrated
production system.
H10 (CPL PEOU): Complexity negatively affects perceived ease of use of the integrated
production system.
H11 (AGE BI): The growers’ age has a negative effect on behavioural intention to use
integrated production system. (↑ years old ↓ intention to adopt IP).
H12 (EXP BI): Farming experience has a positive effect on behavioural intention to use
integrated production system. (↑ years of experience ↑ intention to adopt IP).
H13 (EDU BI): The growers’ education level has a positive effect on behavioural
intention to use integrated production system. (↑ education level ↑ intention to adopt IP).
H14 (IC BI): Incentives access for adopting IP practices has a positive effect on
behavioural intention to use integrated production system.
H15 (FT BI): Farm type affects negatively the behavioural intention to use integrated
production system. (presence of livestock ↓ intention to adopt IP).

29
H16 (FS BI): Farm size (measure by the number of full-workers) has a positive effect on
behavioural intention to use integrated production system. (↑ N. of full-workers ↑ intention
to adopt IP).
H17 (A BI): Attitude toward usage has a positive effect on intention to use integrated
production system.
2.2.1.3 Data Collection and Survey Procedures
For the purposes of this research, we assume the concepts of qualitative and quantitative
research as described by Troilo & Molteni (2003). The authors say that qualitative research
is irreplaceable when the ultimate goal of the researcher is to know so deeply certain
phenomenon, i.e., comprehend the complex relationships of the elements that compose it. It
is indicated especially when the research wants to explore a new phenomenon that has not
even their preliminary knowledge. Qualitative studies are very suitable for understanding
social phenomena linked to reality due to the reality is a social construction.
Some objectives addressed in this research such as understanding the producer intention for
adopting or not a new technology (such as IP), is a phenomenon characterized by strong
social components and therefore they have several interrelated elements.
Troilo & Molteni (2003) mention that these phenomenon is constructed from a reality made
of perception, belief, attitude, motivation and social behaviour. Comprehend the interaction
of all these elements depends on the understanding of the interactions among individuals;
more, depends on the understanding of the interactions among them and tangible and
intangible aspects that constitute the world of what is intended to investigate.
When we apply a qualitative research as a preliminary step to quantitative research, as
proposed in this study, we can enhance the efficiency of the second and all global research.
It allows defining better the shapes of the proposed problems, develop the hypotheses in a
more accurate way and choose the variables and their key relationships clearly. Thus, while
the qualitative research allows us to understand deeply certain phenomena, quantitative
research allows us to measure the phenomenon questioned (Troilo & Molteni, 2003). Thus,
the data collection was conducted in two stages through field work. The first stage was
focused on the qualitative research in order to elicit the salient beliefs for each latent variable.
Qualitative Research
This phase was developed between October 2013 and February 2014. Ten beans’ growers
and agronomists with prior experience in IP were interviewed in the selected area of this
research. The questionnaire with open-ended questions comprised four sections: (1) the first
part with four questions about technical aspects related to IP adoption; (2) the second part
with four questions aiming eliciting the economic advantages and disadvantages in adopting
IP; (3) the third part, with six questions, was constructed with the objective to elicit some
institutional relevant factors the can influence IP adoption; and, (4) the fourth part brought

30
some market aspects and other additional issues, comprising four questions. An additional
section was included to take some personal and professional data about the respondents. The
interviews were recorded and then transcript. Afterwards, a content analysis was applied to
summarize the salient beliefs for each construct, and the respondent’s impressions about the
complementary variables. The main structure of the questionnaire used in this phase is
available in Appendix A.
Quantitative Research
The second stage, in turn, was the quantitative research. The structured questionnaire was
constructed in three sections: (1) the first section with two preliminary questions about the
respondent’s knowledge on IP; (2) the second section with the items (or indicators) of the
TAM’s constructs (or latent variables), PU, PEOU, A, BI, and the IDT characteristics, ADV
and CPL, including also the variable incentives with a total of 38 items; (3) the third part
with items designed to collect the interviewees’ demographic data such as age, educational
level, role in the farm, farming experience, and other variables that can influence the
adoption as reported in prior studies, for instance, farm type, farm size, and average
production level. Details about the final questionnaire items created for each of the research
model variables (latent and external variables) are described in the Appendix B.
The questionnaire was designed considering two important aspects: its validation and
reliability. According to Hair, Jr. et al. (2006) validity means the “extent to which a measure
or set of measures correctly represents the concept of study; the degree to which it is free
from any systematic or non-random error”.
Reliability indicates the “extent to which a variable or set of variables is consistent in what
it is intended to measure. If multiple measurements are taken, the reliable measures will all
be consistent in their values”. Reliability estimates that the item measures a single concept
or, in other words, evaluates the unidimensionality of a set of scale items. Validity is
concerned with how well the concept is defined by the measure(s), whereas reliability relates
to the consistency of the measure(s).
The most common used measure of reliability is internal consistency, which applies to the
consistency among the variables in a summated scale. The logics is that the individual items
of the scale should all be measuring the same construct and thus be highly intercorrelated.
Two diagnostic measures were used to assess internal consistency on the dataset. Firstly, one
relate to each separate item, including the item-to-total correlation and the inter-item
correlation; the parameter in this case is that the item-to-total correlations exceed 0.50 and
that the inter-item correlations exceed 0.30. The second diagnostic measure is related to the
entire scale. In this case, the consistency of the entire scale can be verified by the reliability
coefficient with Cronbach’s Alpha, one of the most applied reliability’s estimators. It ranges
from 0 to 1, with values of 0.60 to 0.70 deemed the lower limit of acceptability (Hair, Jr. et
al, 2006).
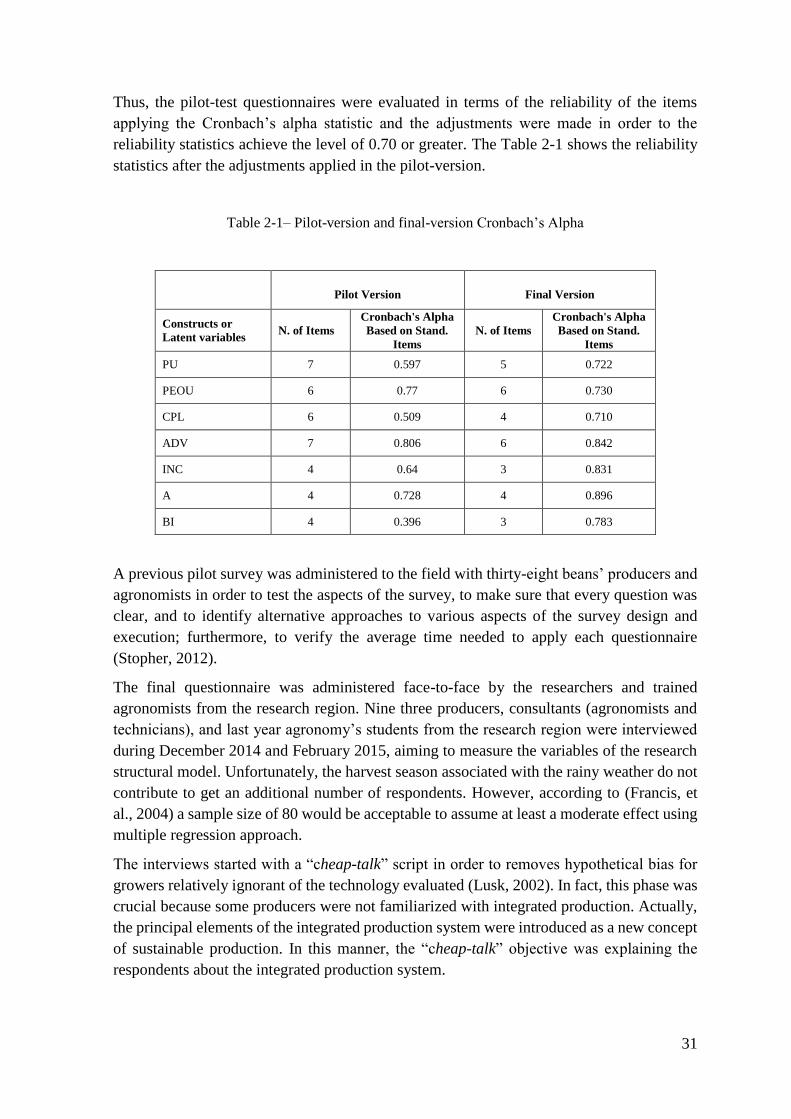
31
Thus, the pilot-test questionnaires were evaluated in terms of the reliability of the items
applying the Cronbach’s alpha statistic and the adjustments were made in order to the
reliability statistics achieve the level of 0.70 or greater. The Table 2-1 shows the reliability
statistics after the adjustments applied in the pilot-version.
Table 2-1– Pilot-version and final-version Cronbach’s Alpha
Pilot Version Final Version
Constructs or
Latent variables N. of Items
Cronbach's Alpha
Based on Stand.
Items
N. of Items
Cronbach's Alpha
Based on Stand.
Items
PU 7 0.597 5 0.722
PEOU 6 0.77 6 0.730
CPL 6 0.509 4 0.710
ADV 7 0.806 6 0.842
INC 4 0.64 3 0.831
A 4 0.728 4 0.896
BI 4 0.396 3 0.783
A previous pilot survey was administered to the field with thirty-eight beans’ producers and
agronomists in order to test the aspects of the survey, to make sure that every question was
clear, and to identify alternative approaches to various aspects of the survey design and
execution; furthermore, to verify the average time needed to apply each questionnaire
(Stopher, 2012).
The final questionnaire was administered face-to-face by the researchers and trained
agronomists from the research region. Nine three producers, consultants (agronomists and
technicians), and last year agronomy’s students from the research region were interviewed
during December 2014 and February 2015, aiming to measure the variables of the research
structural model. Unfortunately, the harvest season associated with the rainy weather do not
contribute to get an additional number of respondents. However, according to (Francis, et
al., 2004) a sample size of 80 would be acceptable to assume at least a moderate effect using
multiple regression approach.
The interviews started with a “cheap-talk” script in order to removes hypothetical bias for
growers relatively ignorant of the technology evaluated (Lusk, 2002). In fact, this phase was
crucial because some producers were not familiarized with integrated production. Actually,
the principal elements of the integrated production system were introduced as a new concept
of sustainable production. In this manner, the “cheap-talk” objective was explaining the
respondents about the integrated production system.

32
Davis (1989) suggests that 6 items for each perceptual variable would be adequate to achieve
acceptable reliability levels while maintaining adequate validity levels. Aubert, Schroeder
and Grimaudo (2012) have used 6 items per factor’s construct as an upper limit in order to
minimize the number of questions; as a lower limit, they have used three items to guarantee
the statistical procedures and give the flexibility to remove an item to improve reliability.
The items of the constructs were measured with seven-point scales having likely-unlikely
endpoints and the anchor points extremely, quite, slightly, and neither. This format is
identical to that used by other authors such as Davis et al. (1989); Silva A. M. (2005); Alves
da Costa Filho, Pires, & Costa Hernandez (2007); and Folorunso & Ogunseye (2008).
Fishbein & Ajzen (1975) also recommend using a bipolar scale that represents a probabilistic
rating of the concept, on scales such as likely-unlikely or agree-disagree, specially to
measure the concept "behavioral intention".
2.2.1.4 Statistical Procedures
The main purpose of the present study was to verify the intention to adopt IP by beans’
growers, viewed as a set of technologies. A confirmatory factor analysis (CFA) was used to
identify the relationship between the factors and their measurement variables, assuming that
some prior knowledge about the base structure of the latent variables already exists. It is a
procedure used to test hypotheses about the structure of a data set. In other words, the
confirmatory approach was applied to determine if the structural (or the path) model fit the
data.
To proceed with the CFA, we used the technique of structural equation modelling (SEM).
The Structural Equation Modelling (SEM) is the most used statistical technique to run TAM
models, according to prior researches. This technique provides the appropriate and most
efficient estimation for a series of separate multiple regression equations estimated
simultaneously. SEM is defined as “a family of statistical techniques which purpose is study
complex relationships among variables, where some of them can be hypothetical or
unobserved” (Kline, 2011).
SEM is a kind of multivariate analysis widely used for analysing latent variables such as
constructs developed from survey items. Some of the key assumptions of standard regression
analysis are violated: the endogenous variables which appear on the right hand side are
correlated with the residuals; and, least squares estimates are inconsistent (Mazzocchi,
2008). SEM is similar to multiple regressions but is used to analyse and calculate variance
explained in endogenous and exogenous latent variables (Adrian, Norwood, & Mask, 2005).
The advantage of using SEM is that two multivariate techniques, factor analysis and multiple
regression analysis, are combined in a single procedure. As result, this technique permits:
(1) estimating multiple and interrelated dependence relationships; (2) representing
unobserved concepts in these relationships and correct for measurements error in the
estimation process; (3) defining a model to explain the entire set of relationships (Hair, Jr.,
et al., 2006).

33
Two basic components characterize the SEM, according to Hair, Jr., et al. (2006): (a) the
structural model that is a path model which relates independent to dependent variables, even
when a dependent variable becomes an independent variable in other relationships; in other
words, the structural model represents the interrelationships of variables between constructs;
and (b) the measurement model that enables the analyst to use several variables or indicators
for a single independent or dependent variable.
In practice, the structural model relates the hypothesized model’s constructs known also as
latent variables that are concepts that can be represented by observable or measurable
variables. It is measured indirectly by examining consistency among multiple measured
variables or indicators.
In the latent construct, two components should be considered: (a) exogenous constructs that
are the latent, multi-item equivalent of independent variables; visually in the model,
exogenous constructs does not have any paths (one-headed arrows) from any other construct
or variable going into it; (b) endogenous constructs that are latent, multi-item equivalent to
dependent variables; visually in the model, endogenous constructs are represented by a path
to an endogenous construct from an exogenous construct (or from another endogenous
construct as well).
The relationship between constructs (or latent variables) is represented by the paths’
coefficients on the path diagram (Adrian, Norwood, & Mask, 2005). Path diagram is the
visual portrayal of the model that is more convenient to show the interrelationships between
variables. In a measurement sense, dependence relationships occur from constructs to
variables. In a structural sense, dependence relationships occur between constructs (Hair, Jr.,
et al., 2006).
On the path diagram, manifest variables are shown in square or rectangular boxes; latent
variables (and measurement errors) are shown through ovals or circles; causality
relationships are indicated through straight arrows; and, correlation without causality is
shown through a curved arrow (Mazzocchi, 2008).
The structural equation model was analysed using Analysis of Moment Structures (AMOS),
which simultaneously estimates the model, including latent and observed variables,
exogenous and endogenous variables, and the paths to these variables. The maximum
likelihood estimation (MLE) is the most common SEM estimation procedure since is more
efficient and unbiased for multivariate normality assumption.
The measurement model validity depends on goodness-of-fit (GOF) for the measurement
model and specific evidence of construct validity. GOF indicates how well the specified
model reproduces the covariance matrix among the indicator items, i.e., the similarity of the
observed and estimated covariance matrices. The closer the values of the estimated
covariance matrix and the actual observed covariance matrix, the better the model is said to
fit. Thus, the implied null hypothesis of SEM is that the observed sample and SEM estimated
covariance matrices are equal, meaning that the model fits perfectly.
34
Several statistical tests are used to determine how well the model fits to the data or the
goodness of fit (GOF) measures. The direct measure of how well the model specified by the
researcher reproduces the observed data is given by the most widely used absolute fit indices:
(1) χ2 test – this is the fundamental measure of fit; it quantifies the differences between the
observed and estimated covariance matrices (S - ∑k). To the extent that perfect fit is not the
case, the χ2 value increases (i.e., we look for low χ2 value). The probability that any observed
sample and SEM estimated covariance matrices are actually equal in a given population is
represented by the traditional p-value. In such case, smaller its value, the greater the chance
that observed sample and SEM estimated covariance matrices are not equal. Then, with SEM
the p-value for the χ2 test should not be small (statistically significant);
(2) GFI (goodness-of-fit index) – measures the goodness of fit between the hypothesized
model and the observed covariance matrix. The GFI was an early attempt to produce a fit
statistic that was less sensitive to sample size. The possible range of GFI values is 0-1, with
higher values indicating better fit (some authors propose the cut-off value of 0.9: ≥ 0.9);
(3) AGFI (adjusted goodness of fit index) – the same GFI proposal but considers the number
of indicators of each latent variable; the cut-off value is the same of GFI: ≥ 0.9;
(4) RMSR (root means of the square residual): an average of the residuals between individual
observed and estimated covariance and variance terms. The SRMR is the standardized
alternative to permit comparing fit across models. Lower RMSR and SRMR values represent
better fit and higher values represent worse fits. Sometimes theses indices are known as
badness-to-fit measures in which high values are indicative of poor fit. The average value of
SRMR is 0; a predicted covariance lower than the observed value results in a positive
residual while a predicted covariance larger than observed results in a negative residual.
Values below -4.0 or above 4.0 should be examined carefully.
(5) RMSEA (root mean square error of approximation) – indicates the discrepancy between
the hypothesized model and the population covariance matrix; avoids problems of sample
size. It is a useful measure to help the analysis of models with large sample (generally, more
than 500 respondents) or large number of variables. Lower RMSEA values indicate better
fit (below 0.1 for most acceptable models).
Besides the absolute fit indices, some incremental fit indices are also useful for the model
analysis. This class of indices permits to verify how well a specified model fits relative to
some alternative baseline model referred to as a null model, one that assumes all observed
variables are uncorrelated. Some of these indices are:
(1) NFI (normed fit index) – it is a ratio of the difference in the χ2 value for the fitted model
and a null model divided by the χ2 value for the null model; indicates the discrepancy
between the Chi-squared value of the hypothesized model and that of the null model. It
ranges between 0 and 1 and greater the value indicates better fit (cut-off value is 0.9: ≥ 0.9);
(2) CFI (comparative fit index) - it is derived from the NFI in an effort to include model
complexity in a fit measure. Indicates the discrepancy between the data and the hypothesized
model taking in account the problems of sample size; its interpretation is the same of NFI;

35
(3) TLI (Tucker Lewis Index) – it is one of the most often used indices together with CFI
and provide very similar results; higher value that approach 1 suggests a better fit than a
model with a lower value; and,
(4) RNI (relative non-centrality Index) – like the other incremental fit indices, higher value
represents better fit in a range between 0 and 1; RNI’s lower than 0.9 are usually not
associated with good fit.
Finally, when the focus is on comparison among a set of competing models, the parsimony
fit indices are indicated. Conceptually, these indices are similar to the notion of an adjusted
R2 in the sense they relate model fit to model complexity. Because of its foundation, these
indices are not useful in assessing the fit of a single model. The most widely applied
parsimony fit indices are the parsimony goodness-to-fit index (PGFI) and parsimony normed
fit index (PNFI). The value range between 0 and 1 and the model with a higher value is
preferable.
2.3 RESULTS AND DISCUSSION
2.3.1 Respondents’ and Farms’ Characteristics
The elicited SDC profile of the respondents shows that 86% of the respondents are male with
average age between 25-35 years representing 23,7% of the respondents. In terms of the role
of the respondent, 36,6% were owner (farmer), 34,4% other category, including last year
agronomy’s students, 10,8% agricultural technicians, 9,7% farm managers, and 8,6%
agronomist consultants. The average level of education of the respondents is agricultural
technicians (considering also the last year agronomy’s students in this same category).
Although the respondents’ experience with agriculture is around 15 years, the major part of
them has never heard about IP (77,4%). Only 22,6% of them have heard about IP. The self-
evaluation about IP knowledge indicates that this group has an average knowledge about IP,
with 5.6 points in a scale from 1 to 10.
Regarding the farms served by the respondents, the major part (69,9%) is dedicated to mixed
crops, followed by 28% of farms dedicated to crop and livestock, and only 2,2% of the farms
served by the respondents are specialized in a single crop. The following municipalities were
covered by the research: Unaí/MG, Paracatú/MG, Cristalina/GO, Brasília/DF, Pires do
Rio/GO, Ipameri/GO, and Silvania/GO. Except the respondents from Unaí/MG, who in the
major part was the last year agronomy's students, the respondents from the other localities
were basically producers and agronomists. Farm size, average area destined to beans’ crop,
and average productivity were eliminated from the dataset due to most of the respondents do
not have the information or preferred not answering.
2.3.2 Respondents’ perceptions toward adopting Integrated Production

36
Table 2-2– Item’s descriptive statistics
Descriptive Statistics - Items Mean Std.
Deviation
Perceived Usefulness (PU)
Benefits to environment 6.0 1.1652
Improve agronomic efficiency 5.7 1.1608
Useful production system 5.6 1.4254
Improve production control 5.5 1.2473
Reduce costs with inputs 5.2 1.6807
Perceived Ease of Use (PEOU)
Easy to learn and apply IP practices 5.7 1.2783
Easy to comprehend and apply the norms 5.3 1.4263
Easy to apply with available bio inputs 4.7 1.7014
Easy to produce beans by using IP 4.6 1.5631
Easy to apply with available services 4.5 1.6189
Can apply without an agronomist full time 3.6 2.1281
Complexity (CPL)
IPM application 5.1 1.4313
Agronomic records and Documentation 4.7 1.4962
Operational fieldwork team 4.4 1.7708
Mandatory regulations 4.3 1.5135
Relative Advantages (ADV)
Bring benefits to employees 6.1 1.1571
Increase consumer confidence 5.9 1.4284
Optimize crop control 5.6 1.4664
Quality of beans better than conventional 5.5 1.6058
Amplify market access 5.3 1.6252
Increase production value by certification 5.3 1.6680
Incentives (INC)
Receiving some finantial subsidy 5.4 1.5964
Receiving some environmental subsidy 5.5 1.5640
Receiving price premium 6.0 1.3388
Attitude (A)
Overall opinion of the IP 5.7 1.0793
The decision of using IP (pos-neg) 5.7 1.1261
The choice of using IP is (adv-disadv) 5.6 1.2110
The idea of using IP on my farm (like-dislike) 5.5 1.2029
Behavioral Intention (BI)
I would recommend IP for other growers 5.4 1.4754
I would adopt if my neighbours adopt 5.2 1.5785
I have the intention of using IP next 5 years 5.0 1.6010

37
This study used SEM to describe the effects of perception of usefulness, perception of ease
of use, perception of complexity in using IP, perception of IP relative advantages compared
to conventional system, and perception of a net benefit on the intention to adopt integrated
production to produce common beans. The original items used for the latent constructs are
illustrated in the Tables 2-2 that brings the item’s descriptive statistics.
Overall, the respondents demonstrate a somewhat favourable attitude toward integrated
production adoption, since all the items of the Attitude construct have means between 5 and
6, in a scale of 7 points where 4 indicates a neutral attitude. The construct behavioural
intention has similar results, i.e., it is somewhat likely that respondents would adopt IP to
produce common beans in the next 5 years. Furthermore, the respondents have a positive
attitude in adopting IP whether their neighbours adopt. It is somewhat likely they would
recommend IP for other growers. One can infer that the success of IP adoption depends on
the cohesion of the growers.
The average perception of the respondents about the IP usefulness was somewhat positive.
However, there is a quite positive perception of the respondents regarding the environmental
benefits of the IP in comparison to the conventional system of production. They also
perceived more benefits to employees if they adopt IP as their production system, reinforcing
one of the principle of IP, the social responsibility.
Additionally, the others relative advantages have means between 5-6 points indicating that
respondents perceive IP as a bundle of technologies that brings somewhat positive benefits
in comparison to the conventional system. The positive perception of the item “increase
consumers’ confidence” is slightly higher than the others indicating that respondents believe
that they using IP can be a differential in the market.
The PEOU and the CPL constructs result the most negative perceptions by the respondents.
Moreover, only two items of PEOU indicate a somewhat positive perception; those related
to the facility of learning and applying IP practices, and the comprehension and norms'
application. Since these items are related to training programs and rules that have to be
fulfilled, the respondents could have control on them.
When elements that they cannot have control such as the market availability of bio inputs or
availability of specific services to support the IP implementation, the respondents show a
certain uncertainty indicating the neutral point (4) of the 7 points scale.
The respondents show a somewhat negative perception when they are asked if could be
possible applying IP without an agronomist full time. One can infer that the respondents
perceive some level of difficulty to use IP without a good technical assistance. This result is
convergent to the known fragility of the public extension services available to the producers
and the technical capacity of the local technicians in IP issues.
The respondents have uncertainty in some items regarding the complexity construct such as
agronomic records and documentation, formation of a good operation team work, and
accomplishment of mandatory regulations. There is no novelty in these questions. One of
the most problematic questions in terms of farm management is still a good and efficient
internal information system, and workforce; moreover, the compliance of several mandatory

38
regulations in diverse fields such as financial, environmental, legal, fiscal, etc. The main IP
practice, the IPM, is perceived as somewhat likely to be applied in farm.
Finally, regarding the incentives, as expected, the respondents "mostly agree" in receiving a
premium price to adopt IP. They agree somewhat in receiving others subsides such as
financial or environmental incentives, but less important than the premium price.
important emphasize that the analyses above were realized based on the complete model
(then, most complex model) with all variables originally proposed; this analyses do not
confirm the validity of the model that is described in the next topic.
2.3.3 Measure properties
The original proposed model had the objective of explaining the adoption process by using
elements of both theoretical models, TAM and IDT, as recommend by prior empirical studies
(Aubert, Schroeder and Grimaudo, 2012; Lee, Hsieh and Hsu, 2011). The expectation was
that the integration of both theoretical model could provide good results in terms of the
behavioural attitudes towards IP, and the perceived characteristics of IP as an innovation,
particularly with respect to IP’s relative advantages compared to conventional production,
and its complexity as a production system.
However, the model has become very complex, requiring a large number of respondents so
it could be analysed according to the precepts of the SEM. Unfortunately, we faced some
problems to gathering a sufficient number of respondents, to answer the interviews on farms
in Brazil. Actually, the number of unknown parameters was too many compared to the
available observations (due to the non-intentional reduced number of the sample). Thus, the
model resulted underidentified, then cannot be processed. Thus, after the adjustments
applied based on the SEM technique, the final model tested became the original simplified
model proposed by Davis (1989). One can conclude that in terms of applicability, this nature
of models requires a large sample to works adequately.
According to Mazzocchi (2008), in such cases, all the non-significant components of the
model should be removed, and when is possible, some other explanatory variables should be
added. How this latter option was not possible, we decided to test only the original TAM
model, without the two IDT constructs, the external variables, and some observable variables
from TAM constructs that were not significant. Then, the Table 2-3 shows the remaining
items after the adjustments that comprise the modified model that is illustrated in the Figure
2-3. The hypotheses considered in the modified research model, its relationships and path
construction are:
H1 (PU BI): Perceived usefulness has a positive effect on behavioral intention to use
integrated production system.
H2 (PU A): Perceived usefulness has a positive effect on attitude to use integrated
production system.

39
H3 (PEOU A): Perceived ease of use has a positive effect on attitude to use integrated
production system.
H4 (PEOU PU): Perceived ease of use has a positive effect on perceived usefulness of
the integrated production system.
H5 (A BI): Attitude toward usage has a positive effect on intention to use integrated
production system.
Table 2-3– Remaining items of the tested model
Cod. Constructs / Items
Perceived Usefulness (PU)
PU.2 Using IP in my farm the agronomic effectiveness would …
(Extremely unlikely/Extremely likely)
PU.3 Using IP in my farm would decrease the costs with inputs ...
(Extremely unlikely/Extremely likely)
PU.5 I believe IP can bring more benefits to the environment than the conventional ...
(Extremely unlikely/Extremely likely)
Perceived Ease of Use (PEOU)
PEOU.1 It will be easy for me to learn and apply most of the IP practices.
(Extremely unlikely/Extremely likely)
PEOU.2 It will be easy for me understand and apply the IP standards for common beans' production.
(Extremely unlikely/Extremely likely)
PEOU.4 It will be easy for me to use IP with the present biological control agents and other IPM supplies
available in my region. (Extremely unlikely/Extremely likely)
PEOU.6 I would find IP easy to use for producing common beans.
(Extremely unlikely/Extremely likely)
Attitude Toward Using (A)
A.1 I would say that my overall opinion of IP system is
(Extremely unfavorable/Extremely favorable).
A.2 I (extremely dislike/extremely like) the idea of using IP in my farm.
A.4 Using IP system in my farm is an (extremely negative/extremely positive) decision.
Behavioural Intention of Use (BI)
BI.1 I intend to use IP as my farming system. (Extremely unlikely/Extremely likely)
BI.2 I would recommend the IP system adoption for other farmers in my region.
(Extremely unlikely/Extremely likely)
BI.3 I would also adopt IP if the neighbouring farmers adopt.
(Extremely unlikely/Extremely likely)
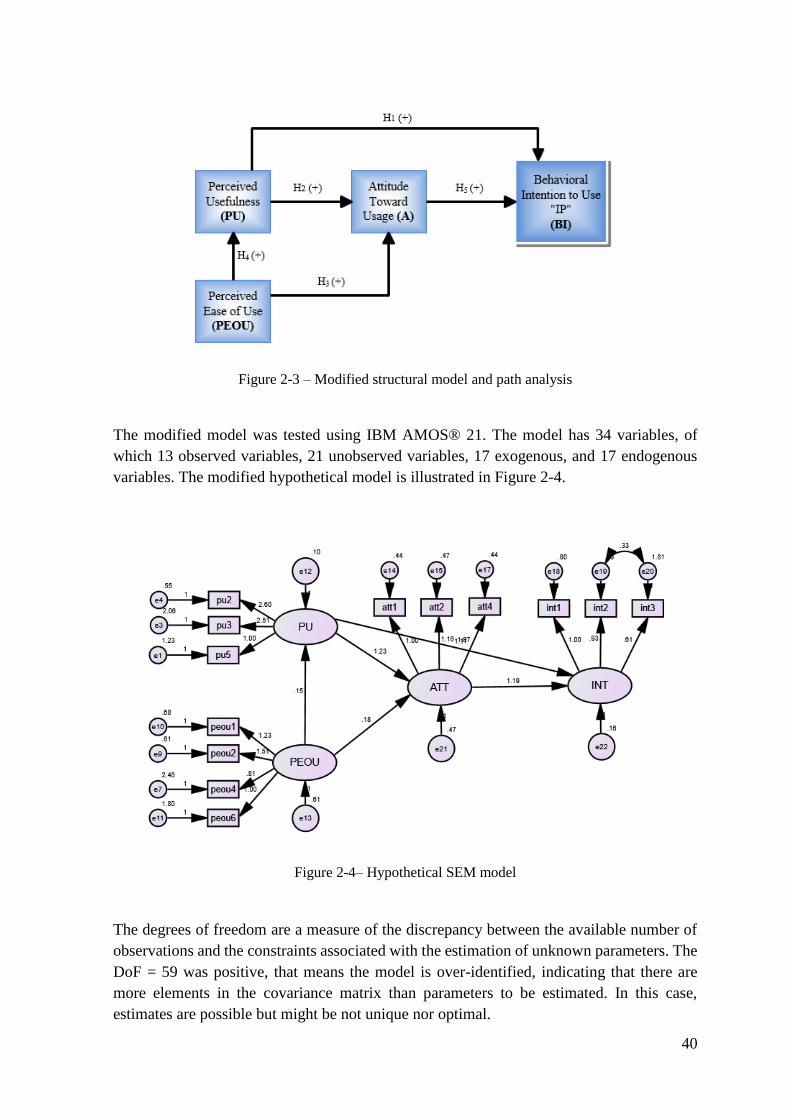
40
Figure 2-3 – Modified structural model and path analysis
The modified model was tested using IBM AMOS® 21. The model has 34 variables, of
which 13 observed variables, 21 unobserved variables, 17 exogenous, and 17 endogenous
variables. The modified hypothetical model is illustrated in Figure 2-4.
Figure 2-4– Hypothetical SEM model
The degrees of freedom are a measure of the discrepancy between the available number of
observations and the constraints associated with the estimation of unknown parameters. The
DoF = 59 was positive, that means the model is over-identified, indicating that there are
more elements in the covariance matrix than parameters to be estimated. In this case,
estimates are possible but might be not unique nor optimal.
41
The Chi-square statistic (59.694) is high and not significant (p-value 0.45). It means that
there is not discrepancy between the observed covariance matrix and the estimated one.
Considering that the implied null hypothesis of SEM is that the observed sample and SEM
estimated covariance matrices are equal, these results are in the correct direction, but
additional indices must be verified to support this general impression of the goodness of fit
since the Chi-square is sample size sensitive.
Then, overall, model fit and measurement model fit assessments were considered in the
model fit examination. The recommendation is using three to four fit indices and at least one
incremental and one absolute index, in addition to the χ2 value and the associated degrees of
freedom. Commonly, a model reporting the χ2 value and degrees of freedom, the CFI, and
the RMSEA will often provide sufficient unique information to evaluate a model (Hair, Jr.,
et al., 2006). The table 2-4 brings the model fit summary.
Table 2-4- Model fit summary.
Measures Estimated
Model
Acceptable
values
Chi-square 59.694 ↓ value
DoF 59 ***
p-value .45 ↑ value
GFI .912 ≥ .90
CFI .998 ≥ .90
RMSEA .011 < .08
CDMIN/DoF 1.012 1 - 5
From the model fit summary statistics is possible proceed with the model evaluation.
Analysing the values of GFI = .912, CFI = 0.998 and RMSEA = 0.11, one can conclude that
the model fits relatively well the sample data.
The GFI measures the goodness of fit between the hypothesized model and the observed
covariance matrix. The CFI is derived from the NFI (normed fit index) that indicates the
discrepancy between the data and the hypothesized model. Both GFI and CFI was an early
attempt to produce a fit statistic that was less sensitive to sample size.
RMSEA, in turn, indicates the discrepancy between the hypothesized model and the
population covariance matrix, although it is more used to avoids problems of large sample
size or large number of variables.
Finally, the ratio between the χ2 value and degree of freedom, indicated by CDMIN/DoF,
resulted an acceptable value.
Additionally, the standardized residual covariances matrix can be used in an ultimate
analysis. According to (Byrne, 2001) value less than 2,58 suggest a good consistency
between the hypothetical and the data. There is no value greater than 2,58, as shown in Table
2-5.

42
Table 2-5- Standardized Residual Covariances Matrix
peou6 pu3 int3 int2 int1 att4 att2 att1 peou1 peou2 peou4 pu2 pu5
peou6 .000
pu3 1.546 .000
int3 .524 .458 .000
int2 1.719 -.355 .000 .000
int1 1.844 .066 -.439 .027 .000
att4 1.284 -.401 -.070 -.237 -.039 .000
att2 1.968 .809 .197 -.033 .167 .067 .000
att1 1.480 -.635 .535 .194 -.102 .157 -.214 .000
peou1 -.309 .167 -1.294 -.329 .106 -.930 .029 -.659 .000
peou2 -.153 .510 -.961 -.323 .179 -.531 .195 -.014 .112 .000
peou4 .603 1.407 .957 -.019 -1.147 .187 -.010 -.225 .184 -.223 .000
pu2 .562 .044 .364 .159 -.152 .060 -.531 -.087 -.643 .012 -.935 .000
pu5 -.082 -.347 .578 .311 -.103 1.497 .244 2.382 -.475 -.503 1.201 .063 .00
2.3.4 Hypotheses test
The table 2-6 brings the structural model and hypothesis testing. The results indicate that
although the good fit measures verified to the model, the hypotheses test show that only two
constructs were statistically significant; the others constructs do not impact positively on
behavioural intention.
Table 2-6– Structural Model and Hypothesis testing
Estimate S.E. C.R. P
PU <--- PEOU .153 .091 1.682 .093NS
ATT <--- PU 1.229 .611 2.010 .044*
ATT <--- PEOU .184 .147 1.255 .210 NS
INT <--- ATT 1.192 .210 5.681 ***
INT <--- PU 1.108 .642 1.727 .084 NS
pu5 <--- PU 1.000
pu2 <--- PU 2.596 1.138 2.281 .023*
peou4 <--- PEOU .814 .285 2.852 .004**
peou2 <--- PEOU 1.510 .353 4.284 ***
peou1 <--- PEOU 1.235 .287 4.307 ***
int1 <--- INT 1.000
int2 <--- INT .928 .104 8.924 ***
int3 <--- INT .613 .126 4.856 ***
pu3 <--- PU 2.509 1.144 2.193 .028*
peou6 <--- PEOU 1.000
att2 <--- ATT 1.162 .143 8.151 ***
att1 <--- ATT 1.000
att4 <--- ATT 1.074 .134 8.037 *** NS/not significantly different from zero at the 0.05 level (two-tailed).
*/significantly different from zero at the 0.05 level (two-tailed).
**/ significantly different from zero at the 0.01 level (two-tailed).
****/ significantly different from zero at the 0.001 level (two-tailed).
43
H1 (PU BI): Perceived usefulness has a positive effect on behavioral intention to use
integrated production system. This hypothesis is positive and not significant. Probably, the
respondents do not believe that simply using the IP they would enhance the farm
performance. One explanation could be the level of technology used in the farms, in the
research regions that is very high. Actually, PU does not have a direct effect in intention, but
an indirect effect by Attitude. It means that other attitudinal factors besides IP usefulness are
important to make growers to adopt IP.
H2 (PU A): Perceived usefulness has a positive effect on attitude to use integrated
production system. This hypothesis is positive and significant at the 0.05 level. Then, the
respondents who consider the IP useful for their current farm's production conditions, at the
moment of the research, they have a higher positive attitude toward adopting IP.
H3 (PEOU A): Perceived ease of use has a positive effect on attitude to use integrated
production system. This hypothesis is positive and not significant. Then, growers do not
believe they would be free from effort if they adopt IP as their production system.
H4 (PEOU PU): Perceived ease of use has a positive effect on perceived usefulness of
the integrated production system. Similarly, this hypothesis is positive and not significant.
The usefulness of IP seems not be influenced by the level of facility or difficulty in applying
some IP practices. However, the frequent support of an agronomist to conduct the IP seems
to be the main factor to encourage growers in adopting IP.
H5 (A BI): Attitude toward usage has a positive effect on intention to use integrated
production system. Finally, this hypothesis was confirmed since it is positive and highly
significant. This result confirms one of the basic premises of TPB. Then, growers who have
positive attitudes toward IP are more likely to adopt IP since they have a higher intention in
performing this behaviour.
The comprehension of this results can be improved by analysing the standardized regression
weights presented in the table 2-7. Standardized weights can be interpreted like correlations,
but they assume causation.
The respondents perceive the factor “pu2” as the most important to measure perceived
usefulness. They consider IP as a good technology to improve the agronomic effectiveness
in the farm since due to the use of good agricultural practices and application of specific
standards of production. The second most important perception is about cost reduction
specially with inputs, if they use IP (“pu3”).
In terms of perceived ease of use, the most important factor to measure this construct is the
fact the respondents believe that would be easy for them understand and apply the IP
standards for common beans' production (“peou2). Similarly, to learn and apply most of the
IP practices (“peou1”) is also an important measurement of the PEOU construct.
The factors to measure attitude toward the behaviour have almost the same level of
importance in the construct measurement. The respondents’ overall opinion of IP, the
respondents’ idea of using IP, and the respondents’ decision of using IP are all important

44
measurements. The less important factor to measure behavioural intention is (“int3”) the
conditioned adoption to the neighbouring farmer’s adoption.
Table 2-7– Standardized Regression Weights
Estimate Estimate
PU <--- PEOU 0.351 peou4 <--- PEOU 0.377
ATT <--- PU 0.498 peou2 <--- PEOU 0.834
ATT <--- PEOU 0.171 peou1 <--- PEOU 0.761
INT <--- ATT 0.762 peou6 <--- PEOU 0.504
INT <--- PU 0.287 pu5 <--- PU 0.294
att2 <--- ATT 0.818 pu2 <--- PU 0.767
att1 <--- ATT 0.785 pu3 <--- PU 0.512
att4 <--- ATT 0.807
int1 <--- INT 0.827
int2 <--- INT 0.833
int3 <--- INT 0.514

45
2.4 CONCLUSIONS AND RECOMMENDATIONS
The present study sought evidencing the intention to adopt integrated production (IP),
viewed as a bundle of technologies by beans’ growers in one the most important areas of
beans’ production in the Brazilian Central Region where the conventional farming still
dominates. Conventional farming generates a conflict between profitability of the activity,
the social benefits of secure food production, and the environmental concerns, motivated by
the indiscriminate use of pesticides, fertilizer, and natural resources (especially water and
land).
IP can conciliate economic results with social concerns and environmental protection
questions. IP provides opportunities for creating significant efficiencies in farming business
and contributes to the environmental sustainability of farming practices as well as the food
quality improvement. Thus, the fact that IP adoption remains relatively low, despite the
positive characteristics and government’s investment, creates an enigma. Curiously, this
same situation is evidence by Sterns & Codron (2001). According to the authors, although
many decades of research and favourable government policies and an ever-growing concern
in the general population about pesticides residues, European and North American farmers
have not embraced IP practices (integrated pest management – IPM or integrated crop
management – ICM) on large scale as their farm system. An estimate from 2000 cited by the
same authors indicates that true IPM, as principal practice of IP, was practiced on only 4 to
8 per cent of the U.S. crop acreage, while in some European regions the adoption rate was
much higher than this in that period, especially for some commodities.
Understanding the factors that influence the adoption of IP is critical for developing target
policies or initiatives that support the adoption of sustainable agricultural practices aiming
the environment protection and the human’s health. This study sought to cover part of the
gap that exists in the literature on the IP adoption in the Brazilian context.
Prior researchers on the adoption of sustainable technologies in the agricultural field have
focused on determining the economic impact of individual farm or owner characteristics
with little attention to the diverse factors and complex interactions that characterize an
adoption decision.
This study significantly advances our understanding of IP adoption by drawing on
established adoption theory and focusing on individual perceptions as important drivers of
the adoption decision process. Our findings offer rich elements to suggest a new approach
of technology transfer aiming the process of IP adoption, taking in account the actors'
perceptions toward the studied technology. The findings suggest also opportunities for
development of new solutions by some key-agents of the production chain to support the IP
usage.
For IP adoption to occur the producer has to perceive the technology or bundle of
technologies as useful and ease to use. This study was based on the Technology Acceptance
Model (TAM) that permitted investigating this issues on this bases. The proposed model
permitted to integrate the individuals' perceptions of the IP with farm and the user’s

46
characteristics. The findings can contribute with several important implications for the
research community, policy makers, and agribusiness stakeholders in terms of economic,
social, technical, environmental, and market factors.
The targeted region of the research has an expressive bean’s production with growers and
consultants perceiving positively, in a certain extent, the IP as a useful solution to solve part
of their problems of production, especially environmental and social issues. IP is useful to
provide more benefits to employees, reinforcing one of the principles of IP, the social
responsibility. Thus, one can conclude that an additional effort must be done in the region to
provide more information about IP. For instance, one can suggest the use of the mass media
channels that are more effective in creating knowledge of innovations, associated to
interpersonal channels that are more effective in forming and changing attitudes toward a
new idea, and thus in influencing the decision to adopt or reject a new idea. If users and
those who indicate the technology usage do not have enough knowledges about IP, then the
IP cannot be developed as expected among that community of farmers.
According to the model, perceived usefulness has a positive impact on behavioural intention
to use integrated production, as expected. So, more knowledge, and more information about
IP, more likely the users' adoption since they can comprehend better the pros and cons of IP,
and whether this technology is adequate for their farms conditions and their objectives.
However, based on the model, the process of adoption depends on also the ease of use. Thus,
some additional factors related to the ease of use can be contributing to the slow process of
IP's adoption among the studied community.
From the technical point of view, the respondents, in a certain extent, consider easy to learn
and to apply mostly IP practices as well as put in practice the IP standards. This is important
information since IP as a bundle of sustainable practices cannot be considered divisible due
to its concepts and principles in the context of a certification scheme (IOBC, 2004). Thus,
producers have to adopt the entire technology or not at all.
Considering the complexity of some IP practices, and the various rules that have to be
fulfilled, it is crucial to promote new training courses in the region to motivate the producers
and give to them confidence to implement IP in their farms. For instance, the main IP
practice, the IPM, is perceived as somewhat likely to be applied in farms. In fact, this practice
has been promoted in that region with several training events. Because of that, they feel
almost prepared in relation to this practice more than the others one. But it is an area that
needs constant training and updating.
Agronomic records and documentation, training a good operation team work represent some
constraints by the interviewed actors. There is no novelty in these questions. One of the most
problematic questions in terms of farm management is still a good and efficient information
system, and availability of trained workforce. Seeking to solve the first drawback, the
suggestion is creating new tools and applications for electronic devices to facilitate and bring
agility to the process of decision making. For instance, to make available electronic sheets
to facilitate the process of agronomic records, and applications to help diagnoses and
monitoring. It is important consider the scientific nature of IP with constant evolution of the

47
biological, entomological and ecological issues; this characteristic difficult the development
of generic guidelines that can be readily applied to the highly site-specific nature of on-farm
situations (Sterns & Codron, 2001). The second factor, a trained workforce team, can be
solved with intensive and frequent training events aiming to create specific competences
among the work team.
These strategies could be realized with the partnership with key organizations such as
EMBRAPA, EMATER, SENAR, SEBRAE and others. It is vital to Involve the actors
responsible to technical support is to improve their knowledge about IP practice and to
promote the experience exchange among the experts. This suggestion can be reinforced by
the fact that one of the most negative perception was related to the technical support. The
respondents perceive that could be difficulty to use IP without an intensive technical
assistance. This result is convergent to the known fragility of the public extension services
available to the producers and the technical capacity of the local technicians in IP issues.
If on one hand, the IP produce could be a differential to the market, the respondents perceived
some problems related to the market, principally the market of biological control products.
There is no certain about the availability of alternative products and specific services to
support the IP implementation.
Moreover, the compliance of several mandatory regulations in diverse fields such as
financial, environmental, legal, fiscal, and so on, is another factor that influence the process
of IP adoption. In this case, it is fundamental to promote discussions with the public
authorities to find solutions to reduce the legal bureaucracy, and to create some legal
advantages for those who implement IP as a sustainable production system.
By the way, regarding the incentives, as expected, the respondents would appreciate
receiving a premium price and other subsides to adopt IP, but this is not a decisive condition
to adopt IP. The premium price is an incentive to adopt IP as well as the perception that
consumers could be more confident toward the certified beans from IP production. Sterns &
Codron (2001) highlight that the lack of clear financial incentives for farmers to adopt IP
practices, particularly in terms of price premiums for IP products and cost savings in
production (lower chemical costs are often overwhelmed by higher monitoring costs and
reductions in marketable production). The same authors state that from the grower’s
perspective, the incentives for IP adoption have been mostly negative in terms of increased
complexity, risk and costs associated with IP system. Souza Filho H. M., Buainain, Jardim
da Silveira, & Vinholis (2011) mention that the lack of resources and low level of producer`s
capitalization are the main barrier for familiar producers to adopt sustainable practices in
Brazil.
Overall, the respondents have the intention to use IP and would recommend IP for other
farmers; moreover, they demonstrate a positive attitude in adopting IP whether their
neighbours adopt. The aggregate adoption is fundamental to the success of IP dissemination
in the long run. When enough individuals have adopted an innovation at the point that the
innovation’s rate of adoption becomes self-sustaining, we have a final decisive concept
diffusion, the final objective of the Brazilian government.
48
In an ultimate analysis, growers will adopt IP when it is in their economic interest to do so,
either because IP increases their net financial returns (as compared to other production
systems) or maintains that return but with other desired, non-monetary benefits.
As recommendation, we suggest further studies to verify the intention of IP adoption by
single crop versus mixed crops versus crop and livestock. The complexity of management
in this latter situation could influence negatively the intention of IP adoption. Additionally,
further studies to verify the intention of IP adoption in different levels of farm size is also
indicated. Considering that farms in Brazil have huge land extensions, could be more
difficult to convince producers and/or their consultants in adopting IP; IP requires an
intensive presence of technical support and a more complex information system to provide
the agronomic records and documentation as foreseen by the IP standards.
49
3 CONSUMER PREFERENCES AND WILLINGNESS-TO-PAY FOR
INTEGRATED PRODUCTION (IP) CERTIFICATION ON COMMON BEANS:
AN EX-ANTE ANALYSIS.
Abstract
Food choice in Brazil is not dictated simply consumer preferences or habits, but much more by the
production and food supply systems. Integrated Production (IP), as a sustainable production system,
has been applied in Brazil since 1998/99 as a voluntary certification scheme aiming to contribute for
reducing the negative environmental impacts of intensive production areas, and to improve the
quality of beans produced in compliance with minimum standards of production. Economic and
market analysis to permit an adequate and profound understanding of the likely response of potential
buyers and competitors regarding this kind of certified product is fundamental, especially when them
can result a premium price. Thus, the objective of this study is examining the consumer’s perception
of IP label in hypothetical beans marketed at supermarket in Goiânia (GO) - Brazil, and estimate
consumer WTP for the certified beans. This study can also help the process of structuring the IP
adoption at the farm level providing producers with information about the consumers’ behavior
toward certified beans. The data was collected by an indirect survey technique on a sample of 160
consumers. The discrete choice analysis was applied to elicit consumer’s preferences and
willingness-to-pay for labeled beans. The selected beans’ attributes selected to apply the choice
experiment were: label (labeled vs. conventional), price (3 levels), and brand (preferred vs. fictitious).
Multinomial Logit and Mixed Logit models were used to analyze the data. The findings indicate that
consumers are label-sensitive and are willing to pay a premium price for IP certified beans. There
seems to be an unmet demand for safe and sustainable food products since the consumers apparently
prefer the certified alternative, even if the case the brand is unknown and the price is higher.
Keywords: Integrated Production, stated preferences, consumer preference, credence attributes,
willingness-to-pay, common beans.
3.1 INTRODUCTION
Consumers have been demanded products with an increasingly wide array of attributes with
differentiation claims including factors related to experiential eating quality as well as
attributes related to environmental conservation, and public health, especially after the food-
safety events publicized in recent decades.
Consumers have perceived health related attributes as the most significant motives to buy
sustainable and safe food. In many countries, consumers are willing to pay higher prices to
minimize the perceived direct and societal risk associated with pesticides residues in food,
generally linked to conventional food production. Incidentally, attributes related to
production methods can impact the purchase decision across consumer in different ways due
to production methods evoke several attributes related to different concerns, for instance,
environment, and certification criteria.
50
The difficulty for consumers, regarding food-safety or environmental aspects of agricultural
products, is that they are faced to credence attributes that are difficult to ascertain directly
by them at any stage of purchase, even after consumption of the food; many of this kind of
products fall into this category.
Because of that, credence goods require a judgement or a certification by an authority figure
such as a government agency or private bodies that consumers trust to lend information on
credence attributes (Moser, Raffaelli, & McFadden, Consumer preferences for fruit and
vegetables with credence-based attributes: a review, 2011). Additionally, in general,
credence goods result in consumers relying on aspects such as brands, labels, and perceptions
(Shepherd & Saghaian, 2008).
In order to attend this new consumers’ profile, private industries have invested more in
branding programs, while national governments and other organizations have developed and
coordinated public certification schemes with the scope of addressing asymmetric
information in consumer agro-products market, and/or communicating and promoting
sustainable and safe food characteristics, as well.
However, there are many types of certification schemes in agribusiness sector, with different
interests. Depending on the type of them, the target public will be different. There are those
that are more addressed to other businesses (B2B); others addressed to consumers (B2C),
and a third type with double purpose, i.e., aiming both businesses and final consumers.
Business-to-Business (B2B) schemes have, normally, attention on the production sphere, on
the relationship between supplier-client; they aim to minimize the quality uncertainties
within the supply chain. Moreover, the label of this type of certification serves as quality
signals to reduce transaction costs and liability risks. Business-to-Consumer (B2C) schemes,
on the other hand, are addressed to final consumer. Typically, they are associated to a
distinctive signal (label) to differentiate the products produced by certified farms and firms,
and help consumers to identify the inherent credence attributes of the products. B2C
represents the majority of certification schemes in Europe (Gawron & Theuvsen, 2009).
That said, in the scope of this study we have chosen the standard for Integrated Production
(IP) system, according to the International Organization for Biological and Integrated
Control (IOBC), as study object. IP standard covers ecological, ethical and social aspects of
agriculture production as well as those related to food quality and safety. Therefore, credence
attributes are extremely related to IP produce. In Europe, IP standards may be designed at
the national, regional, or local level so that they can be adapted to particular farming systems
and specific environmental conditions (European Commission, 2015).
IP is a concept of sustainable agriculture that integrates natural resources and regulation
mechanisms into farming activities to replace the most possible polluting inputs where
agronomic practices are applied taking into account the protection of health of both farmers
and consumers and of the environment (IOBC, 2004). This production system has been
applied, voluntarily, in Europe, since 1990’s, for instance, to address environmental and
health concerns by reducing the net chemical pesticide inputs to agriculture, and improves
food quality and safety.
51
Since 2014, to comply with the Directive 2009/128/EC that establishes a framework to
achieve a sustainable use of pesticides by reducing the risks and impacts of pesticide use on
human health and the environment, the use of integrated pest management and other
alternatives approaches or techniques such as non-chemical alternatives to pesticides have
been prioritized. In a certain manner, IP became compulsory (European Parliament, 2009).
Although, normally, IP standard falls in the B2B category since is targeted to guaranteeing
quality and food safety within the supply chain, it could be also a B2C scheme if we consider
using a distinctive signal such as the IP certification label for communicating to consumers
about the quality attributes inherent to the IP produce.
IP produce are not only perceived by some as safer for consumption, but also reduce the
impact on environment, may protect biodiversity and/or reduce greenhouse gas emissions
(Moser, Raffaelli, & McFadden, Consumer preferences for fruit and vegetables with
credence-based attributes: a review, 2011). Thus, whatever strategy chosen to communicate
the quality attributes of IP produce the challenge is equally great, because we are treating
with credence attributes.
In the Emilia-Romagna (ER) Region, Italy, for instance, another way for communicating the
differentiated quality of IP produce was applied. The Regional public administration created
the collective brand “Qualità Controllata”, specific for this purpose. The use of this brand
is allowed for all stakeholders that are in compliance with IP standards. The brand increases
the visibility of the IP produce, ensuring consumers that those foods were obtained through
the techniques of IP, then, respecting the environment and health aspects (Regione Emilia-
Romagna, 2012).
In Brazil, the application of this kind of certification schemes is relatively new. IP has been
applied since 1998/99 as a voluntary certification scheme. The first experience was with
fruits, specifically with apple crops (Andrigueto, et al., 2009); the IP legal framework for
fruits is represented by the Normative Instruction IN/MAPA n. 20/2001. Later, in 2010, the
new IN/MAPA n. 27/2010 extends the legal framework for the other crops and animal
production, as well (BRASIL, 2015).
The IP label is called “Brasil Certificado – Agricultura de Qualidade” (Certified Brazil –
Agriculture of Quality), and aims to contributing for an appropriately communication toward
consumers, evoking the most important credence attributes intrinsic to IP produce such as
“sustainably produced” and “safe food” (figure 3-1).
Figure 3-1– Brazilian logo for Integrated Production produce.
52
The strategy of the Brazilian Ministry of Agriculture is a little bit different when compared
to Italy, for instance, because IP standard are being treated as B2B/B2C scheme, i.e., the
addressees of the certificates can be either other businesses within the supply chain or final
consumers. Thus, it becomes even more important studying the consumers’ perception
toward IP produce. Moreover, food choice in Brazil is not dictated simply consumer
preferences or habits, but much more by the production system and food supply system
(BRASIL, 2005).
The two basic objectives of IP certification in Brazil are: (1) on the production side, IP has
been promoted as strategy for reducing the negative impacts of intensive production of
beans4 in the irrigated areas of the Brazilian central region, and also to improve the quality
of beans produced (Barbosa, et al., 2009); (2) on the consumer side, improving quality and
food safety by guaranteeing compliance with minimum standards of production (BRASIL,
2015).
According to the Brazilian Agrochemical Industry Association (ANDEF), the largest agrochemicals
market in the world is the Brazilian one. However, a research conducted by Kleffmann Group to
ANDEF showed that in term of efficiency of pesticides use, the country is one of the most efficient
when compared to other countries. For instance, while the Brazilian agriculture generates, on
average, 142 Kg of harvested food per each dollar invested in agrochemicals, the U.S. agriculture
generates 94 Kg/dollar, Europe 51 Kg/dollar, and Japan only 8 Kg/dollar invested in agrochemicals
(ANDEF, 2015).
However, this apparent technical efficiency of use of pesticides, suggested by these results, does not
reduce the growing concern of government and consumers regarding the consumption of pesticide
residues in food. Schmidt, Rodrigues, Celia, & Gomes (2012) showed that the main motivating
factors to purchase certified foods by Brazilian consumers: food safety, and food’s credibility.
Moreover, the Brazilian Heath Surveillance Agency, in 2010, reported that 6,5% of the common
beans' sample presented non-compliances; 5,2% with presence of non-permitted (NP) pesticides, and
1,3% with pesticides residues upper to the maximum residue limits (MRL) permitted (ANVISA,
2011).
Despite the IP standards for common beans were produced in the 2008/09 winter harvest, the specific
norms are not available for growers yet. Because of that, there are no certified beans available for
sale in supermarkets, and then, the present study was conducted considering the certified beans as a
hypothetical product.
Before government and producer’s organizations move great force to invest and promote this kind
of food safety protocols and policies, should be important studying consumer’s perceptions of such
labelled products, and the probable return from these investments, as well, as observed by Tonsor &
Shupp (2009); and Govindasamy, Italia, & Adelaja (2001). We cannot presuppose that consumers
will automatically view the IP produce from a win-win perspective due to farmers have
environmental and financial benefits, as emphasized by Govindasamy, Italia, & Adelaja (2001).
4 Not only beans production, and not only in Cerrado areas. Data from 2009 cited by (Andrigueto, et al., 2009)
show that more than 40 different crops count with IP standards in more than 18 different States within the
country.
53
Economic and market analysis to permit an adequate and profound understanding of the
likely response of potential buyers and competitors regarding this kind of differentiated
products is fundamental, especially when them can result a premium price. Comprehend
consumer’s behavior and the determinants of their decision of purchasing, and willingness-
to-pay (WTP) are vital to the success of the supply chain’s agents interested in investing in
this kind of product. This information can be very important to estimate the acceptability of
the products offered to the market by customers.
Several studies worldwide have focused on consumer’s preference and WTP for labelling
claims of “produced by sustainable practices”, and “pesticides-free”, especially with fruits,
vegetables and meat. Misra, Huang, & Ott (1991) have studied consumers from Georgia
(U.S.) in terms of their preferences for testing and certification of fresh produce and WTP
for the same products certified as free of pesticides residues, and found that consumers were
willing to pay a maximum premium price of 10% for certified fresh products. Boccaletti &
Nardella (2000) have measured how much Italian consumers would be willing to pay for
pesticide-free FFV, and mostly of them were willing to pay a premium between 6 and 10%
of the regular price. Cranfield & Magnusson (2003) have conducted their research focusing
on a production system called Pesticide Free Production (PFP) (very similar to IP), and found
that Canadian consumers would pay 1 to 10% premium for PFP food products in comparison
to conventional products.
Complementary, McCluskey & Loureiro (2003) have proposed a study with several food
quality or attribute labeling in U.S., for instance, eco-labels, labels that identifies
environmentally preferable products based on an environmental-impact assessment that
includes the production process, use, and disposal of the product. Tonsor & Shupp (2009)
have evaluated consumer perceptions and estimated WTP for sustainably produced food
labels on beef, tomato, and apple, and found that U.S. consumer was not willing to pay a
positive premium for those products. More recently Wongprawmas, Canavari, &
Waisarayutt (2014) have studied safety labels on fresh produce in Thailand with focus on
estimation the value of safety labels perceived by Bangkok consumers.
However, relatively few economic researches has focused specific on IP produce (or
Integrated Pest Management - IPM, since it is the main component of IP system). Some
exceptions are: (a) Govindasamy, Italia, & Rabin (1998) have presented an empirical
evaluation of consumer preferences and response to IPM grown fresh produce in U.S.;
consumers who had knowledge of sustainable practices and have made previous purchases
of such products were more likely to buy IPM grown F&V, and were willing to pay a
premium of 6% or higher; (b) Govindasamy, Italia, & Adelaja (2001) have focused their
study on evaluating demographic characteristics that influence consumers to pay a premium
for IPM grown produce in U.S.; and (c) Kuhar & Juvančič (2010) have conducted their
research with consumers from Slovenia with the objective of elucidating and quantifying the
impact of various determinants influencing purchasing behavior of organic and integrated
fruit and vegetables.
After a vast literature review, no published economic research conducted in Brazil realm
was found with the focus on consumer behavior toward IP produce. Building upon existing

54
work evaluating other food attribute labels, we seek to begin addressing this gap and
contribute with future studies on this same field.
For the purposes of this study, reasonable questions to ask are: (a) What is the consumer’s
perception toward the IP label that claims credence attributes such as “sustainably produced”
and “free of pesticides residues?”; (b) Considering that the (hypothetical) product “IP
certified beans” is new for consumers, do they willing to pay (WTP) a price premium for
that as a safe food?
We focused on common beans (Phaseolus vulgaris), specifically the type called “carioca”
beans, in our study for some reasons: (1) this legume is one of the Brazilian staple foods; (2)
“carioca” beans is preferred by 76% of local’s consumers according to (Wander, Basinello,
& Ricardo, 2006); (3) we have special interest in studying continuously this issue in the
context of beans production in the Brazilian Central Region.
The objective of this study is examining the consumer’s perception of IP label in
hypothetical beans marketed at supermarket in Goiânia (GO) - Brazil, and estimate consumer
WTP for the certified beans. Besides the results regarding consumer’s preferences, this study
can also help the process of structuring the IP adoption at the farm level providing producers
with information about the price level of the certified beans.
3.2 METHODOLOGY
3.2.1 Theoretical Model
3.2.1.1 Discrete Choice Analysis (DCA)
In order to bring out consumer preferences toward IP label on common beans, we applied
the Choice Modelling or Choice Experiment (CE) framework since allows researchers to
specifically investigate trade-offs between several competing product attributes and to
determine the relative importance of various attributes in consumers’ choice process. CE is
used to determine the significance of the attributes that describe the good or service and the
extent to which individuals are willing to trade one attribute for another (Drummond et al.
(2005)5 cited by Mangham, Hanson, & McPake (2009)).
Choice theory assumption is that the individual will choose the alternative that yields his/her
highest individual preferences. Preferences are defined over commodities which may have
complex hedonic attributes, measured and unmeasured (McFadden, 1986). It is based on the
concept of Utility from the Theory of Consumer Behavior that means each individual has a
specific set of preferences for bundles of products (and attributes), and takes decisions in a
way to maximize the level of satisfaction from consumption (the utility level) (Mas-Colell,
Whinston, & Green, 1995).
5 Drummond M.F., Sculpher M.J., Torrance G.W., O’Brien B.J., Stoddart G.L. 2005. Methods for the economic
evaluation of health care programmes. Third edition. Oxford: Oxford University Press.

55
Specifically, this study was developed using the survey-based technique for estimation of
willingness-to-pay (WTP) known as Discrete Choice Analysis (DCA) or Choice Experiment
(CE). WTP measures indicate the amount of money individuals are willing to forfeit in order
to obtain some benefit from the undertaking of some specific action or task. In linear models,
WTP measures can be calculated as the ratio of two parameter estimates, ceteris paribus
(Hensher, Rose, & Greene, 2005).
DCA is indicated to study consumer preferences for products and services not traded on a
market such as for a new product under development and not yet commercially available
(Mangham, Hanson, & McPake, 2009) - that is the current case; certified beans are not yet
available. DCA requires respondents to state their choice over sets of hypothetical
alternatives (choice set) where each alternative is described by different characteristics or
attributes.
Some advantages of using this approach are: (a) DCA permits to decompose products into
attributes levels and estimate part-worth for these levels, i.e., the relative contributions of the
different attribute levels (Breidert, Hahsler, & Reutterer, 2006); (b) the choice experiment is
versatile in its application; it permits design an application to estimate a wide range of values
from hypothetical choice sets, including credence attributes (Bennett, 2005).
Its theoretical foundation is based on two economic theories. Firstly, the Lancaster’s new
approach to the individual utility maximization problem in consumer theory Lancaster
(1966) from which the consumers' utility is not from the product per se, but from the
attributes or characteristics that describe the product.
Secondly, the Random Utility Theory (RUT) based on Thurstone’s hypothesis on human
decision making, in 1927. He introduced the idea of random utility, with choice determined
by the alternative with the maximum utility at the moment (McFadden, 1986). Later, the
RUT was extended by (McFadden, 1986) whom considers utility as a latent construct that is
in the consumer’s mind and, then, cannot be observed directly.
The RUT supposes that the overall utility or random utility function (Uiq) associated with
the alternative (i), from an individual (q) can be divided into the contributions that are
observable and measurable (Viq) by the researcher, and those that are not observable, the
random component (Ɛiq) (Hensher, Rose, & Greene, Applied Choice Analysis: a primer,
2005).
Then, the utility expression is:
𝑈𝑖𝑞 = 𝑉𝑖𝑞 + 𝜀𝑖𝑞 (1)
After the individual (q) evaluating each and every alternative in the choice set of j= 1, 2, …,
i, …, J, alternatives, that chosen will be the one with the maximum utility. In turn, the
probability of the alternative i is chosen is equal to the probability that the utility of
alternative i is greater than (or equal to) the utility associated with alternative j (equation 2).

56
𝑃𝑖𝑞 = 𝑃𝑟𝑜𝑏[(𝑈𝑖𝑞 ≥ 𝑈𝑗𝑞) ∀ 𝑗 ∈ 𝑗 = 1, 2, … , 𝐽; 𝑖 ≠ 𝑗] (2)
The equation (3) contains the measurable elements that can be observed on a set of attributes
(i.e. Vj), and those considered random (or not directly measurable such as 𝜀𝑖𝑞).
𝑃𝑖𝑞 = 𝑃𝑟𝑜𝑏[(𝑉𝑖𝑞 + 𝜀𝑖𝑞) ≥ (𝑉𝑗𝑞 + 𝜀𝑗𝑞) ∀ 𝑗 ∈ 𝑗 = 1, 2, … , 𝐽; 𝑖 ≠ 𝑗] (3)
Finally, from equation (4) we can say that the probability of an individual (q) choosing
alternative i is equal to the probability that the difference in the observed sources of utility
associated with alternative i compared to alternative j is greater than (or equal to) the
difference in the unobserved sources of utility of alternative j compared to i after evaluating
each and every alternative in the choice set j.
𝑃𝑖𝑞 = 𝑃𝑟𝑜𝑏[(𝑉𝑖𝑞 − 𝑉𝑗𝑞) ≥ (𝜀𝑗𝑞 − 𝜀𝑖𝑞) ∀ 𝑗 ∈ 𝑗 = 1, 2, … , 𝐽; 𝑖 ≠ 𝑗] (4)
Commonly, the multinomial logit model (MNL) is the most traditional model used in CE.
We show this approach in the next section. Complementary, we have used also the random
parameter logit model or mixed logit.
3.2.2 Econometric Models
3.2.2.1 Multinomial Logit Model (MNL)
The multinomial logit model (MNL) is the most widely used econometric model in choice
modelling which combine hedonic evaluation of alternatives and random utility
maximization (McFadden, 1986). The model is derived under the premise that error term is
identically and independently distributed. The MNL general notation is:
𝑃𝐶(𝑖) = 𝑒𝑥𝑝(𝑉𝑖)/ ∑ 𝑒𝑥𝑝(𝑉𝑗)𝑗∈𝐶 , (5)
where, C represents a set of available alternatives; P is the probability that an individual will
choose alternative i among the set of available alternatives; the V’s are functions` of the
attributes of the alternatives that summarize the desirability of those.
MNL models assume consumers' homogeneity across preferences that are likely unrealistic.
In fact, there is a huge amount of variability in the reasoning underlying decisions made by
57
a population of individuals, often referred to as heterogeneity (Hensher, Rose, & Greene,
2005).
This characteristic is related to the Independence from Irrelevant Alternatives (IIA)
assumption. “IIA implies a uniform pattern of response to changes in the attributes of one
alternative which are inconsistent with heterogeneous patterns of similarities often
encountered in economics and marketing problems”, affirms McFadden (1986). It means
that the ratio of probabilities of choosing any two alternatives is independent of the choice
set. In certain cases, it is considered a limitation of the MNL model.
In order to solve this drawback, we used one strategy demonstrated by (Sackett, Shupp, &
Tonsor, 2012) that is to employ a Random Parameters Logit (RPL) model on the same data
set.
We have used the maximum likelihood (MLE) technique to estimate the parameters to the
probability of choice. MLE is an estimator that calculates parameters for which the observed
sample is most likely to have occurred. This is a popular method of model estimation because
of its robustness and ability to deal with complex data (Hensher, Rose, & Greene, 2005).
3.2.2.2 Random Parameter Logit Model (RPL)
RPL or Mixed Logit model allows consumer heterogeneity to be continuous across
respondents. The heterogeneity can be modeled including some interactions terms of case-
specific demographic variables and/or habits of consume.
Vojáček & Pecáková (2010) highlight two advantages stated by Train (2003) of using RPL
model instead of MNL for analyzing CE. The first advantage is that RPL model overcomes
the IIA assumption from MNL model; the second is the ability of RPL model to explicitly
account for heterogeneity in data.
According to Hensher & Greene (2001), RPL model estimates the unconditional choice
probability that is the expected value of the logit probability over all the possible values of
𝛃𝑞6, that is, integrated over these values, weighted by the density of 𝛃𝑞
7.
Thus, the unconditional probability is:
P𝑗𝑞(𝐗𝑞 , 𝐳𝑞 , 𝛀) = ∫ L𝑗𝑞𝑥
β𝑞(𝛃𝑞|𝐗𝑞 , 𝛈𝑞)𝑓(𝛈𝑞|𝐳𝑞 , 𝛀)𝑑𝛈𝑞 , (6)
6 The parameters 𝛃𝑞 consider additional stochastic element that may be heteroskedastic and correlated across
alternatives; it permits taking into account correlations among the error components of different choice
alternatives. 7 The density of β’s is specified as continued and can assume diverse distributions patterns such as normal,
lognormal, uniform, triangular or others, depending on the expectations about decision makers behavior.
58
where, the term Ljq(βq|Xq, ηq) is the conditional (or logit) probability; its parameters can be
interpreted as representing the tastes of individuals; and, f(ηq|zq, Ω) is the density of the
coefficients βq, where ηq denotes a vector of K random components in the set of utility
functions that reflects the random variation in βq, and Ω denotes the parameters of the density
function; the parameters which describe the density can be interpreted as their distribution
across individuals.
From the equation (6) it is possible interpret that the probability that an individual q will
choose alternative j given the specific characteristics of their choice set and the underlying
model parameters is equal to the expected value of the conditional probability as it ranges
over the possible values of βq.
Since the choice probability Pjq is a mixture of logits with different distributional forms
given by density 𝑓, the result will not exhibit the questionable IIA property present in the
MNL model, and different substitution patterns may be obtained by appropriate
specifications of 𝑓.
Considering that the choice probability generally cannot be calculated exactly because the
integral, will not have a closed form solution; the integral is approximated through
simulation (Hensher, Rose, & Greene, 2005). Then, the alternative is calculate the simulated
probability (SPjq) for the observed data (𝐳𝑞), given value of parameters (𝛀).
SP𝑗𝑞(𝐗𝑞 , 𝐳𝑞 , 𝛀) =1
𝑅∑ L𝑗𝑞(𝛃𝑞𝑟|𝑅
𝑟=1 𝐗𝑞 , 𝛈𝑞𝑟) , (7)
where, R is the number of replications (draws of βqr), βqr is the rth, and SPjq is the simulated
probability that an individual chooses alternative i (represented by the mean of the Ljq(βq)s).
Hensher, Rose, & Greene (2005) state that SPjq is a consistent estimator of Pj for any R; its
variance decreases as R increases, and is strictly positive for any R, so that ln(SPj) is always
defined in a log likelihood function.
Finally, the notation for the utility of the decision maker q from the alternative j in the RPL
model is:
𝑈𝑞𝑗 = 𝐱′𝑞𝑗𝛃𝑞 + 𝜀𝑞𝑗, q=1, 2, …, n; j=1, 2, …, J, (8)
where, x′qj are observed variables that relate to the alternative j and the individual q; βq is a
vector of coefficients of the observed variables for the individual q, i.e., the individual’s
tastes; and εqj is a random term with an independent and identically distributed (IID)
extreme value distribution.
59
Note that the for all the variables 𝐗𝑞𝑗, their respective coefficients will vary across
individuals in the population with density f(ηq|zq, Ω). In MNL, in contrast, it does not occur.
RPL model is exploratory in nature and each of the alternatives should be compared with
the MNL model to determine the best fit to the data.
Regarding the WTP estimation from the RPL model, if the two parameters used in deriving
measures of WTP are estimated as non-random parameters, the method of calculating WTP
is the same of the MNL model; that is, the WTP for an attribute is the ratio of that attribute’s
parameter estimate to the parameter estimate of the cost parameter. However, if one or the
other parameters is a random parameter, then the WTP calculations have to consider some
other criteria, that is not the case for the present study.
3.2.3 Empirical Model
3.2.3.1 Experimental Design
A choice experiment is characterized by a set of alternatives with combinations of attributes
(or factors) at different values (or levels). By including price levels in the choice set it
becomes possible to evaluate how much consumers would be willing to pay for certain
attribute.
Experimental designs permit constructing each alternative and its combinations in each
choice event. If the experimental design is inappropriate, biases can affect parameter
estimates and the model will not be able to capture the fullest extent of information from
survey participants (Kerr & Sharp, 2009).
Attributes and levels selection
The selection of the attributes was made taking in account the results from a qualitative
research (East R. , 2003), applied in Nov. 2013 to a sample of consumers from a supermarket
in the same city where the quantitative research was conducted. The qualitative technique
aimed to elicit the salient beliefs regarding the criteria of beans purchasing, and actually was
applied to reach other objectives of the role research. Thus, we used the results for
convenience.
We confirmed the relevance of the selected attributes comparing with some findings from
other studies. For instance, Sá R. S. (2008) cites the grains “color”, “appearance”, and “grain
size” as important attributes reported by consumers, related to beans purchasing preferences.
Wander, Basinello, & Ricardo (2006) have included also “commercial brand”.
Considering the objectives of this study that are measuring consumer’s perception toward
certified beans, and WTP for IP label, naturally, the attributes label and price are
indispensable. Complementary, we selected the attribute brand based on the referred sources.
The selected attributes and its respective levels are shown in Table 3-1.

60
Table 3-1- Attributes and levels of common beans
Attributes Levels
Price
(R$/Kg)
P0 = 2,76
P1 = 3,25
P2 = 3,75
Label (0) conventional beans
(1) IP labeled beans
Brand (0) fictitious brand
(1) preferred brand
(Currency ref. in Nov. 2014: €1,00 ≈ R$ = 3,14)
For the attribute “price”, three levels were applied. The basic level of price is P1 = R$ 3,25/kg
that represents the average price from 5 different local outlets; the prices were collected
during the week of the research. The range of price applied in the choice experiment was +/-
15% around the average price based on estimates for IP and organic products premium prices
according to Anderson et al. (1996); Aryal, Pashupati, Sangita, & Govinda (2009); and
Bonti-Ankomah & Yiridoe (2006).
The attribute “label”, in turn, was applied considering only two levels; one for certified beans
(IP labeled beans), and another for conventional beans (those actually familiar to
consumers).
Finally, the attribute “brand” was included considering the respondent preferred commercial
brand of beans (preferred brand), and another unknown brand for consumers that we called
fictitious brand.
Experimental Design Procedures
The experimental design was structured using the software Ngene 1.1.1. (Choice Metrics,
2012) from which an MNL efficient or D-optimal design was applied. According to Kerr &
Sharp (2009), D-efficient designs have been the most common approach to measuring
efficiency of experimental designs. It offers the potential to reduce confidence intervals for
parameters of interest in choice models, or to reduce required sample sizes. Moreover, D-
efficient designs minimize the D-error, which is an aggregate measure constructed from the
variances and covariances of the estimated utility function parameters.
Efficient designs are based on the idea that one should construct choice sets in such a way
that the choice maximizes the information on the trade-offs respondents make between the
attributes. It is important avoiding a dominant alternative in the choice set, on contrary, the
experiment result does not provide any additional information on the trade-offs. It is possible
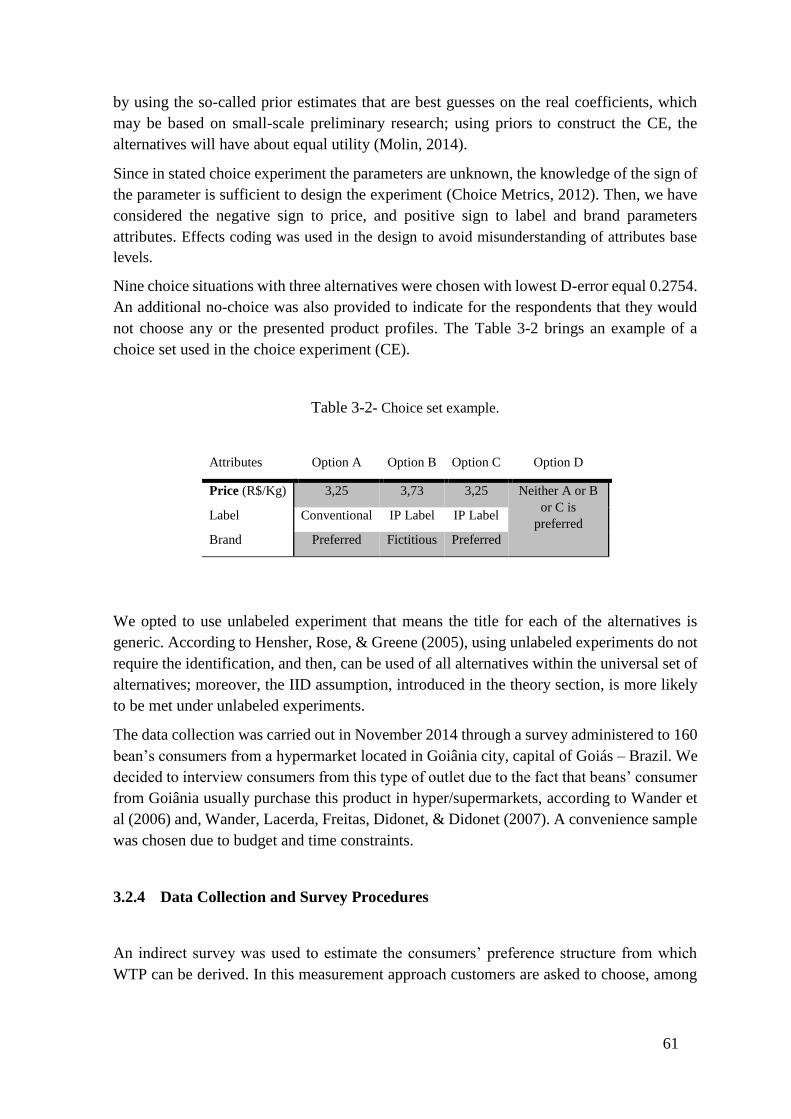
61
by using the so-called prior estimates that are best guesses on the real coefficients, which
may be based on small-scale preliminary research; using priors to construct the CE, the
alternatives will have about equal utility (Molin, 2014).
Since in stated choice experiment the parameters are unknown, the knowledge of the sign of
the parameter is sufficient to design the experiment (Choice Metrics, 2012). Then, we have
considered the negative sign to price, and positive sign to label and brand parameters
attributes. Effects coding was used in the design to avoid misunderstanding of attributes base
levels.
Nine choice situations with three alternatives were chosen with lowest D-error equal 0.2754.
An additional no-choice was also provided to indicate for the respondents that they would
not choose any or the presented product profiles. The Table 3-2 brings an example of a
choice set used in the choice experiment (CE).
Table 3-2- Choice set example.
Attributes Option A Option B Option C Option D
Price (R$/Kg) 3,25 3,73 3,25 Neither A or B
or C is
preferred Label Conventional IP Label IP Label
Brand Preferred Fictitious Preferred
We opted to use unlabeled experiment that means the title for each of the alternatives is
generic. According to Hensher, Rose, & Greene (2005), using unlabeled experiments do not
require the identification, and then, can be used of all alternatives within the universal set of
alternatives; moreover, the IID assumption, introduced in the theory section, is more likely
to be met under unlabeled experiments.
The data collection was carried out in November 2014 through a survey administered to 160
bean’s consumers from a hypermarket located in Goiânia city, capital of Goiás – Brazil. We
decided to interview consumers from this type of outlet due to the fact that beans’ consumer
from Goiânia usually purchase this product in hyper/supermarkets, according to Wander et
al (2006) and, Wander, Lacerda, Freitas, Didonet, & Didonet (2007). A convenience sample
was chosen due to budget and time constraints.
3.2.4 Data Collection and Survey Procedures
An indirect survey was used to estimate the consumers’ preference structure from which
WTP can be derived. In this measurement approach customers are asked to choose, among

62
a certain product profiles with different prices and other product attributes, whether they
would purchase the good at that price with such attributes or not.
In this study, respondents were presented for a set of nine hypothetical situations and they
were asked to indicate that preferred alternative. The choice questions were presented in
randomized order across respondents to reduce question ordering biases (Loureiro &
Umberger, 2003). A no-choice alternative was also provided to indicate that respondent
would not choose any of the available product profiles, as suggested by Breidert, Hahsler, &
Reutterer (2006).
Considering that commercial beans' brand is an important element to drive consumers'
purchasing habits, before asking respondents what option was preferred in the choice set, we
asked them to nominate their preferred brand, and then, we used the nominated brand to
apply the CE given the alternative fictitious brand (figure 3-2).
Figure 3-2– Choice task example.
Additionally, questions on habits of purchasing and consumption from the consumers, and
their socio-demographic characteristics (SDC) were considered as part of the survey
instrument since these variables can modify preferences (McFadden, 1986).
Thus, the final survey instrument comprised four sections: (1) buying behavior and
consumption habits; (2) choice experiment (CE); (3) theory of planned behavior; and (4)
SDC data. For the purposes of this study, the answers regarding the third section were not
used since they were collected to attend another study.
A previous pilot survey was administered to the field with thirty beans’ consumers in order
to test the aspects of the survey, to make sure that every question was clear, and to identify
alternative approaches to various aspects of the survey design and execution; furthermore,
to verify the average time needed to apply each questionnaire (Stopher, 2012).
The questionnaire was administered face-to-face by trained interviewers; they were located
in front of the beans shelves. The interviews duration took almost 15 min and were done in
Portuguese language.

63
Two screening questions were done before starting the interview to ensure the respondents
were at least 18th years old, and also regular beans’ consumers.
Afterwards, the interviewers started the process using a “cheap-talk” script in order to
removes hypothetical bias for consumers relatively ignorant of the good evaluated (Lusk,
2002). In fact, this phase was crucial because local consumers were not familiarized with
this kind of product. Actually, the hypothetical certified beans were introduced as a new
concept of product for them.
In this manner, the “cheap-talk” objectives were: (1) explaining consumers about the
meaning of IP label evidencing the mainly credence attributes on those kind of beans such
as “produced by sustainable practices” and “free of pesticides residues”8; (2) though the CE
were hypothetical in that they did not include actual money or real product, we have
explained to consumers that they would make their selections like them would if they were
actually facing that options in the hypermarket.
The following elements were used to implement the CE: (a) a leaflet with a short message
to communicate consumers about the research in the outlet; (b) message inviting consumers
to the research transmitted by the audio system of the hypermarket; (c) a script (the same
used on cheap-talk) with information on IP beans; (d) package illustrations to represent the
choices; and (e) the questionnaire itself (figure 3-3).
Figure 3-3– Set of resources used on CE.
3.2.5 Model Specification and Statistical Procedures
The IBM SPSS Statistics software (SPSS Inc., 2013) was used to analyze the SDC in order
to characterize the sample. The choice experiment analysis and WTP estimates were made
using the software NLOGIT v.4.0 (Greene, 2012) through the use of multinomial logit and
mixed logit models.
The designed CE allowed each respondent to select from three alternatives plus one opt-out
of the purchase between nine different scenarios. As demonstrated in the theory section, each
8 Special care was taken to avoid confounding with organic products that are pesticides-free.
64
alternative among the given scenarios can be represented with a utility function containing
a deterministic and a stochastic component.
The best empirical model comprises the three main attributes selected to the choice
experiment - price, label, and brand - and the interaction label/brand (R2-Adj=0.4263). The
respective parameters attributes were estimated in a MNL model. In this framework, the left
hand side variable represents choices and is coded as a dummy variable, taking the value of
1 when the product was chosen and 0 otherwise. The right hand side is represented by the
attribute levels of each product or the explanatory variables; also here, we have coded as
dummy variables, except price that was coded as a continuous variable. The data were
analyzed using the random utility framework, and estimated by maximum likelihood
estimation (MLE).
Therefore, the basic logistic regression estimated for each alternative j was as follow:
𝑉𝑖𝑗 = 𝛽𝑝𝑟𝑖𝑐𝑒 . 𝑃𝑟𝑖𝑐𝑒𝑖𝑗 + 𝛽𝑙𝑎𝑏𝑒𝑙. 𝐿𝑎𝑏𝑒𝑙𝑖𝑗 + 𝛽𝑏𝑟𝑎𝑛𝑑. 𝐵𝑟𝑎𝑛𝑑𝑖𝑗 + 𝛽𝑙𝑏𝑥𝑏𝑟. 𝐿𝑏𝑥𝐵𝑟𝑖𝑗 + 𝜀𝑖 (9)
where i = 1, 2, … , N, is the number of respondents; j is the number of alternatives given the
choice set. 𝑉𝑖𝑗 indicates the respondent’s utility, individually; 𝑃𝑟𝑖𝑐𝑒𝑖𝑗 is the price applied to
a package of 1Kg of dried beans for alternative j; 𝐿𝑎𝑏𝑒𝑙𝑖𝑗 indicates the presence or not the
IP label indicating that the product is certified or conventional; 𝐵𝑟𝑎𝑛𝑑𝑖𝑗 indicates the beans’
commercial brand (preferred by consumer vs. fictitious); and, 𝐿𝑏𝑥𝐵𝑟𝑖𝑗 the interaction
between label and commercial brand.
The RPL model was used to estimate the heterogeneity across respondents. The parameters
of the attributes βlabel, βbrand, and the interaction βlbxbr were modelled as random with
normal distribution; the model was applied using 100 Halton draws. This number of draws
seems to be reasonable to secure a stable set of parameters estimates for the present model
(Hensher, Rose, & Greene, 2005).
Several interactions were tested in the data analysis in order to identify the sources of the
heterogeneity in the preferences such as label vs. genre, label vs. marital status, label vs.
income, label vs. educational level, label vs. job status, label vs. children < 12 years at home,
and label vs. age. Basically, all of them were statistically insignificant, except the interaction
label vs. brand that was included in the model.
To measure how well the model fits the data, the goodness-of-fit statistics on the basis of the
log-likelihood function are usually used. McFadden’s statistic is the most used in literature
on discrete choice. Although its interpretation is not the same as that of the R-squared in the
linear regression, fortunately, the relationship between them permits a better interpretation.
Thus, when the pseudo R-squared values are between the range of 0.3 and 0.4, we can
consider values between 0.6 and 0.8 for the equivalent linear model (Vojáček & Pecáková,
2010).
65
The estimates of the parameters values can also be used to derive willingness-to-pay (WTP).
WTP represents the estimation of the welfare changes caused by changes in the attribute
levels, specifically in terms of price.
The average WTP for the label and brand attributes, ceteris paribus, was estimated as:
𝑊𝑇𝑃(𝐿𝑎𝑏𝑒𝑙𝑖) =𝛽𝑙𝑎𝑏𝑒𝑙𝑖
𝛽𝑝𝑟𝑖𝑐𝑒𝑖⁄ (10)
𝑊𝑇𝑃(𝐵𝑟𝑎𝑛𝑑𝑖) =𝛽𝑏𝑟𝑎𝑛𝑑𝑖
𝛽𝑝𝑟𝑖𝑐𝑒𝑖⁄ (11)
In the case of this study, the value from the equation (10) indicates also the price premium
for IP beans, relative to the conventional ones; instead, the estimates from equation (11) give
to us the value that consumers are willing to pay for the preferred brand.
For each unit change in the attribute level of each variable, we have an increase (or decrease)
in terms of the probability of choice. Thus, it’s foreseen that price variable will have negative
coefficient estimates since provide disutility to the consumer under the designed model. In
DCA, WTP is traditionally estimated at the segment or sample level (Breidert, Hahsler, &
Reutterer, 2006).
3.3 RESULTS AND DISCUSSION
3.3.1 Consumers Characteristics and Consumption Habits
The Consumers’ socio-demographic characteristics (SDC) are reported in the table 3-3.
The elicited SDC profile shows that 63% of the respondents are female. This result
converges to that reported by Wander, Basinello, & Ricardo (2006) in which the profile of
rice and beans’ consumers from the Metropolitan Region of Goiânia was described. The
authors also had a high female response rate (65,6%). According to Blessa (2003) females
are the majority hypermarkets and supermarkets’ frequent consumers in Brazil.
The mode of age is between 56-65 years (35%) while the average age is between 36-50 years
representing 25,6% of the respondents; basically, the same range (between 36-45 years)
reported by Wander, Basinello, & Ricardo (2006), and by Wander, Lacerda, Freitas,
Didonet, & Didonet (2007) in their studies in the same place.
The majority of the respondents are married (71,3%) with family size up to 5 people (86,9%),
and 65% reported having children up to 12 years at home. Wander, Basinello, & Ricardo
(2006) reported family size between 3-5 people, and 80,1% of their sample had at least one
children up to 16 years old.
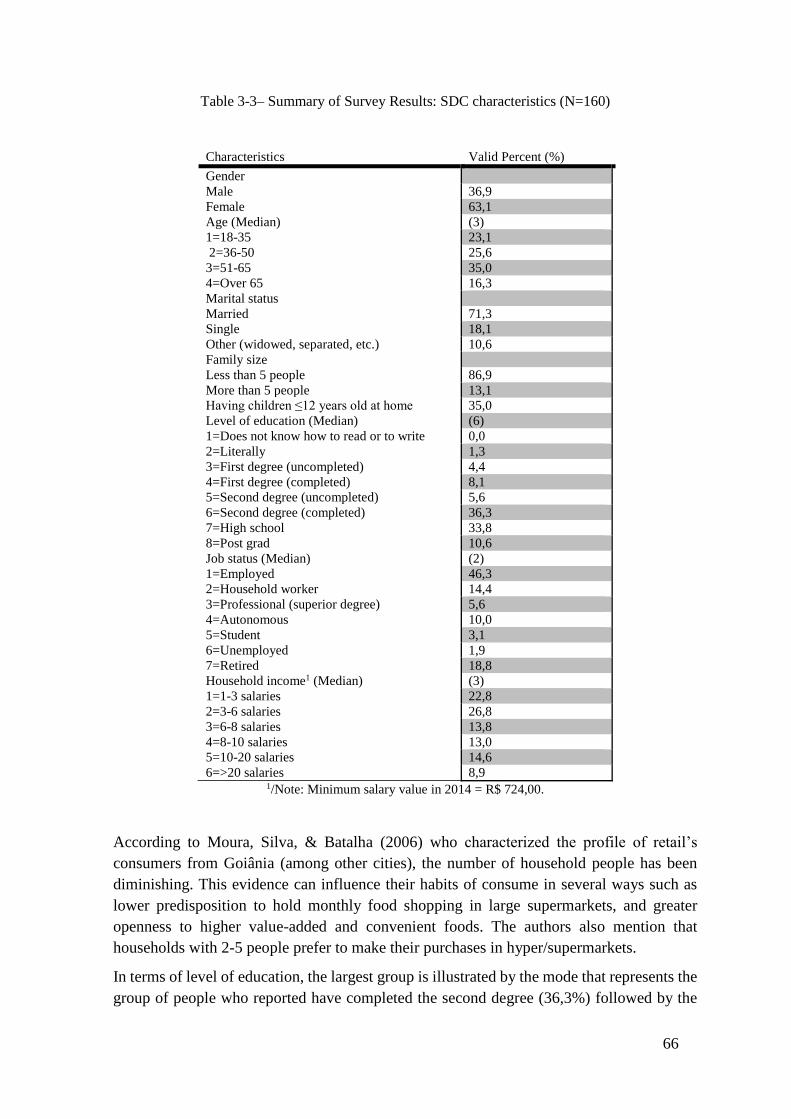
66
Table 3-3– Summary of Survey Results: SDC characteristics (N=160)
Characteristics Valid Percent (%)
Gender
Male 36,9
Female 63,1
Age (Median) (3)
1=18-35 23,1
2=36-50 25,6
3=51-65 35,0
4=Over 65 16,3
Marital status
Married 71,3
Single 18,1
Other (widowed, separated, etc.) 10,6
Family size
Less than 5 people 86,9
More than 5 people 13,1
Having children ≤12 years old at home 35,0
Level of education (Median) (6)
1=Does not know how to read or to write 0,0
2=Literally 1,3
3=First degree (uncompleted) 4,4
4=First degree (completed) 8,1
5=Second degree (uncompleted) 5,6
6=Second degree (completed) 36,3
7=High school 33,8
8=Post grad 10,6
Job status (Median) (2)
1=Employed 46,3
2=Household worker 14,4
3=Professional (superior degree) 5,6
4=Autonomous 10,0
5=Student 3,1
6=Unemployed 1,9
7=Retired 18,8
Household income1 (Median) (3)
1=1-3 salaries 22,8
2=3-6 salaries 26,8
3=6-8 salaries 13,8
4=8-10 salaries 13,0
5=10-20 salaries 14,6
6=>20 salaries 8,9 1/Note: Minimum salary value in 2014 = R$ 724,00.
According to Moura, Silva, & Batalha (2006) who characterized the profile of retail’s
consumers from Goiânia (among other cities), the number of household people has been
diminishing. This evidence can influence their habits of consume in several ways such as
lower predisposition to hold monthly food shopping in large supermarkets, and greater
openness to higher value-added and convenient foods. The authors also mention that
households with 2-5 people prefer to make their purchases in hyper/supermarkets.
In terms of level of education, the largest group is illustrated by the mode that represents the
group of people who reported have completed the second degree (36,3%) followed by the

67
high school group (33,8%). Similarly, from the findings by Wander, Basinello, & Ricardo
(2006), the same two groups were the most frequent. Consumers with high school were
35,8% followed by that with completed second degree (30,3%). We found that literally
people represents only 1,3% of the respondents and nobody reported do not read or right.
Normally, it is expected that people who have a higher level of education are more likely to
respond to a survey, as they understand the necessity of such studies.
Employed people are also the majority (46,25%) followed by retired group (18,75%), and
household workers (14,38%). Two important groups in terms of power of acquisition, i.e.,
the autonomous and professional workers (represented by doctors, dentists, lawyers, etc)
sum 15,62%. Students (up 18 years) were 3,125% and 1,37% unemployed people.
It is possible to grasp several things about the data on household income such as the fact that
the largest group is the one with 3-6 salaries (equivalent to R$2.173,00 - R$4.334,00 monthly
income) that is equivalent to social classes “B2” and “C”, according to the Brazilian
Research Company Association cited by Moura, Silva, & Batalha (2006). As observed,
23,1% of respondents did not report their income. However, when the non-reported income
was excluded to the statistical analysis, the results did not change, and the median maintained
in the same interval of 6-8 salaries (R$4.335,00 - R$ 5.792,000). The most frequent
household income reported by Wander, Basinello, & Ricardo (2006) was 3-5 salaries
(29,2%) followed by the group with 5-10 salaries (23,7%).
Regarding the purchasing and consumption habits, 83% of the respondents self-declared as
being the responsible by household’s food shop-ping. Beans are purchased almost one or
two times a month by 80% of the respondents, basically in hypermarkets and supermarkets
as illustrated in figure 3-4.
Figure 3-4– Consumers habits of beans purchasing.
Our findings are very similar of that reported by other studies on beans’ consumer’s habits
in the same municipality. In terms of beans’ consumption, 91% of the respondents reported

68
a daily consumption of beans; this result confirms the importance of beans in the Brazilian
diet.
We have also questioned consumers whether they trust in all of the beans label information,
and approximately 57% does not trust completely on that; only 43% of them believe that the
information on the beans’ label are reliable. This result indicates that one more information
on package such as “IP label” needs to be included carefully and followed by a good
communication toward consumer.
The respondent’s evaluation regarding some beans’ quality attributes is illustrated in figure
3-5.
Figure 3-5– Beans’ quality attributes reported by respondents
Almost eight in 10 consumers (75%) consider price and brand as the most important
attributes to be evident on beans’ package, followed by expiration data (best before). Its
results are in accordance with other authors that highlight the importance that consumers
from Goiania give for the beans’ brand.
Certification’s label, origin, nutritional information, and cook tips were the attributes with
less importance to the group of consumers interviewed. Besides that, the attribute
certification of quality figures as the fifth most important. This level of importance has to be
interpreted carefully. The relative importance could be justified on the fact that IP label is a
new sign of quality for consumers and represents part of consumers’ desire and necessity.
On the other hand, the label was the focus of the research and consumers could be over
valuating it.
Finally, the consumers were asked about additional information they would consider
important and they would like to see on beans’ package regarding some credence attributes
related to sustainability and health concerns. The results are shown in figure 3-6.

69
Figure 3-6– Additional labelling information considered important by respondents.
Almost 80% of the respondents considered important including on the beans package
information about environmental responsibility, pesticides residues and health benefits of
beans, as well, while 78,8% considered important include information on the type of system
of production such as IP system. Information about social responsibility appears in the last
position but not less important. I would say that local consumers are not familiarized with
this kind of quality attributes, i.e., credence attributes. This positive reaction could be
explained by the effect of the novelty.
3.3.2 Consumers’ Preferences and Willingness-to-Pay (WTP)
The estimates for MNL and RPL models are reported in table 3-4. β coefficients refer to
parameters that weight beans’ attributes in determining the consumers’ utility. Note that the
outcome of the model estimation is ‘choice probabilities’, not choices per se.
Both MNL and RPL models exhibit a decent fit as they reach an Adjusted R2 greater than
0.3 which is equivalent of 0.6-0.8 for linear regression model. RPL model is statistically
better than the MNL model due to the Adjusted R2 is greater than the MNL model.
The MNL estimates results show expected signs for each parameter and are all highly
significant. It means that the null hypothesis which all coefficients are zero was rejected
since the likelihood ratio test has p-value < 0.01. We can say that all the attributes selected
to compound the CE are significant on the consumer’s point of view.
The MNL estimates suggest that the provided information had effect on respondent’s choice
made in the hypothetical CE across labeled vs. conventional product indicating that
consumers are label sensitive. In magnitude, the utility estimated for the attribute IP label is
higher than the utility associated with the preferred brand; probably, because the novelty
effect related to certified products.
The negative parameter on price (βprice) indicates the marginal disutility associated with a
change in price due to the added-value of certified beans; it means that increments on “price”
decrease the associated utility level provided by the choice (dislike). Several studies show
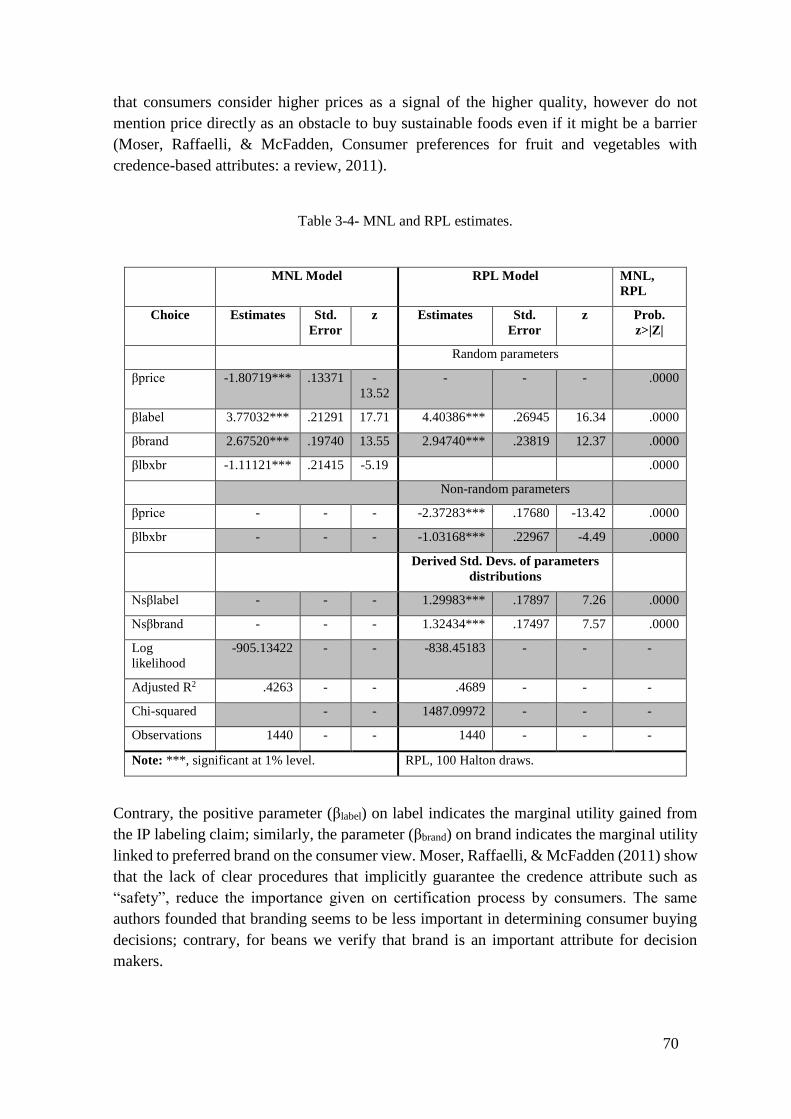
70
that consumers consider higher prices as a signal of the higher quality, however do not
mention price directly as an obstacle to buy sustainable foods even if it might be a barrier
(Moser, Raffaelli, & McFadden, Consumer preferences for fruit and vegetables with
credence-based attributes: a review, 2011).
Table 3-4- MNL and RPL estimates.
MNL Model RPL Model MNL,
RPL
Choice Estimates Std.
Error
z Estimates Std.
Error
z Prob.
z>|Z|
Random parameters
βprice -1.80719*** .13371 -
13.52
- - - .0000
βlabel 3.77032*** .21291 17.71 4.40386*** .26945 16.34 .0000
βbrand 2.67520*** .19740 13.55 2.94740*** .23819 12.37 .0000
βlbxbr -1.11121*** .21415 -5.19 .0000
Non-random parameters
βprice - - - -2.37283*** .17680 -13.42 .0000
βlbxbr - - - -1.03168*** .22967 -4.49 .0000
Derived Std. Devs. of parameters
distributions
Nsβlabel - - - 1.29983*** .17897 7.26 .0000
Nsβbrand - - - 1.32434*** .17497 7.57 .0000
Log
likelihood
-905.13422 - - -838.45183 - - -
Adjusted R2 .4263 - - .4689 - - -
Chi-squared - - 1487.09972 - - -
Observations 1440 - - 1440 - - -
Note: ***, significant at 1% level. RPL, 100 Halton draws.
Contrary, the positive parameter (βlabel) on label indicates the marginal utility gained from
the IP labeling claim; similarly, the parameter (βbrand) on brand indicates the marginal utility
linked to preferred brand on the consumer view. Moser, Raffaelli, & McFadden (2011) show
that the lack of clear procedures that implicitly guarantee the credence attribute such as
“safety”, reduce the importance given on certification process by consumers. The same
authors founded that branding seems to be less important in determining consumer buying
decisions; contrary, for beans we verify that brand is an important attribute for decision
makers.
71
However, the negative parameter (βlbxbr) on LBxBR should be carefully interpreted.
Comparing to the magnitude of the other two parameters on label and brand, individually,
one cannot interpret this interaction parameter as a cumulative effect. It means that preferred
brand associated with IP label has a probability of choice less than any other commercial
labeled brand.
Equally, the RPL model is significant at the level of 1%. All the parameters of the model are
significant at the 1% level and have the expected signs. The estimated parameters differ a
little from the MNL model estimates. As depicted in table 4, βlabel and βbrand are random
parameters indicating that vary across decision-makers. However, it is important consider
that both these parameters were estimated as random and their standard deviations are
significant at the 1% level. Thus, the values shown in table 4 for the RPL model indicate
only the mean values of the parameter estimates.
From RPL estimates, both values for the derived standard deviations of parameters
distribution Nsβlabel and Nsβbrand are statistically significant at the level of 1% indicating
that there is heterogeneity in the parameters estimates across the sample population. In other
words, it means that individual's preferences differ among different individuals, and from
the mean estimate for the sample population.
WTPMNL estimates (or price premium) for IP label attribute is R$2,08/Kg, i.e., the amount
of money the average consumer is willing to pay for certified (labeled) beans, holding all
else constant and considering no uncertainty regarding choice. The MNL framework used in
this analysis assumed homogeneous preferences, and thus the WTP estimates can only be
interpreted for the average consumer. Instead, WTPMNL estimates for brand attribute is
R$1,48/Kg. Although the WTP for brand is not the focus of this study, is interesting consider
that both WTP estimates are positive which implies beans is anyway purchasing by
consumers. From RPL model, WTP estimates for IP label was R$1,83/Kg, and for preferred
commercial brand, R$1,26/Kg. The results are similar to those from MNL.
Moser, Raffaelli, & McFadden (2011) state that is important to consider other types of
consumer buying behavior variables such as frequency of purchasing and demographics
(age, education, place of residence, income, marital status) when estimating WTP. However,
these variables were not significant in the model applied in this study.
3.3.3 “What-if” Scenarios using MNL results
An interesting analysis that can be performed from MNL results (table 04) are “what-if”
scenarios using spreadsheet programs such as Excel to establish simulation on how changes
in attributes impact upon the choice probabilities for each of the alternatives. Naturally, the
focus is on the IP label, i.e., IP certified beans.
To calculate the probability that an alternative will be selected over all other available
alternatives, ceteris paribus, by certain consumer from our sample, the utility function for
that alternative is treated as the numerator in the equation (12):
72
Prob(𝑖|𝑗) = 𝑒𝑥𝑝(𝑉𝑖)/ ∑ 𝑒𝑥𝑝𝐽𝑗=1 𝑉𝑗 , j = 1, ... , i, ..., J i=j (12)
where, Prob(i|j) is the probability that an individual will choose alternative i among the set
of available alternatives; Vi is the utility function for the alternative chosen; Vj is the utility
function for all other available alternatives. The V’s were calculated using the estimated
parameters from the MNL model.
To simulate our scenario, we assume that are only three different types of beans available in
the market with different levels of prices: (1) a certified bean from a fictitious brand (on sale
for varied prices); (2) a conventional bean from a preferred brand on sale for R$ 3,25/Kg
(fixed price); and, (3) a conventional bean from a fictitious brand on sale for R$ 2,76/Kg
(fixed price). The figure 07 illustrates the choice probabilities for each of the alternatives.
As shown in figure 3-7, consumers are willing to purchase certified beans instead of
conventional ones until its price is around R$ 3,80/Kg, maximum, even if the brand is
unknown by them. Above that price, consumers will change their preferences and will buy
conventional beans from their preferred commercial brand. This scenario indicates that
interviewed consumers probably understood the message of the IP label. Considering that
the beans average price in the market at the period of the research was R$ 3,25/Kg, one can
concludes that consumers were willing to pay almost up to 17% more for certified beans
from any brand. If both alternatives certified + fictitious brand and conventional + preferred
brand were on sale at the same price, i.e., R$ 3,25/Kg, the probability of purchasing the first
option would be next to 70%. The alternative ‘conventional beans from a fictitious brand’
will be the consumers’ less preferred alternative.

73
Figure 3-7– Scenario 01: choice probabilities for beans alternatives in the market
3.4 CONCLUSIONS AND RECOMMENDATIONS
The present study was very useful for concluding some important points regarding
consumers’ preferences toward sustainable food attributes in Brazil, even if we cannot make
inference for the overall Brazilian consumers.
Although other studies highlight that beans’ consumers from Goiânia city have more
preferences for visual attributes, especially for the beans color and appearance, our findings
suggest that they are also concerned about pesticide residues in beans, as well as, the
sustainable practices applied by growers. The findings suggest that consumers are label-
sensitive that means they are willing to purchase IP certified beans.
The average consumer is prepared to facing labeled products from the integrated production,
i.e., products with sustainable and food safety claims. However, we acknowledge that
consumers are likely to have heterogeneous preferences over beans value attributes such as
certification label and commercial brand.
Besides the fact IP certification is a kind of business-to-business scheme to guaranteeing
minimum quality patterns of the product within the supply chain, in the market where the
research was conducted it could be also considered business-to-consumer. One explanation
could be the novelty effect and the latent demand for certified products that offer less risk
for health and are more sustainable.

74
Overall, our findings suggest that profitable marketing opportunities may exist for operators
interested in trading IP certified beans, however there needs to be considerable effort put
into leveling information asymmetries about beans quality on sustainable and food safety
label claims to be differentiated from more recognizable competing products.
Thus, making relevant information available at the point of purchase can further help to
educate consumers about the benefits of choosing IP produce, with accuracy of
communication. The consumer confidence in this kind of food label depends on how
companies will provide information about the product. Misleading or imprecise
environmental or healthy claims can have a detrimental effect on how consumers perceive
the supply chain’s operators in general.
Our analysis demonstrates that positive price premiums can be captured by sustainably
produced and healthy labeling claims such as IP label, relative to similar unlabeled or
conventionally produced beans. The price premiums calculated in our model for both, IP
label and preferred commercial brand, reveal that there is a positive trade off in utility
between conventional and sustainably labeled food products, and fictitious and preferred
brand. However, we cannot conclude that preferred brands associated with IP label could
result a higher price premium.
We are convinced that our findings can provide more insights for both policy makers and
supply chain actors into Brazilian consumer’s perception and preferences for quality
attributes inherent to the integrated production system. The results indicate that the
Government investments in IP can be effective in the long-term since consumers need to be
familiarized with labeling schemes.
Moreover, the positive WTP values and positive consumer’s behavior toward certified beans
could influence positively beans’ growers to adopt IP to offer certified beans as alternative
to conventional beans. They probably could sell certified beans with higher price.
As recommendation, future researches in this same field could be explore in depth the
possible factors that conditioning the heterogeneity of consumer’s preferences; it could be
useful for developing marketing strategies to positioning better the IP certified products.
More information about consumers’ perception toward food attributes with environmental,
social and health claims are also important.
Finally, a replication of similar study in other strategic cities could be fundamental to permit
a better comprehension on Brazilian consumer’s preferences overall.

75
4 CONSUMERS’ INTENTION TOWARD PURCHASING IP CERTIFIED
BEANS: AN ANALYSIS USING THE THEORY OF PLANNED BEHAVIOUR
(TPB).
Abstract
The food patterns of consumption are changing rapidly. This change has been reflecting in the
increased of safe and more sustainable food consumption such as organic products. Agricultural
foods grown in integrated production (IP) also fit the new consumer’s food patterns of quality. In
Brazil, the supply of IP certified products is still small. In this context, this study proposes, as a
theoretical contribution, to replicate the Theory of Planned Behavior (TPB) to evaluate the
consumers’ perception and intention of purchasing IP certified beans. TPB states that the individual's
behavior is a function of its behavioral intention that, in turn, it depends on three factors: the
combination of attitudes and the influence that behavioral beliefs have on them; the subjective norms;
and the individual’s perception on the perceived behavior. The survey was conducted in Goiânia
(GO), Brazil, in 2014, where 160 common beans’ consumers were interviewed in a local
hypermarket. Data were analyzed using univariate techniques and multivariate statistics such as
structural equation modeling (SEM). The results reveal characteristics of consumer’s behavior of IP
certified products, and allowed the validation of the TPB model for the consumption of certified food
in a limited context in the Brazilian market.
Keywords: consumer behaviour, integrated production, TPB, credence attributes, common beans.
4.1 INTRODUCTION
The consumers’ behavior of food is directly related to their culture, their family, their
environment and economic reality. Comprehend the consumers’ decision making process
require knowledge in several disciplines such as marketing, psychology, economy and
management. Several studies related to consumers’ behavior have sought to understand their
logic of consumption (Magistris & Gracia, 2008; Hoppe, Barcellos, Vieira, & Matos, 2012;
Govindasamy & Italia, 1999).
Fishbein & Ajzen (1975) state that the individual human behavior is a function of the
intention of behavior that, in turn depends on three elements: the combination of attitudes,
and the influence that behavioral beliefs have on them; the subjective norms, and individual
perception about the perceived behavior.
In the recent years, the attention on food consumption patterns is not only on food quality
and price. Several studies have investigated consumers’ demands, commonly measured in
terms of willingness to pay (WTP) a higher price premium, for higher levels of food safety
and quality. The majority of them carried out in developed countries, including, but not
limited to Australia, Canada, France, Germany, Greece, Italy, UK and USA. These studies
involve a wide array of food safety and quality issues such as consumers’ WTP to avoid
some perceived food risks, or WTP for better quality, or even WTP for some ethical and/or

76
environmental causes. Some of them also investigated consumers’ WTP for various food
certification/labelling schemes (Birol, Roy, Deffner, & Karandikar, 2009).
Thus, investigation attributes related to production methods such as sustainable practices
became crucial since evokes diverse attributes related to different concerns, for example,
environment, and human. Therefore, food-safety became an important dimension of quality
where attributes such as foodborne pathogens, heavy metals, pesticide residues, food
additives and veterinary residues are important elements in the decision making process of
consumers.
However, the attributes associated to food-safety or environmental aspects of agricultural
products cannot be directly recognized by consumers due to are considered credence
attributes. In this sense, consumers can never ascertain by themselves the presence of such
attribute; they have to rely on the information given. Due to the credence aspect of such
attributes, credence goods require standards or a certification to provide information to
consumers, legitimating health and safety regulation (Moser, Raffaelli, & McFadden,
Consumer preferences for fruit and vegetables with credence-based attributes: a review,
2011). Indeed, the standards can help consumers to evaluate the quality of food products by
increasing the transparency of the production processes and the traceability of products.
The movement toward food-safety started in Europe with the successive food crises during
the last thirty years. The contaminant based “food scares” (antibiotics, hormones and
pesticides) became more concern to consumers than hygiene standards and food poisoning.
Consumers also became alarmed with the “cocktail effect” that is the synergistic effects of
different pesticide residues (Fontes, Giraud-Héraud, & Pinto, 2013).
In Brazil, these concerns became more popular in the 90's with the opening of the Brazilian
market worldwide. Since then, the consumption patterns of Brazilian people have been
changing due to the variety of available goods and services options. In this process of change,
Brazilian consumers have been considering the value aspects of quality and food safety
(Hoppe, Barcellos, Vieira, & Matos, 2012).
As result, the demand by consumers for food is increasingly towards higher quality,
including taste, nutritional, and safety characteristics, and value added products, principally
in developed economies. But, in the long-run, food-safety attributes are underneath all the
other attributes in the sense that consumers do not take it into consideration, assuming that
a food product to be available in the market is in accordance with the food safety minimum
legal requirements.
In this context, Public Authorities have been establishing “minimum quality standards”
(MQS) of safety performance for a product characteristic. Moreover, the governments have
been setting up certifications and standards, in the context of voluntary agreements (i.e. non
mandatory standards) which allow to certify behavior of producers/companies, virtuous in
social or/and environmental aspects and which can have an indirect link with food safety
from the consumer’s point of view.
Thus, we address some questions that prompt this research considering the consumers’ point
of view: would consumers prepared to purchase certified agro-food products such as
77
common beans from IP produce, with sustainable and safe food claims? Would IP label
influence positively the consumers’ decision making when they are choosing common
beans?
We focused on common beans (Phaseolus vulgaris), specifically the type called “carioca”
beans, in our study for some reasons:
(1) this legume is one of the Brazilian staple foods;
(2) “carioca” beans are preferred by 76% of local’s consumers according to (Wander,
Basinello, & Ricardo, 2006);
(3) we have special interest in studying continuously this issue in the context of beans
production in the Brazilian Central Region where this type of beans is broadly grown.
That said, for the purposes of this study we have chosen the case of Integrated Production
(IP) label taking into account the standards according to the International Organization for
Biological and Integrated Control (IOBC, 2004) that cover ecological, ethical and social
aspects of agriculture production as well as those related to food quality and safety.
Therefore, credence attributes are extremely related to IP produce.
IP has been applied, voluntarily, in Europe, since 1990’s, for instance, to address
environmental and health concerns by reducing the net chemical pesticide inputs to
agriculture, and improves food quality and safety.
IP certification is very often interpreted as an improvement of the sanitary safety. In Brazil,
the standards of Integrated Production had its legal framework established in 2010 by the
Normative Instruction Nº 27 of 30/08/10 (BRASIL, 2010), although the first experiences
started with fruits ten years before this.
Since then, the agro-foods produced in the IP system have been one of the choices of food
produced in a farming system based on sustainable agriculture, which restricts the
indiscriminate use of pesticides, with preservation of natural resources, and social
responsibility.
Originally, IP standards are classified as B2B since they are targeted to guaranteeing quality
and food safety within the supply chain. However, in this study IP standards are considered
also as B2C since the Brazilian government focus is also on the final consumer. One of the
objectives of IP certification in Brazil is improving quality and food safety by guaranteeing
compliance with minimum standards of production, on the consumer side (BRASIL, 2015)
In this context, the distinctive signal or the IP certification label have been used to
communicate consumers about the quality attributes inherent to the IP produce. The IP label
is called “Brasil Certificado – Agricultura de Qualidade” (Certified Brazil – Agriculture of
Quality), and aims to contributing for an appropriately communication toward consumers.
The label evokes the most important credence attributes intrinsic to IP produce such as
“sustainably produced” and “safe food” (figure 4-1).
78
Figure 4-1– Brazilian logo for Integrated Production produce.
IP standards for common beans were developed in the 2008/09 winter harvest, when specific
norms for this crop were created with the participation of several agents from the beans’
supply chain. However, these norms are not available for growers yet, and consequently,
during the period of the present research; there were no certified beans available for sale in
supermarkets. For this reason, the present study was conducted considering the certified
beans as a hypothetical product.
Actually, the supply of IP products in Brazil is still very low. Because of that, the consumers’
behavior has been studied most commonly taking the cases of organic products
(Albuquerque Júnior, Filho, Costa, & Santos, 2013); (Hoppe, Barcellos, Vieira, & Matos,
2012).
As decisive factors for the purchase and consumption of organic products, generally,
consumers point health issues, environmental concerns, and food safety and taste. Other
attributes such as brand, image, certification, traceability and price were not pointed as the
most important in that study (Hoppe, Barcellos, Vieira, & Matos, 2012). No published
economic research conducted in Brazil was found from the literature review with the focus
on consumer behavior toward IP produce. Then, the present study seeks to contribute with
future studies in this issue.
The objective of this study was examining the consumer’s intention toward purchasing
hypothetical IP labeled common beans marketed at a supermarket in Goiânia (GO) - Brazil.
We used the Theory of Planned Behavior (TPB) to attempt the goals of this study. TPB
model is one the most expected value models used in the literature, especially when one
wants to explain human behavior in food area. A meta-analysis by Armitage & Conner
(2001) confirms the efficiency of the TPB model to predict intentions and behaviors in such
area.
Besides the results regarding consumer’s behavior, this study can also provide stakeholders
of supply chain, and public administration with basic information on consumer behavior
toward IP certified products aiming to establish future strategies to disseminate IP produce
more efficiently among consumers.
4.2 METHODOLOGY
4.2.1 Theoretical Model
4.2.2 Theory of Planned Behaviour

79
Over the past 40 years, social psychology theories have gained in popularity, as is indicated
by the increased use of their applications to predict and understand social behaviors in
different domains. One of the most cited authors in this domain are Fishbein and Ajzen.
Initially, Fishbein and Ajzen (1975) proposed the Theory of Reasoned Action (TRA) that
assumes much of human behavior is dependent on human will. Later, an extension of the
TRA was proposed with the inclusion of the concept of perceived behavioral control, and
then, named Theory of Planned Behavior (TPB). This additional element, the Perceived
Behavioral Control (PBC), represents the confidence of the individual in performing the
behavior. According to Ajzen e Fishbein (1980), PBC influences the intention and even the
individual behavior.
Both theories, TRA and TPB, suggest that an individual behavior is driven by his/her
behavioral intentions to perform the behavior, and these intentions are, in turn, depends on
the other three elements: the combination of attitudes and the influence of behavioral beliefs
have on them; the normative beliefs, and control beliefs, all of which are underlying,
cognitive structures (Hattam, 2006). These beliefs are considered indirect influences on
behavioral intention. Intention itself is mediated through the direct latent factors showed in
the TPB model, i.e., attitudes (A), subjective norms (SN) and perceived behavioral control
(PBC). The Figure 4-2 illustrates the schematic representation of Theory of Planned
Behavior by Fishbein & Ajzen.
Source: (Fishbein & Ajzen, 1975).
Figure 4-2– Theory of Planned Behavior.
According to Fishbein & Ajzen (1975), attitude toward the behavior (A) is defined as “the
individual’s positive or negative feelings about performing a behavior”. This predictor
represents s a person’s overall evaluation of the behavior, and has two components: beliefs
about consequences of the behavior (behavioral beliefs) and the corresponding positive or
negative judgements about each these features of the behavior (outcome evaluations). Using
Perceived
behavioral
control (PBC)
Attitude
toward the
behavior (A)
Subjective
norm (SB)
Behavioural
Intentions (I)
Behaviour
(B)
80
the expectancy-value framework, attitudes A, are assumed to be formed from behavioral
beliefs bi, or expectations about the likelihood that an outcome is associated with an action,
weighted by the evaluation ei, of these outcomes.
Subjective norms (SN) are defined as “an individual’s perception of whether people
important to the individual think the behavior should be performed”. In other words,
subjective norms are a person’s own estimate of the social pressure to perform or not perform
the target behavior. This predictor is assumed to have two components which work in
interaction: beliefs about how other people, who may be in some way important to the
person, would like them to behave (normative beliefs) and the positive or negative
judgements about each belief. SN are constructed from normative beliefs ni, which are
weighted by the motivation to comply with them mi.
Finally, perceived behavioral control (PBC) is “the extent to which a person feels able to
enact the behaviour”. It has two aspects: how much a person has control over the behavior
and how confident a person feels about being able to perform or not perform the behavior.
PBC can be represented as the result of the control beliefs pi, an individual has that some
factor aids an action, weighted by the access ci, an individual believes he or she has to that
factor. Ajzen (2001) considers that demographic characteristics and prior experience might
be also important to the formation of intentions.
According to TPB, attitudes, jointly with aspects related to the social pressure perceived,
available infrastructure and individual’s skills are predictors of their behavioural intentions
related to a specific behaviour.
Although there is not a perfect relationship between behavioural intention and actual
behaviour, intention can be used as a proxy measure of behaviour. This observation is one
of the most important contributions of the TPB model compared to previous models of the
attitude-behaviour relationship.
It is expected that the different behaviors and situations faced by an individual change the
relative importance of A, SN and the PBC towards the prediction of the intention (Ajzen e
Fishbein, 1980).
TPB is one of the models most commonly used in research related to human behavior in the
food area. Many studies on consumer behavior of organic products have been published
under the application of the TPB, but little focused on products from integrated production.
Hoppe, Barcellos, Vieira, & Matos (2012) cite some of these studies developed in Brazil.
4.2.3 Empirical Framework, and Hypotheses
The present study focuses on consumer’s intention to purchase integrated production (IP)
certified beans. This kind of study is a complex phenomenon since cognitive and behavioural
factors vary suddenly between individuals. Thereby, whether consumers’ intent or decide to
purchase IP certified beans is a difficult task because it depends on many factors that cannot
be directly observed.
81
Several studies on consumer’s behaviour have been undertaken, but most of them with
organic products. (Kuhar, Slabe, & Juvančič, Determinants of purchasing behaviour for
organic and integrated fruits and vegetables: the case of the post socialist economy, 2012);
(Kuhar & Juvančič, 2010); (Magistris & Gracia, 2008); (Hattam, 2006); (Govindasamy &
Italia, Identifying the market environment and consumer attitudes facing the introduction of
integrated pest management produce, 1999); (Govindasamy, Italia, Thatch, & Adelaja,
2013).
Many of this studies reveal that consumer’s attitudes towards different organic food
attributes such as human health, safety, and towards the environment are the most important
factors that explain consumers’ decision-making process for organic food products. Positive
attitudes towards environmental issues are positively correlated to the buying of such foods
(Magistris & Gracia, 2008). In the present study, we expect similar behaviour but toward an
IP certified product.
With the exception of behaviour, the variables in the TPB model are psychological (internal)
constructs. Each predictor variable may be measured directly or indirectly by asking
respondents about specific behavioural beliefs and outcome evaluations. Direct and indirect
measurement approaches make different assumptions about the underlying cognitive
structures and neither approach is perfect. For the purposes of this study we decided to use
the indirect measurement according to (East R. , 2009).
Overall, the motivation to purchase IP certified food is almost the same of purchasing
organic ones. Although its different concepts of production, both IP and organic produce
offer similar attributes of quality to consumers. Thus, it can be supposing that the more
favourable health and environmental attitudes consumers have, the more likely they will buy
IP food product. In accordance with this, the proposed structural model is illustrated by the
Figure 4-3, and the hypothesis of the proposed model are defined as follow:
(H1) attitude has a direct effect on intention;
(H2) subjective norms has a direct effect on intention;
(H3) perceived behavioural control has a direct effect on intention;
Ajzen in the theory of planned behaviour stated intention is the best predictor of behaviour.
Based on this statement, the proposed model aims to verify the consumers’ intention in
purchasing IP certified beans. Intention is the cognitive representation of an individual’s
readiness to perform a given behaviour, and it is considered the intermediate antecedent of
behaviour.
In other words, TPB suggests that the more positive the A, SN and PBC, the greater the
likelihood an individual has of intending to carry out the behaviour when the opportunity
arises.
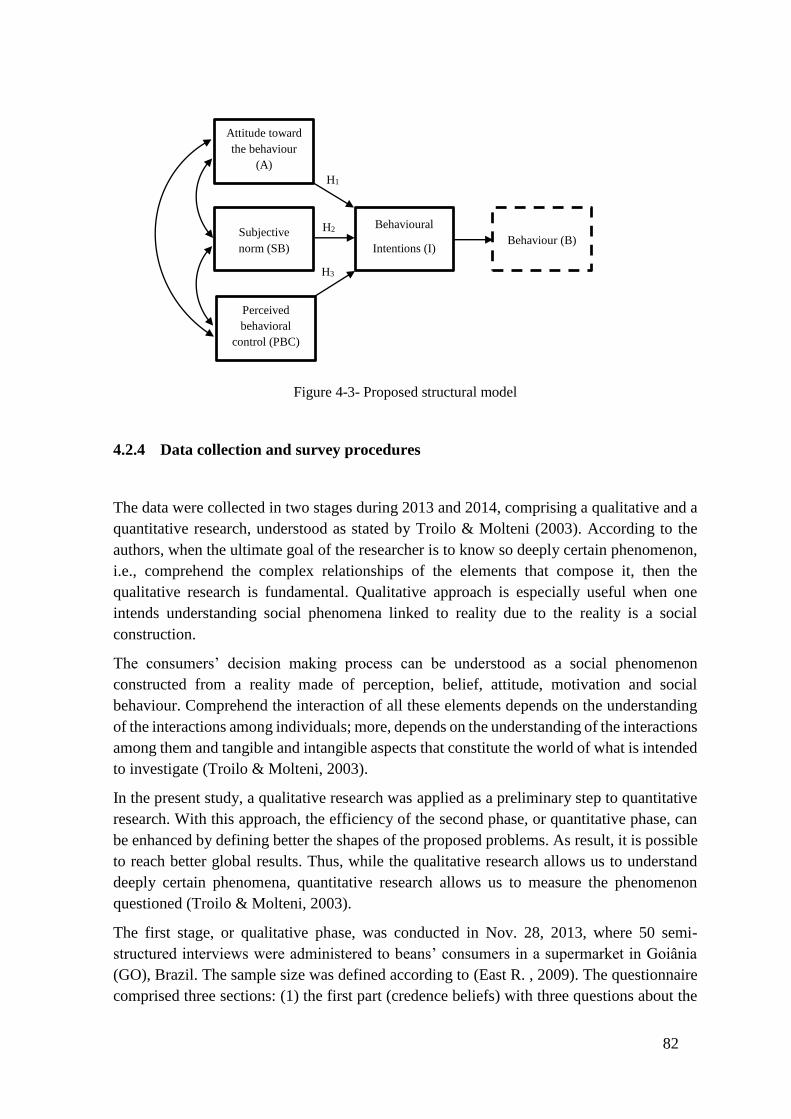
82
Figure 4-3- Proposed structural model
4.2.4 Data collection and survey procedures
The data were collected in two stages during 2013 and 2014, comprising a qualitative and a
quantitative research, understood as stated by Troilo & Molteni (2003). According to the
authors, when the ultimate goal of the researcher is to know so deeply certain phenomenon,
i.e., comprehend the complex relationships of the elements that compose it, then the
qualitative research is fundamental. Qualitative approach is especially useful when one
intends understanding social phenomena linked to reality due to the reality is a social
construction.
The consumers’ decision making process can be understood as a social phenomenon
constructed from a reality made of perception, belief, attitude, motivation and social
behaviour. Comprehend the interaction of all these elements depends on the understanding
of the interactions among individuals; more, depends on the understanding of the interactions
among them and tangible and intangible aspects that constitute the world of what is intended
to investigate (Troilo & Molteni, 2003).
In the present study, a qualitative research was applied as a preliminary step to quantitative
research. With this approach, the efficiency of the second phase, or quantitative phase, can
be enhanced by defining better the shapes of the proposed problems. As result, it is possible
to reach better global results. Thus, while the qualitative research allows us to understand
deeply certain phenomena, quantitative research allows us to measure the phenomenon
questioned (Troilo & Molteni, 2003).
The first stage, or qualitative phase, was conducted in Nov. 28, 2013, where 50 semi-
structured interviews were administered to beans’ consumers in a supermarket in Goiânia
(GO), Brazil. The sample size was defined according to (East R. , 2009). The questionnaire
comprised three sections: (1) the first part (credence beliefs) with three questions about the
Perceived
behavioral
control (PBC)
Attitude toward
the behaviour
(A)
Subjective
norm (SB)
Behavioural
Intentions (I) Behaviour (B)
H1
H2
H3
83
advantages, disadvantages in purchasing common beans produce in a sustainable way and
free of pesticide residues; and the last one, open-ended question to permit the respondent
including ultimate comments about the action; (2) the second part (normative beliefs) with
two questions related the social pressure toward the action of purchasing IP certified beans;
(3) the third part (control beliefs) with two questions related to those things that could
facilitate or make difficult complete the action of purchasing IP certified beans.
After a content analysis, the interviews’ results were used to elicit model salient beliefs, the
most important shared beliefs about IP produce found in the target sample, the beans’
consumers. The beliefs that were repeated frequently by the respondents were then included
in the quantitative instrument.
The quantitative research, or second phase, involved 160 beans’ consumers from a
hypermarket located in Goiânia city, capital of Goiás State, Brazil. We decided to interview
consumers from this type of outlet due to the fact that beans’ consumer from Goiânia usually
purchase this product in hyper/supermarkets (Wander et al., 2006; Wander, Lacerda, Freitas,
Didonet, & Didonet, 2007).
A previous pilot survey was administered to twenty-four beans’ consumers in order to test
the aspects of the survey, to make sure that every question was clear, and to identify
alternative approaches to various aspects of the survey design and execution; furthermore,
to verify the average time needed to apply each questionnaire (Stopher, 2012).
The pilot-questionnaire was designed considering two important aspects: its validation and
reliability. According to Hair, Jr. et al. (2006) reliability estimates that the item measures a
single concept or, in other words, evaluates the unidimensionality of a set of scale items;
validity is concerned with how well the concept is defined by the measure(s). The most
common used measure of reliability is internal consistency, which applies to the consistency
among the variables in a summated scale. The logics is that the individual items of the scale
should all be measuring the same construct and thus be highly intercorrelated.
Thus, the pilot-test questionnaires were evaluated in terms of the reliability of the items
applying the Cronbach’s alpha statistic and the adjustments were made in order to the
reliability statistics achievement the level of 0.70 or greater. All items were measured using
a seven-point scale with appropriate anchors. (The pilot-questionnaire structure is illustrated
in the Appendix 4-1).
The final version of the questionnaire was constructed in four sections. One of them (the
second one) was included to another research objective, then for the purposes of the present
study only three sections are described: (1) buying behaviour and consumption habits; (2)
theory of planned behaviour; and (3) SDC data. (The final-questionnaire structure is
illustrated in the Appendix 4-2).
This survey instrument was administered face-to-face by trained interviewers; they were
located in front of the beans shelves. The interviews duration took almost 15 min and was
done in Portuguese language. Two screening questions were done before starting the
interview to ensure the respondents were at least 18th years old, and also regular beans’
consumers.
84
Afterwards, the interviewers started the process using a “cheap-talk” script in order to
removes hypothetical bias for consumers relatively ignorant of the good evaluated (Lusk,
2002). In fact, this phase was crucial because local consumers were not familiarized with
this kind of product. Actually, the hypothetical certified beans were introduced as a new
concept of product for them. In this manner, the “cheap-talk” objectives were: (1) explaining
consumers about the meaning of IP label evidencing the mainly credence attributes on those
kind of beans such as “produced by sustainable practices” and “free of pesticides residues”9;
(2) how the product was hypothetic, neither actual money or real product was considered on
the survey; we have explained to consumers that they would indicate their responses like
them would if they were actually facing that options in the hypermarket.
The following elements were used to implement the survey: (a) a leaflet with a short message
to communicate consumers about the research in the outlet; (b) message inviting consumers
to the research transmitted by the audio system of the hypermarket; (c) a script (the same
used on cheap-talk) with information on IP beans; (d) package illustrations to represent the
hypothetical certified beans’ package; and (e) the questionnaire itself.
4.2.5 Statistical Procedures
The purposes of the present study were verifying the consumers’ intention of purchasing IP
certified beans as soon as available for sale in the food market. A convenience sample was
chosen due to budget and time constraints, even though it was considered the Hair Jr. et al
(2006) orientation to determine the sample size when one intends to use the technique of
Structural Equation Modelling (SEM). The ideal situaton would be at least five respondents
for each item. Considering that there are 12 items in the final version questionnaire, then the
number of respondents should be at least 60.
Two diagnostic measures were used to assess internal consistency on the dataset. Firstly, one
relate to each separate item, including the item-to-total correlation and the inter-item
correlation; the parameter in this case is that the item-to-total correlations exceed 0.50 and
that the inter-item correlations exceed 0.30. The second diagnostic measure is related to the
entire scale. In this case, the consistency of the entire scale can be verified by the reliability
coefficient with Cronbach’s Alpha, one of the most applied reliability’s estimators (See
Appendix 4-2). It ranges from 0 to 1, with values of 0.60 to 0.70 deemed the lower limit of
acceptability (Hair, Jr. et al, 2006).
First of all, a confirmatory factor analysis (CFA) was used to identify the relationship
between the factors and their measurement variables, assuming that some prior knowledge
about the base structure of the latent variables already exists. It is a procedure used to test
hypotheses about the structure of a data set. In other words, the confirmatory approach was
9 Special care was taken to avoid confounding with organic products that are pesticides-free.
85
applied to determine if the structural (or the path) model fit the data. The software SPSS®
v.22 was used to process the data.
To proceed with the CFA it was used the technique of Structural Equation Modelling (SEM)
by using IBM AMOS® (Analysis of Moment Structures), which simultaneously estimates
the model, including latent and observed variables, exogenous and endogenous variables,
and the paths to these variables (Adrian, Norwood, & Mask, 2005). This technique provides
the appropriate and most efficient estimation for a series of separate multiple regression
equations estimated simultaneously. SEM is defined as “a family of statistical techniques
which purpose is study complex relationships among variables, where some of them can be
hypothetical or unobserved” (Kline, 2011). The SEM is the most used statistical technique
to analyze TAM models, according to prior researches. The maximum likelihood estimation
(MLE) was applied since it is the most common SEM estimation procedure since is more
efficient and unbiased for multivariate normality assumption.
There are some advantages in using SEM; two multivariate techniques, factor analysis and
multiple regression analysis are combined in a single procedure. As result, this technique
permits: (1) estimating multiple and interrelated dependence relationships; (2) representing
unobserved concepts in these relationships and correct for measurements error in the
estimation process; (3) defining a model to explain the entire set of relationships (Hair, Jr.,
et al., 2006).
Two basic components characterize the SEM, according to Hair, Jr., et al. (2006). The first
is the structural model that is a path model which relates independent to dependent variables,
even when a dependent variable becomes an independent variable in other relationships. In
other words, the structural model represents the interrelationships of variables between
constructs. In practice, the structural model relates the hypothesized model’s constructs
known also as latent variables that are concepts that can be represented by observable or
measurable variables. It is measured indirectly by examining consistency among multiple
measured variables or indicators. The second component is the measurement model that
enables the analyst to use several variables or indicators for a single independent or
dependent variable.
In the latent construct, two components should be considered. Firstly, the exogenous
constructs that are the latent, multi-item equivalent of independent variables. Visually in the
model, exogenous constructs does not have any paths (one-headed arrows) from any other
construct or variable going into it. The secondo component are the endogenous constructs
that are latent, multi-item equivalent to dependent variables; visually in the model,
endogenous constructs are represented by a path to an endogenous construct from an
exogenous construct (or from another endogenous construct as well).
The relationship between constructs (or latent variables) is represented by the paths’
coefficients on the path diagram (Adrian, Norwood, & Mask, 2005). Path diagram is the
visual portrayal of the model that is more convenient to show the interrelationships between
variables. In a measurement sense, dependence relationships occur from constructs to
86
variables. In a structural sense, dependence relationships occur between constructs (Hair, Jr.,
et al., 2006).
On the path diagram, manifest variables are shown in square or rectangular boxes; latent
variables (and measurement errors) are shown through ovals or circles; causality
relationships are indicated through straight arrows; and, correlation without causality is
shown through a curved arrow (Mazzocchi, 2008).
The convergent validity was used to test the construct validity of the model. According to
Hair et al., (2006) a rule of thumb is: (a) standardized factor loadings (i.e. path coefficients/λ)
should exceed 0.5, ideally, 0.7 or higher; (b) construct reliabilities (CR) should exceed 0.7
or higher, to indicate internal consistency; and (c) average variance extracted (AVE) should
be 0.5 or greater.
Goodness-of-fit (GOF) for the CFA is done by comparing the results of data analysis with
the recommended values on several criteria. GOF indicates how well the specified model
reproduces the covariance matrix among the indicator items, i.e., the similarity of the
observed and estimated covariance matrices. The closer the values of the estimated
covariance matrix and the actual observed covariance matrix, the better the model is said to
fit. Thus, the implied null hypothesis of SEM is that the observed sample and SEM estimated
covariance matrices are equal, meaning that the model fits perfectly.
Several statistical tests are used to determine how well the model fits to the data or the
goodness of fit (GOF) measures. The direct measure of how well the model specified by the
researcher reproduces the observed data is given by the most widely used absolute fit indices:
(1) χ2 test – this is the fundamental measure of fit; it quantifies the differences between the
observed and estimated covariance matrices (S - ∑k). To the extent that perfect fit is not the
case, the χ2 value increases (i.e., we look for low χ2 value). The probability that any observed
sample and SEM estimated covariance matrices are actually equal in a given population is
represented by the traditional p-value. In such case, smaller its value, the greater the chance
that observed sample and SEM estimated covariance matrices are not equal. Then, with SEM
the p-value for the χ2 test should not be small (statistically significant);
(2) GFI (goodness-of-fit index) – measures the goodness of fit between the hypothesized
model and the observed covariance matrix. The GFI was an early attempt to produce a fit
statistic that was less sensitive to sample size. The possible range of GFI values is 0-1, with
higher values indicating better fit (some authors propose the cut-off value of 0.9: ≥ 0.9);
(3) AGFI (adjusted goodness of fit index) – the same GFI proposal but considers the number
of indicators of each latent variable; the cut-off value is the same of GFI: ≥ 0.9;
(4) RMSR (root means of the square residual): an average of the residuals between individual
observed and estimated covariance and variance terms. The SRMR is the standardized
alternative to permit comparing fit across models. Lower RMSR and SRMR values represent
better fit and higher values represent worse fits. Sometimes theses indices are known as
badness-to-fit measures in which high values are indicative of poor fit. The average value of
SRMR is 0; a predicted covariance lower than the observed value results in a positive residual
while a predicted covariance larger than observed results in a negative residual. Values below
-4.0 or above 4.0 should be examined carefully.

87
(5) RMSEA (root mean square error of approximation) – indicates the discrepancy between
the hypothesized model and the population covariance matrix; avoids problems of sample
size. It is a useful measure to help the analysis of models with large sample (generally, more
than 500 respondents) or large number of variables. Lower RMSEA values indicate better
fit (below 0.1 for most acceptable models).
Besides the absolute fit indices, some incremental fit indices are also useful for the model
analysis. This class of indices permits to verify how well a specified model fits relative to
some alternative baseline model referred to as a null model, one that assumes all observed
variables are uncorrelated. Some of these indices are:
(1) NFI (normed fit index) – it is a ratio of the difference in the χ2 value for the fitted model
and a null model divided by the χ2 value for the null model; indicates the discrepancy
between the Chi-squared value of the hypothesized model and that of the null model. It
ranges between 0 and 1 and greater the value indicates better fit (cut-off value is 0.9: ≥ 0.9);
(2) CFI (comparative fit index) - it is derived from the NFI in an effort to include model
complexity in a fit measure. Indicates the discrepancy between the data and the hypothesized
model taking in account the problems of sample size; its interpretation is the same of NFI;
(3) TLI (Tucker Lewis Index) – it is one of the most often used indices together with CFI
and provide very similar results; higher value that approach 1 suggests a better fit than a
model with a lower value; and,
(4) RNI (relative non-centrality Index) – like the other incremental fit indices, higher value
represents better fit in a range between 0 and 1; RNI’s lower than 0.9 are usually not
associated with good fit.
Finally, when the focus is on comparison among a set of competing models, the parsimony
fit indices are indicated. Conceptually, these indices are similar to the notion of an adjusted
R2 in the sense they relate model fit to model complexity. Because of its foundation, these
indices are not useful in assessing the fit of a single model. The most widely applied
parsimony fit indices are the parsimony goodness-to-fit index (PGFI) and parsimony normed
fit index (PNFI). The value range between 0 and 1 and the model with a higher value is
preferable.
4.3 RESULTS AND DISCUSSION
4.3.1 Consumers Characteristics and Consumption Habits
The Consumers’ socio-demographic characteristics (SDC) are reported in the table 4-1. The
elicited SDC profile shows that 63% of the respondents are female. This result converges to
that reported by Wander, Basinello, & Ricardo (2006) in which the profile of rice and beans’
consumers from the Metropolitan Region of Goiânia was described. The authors also had a
high female response rate (65,6%). According to Blessa (2003) females are the majority
hypermarkets and supermarkets’ frequent consumers in Brazil.

88
The mode of age is between 56-65 years (35%) while the average age is between 36-50 years
representing 25,6% of the respondents; basically, the same range (between 36-45 years)
reported by Wander, Basinello, & Ricardo (2006), and by Wander, Lacerda, Freitas,
Didonet, & Didonet (2007) in their studies in the same place.
The majority of the respondents are married (71,3%) with family size up to 5 people (86,9%),
and 65% reported having children up to 12 years at home. Wander, Basinello, & Ricardo
(2006) reported family size between 3-5 people, and 80,1% of their sample had at least one
children up to 16 years old. According to Moura, Silva, & Batalha (2006) who characterized
the profile of retail’s consumers from Goiânia (among other cities), the number of household
people has been diminishing. This evidence can influence their habits of consume in several
ways such as lower predisposition to hold monthly food shopping in large supermarkets, and
greater openness to higher value-added and convenient foods. The authors also mention that
households with 2-5 people prefer to make their purchases in hyper/supermarkets.
In terms of level of education, the largest group is illustrated by the mode that represents the
group of people who reported have completed the second degree (36,3%) followed by the
high school group (33,8%). Similarly, from the findings by Wander, Basinello, & Ricardo
(2006), the same two groups were the most frequent. Consumers with high school were
35,8% followed by that with completed second degree (30,3%). We found that literally
people represents only 1,3% of the respondents and nobody reported do not read or right.
Normally, it is expected that people who have a higher level of education are more likely to
respond to a survey, as they understand the necessity of such studies.
Employed people are also the majority (46,25%) followed by retired group (18,75%), and
household workers (14,38%). Two important groups in terms of power of acquisition, i.e.,
the autonomous and professional workers (represented by doctors, dentists, lawyers, etc)
sum 15,62%. Students (up 18 years) were 3,125% and 1,37% unemployed people.
It is possible to grasp several things about the data on household income such as the fact that
the largest group is the one with 3-6 salaries (equivalent to R$2.173,00 - R$4.334,00 monthly
income) that is equivalent to social classes “B2” and “C”, according to the Brazilian
Research Company Association cited by Moura, Silva, & Batalha (2006). As observed,
23,1% of respondents did not report their income.
However, when the non-reported income was excluded to the statistical analysis, the results
did not change, and the median maintained in the same interval of 6-8 salaries (R$4.335,00
- R$ 5.792,000). The most frequent household income reported by Wander, Basinello, &
Ricardo (2006) was 3-5 salaries (29,2%) followed by the group with 5-10 salaries (23,7%).
The higher the consumers’ income, the most important safety food attribute is considered,
because this category of consumers has higher levels of education and access to information
(Lima-Filho, et al., 2013).
Regarding the purchasing and consumption habits, 83% of the respondents self-declared as
being the responsible by household’s food shopping. Beans are purchased almost one time
a month (54%) or two times a month (26%) by the respondents, basically in hypermarkets
(54%) and supermarkets (39%).

89
Table 4-1– Summary of Survey Results: SDC characteristics (N=160)
Characteristics Valid Percent (%)
Gender
Male 36,9
Female 63,1
Age (Median) (3)
1=18-35 23,1
2=36-50 25,6
3=51-65 35,0
4=Over 65 16,3
Marital status
Married 71,3
Single 18,1
Other (widowed, separated, etc.) 10,6
Family size
Less than 5 people 86,9
More than 5 people 13,1
Having children ≤12 years old at home 35,0
Level of education (Median) (6)
1=Does not know how to read or to write 0,0
2=Literally 1,3
3=First degree (uncompleted) 4,4
4=First degree (completed) 8,1
5=Second degree (uncompleted) 5,6
6=Second degree (completed) 36,3
7=High school 33,8
8=Post grad 10,6
Job status (Median) (2)
1=Employed 46,3
2=Household worker 14,4
3=Professional (superior degree) 5,6
4=Autonomous 10,0
5=Student 3,1
6=Unemployed 1,9
7=Retired 18,8
Household income1 (Median) (3)
1=1-3 salaries 22,8
2=3-6 salaries 26,8
3=6-8 salaries 13,8
4=8-10 salaries 13,0
5=10-20 salaries 14,6
6=>20 salaries 8,9 1/Note: Minimum salary value in 2014 = R$ 724,00.
Farmers market, neighborhood markets, grocery shops and others sum 7% of the preferred
outlets to purchase common beans. Our findings are very similar of that reported by other
studies on beans’ consumer’s habits in the same municipality. In terms of beans’
consumption, 91% of the respondents reported a daily consumption of beans; this result
confirms the importance of beans in the Brazilian diet.
We have also questioned consumers whether they trust in all of the beans label information,
and approximately 57% does not trust completely on that; only 43% of them believe that the
information on the beans’ label are reliable. This result indicates that one more information
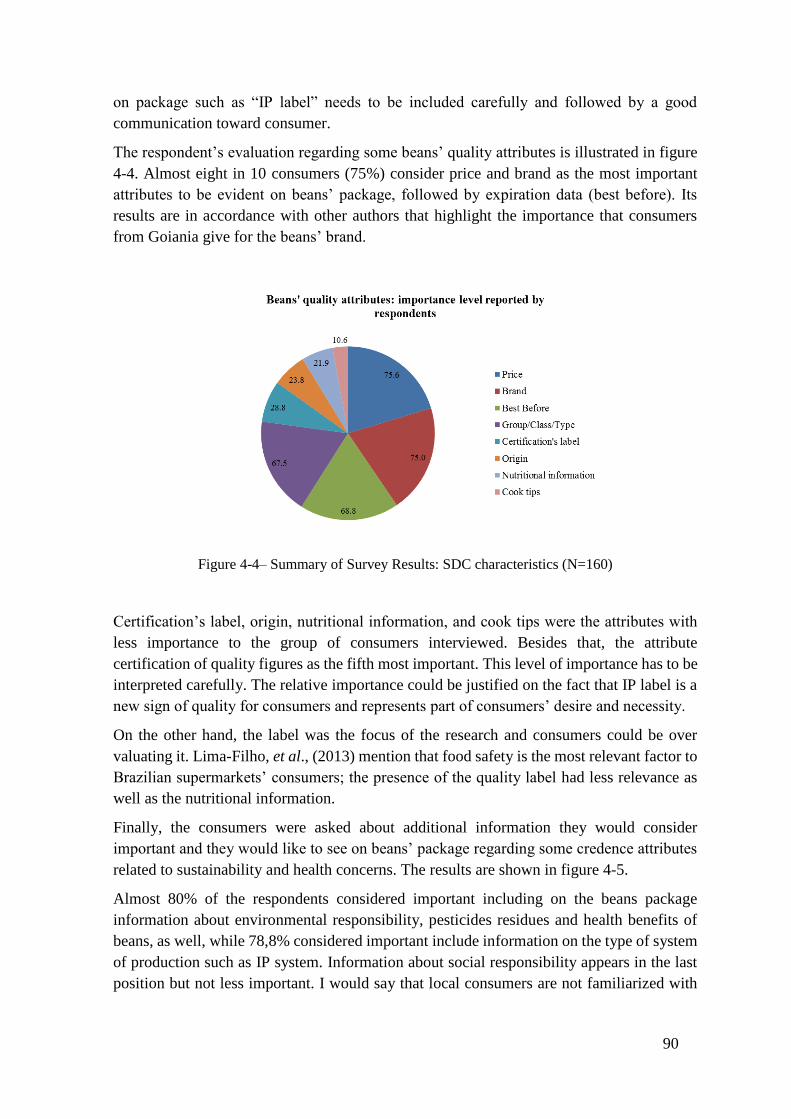
90
on package such as “IP label” needs to be included carefully and followed by a good
communication toward consumer.
The respondent’s evaluation regarding some beans’ quality attributes is illustrated in figure
4-4. Almost eight in 10 consumers (75%) consider price and brand as the most important
attributes to be evident on beans’ package, followed by expiration data (best before). Its
results are in accordance with other authors that highlight the importance that consumers
from Goiania give for the beans’ brand.
Figure 4-4– Summary of Survey Results: SDC characteristics (N=160)
Certification’s label, origin, nutritional information, and cook tips were the attributes with
less importance to the group of consumers interviewed. Besides that, the attribute
certification of quality figures as the fifth most important. This level of importance has to be
interpreted carefully. The relative importance could be justified on the fact that IP label is a
new sign of quality for consumers and represents part of consumers’ desire and necessity.
On the other hand, the label was the focus of the research and consumers could be over
valuating it. Lima-Filho, et al., (2013) mention that food safety is the most relevant factor to
Brazilian supermarkets’ consumers; the presence of the quality label had less relevance as
well as the nutritional information.
Finally, the consumers were asked about additional information they would consider
important and they would like to see on beans’ package regarding some credence attributes
related to sustainability and health concerns. The results are shown in figure 4-5.
Almost 80% of the respondents considered important including on the beans package
information about environmental responsibility, pesticides residues and health benefits of
beans, as well, while 78,8% considered important include information on the type of system
of production such as IP system. Information about social responsibility appears in the last
position but not less important. I would say that local consumers are not familiarized with
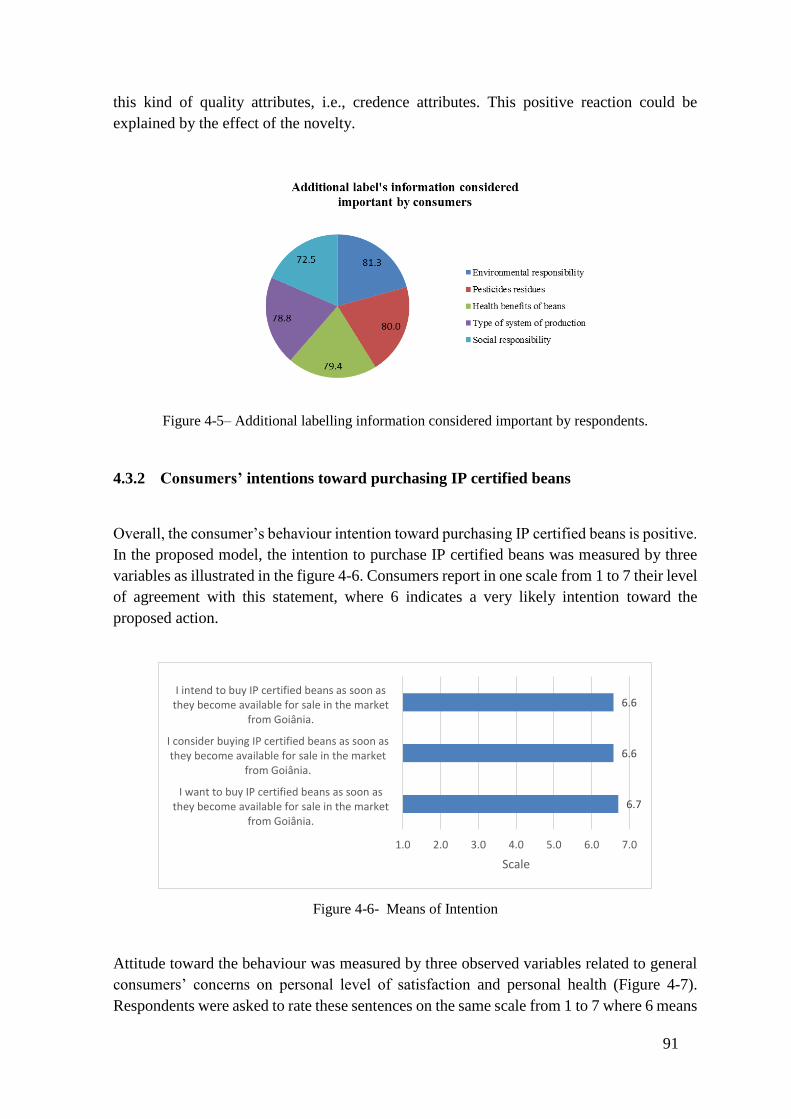
91
this kind of quality attributes, i.e., credence attributes. This positive reaction could be
explained by the effect of the novelty.
Figure 4-5– Additional labelling information considered important by respondents.
4.3.2 Consumers’ intentions toward purchasing IP certified beans
Overall, the consumer’s behaviour intention toward purchasing IP certified beans is positive.
In the proposed model, the intention to purchase IP certified beans was measured by three
variables as illustrated in the figure 4-6. Consumers report in one scale from 1 to 7 their level
of agreement with this statement, where 6 indicates a very likely intention toward the
proposed action.
Figure 4-6- Means of Intention
Attitude toward the behaviour was measured by three observed variables related to general
consumers’ concerns on personal level of satisfaction and personal health (Figure 4-7).
Respondents were asked to rate these sentences on the same scale from 1 to 7 where 6 means
6.7
6.6
6.6
1.0 2.0 3.0 4.0 5.0 6.0 7.0
I want to buy IP certified beans as soon asthey become available for sale in the market
from Goiânia.
I consider buying IP certified beans as soon asthey become available for sale in the market
from Goiânia.
I intend to buy IP certified beans as soon asthey become available for sale in the market
from Goiânia.
Scale
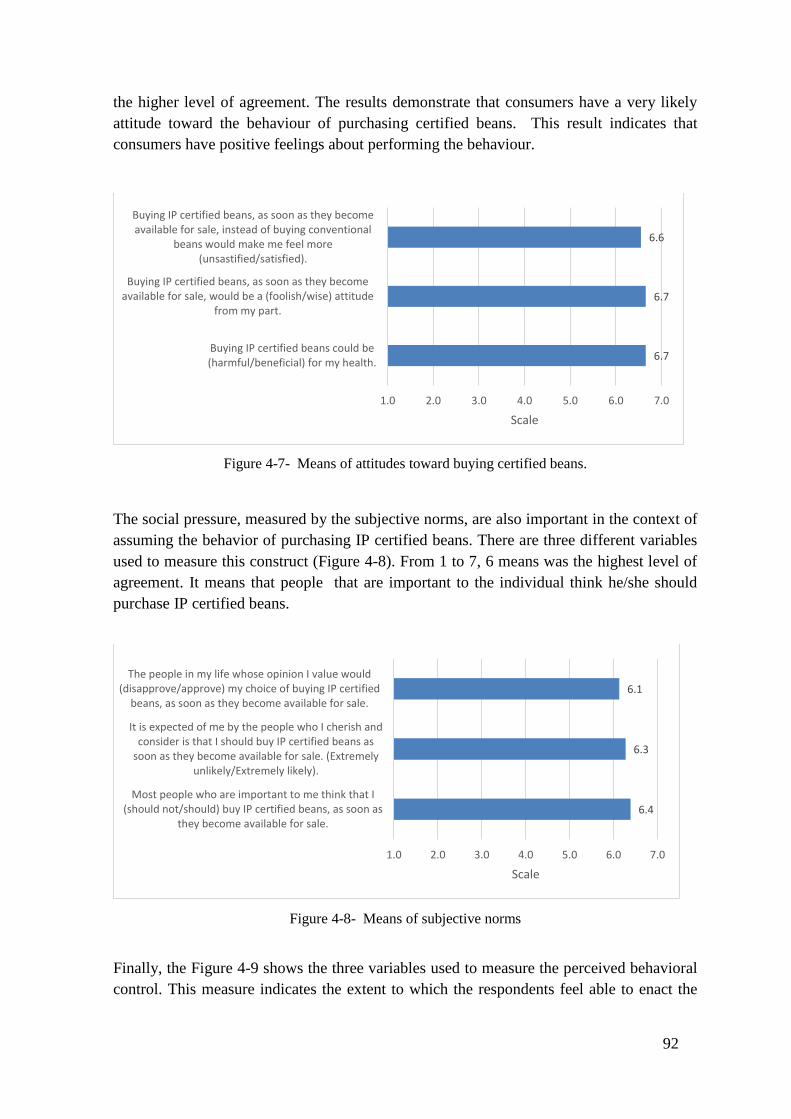
92
the higher level of agreement. The results demonstrate that consumers have a very likely
attitude toward the behaviour of purchasing certified beans. This result indicates that
consumers have positive feelings about performing the behaviour.
Figure 4-7- Means of attitudes toward buying certified beans.
The social pressure, measured by the subjective norms, are also important in the context of
assuming the behavior of purchasing IP certified beans. There are three different variables
used to measure this construct (Figure 4-8). From 1 to 7, 6 means was the highest level of
agreement. It means that people that are important to the individual think he/she should
purchase IP certified beans.
Figure 4-8- Means of subjective norms
Finally, the Figure 4-9 shows the three variables used to measure the perceived behavioral
control. This measure indicates the extent to which the respondents feel able to enact the
6.7
6.7
6.6
1.0 2.0 3.0 4.0 5.0 6.0 7.0
Buying IP certified beans could be(harmful/beneficial) for my health.
Buying IP certified beans, as soon as they becomeavailable for sale, would be a (foolish/wise) attitude
from my part.
Buying IP certified beans, as soon as they becomeavailable for sale, instead of buying conventional
beans would make me feel more(unsastified/satisfied).
Scale
6.4
6.3
6.1
1.0 2.0 3.0 4.0 5.0 6.0 7.0
Most people who are important to me think that I(should not/should) buy IP certified beans, as soon as
they become available for sale.
It is expected of me by the people who I cherish andconsider is that I should buy IP certified beans as
soon as they become available for sale. (Extremelyunlikely/Extremely likely).
The people in my life whose opinion I value would(disapprove/approve) my choice of buying IP certified
beans, as soon as they become available for sale.
Scale

93
behavior of purchasing IP certified beans. Similarly, the means 6 indicates a high level of
agreement of the consumers related to the variables used. Although consumers consider
important the opinion of the people that are important to them, the choice of purchasing IP
certified beans seems not depending the others. Clearly and reliable information about
certified beans is also very important to the consumers feel confident in performing the
behavior.
Figure 4-9- Means of perceived behavioral control
4.3.3 Measurements of Constructs and testing the structural model
To analyse the factors affecting the intention to purchase IP certified beans, a SEM approach
was used. SEM was employed to examine the general fit of the proposed model and test the
hypothesis (see the proposed model in Figure 4-3). A confirmatory factor analysis was
applied to assess the measurement model and the SEM analysis to examine the overall
relationships among the constructs.
The adequacy of the measurement model was evaluated by the criteria of overall fit with the
data, the reliability of each of the constructs evaluated by the α coefficient, and the indicator
loadings statistical significance. The analysis began with a general specification to which
explanatory variables were dropped or added in an attempt to increase the number of
significant variables and the goodness of fit. A total number of 6 indicators variables were
deleted in the final model (see Appendix 4-2). Since the number of items in the original
proposed model was reduced, most of the explanatory variables was remained even if was
not significant.
The consistency of the measurement was evaluated by the reliability test. The table 4-2
indicates the results for the measurement model.
6.7
6.3
6.3
1.0 2.0 3.0 4.0 5.0 6.0 7.0
Buying IP certified beans, as soon as they becomeavailable for sale, will be an entirely my choice.
(Completely disagree/Completely agree).
If I want, I can buy IP certified beans, instead of theconventional ones, as soon as they become available
for sale. (Extremely unlikely/Extremely likely)
Having clearly and reliable information about IPcertified beans available for sale would facilitate my
decision of purchasing. (Completelydisagree/Completely agree).
Scale

94
Table 4-2- Results for the measurement model.
(N=160; N. of Items=12) Descriptive
Statistics Reliability Statistics
Cod. Variables Mean Std.
Dev.
Standardized
factor
loading (g)
Cronbach's
Alpha
Based on
Std. Items
Attitude (A) / CR = 0.74 / AVE = 0.58 α = 0.679
(A.4)
Buying IP certified beans, as soon as
they become available for sale, would be
a (foolish/wise) attitude from my part.
6.7 .7934 .787
(A.6)
Buying IP certified beans, as soon as
they become available for sale, instead
of buying conventional beans would
make me feel more
(unsatisfied/satisfied).
6.6 1.0687 .738
Subjective Norm (SN) / CR = 0.82 /
AVE = 0.69 α = 0.85
(NS.2)
It is expected of me by the people who I
cherish and consider is that I should buy
IP certified beans as soon as they
become available for sale. (Extremely
unlikely/Extremely likely).
6.3 1.1435 .854
(NS.3)
The people in my life whose opinion I
value would (disapprove/approve) my
choice of buying IP certified beans, as
soon as they become available for sale.
6.1 .8477 .807
Perceived Behavioral control (PBC) /
CR = 0.59 / AVE = 0.33 α = 0.593
(CP.3)
Having clearly and reliable information
about IP certified beans available for
sale would facilitate my decision of
purchasing. (Completely
disagree/Completely agree).
6.3 .7519 .584
(CP.6)
Buying IP certified beans, as soon as
they become available for sale, will be
an entirely my choice. (Completely
disagree/Completely agree).
6.7 .7786 .570
(CP.5)
If I want, I can buy IP certified beans,
instead of the conventional ones, as soon
as they become available for sale.
(Extremely unlikely/Extremely likely)
6.3 1.1825 .564
Intention (I) / CR = 0.89 / AVE = 0.74 α = 0.893
(I.1)
I consider buying IP certified beans as
soon as they become available for sale in
the market from Goiânia.
6.6 .9935 .862
(I.2)
I want to buy IP certified beans as soon
as they become available for sale in the
market from Goiânia.
6.7 .8437 .864
(I.3)
I intend to buy IP certified beans as soon
as they become available for sale in the
market from Goiânia.
6.6 1.0369 .846

95
The results indicate that only the α value of the measuring scale perceived behavioural
control did not achieve the recommended level of 0.60 – 0.70. All the factor loadings are
greater than 0.5 indicating that the fit of measurement model is quite reasonable.
Furthermore, composite reliabilities (CR) suggest adequate reliability for all the parameters
except PBC (smaller than 0.7). By using the AVE measure, the same construct PBC indicates
some problems in terms of construct validity since its value is smaller than the baseline equal
0.5.
The structural model was estimated using the maximum likelihood estimation procedure
with the IBM AMOS® 21 computer software. The model has 25 variables, of which 10
observed variables, 15 unobserved variables, 14 exogenous, and 11 endogenous variables.
The results of SEM Analysis (standardized) are illustrated in Figure 4-10 and Table 4-5.
Standardized structural coefficient estimates are used to compare the relative importance of
the independent variables.
Then, overall, model fit and measurement model fit assessments were considered in the
model fit examination. The recommendation is using three to four fit indices and at least one
incremental and one absolute index, in addition to the χ2 value and the associated degrees of
freedom. Commonly, a model reporting the χ2 value and degrees of freedom, the CFI, and
the RMSEA will often provide sufficient unique information to evaluate a model (Hair, Jr.,
et al., 2006). The degrees of freedom are a measure of the discrepancy between the available
number of observations and the constraints associated with the estimation of unknown
parameters. The positive df (29) indicates that the model is over-identified, i.e., there are
more elements in the covariance matrix than parameters to be estimated. In this case,
estimates are possible but might be not unique nor optimal. The table 4-3 brings the model
fit summary.
Table 4-3– Model fit summary
Measures Estimated Model Acceptable
values
χ2 80.563 ↓ value
df 29 ***
p-value .000 ↑ value
GFI .908 ≥ .90
CFI .934 ≥ .90
RMSEA .106 < .08
CDMIN/df 2.778 1 - 5
The Chi-square statistic (80.563) is high and significant (p-value 0.000). Considering that
the implied null hypothesis of SEM is that the observed sample and SEM estimated
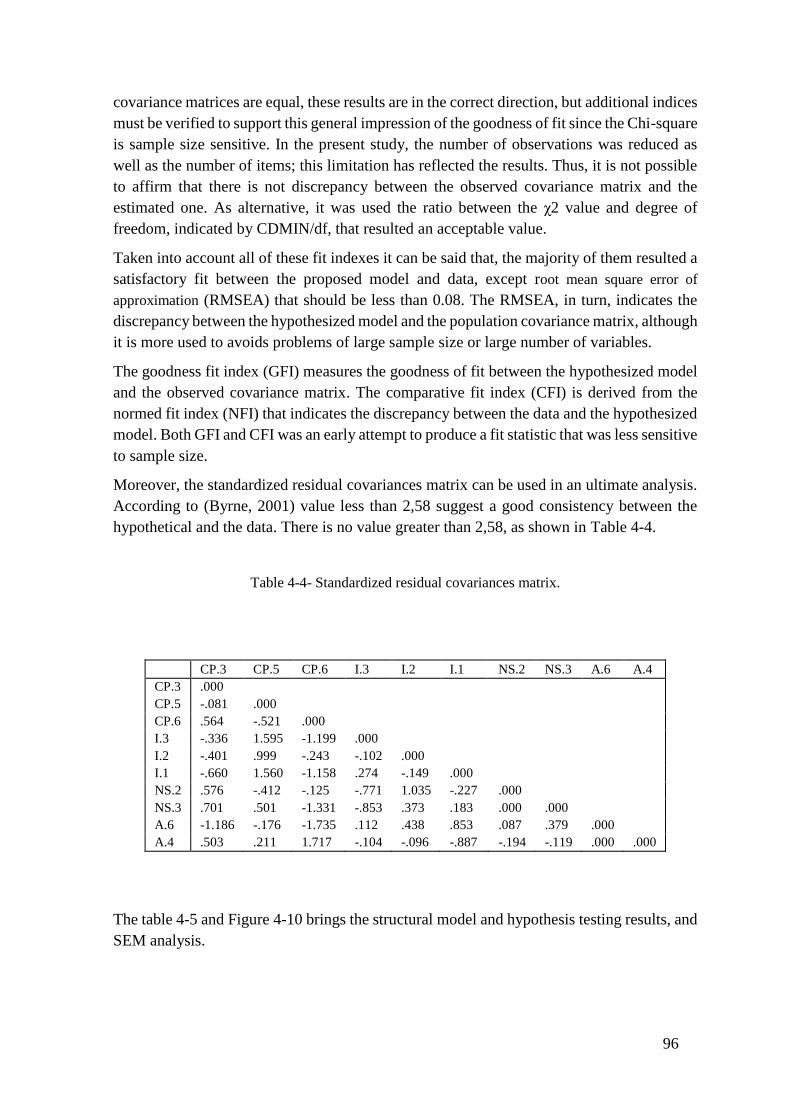
96
covariance matrices are equal, these results are in the correct direction, but additional indices
must be verified to support this general impression of the goodness of fit since the Chi-square
is sample size sensitive. In the present study, the number of observations was reduced as
well as the number of items; this limitation has reflected the results. Thus, it is not possible
to affirm that there is not discrepancy between the observed covariance matrix and the
estimated one. As alternative, it was used the ratio between the χ2 value and degree of
freedom, indicated by CDMIN/df, that resulted an acceptable value.
Taken into account all of these fit indexes it can be said that, the majority of them resulted a
satisfactory fit between the proposed model and data, except root mean square error of
approximation (RMSEA) that should be less than 0.08. The RMSEA, in turn, indicates the
discrepancy between the hypothesized model and the population covariance matrix, although
it is more used to avoids problems of large sample size or large number of variables.
The goodness fit index (GFI) measures the goodness of fit between the hypothesized model
and the observed covariance matrix. The comparative fit index (CFI) is derived from the
normed fit index (NFI) that indicates the discrepancy between the data and the hypothesized
model. Both GFI and CFI was an early attempt to produce a fit statistic that was less sensitive
to sample size.
Moreover, the standardized residual covariances matrix can be used in an ultimate analysis.
According to (Byrne, 2001) value less than 2,58 suggest a good consistency between the
hypothetical and the data. There is no value greater than 2,58, as shown in Table 4-4.
Table 4-4- Standardized residual covariances matrix.
CP.3 CP.5 CP.6 I.3 I.2 I.1 NS.2 NS.3 A.6 A.4
CP.3 .000
CP.5 -.081 .000
CP.6 .564 -.521 .000
I.3 -.336 1.595 -1.199 .000
I.2 -.401 .999 -.243 -.102 .000
I.1 -.660 1.560 -1.158 .274 -.149 .000
NS.2 .576 -.412 -.125 -.771 1.035 -.227 .000
NS.3 .701 .501 -1.331 -.853 .373 .183 .000 .000
A.6 -1.186 -.176 -1.735 .112 .438 .853 .087 .379 .000
A.4 .503 .211 1.717 -.104 -.096 -.887 -.194 -.119 .000 .000
The table 4-5 and Figure 4-10 brings the structural model and hypothesis testing results, and
SEM analysis.
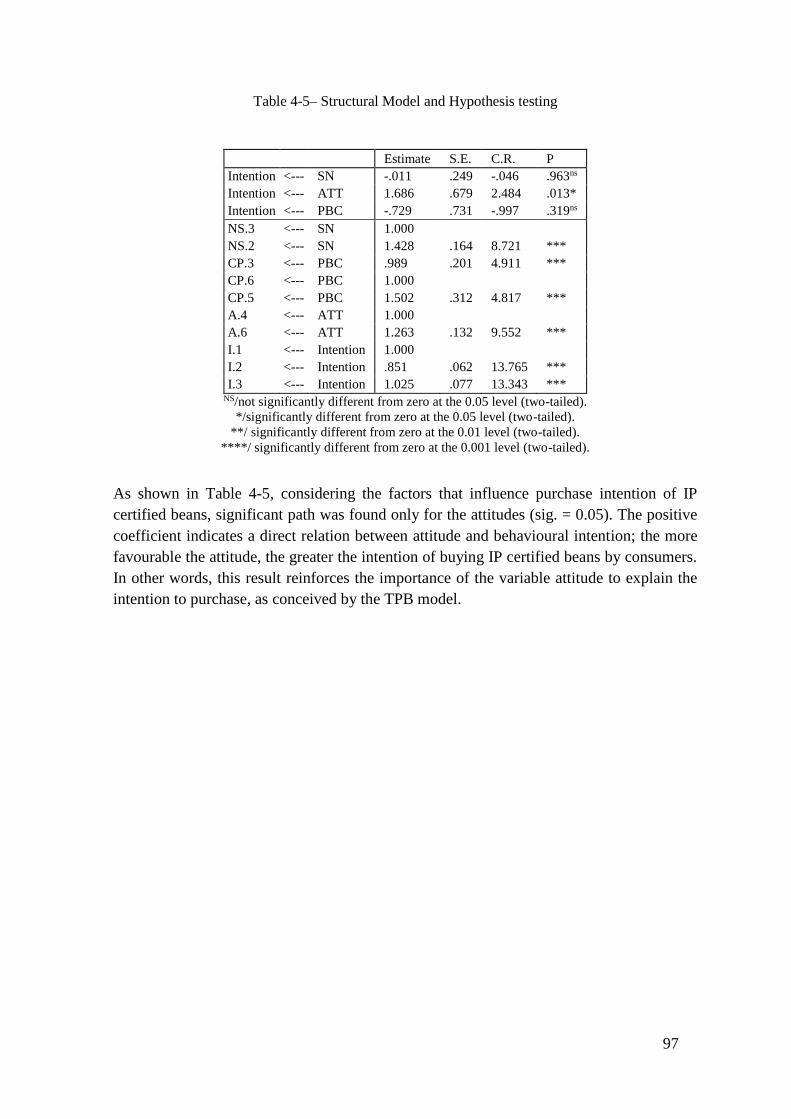
97
Table 4-5– Structural Model and Hypothesis testing
Estimate S.E. C.R. P
Intention <--- SN -.011 .249 -.046 .963ns
Intention <--- ATT 1.686 .679 2.484 .013*
Intention <--- PBC -.729 .731 -.997 .319ns
NS.3 <--- SN 1.000
NS.2 <--- SN 1.428 .164 8.721 ***
CP.3 <--- PBC .989 .201 4.911 ***
CP.6 <--- PBC 1.000
CP.5 <--- PBC 1.502 .312 4.817 ***
A.4 <--- ATT 1.000
A.6 <--- ATT 1.263 .132 9.552 ***
I.1 <--- Intention 1.000
I.2 <--- Intention .851 .062 13.765 ***
I.3 <--- Intention 1.025 .077 13.343 *** NS/not significantly different from zero at the 0.05 level (two-tailed).
*/significantly different from zero at the 0.05 level (two-tailed).
**/ significantly different from zero at the 0.01 level (two-tailed).
****/ significantly different from zero at the 0.001 level (two-tailed).
As shown in Table 4-5, considering the factors that influence purchase intention of IP
certified beans, significant path was found only for the attitudes (sig. = 0.05). The positive
coefficient indicates a direct relation between attitude and behavioural intention; the more
favourable the attitude, the greater the intention of buying IP certified beans by consumers.
In other words, this result reinforces the importance of the variable attitude to explain the
intention to purchase, as conceived by the TPB model.

98
Figure 4-10– Results of SEM Analysis (standardized).
Moreover, as in this research the attitudes were positive and resulted high means, it can be
said that such consumers of certified beans have very favourable attitudes towards these
products and that their beliefs strongly influence their choices.
The subjective norms and perceived behavioural control had no significant effect on
intention of purchasing IP certified beans.
With regard to the subjective norms, the results were similar to those found in other studies
in Brazil (Barcellos, 2007). That is, for the interviewed consumers, "people they respect and
admire " are not significant elements in determining the intention of purchasing certified
beans, possibly by the fact that this product is seen as a type of product that brings benefits
to health. Additionally, the consumer has control over his own acts of choice and shopping.

99
4.4 CONCLUSIONS AND RECOMMENDATIONS
The results of this study reveal that the interviewed consumers have a positive attitude
toward the purchasing of IP certified bean, although this product is not yet available in the
local even the Brazilian outlets. This positive might be associated with an unmet demand for
safe food, free of pesticide residue, and produced in a sustainable way.
Additionally, the results suggest that a clear and reliable information about the certification
label may favour the process of certified beans marketing since the consumer will have an
easy access of IP label’s information. Thus, they will be more confident in what they are
buying and consuming. Moreover, this can help the process of expansion of the Brazilian
market of certified food products. According to Rocha (2010) cited by Hoppe, Barcellos
Vieira & Matos (2012), there is a potential market for this type of product in the big city
centres of Brazil
Furthermore, the choice and the decision of purchasing certified beans seems to be directly
related to the price that will be practiced in the market. Therefore, the respondents do not
feel completely able to perform the action of purchasing certified beans because the action
of purchasing will be subject to the prices. If the differential price of the certified beans is
greater than the consumer expectations, the consumer probably may opt for the conventional
beans, as alternative.
The results indicate that the theoretical model based on the TPB used to explain the intention
behaviour of purchasing certified beans resulted reasonable fit indices, but with only some
of the relations among constructs was consistent with the theory. Thus, the results showed
that the proposed model was adequate for explaining the consumer behaviour toward the IP
certified beans purchasing. As exceptions, one can refer the constructs subjective norms and
perceived behavioural control toward the intention of purchasing.
However, the application of this research with a higher number of respondents could
possibly produce more robust results. It is necessary, also, to recognize the limitations of any
survey instrument when applied to different cultural contexts, especially in the case in which
the central element is related to psychological issues.
The subjective norms, in this study, were not significant in the model, indicating that the
opinion of others is not a decision-making factor for the intention of buying certified beans,
in the point of view of the surveyed consumers. This construct was measured by only two
indicators, which may have affected their performance in the modelling.
In any case, this research used a case of a hypothetical product, not known by the surveyed
consumers. This factor may also have influenced the consumer's decision-making in relation
to some issues raised in the model.
The consumer’s expectation that the certified beans can be sold in the habitual retail outlets
did not affect the consumer’s possible behaviour of buying certified beans. On the contrary,
the price to be charged for this product can positively or negatively influence consumer
behaviour in relation to the purchase of certified beans.
100
This study brings important contributions from the application of TPB in the field of certified
food products from integrated production, in the Brazilian context. It can be said, based on
the literature review, that there are few similar studies conducted in Brazil. So, one of the
contributions is on the scientific community that can use the results of this study as a basis
for similar future researches.
Another contribution of this study is targeted to the various agents of the Brazilian beans
supply chain. The results show that there is a great opportunity in the market, for those that
wish investing in the market of certified products with sustainable and food-safety claims.
The beans’ growers may benefit from the present results with the information that the
consumer has a positive attitude toward certified beans and, therefore, there is a latent
demand for this type of product.
On the other hand, the retail outlets should be alert to promote the certified products in a
clear and reliable way, since these criteria are flagged as important from the point of view
of consumers. The consumer must trust the certification label in consideration, as the quality
attributes that make differentiated the IP certified product, are credence attributes, and thus
cannot be directly observed by consumers, in the products available on supermarket shelves.
It is important to note that the results of this study are valid only for consumers interviewed
in Goiânia (GO) and cannot be generalized for all the Brazil as a whole. So, one cannot infer
behaviours and or attitudes for all the Brazilian consumers based on these results.
As recommendations for future researches within the same field, we suggest performing
similar research in other large Brazilian centres to promote a research culture focused on
consumer behaviour, which is still very few explored in Brazil. We suggest also the
interaction of SDC to TPB model to stratify the results and return a better understanding the
consumer behaviour on different profiles. Finally, to emphasize that this type of model must
to be applied in situations where it is possible to have a sufficient minimum number of
respondents to avoid problems during the model validation, as faced in this research.

101
5 SUMMARY AND CONCLUDING REMARKS
This study presents an analysis of the influence of integrated production (IP) on the beans’
supply chain context. The proposed analysis comprised both supply and demand sides.
Beans’ production in Brazil is dominated by small-scale agriculture with 62% of the total
production coming from the called “familiar agriculture”. On the other hand, the large-scale
agriculture, represented by the “agribusiness sector”, is responsible for 38% of the entire
production; Goiás State is the largest producer in this category.
The present study was conducted in this region with others nearby municipalities, and in this
context. Farms are normally characterized by large-scale agriculture, and single cultivation,
normally in irrigated areas located in the tropical savannas (Cerrado). Those areas require
intensive use of inputs, specially fertilizers and pesticides, resulting polluting outputs and
agro-products with doubtful quality.
The IP was proposed by the Brazilian Ministry of Agriculture, Livestock and Food Supply
– MAPA in order to reduce the negative environmental impacts of these intensive beans’
production in irrigated areas of the Cerrado, grown during winter’s crop.
Thus, from the supply side, the Chapter 2 was proposed to provide an adequate explanation
of adoption and use of integrated production by common beans’ farmers. An additional aim
was to determine the extent to which some economic, social, technical, environmental, and
market factors influence decision making of bean’s growers, technology adoption and use.
The replication of the Technology Acceptance Model (TAM) was applied in order to
evaluate the intention of IP adoption.
The fact that IP adoption remains relatively low could be explain in the fact that farms, in
the research area, are characterized by large-scale production with high-technology applied,
understood as intensive usage inputs. Then, change the protocol of production (conventional
to integrated) could generate some level of risk perception. Moreover, IP requires a more
intensive use of workforce, principally for monitoring and agronomic record procedures; in
those farms these additional managerial activities could bring even more work in terms of
farm management.
The fragility in terms of technical support availability in the region is another important
element that influence IP adoption. This result can be explained in the perceived ease of use
of some IP practices such as IPM that remains some doubt about the correct way in
proceeding the monitoring practice, for example.
The most important elements are those related to IP management, i.e., the records and
documentation procedures. These findings support the idea that is crucial creating a new
concept of technology transfer focused on IP adoption. This new concept should involve
several actors of the supply chain in order to create a synergy that reinforce the process of
adoption. Producers, agronomists, cooperatives, public organizations, logistic and retail

102
sector, and so on, all of them could justify the IP importance and, together, contribute to the
development and adoption of IP locally.
Another crucial factor that influence IP adoption is the availability of adequate products and
services to support IP implementation such as biological control products, monitoring and
alert system of pest and diseases, meteorological station. According to the respondents’
perceptions the absence of some of these factors could result some level of uncertainty. Then,
involving private companies from the inputs market could be an interesting strategy to
provide these essential elements required to a perfect IP usage.
The respondents consider very important having an intense agronomic support to implement
and use IP. Considering the complexity of some IP practices, and the various rules that have
to be fulfilled, it is crucial to promote new training courses in the region to motivate the
producers and give to them confidence to implement IP in their farms.
Finally, the compliance of several mandatory regulations seems to be another crucial point
related to IP adoption. it is fundamental to promote discussions with the public authorities
to find solutions to reduce the legal bureaucracy, and to create some legal advantages for
those who implement IP as a sustainable production system.
Regarding the incentives, as expected, the respondents would appreciate receiving a
premium price and other subsides to adopt IP, but this is not a decisive condition to adopt
IP. The premium price is an incentive to adopt IP as well as the perception that consumers
could be more confident toward the certified beans from IP production. These findings have
a strict relation to the Chapter 3 that treats on consumer’s perception and willing to pay a
premium price for IP labelled beans over conventional ones.
The findings of the Chapter 3 are very useful. The findings suggest that interviewed
consumers are prepared to facing labelled products from the integrated production, i.e.,
products with sustainable and food safety claims; they are willing to pay a premium price
for IP labelled beans. One can be understanding that the sample of consumers is also
concerned about pesticide residues in beans as well as sustainable practices applied by
growers.
Thus, consumers are label-sensitive and this information is quite important to producers and
market operators, indicating that profitable marketing opportunities may exist in trading
certified beans. The positive WTP values and positive consumer’s behaviour toward
certified beans could influence positively beans’ growers to adopt IP to offer certified beans
as alternative to conventional beans.
However, the involvement of the retail sector is crucial to reduce the asymmetry of
information and to provide adequate information about certified product, to consumers. We
are convinced that our findings can provide more insights for both policy makers and supply
chain actors into Brazilian consumer’s perception and preferences for quality attributes
inherent to the integrated production system.
The results indicate that the Government investments in IP can be effective in the long-term
since consumers need to be familiarized with labeling schemes.

103
The Chapter 4, in turn, analyses consumer’s attitude behaviour toward IP labelled beans.
The findings show that consumers are concerned about other quality attributes in addition to
colour and grain size. The interviewed consumers have a positive attitude toward the
purchasing of IP certified bean, although this product is not yet available in the local even
the Brazilian outlets.
Currently, the Brazilian domestic market does not yet offer a variety of IP certified products.
Because of this, consumers are not familiar with certified products, and this situation may
influence the process of buying this kind of products. So, a clear and reliable information
about the certification label may favour the process of certified beans marketing since the
consumer will have an easy access of IP label’s information. This role competes principally
to retail channels. The marketing strategies should achieve directly the consumers since the
opinion of others is not a decision-making factor for the intention of buying certified beans,
in the point of view of the surveyed consumers.
Researchers are made of results that come against the researcher's expectations or, in some
cases, not. In this study, for instance, one can be found some limitations that cannot be
neglected for a conscious researcher. Firstly, it is highly challenging the objective to verify
interfaces between two models or theories such as the TAM and IDT case. Second, it is very
important to carry out empirical research to test these relationships.
In the case of Brazil, this need becomes more pressing since the simple transfer of concepts
from other countries with very different cultural matrices should be conducted with extreme
caution in order to avoid that we become consumers, repeaters and disseminators of ideas
produced abroad, with reduced practical applicability and low originality. However, from
the previously arguments presented, it can be stated that there are possibilities to relate the
TAM and IDT in a satisfactory way. However, empirical studies need to be conducted to
verify these possibilities.
This study brings important contributions from the application of TPB in the field of certified
food products from integrated production, in the Brazilian context. One of the contributions
is on the scientific community that can use the results of this study as a basis for similar
future researches. The results reinforce the great opportunity for the market operators, and
beans’ growers.
Regarding the recommendations for further studies, in the field of IP adoption (using TAM
model) we suggest investigating the intention of IP adoption in different farm types, with
single crop versus mixed crops versus crop and livestock; we believe that most complex the
production system, the most difficult the process of IP adoption, principally in terms of
managerial complexity.
Moreover, to investigate the intention of IP adoption in different levels of farm size; we
believe that IP is not very adequate to farms with huge land extensions since requires an
intensive human labour, and normally large farms are characterized by intensive
mechanization and other mechanical practices that substitute, in many times, the presence of
the technician.

104
Regarding the research in the field of consumers’ behaviour, we suggest investigating, in
depth, the possible factors that conditioning the heterogeneity of consumers’ preferences.
Furthermore, it could be interesting to investigate consumers’ perception toward food
attributes with environmental, social and health claims are also important. Finally, we
recommend to replicate similar study of consumer’s preferences and WTP in other Brazilian
strategic cities to permit a better comprehension of Brazilian consumer’s preferences overall.
Finally, other studies involving consumers’ behaviour using TPB model should be replicate
in other strategic Brazilian cities to promote the research culture focused on this issue, which
is still very few explored in Brazil. Interact SDC to TPB model could result important results
to a better understanding of the consumer behaviour in different profiles.
In conclusion, on one hand, this research report contributes theoretically to the scientific
literature on the technology adoption approach, and consumer behaviour approach. On the
other hand, practical results can be evidenced in favour to producers and the various actors
of the commodity market. The findings provide elements to producers understanding better
how is their decision making process and, together with other producers, they can seek
common solutions to improve their competitiveness in the grain market.
The market, in turn, has elements to define appropriate strategies to promote certified
products that can return additional profits due to the favourable attitudes evidenced by
consumers in paying a premium price for safer and more sustainable products.
The findings have important implications even for public policy makers. If the government
intends to promote the production of safe and sustainable food products, one can say that the
government strategy is correct in encouraging producers to adopt integrated production.
However, it is also necessary to stimulate demand and the habit of consumption of IP
certified foods.
In this way, Brazilian consumers can count on quality food and eliminate much of the risk
of contamination that currently they are facing. Similarly, international markets can rely with
safe and sustainable food products from the Brazilian agriculture.

105
6 REFERENCES
Adrian, A. M., Norwood, S. H., & Mask, P. L. (2005). Producers' perceptions and attitudes
toward precision agriculture technologies. Computers and Electronics in
Agriculture, 48, 256-271.
Agarwal, R. (2000). Individual Acceptance of Information Technologies. Educational
Technology Research and Development, 40, 90-102.
Ajzen, I., & Fishbein, M. (1980). Understanding Attitudes and Predicting Social Behavior.
Englewood Cliffs, Nj: Prentice-Hall.
Albuquerque Júnior, E. P., Filho, J. L., Costa, J. S., & Santos, S. M. (2013). Aspectos
relativos à saúde e ao meio ambiente ligados ao consumo de alimentos orgânicos.
Revista de Administração da UFSM, p. 295-312.
Alves da Costa Filho, B., Pires, P. J., & Costa Hernandez, J. (2007). Modelo Technology
Acceptance Model - TAM aplicado aos automated teller machines - ATM's. RAI -
Revista de Administração e Inovação, 4 (1), 40-56.
ANDEF. (2015). Associação Nacional de Defesa Vegetal. Tratto il giorno 09 15, 2015 da
Sustentabilidade: http://www.andef.com.br/sustentabilidade/brasil-produz-mais-
com-menos-defensivos
Anderson, M. D., Hollingsworth, C. S., Van Zee, V., Coli, W. M., & Rhodes, M. (1996,
Dec.). Consumer response to integrated pest management and certification.
Agriculture, Ecosystems & Environment, 60(2).
Andrigueto, J. R., Nasser, L. B., Teixeira, J. A., Simon, G., Veras, M. V., Medeiros, S. F., .
. . Kososki, A. R. (2009). Panorama Mundial e Nacional. In P. e. Brasil. Ministério
da Agricultura, Produção Integrada de Frutas e Sistema Agropecuário de
Produção Integrada no Brasil. Brasilia: MAPA/ACS.
ANVISA. (2010, 06 22). Agência Nacional de Vigilância Sanitária. Tratto il giorno 07 08,
2012 da Programa de Análise de Resíduos de Agrotóxicos em Alimentos (PARA) -
Relatório de Atividades de 2009: www.anvisa.gov.br
ANVISA. (2011, 12 05). Programa de Análise de Resíduos de Agrotóxicos em Alimentos
(PARA). Tratto il giorno 06 22, 2015 da Agência Nacional de Vigilância Sanitária:
www.anvisa.gov.br
Armitage, C. J., & Conner, M. (2001). Efficacy of the Theory of Planned Behaviour: a
meta-analytic review. British Journal of Social Psychology, 40, p. 471-499.
Aryal, K. P., Pashupati, C., Sangita, P., & Govinda, S. (2009, Jun.). Consumers'
willingness to pay for organic products: a case from Kathmandu Valley. The
Journal of Agriculture and Environment, 10.
Ascough II, J. C., Hoag, D. L., Frasier, W. M., & McMaster, G. S. (1999). Computer use in
agriculture: an analysis of Great Plains producers. Computers and Electronics in
Agriculture, 23, 189-204.
Aubert, B. A., Schroeder, A., & Grimaudo, J. (2012). IT as enabler of sustainable farming:
an empirical analysis of farmers' adoption decision of precision agriculture
technology. Decision Support Systems, 54, 510-520.
Barbosa, F. R., Silva, C. C., Gonzaga, A. d., Silveira, P. M., Quintela, E. D., Lobo Junior,
M., . . . Junqueira, R. M. (2009, Dez.). Sistema de Produção Integrada do Feijoeiro
Comum na Região Central Brasileira. Circular Técnica 86. Santo Antônio de
Goiás, GO, Brasil: Embrapa Arroz e Feijão.
Barbosa, F. R., Silva, C. C., Gonzaga, A. d., Silveira, P. M., Quintela, E. D., Lôbo Junior,
M., . . . Junqueira, R. M. (2009). Sistema de produção integrada do feijoeiro
106
comum na região central brasileira. Circular Técnica, 86, 28p. Santo Antônio de
Goiás, GO, Brasil: Embrapa Arroz e Feijão.
Barcellos, M. D. (2007). Beef lovers: um estudo cross-cultural sobre o comportamento de
consumo de carne bovina. Porto Alegre: Universidade Federal do Rio Grande do
Sul.
Bennett, J. (2005, Apr.). Choice modelling: a step-by-step guide . The Economics Branch,
Policy Division, EPA.
Birol, E., Roy, D., Deffner, K., & Karandikar, B. (2009). Developing country consumers'
demand for food safety and quality: Is Mumbai ready for certified and organic
fruits? International Association of Agricultural Economists Conferene. Beijing,
China.
Blessa, R. (2003). Merchandising no ponto-de-venda. São Paulo: Atlas.
Boccaletti, S., & Nardella, M. (2000). Consumer willingness to pay for pesticide-free fresh
fruit and vegetables in Italy. International Food and Agribusiness Management
Review, 3, p. 297-310.
Boller, E. F., Avilla, J., Joerg, E., Malavolta, C., Wijnands, F. G., & Esbjerg, P. (2011).
IOBC Integrated Production: objectives, principles and technical guidelines. In R.
Baur, F. Wijnands, & C. Malavolta, Integrated Production: objectives, principles
and technical guidelines (p. 1-23). Darmstadt, Germany: IOBC-WPRS.
Bonti-Ankomah, S., & Yiridoe, E. K. (2006). Organic and Conventional food: a literature
review of the economics of consumer perceptions and preferences. Nova Scotia,
CA: Organic Agriculture Centre of Canada.
BRASIL. (2005). Guia alimentar para a população brasileira: promovendo a alimentação
saudável. Ministério da Saúde. Brasilia, DF, Brasil.
BRASIL. (2006, 07 25). Lei nº 11.326, de 24 de julho de 2006. Estabelece as diretrizes
para a formulação da Política Nacional da Agricultura Familiar e Empreendimentos
Familiares Rurais. Lei nº 11.326, de 24 de julho de 2006. Estabelece as diretrizes
para a formulação da Política Nacional da Agricultura Familiar e
Empreendimentos Familiares Rurais., v. 143 (141) , 1-25. Brasília, DF, Brasil:
Diário Oficial [da] República Federativa do Brasil.
BRASIL. (2009). Produção Integrada no Brasil: agropecuária sustentável, alimentos
seguros. Brasília: MAPA/ACS.
BRASIL. (2010, Ago. 30). Instrução Normativa n. 27, de 30 de Agosto de 2010. Diretrizes
gerais com vistas a fixar preceitos e orientações para os programas e projetos que
fomentem e desenvolvam a Produção Integrada Agropecuária (PI-Brasil), 167,
Seção 1, 7. Brasília, DF, Brasil: Diário Oficial da União.
BRASIL. (2010). Ministério da Agricultura, Pecuária e Abastecimento - MAPA. Tratto il
giorno 07 08, 2012 da Projeções do Agronegócio: Brasil 2009/2010 a 2019/2020:
http://www.agricultura.gov.br
BRASIL. (2012). Projeções do Agronegócio: Brasil 2011-2012 a 2021-2022. Brasília, DF:
Assessoria de Gestão Estratégica, MAPA/ACS.
BRASIL. (2015). Produção Integrada da Cadeia Agrícola. Tratto il giorno Set. 14, 2015
da Ministério da Agricultura: http://www.agricultura.gov.br/desenvolvimento-
sustentavel/producao-integrada
BRASIL. (2015). Produção Integrada da Cadeia Agrícola. Tratto da Ministério da
Agricultura: http://www.agricultura.gov.br/desenvolvimento-sustentavel/producao-
integrada
BRAZIL. (2015). Projections of Agribusiness, Brazil 2014/15 to 2024/25. Long-term
projections. Ministry of Agriculture, Livestock and Food Supply/Strategic
107
Management Office, Brasília (DF). Tratto il giorno 07 20, 2015 da
http://www.agricultura.gov.br/arq_editor/PROJECTIONS_ENG_WEB.pdf
Breidert, C., Hahsler, M., & Reutterer, T. (2006). A review of methods for measuring
willingness-to-pay. Innovative Marketing.
Byrne, B. M. (2001). Structural equation modeling wity AMOS. Lawrence Erlbaum:
Mahwah.
Carneiro, P. T., & Parré, J. P. (2005). Importância do setor varejista na comercialização de
feijão no Paraná. Revista de Economia e Agronegócio, 3, 277-298.
Carvalho Júnior, L. C., & Ozon, R. T. (2004). Análise das transações e das estruturas de
governança na cadeia produtiva do feijão da Região de União da Vitória (PR). XLII
Congresso Brasileiro de Economia e Sociologia Rural. Cuiabá: SOBER.
Chin, W. C., & Todd, P. A. (1995). On the use, usefulness and ease of use of structural
equation modeling in MIS research: a note of caution. MIS Quarterly, 19 (2), 237-
246.
Choice Metrics. (2012). Ngene 1.1.1 User Manual & Reference Guide. Australia.
CONAB. (2012, 10 10). Balanço de oferta e demanda: quadro de suprimento. Tratto il
giorno 10 10, 2012 da Companhia Nacional de Abastecimento: www.conab.br
CONAB. (2015, 07 20). CONAB. Companhia Nacional de Abastecimento. Tratto da Séries
históricas:
http://www.conab.gov.br/OlalaCMS/uploads/arquivos/15_07_09_08_59_32_boleti
m_graos_julho_2015.pdf
Cranfield, J. L., & Magnusson, E. (2003). Canadian consumer's willingness-to-pay for
pesticide free food products: an ordered probit analysis. International Food and
Agribusiness Management Review, 6(4), p. 13-30.
Cunha, C. A., & Wander, A. E. (2014). Asymmetry in farm-to-retail dry bean price
transmission in São Paulo, Brazil. Journal on Chain and Network Science, 14(1), p.
31-41.
Daberkow, S. G., & McBride, W. D. (2003). Farm and operator characteristics affecting
the awareness and adoption of precision agriculture technologies in the US.
Precision Agriculture, 4, 163-177.
Davis, F. D. (1989, Sep). Perceived usefulness, perceived ease of use, and user acceptance
of information technology. MIS Quarterly, 13(3), 319-340.
East, R. (2003). Comportamento del consumatore. Milano: Apogwo.
East, R. (2009). Comportamento del Consumatore. Apogeo Education.
EMBRAPA. (2013). Agência Embrapa de Informação Tecnológica. Tratto il giorno 06 21,
2013 da Árvore do Conhecimento Feijão - Produção:
http://www.agencia.cnptia.embrapa.br/gestor/
feijao/arvore/CONTAG01_74_1311200215104.html
Embrapa Arroz e Feijão. (2012). Dados conjunturais da produção de feijão (Phaseolus
vulgaris L.) e caupi (Vigna unguiculata L.) no Brasil (1985 a 2011): área, produção
e rendimento. Tratto il giorno 10 04, 2012 da http://www.cnpaf.embrapa.br/
socioeconomia/index.htm
European Commission. (2000). White Paper on Food Safety. Tratto il giorno 09 10, 2010
da http://ec.europa.eu/food/food/intro/white_paper_en.htm
European Commission. (2015). Agri-environment measures. Tratto il giorno sept 15, 2015
da Agriculture and Rural Development:
http://ec.europa.eu/agriculture/envir/measures/index_en.htm
European Parliament. (2009). Directiva 2009/128/EC of the European Parliament and of
the Council of 21 october 2009 establising a framework for Community action to
achieve the sustainable use of pesticides. Off. J. Eur. Union, 309, 71-86.

108
Ferreira, C. M., Del Peloso, M. J., & Faria, L. C. (2002). Feijão na economia nacional.
Santo Antônio de Goiás: Embrapa Arroz e Feijão.
FIESP. (2012). Outlook Brasil 2022: projeções para o agronegócio. Tratto il giorno 06 15,
2012 da Federação das Indústrias do Estado de São Paulo: http://www.fiesp.com.br
/outlookbrasil
Fishbein, M., & Ajzen, I. (1975). Belief, attitude, intention, and behavior: an introduction
to Theory and Research. Tratto il giorno April 15, 2014 da
http://people.umass.edu/aizen/f&a1975.html
Flett, R., Alpass, F., Humphries, S., Massey, C., Morriss, S., & Long, N. (2004). The
technology acceptance model and use of technology in New Zealand dairy farming.
Agricultural Systems, 80, p. 199-211.
Folorunso, O., & Ogunseye, S. O. (2008). Applying an enhaced technology acceptance
model to knowledge management in agricultural extension services. Data Science
Journal, 7, 31-45.
Fontes, M. A., Giraud-Héraud, E., & Pinto, A. S. (2013, Dec). Consumers' Behaviour
towards food safety: a literature review. École Polytechnique.
Francis, J. J., Eccles, M. P., Johnston, M., Walker, A., Grimshaw, J., Foy, R., . . . Bonetti,
D. (2004, May). Constructing questionnaires based on the theory of planned
behaviour. A manual for health services researchers. University of Newcastle.
Centre of Health Services Research, Newcastle, UK.
Gasson, R., Crow, G., Errington, A. J., Hutson, J., Marsden, T., & Winter, D. M. (1988).
The farm family business: a review. Journal of Agricultural Economics, 39 (1), p.
1-14.
Gawron, J. C., & Theuvsen, L. (2009). Agrifood Certification Schemes in an Intercultural
Context: theoretical reasoning and empirical findings. 113th EAAE Seminar "A
resilient European food industry and food chain in a challenging world". Chania:
EAAE.
Govindasamy, R., & Italia, J. (1999). Identifying the market environment and consumer
attitudes facing the introduction of integrated pest management produce. Journal of
the ASFMRA, p. 55-62.
Govindasamy, R., Italia, J., & Adelaja, A. (2001, Oct.). Predicting willingness-to-pay a
premium for integrated pest management produce: a logistic approach. Agricultural
and Resource Economics Review, 30(2), p. 151-159.
Govindasamy, R., Italia, J., & Rabin, J. (1998). Consumer response and perceptions of
Integrated Pest Management Produce. New Jersey, U.S.: The State University of
New Jersey - Rutgers.
Govindasamy, R., Italia, J., Thatch, D., & Adelaja, A. (2013). Consumer Response to IPM-
Grown Produce. Journal of Extension.
Granatstein, D. (2013, March 25). Alternative Markets for Fruit: organic and integrated
fruit production. Tratto da WSU Tree Fruit Research & Extension Center:
postharvest.tfrec.wsu.edu/pages/PC2000M
Greene, W. H. (2012). NLOGIT Econometric Software, Inc.
Hair, J., Black, W. C., Babin, B. J., Anderson, R. E., & Tatham, R. L. (2006). Multivariate
Data Analysis. Upper Saddle River, NJ: Pearson Prentice Hall.
Hammitt, J. K. (1993). Consumer willingness to pay to avoid pesticide residues. Statistica
Sinica, p. 351-366.
Hattam, C. (2006). Adopting organic agriculture: an investigation using the Theory of
Planned Behaviour. International Association of Agricultural Economics
Conference. Gold Coast.
109
Hensher, D. A., & Greene, W. H. (2001, Nov. 28). The Mixed Logit Model: the state of
practice and warnings for the unwary. Tratto il giorno sept 18, 2015 da NYU Stern
School of Business: http://people.stern.nyu.edu/wgreene/MixedLogitSOP.pdf
Hensher, D. A., Rose, J. M., & Greene, W. H. (2005). Applied Choice Analysis: a primer.
Cambridge: Cambridge University Press.
Hoppe, A., Barcellos, M. D., Vieira, L. M., & Matos, C. A. (2012, Abr/Jun).
Comportamento do consumidor de produtos orgânicos: uma aplicação da teoria do
comportamento planejado. Revista de Administração e Contabilidade da Unisino,
9(2), p. 174-188.
Hussain, M., Zia, S., & Saboor, A. (2011). The adoption ot integrated pest management
(IPM) technologies by cotton growers in the Punjab. Soil Environment, 30 (1), 74-
77.
IBGE. (2006). Instituto Brasileiro de Geografia e Estatística. Tratto il giorno 07 20, 2015
da Censo Agropecuário 2006, Brasil, Grandes Regiões e Unidades da Federação:
http://www.ibge.gov.br/home/estatistica/economia/agropecuaria/censoagro/
IBGE. (2014). Instituto Brasileiro de Geografia e Estatística. Tratto il giorno 07 23, 2015
da Pesquisa nacional de saúde 2013: percepção do estado de saúde, estilos de vida e
doenças crônicas: Brasil, grandes regiões e unidades da federação.:
http://biblioteca.ibge.gov.br/visualizacao/livros/liv91110.pdf
INMETRO. (2010, 08 05). Instituto Nacional de Metrologia, Normalização e Qualidade
Industrial. Tratto da Certificação:
http://www.inmetro.gov.br/qualidade/certificacao.asp>
IOBC. (2004). IOBC-WPRS IP & IPM: Integrated Production Principles of IOBC. Tratto
il giorno Sept 20, 2015 da International Organisation for Biological and Integrated
Control (IOBC): https://www.iobc-wprs.org/ip_ipm/IOBC_IP_principles.html
Kerr, G. N., & Sharp, B. H. (2009). Efficient design for willingness to pay in choice
experiments: evidence from the field. New Zealand Agricultural and Resources
Economics Society Conference. Nelson, NZ: NZARES.
Kline, R. B. (2011). Principles and practice of structural equation modeling (3rd Ed. ed.).
New York: The Guilford Press.
Kuhar, A., & Juvancic, L. (2010). What determines purchasing behaviour for organic and
integrated fruits and vegetables? Bulgarian Journal of Agricultual Science, 16(2),
p. 111-122.
Kuhar, A., & Juvančič, L. (2010). What determines purchasing behaviour for organic and
integrated fruits and vegetables? Bulgariam Journal of Agricultural Science, 16(2),
p. 111-122.
Kuhar, A., Slabe, A., & Juvančič, L. (2012). Determinants of purchasing behaviour for
organic and integrated fruits and vegetables: the case of the post socialist economy.
In M. Reed, Organic Food and Agriculture - New trends and Developments in the
Social Sciences (p. 216). Rijeka: Intech Europe.
Lancaster, K. J. (1966, Apr.). A New Approach to Consumer Theory. Journal of Political
Economy, 74(2), p. 132-157.
Lee, Y.-H., Hsieh, Y.-C., & Hsu, C.-N. (2011). Adding Innovation Diffusion Theory to the
Technology Acceptance Model: supporting employees' intentions to use e-learning
systems. Educational Technology & Society, 14 (4), 124-137.
Leitão, F. O., Brisola, M. V., & Thomé, K. M. (2010). Análise das estruturas de
governança adotadas entre produtores rurais e corretores na cadeia do feijão.
Revista em Agronegócios e Meio Ambiente, 3(1), p. 29-46.
110
Li, J., Gómez, M. I., Rickard, B. J., & Margaret, S. (2013, August). Factors influencing
adoption of integrated pest management in Northeast greenhouse and nursery
production. Agricultural and Resource Economics Review, 42 (2), 310-324.
Lima-Filho, D. d., Alves, C. d., Quevedo-Silva, F., Kondo, A. S., Arakak, D. E., &
Higashi, S. Y. (2013, jul./dez.). Decisão de compra das classes A-B em
Supermercados. Revista Cesumar Ciências Humanas e Sociais Aplicadas, 18(2), p.
353-374.
Loureiro, M. L., & Umberger, W. J. (2003). Estimating consumer willingness to pay for
country-of-origin labeling. Journal of Agricultural and Resource Economics, 28(2),
p. 287-301.
Lusk, J. L. (2002). Effects of cheap talk on consumer willingness-to-pay for golden rice.
American Agricultural Economics Association Annual Meeting. Long Beach.
Magistris, T. d., & Gracia, A. (2008). The decision to buy organic food products in
Southern Italy. British Food Journal, 9, p. 929-947.
Mangham, L. J., Hanson, K., & McPake, B. (2009). How to do (or not to do)...Designing a
discrete choice experiment for application in a low-income contry. Health Policy
and Planning, 24, p. 151-158.
Mas-Colell, A., Whinston, M. D., & Green, J. R. (1995). Microeconomic theory (Vol. 1).
New York: Oxford University Press.
Mazzocchi, M. (2008). Statistics for Marketing and Consumer Research. SAGE
Publications Ltd.
McCluskey, J. J., & Loureiro, M. L. (2003, Nov.). Consumer preferences and willingness
to pay for food labeling: a discussion of empirical studies. Journal of Food
Distribution Research, 34(3), p. 95-102.
McFadden, D. (1986). Theory Approach to Market Research (Special Issue on Consumer
Choice Models). Marketing Science, 5(4), p. 275-297.
Misra, S. K., Huang, C. L., & Ott, S. L. (1991). Consumer willingness to pay for pesticide-
free fresh produce. Western Journal of Agricultural Economics, 16(2), p. 218-227.
Misra, S. K., Huang, C. L., & Ott, S. L. (1991). Consumer willingness to pay for pesticide-
free fresh produce. Western Journal of Agricultural Economics, 16(2), p. 218-227.
Molin, E. E. (2014). Context-dependent stated choice experiments. Tratto il giorno sept 20,
2015 da http://repository.tudelft.nl/assets/uuid:d4ab739c-a1f1-40bd-ab27-
2d272b9e70c2/316758.pdf
Moreira, F. B., & Gonzaga, A. d. (2012). Informações técnicas para o cultivo do feijoeiro
comum na Região Central Brasileira: 2012-2014. Documentos, 272, 247p. Embrapa
Arroz e Feijão.
Morris, M. G., & Venkatesh, V. (2000). Age differences in technology adoption decisions:
implications for a chaging workforce. Personnel Psychology.
Moser, C. M., & Barrett, C. B. (2003). The disappointing adoption dynamics of a yield-
increasing, low external-input technology: the case of SRI in Madagascar.
Agricultural Systems, 76, p. 1085-1100.
Moser, R., Raffaelli, R., & McFadden, D. T. (2011). Consumer preferences for fruit and
vegetables with credence-based attributes: a review. International Food and
Agribusiness Management Review, 14(2), p. 121-142.
Moser, R., Raffaelli, R., & McFadden, D. T. (2011). Consumer preferences for fruit and
vegetables with credence-based attributes: a review. International Food and
Agribusiness Management Review, 14(2), p. 121-142.
Moura, T. L., Silva, A. L., & Batalha, M. O. (2006). Perfil dos consumidores que
frequentam os formatos de varejo de alimentos no Brasil. Encontro da ANPAD.
111
Ozon, R. T. (2002). Análise da cadeia produtiva do feijão na região de União da Vitória,
PR. Florianópolis: Universidade Federal de Santa Catarina.
Parvan, A. (2011). Agricultural Tecnology Adoption: issues for consideration when
scaling-up. The Cornell Policy Review, 1 (1), 5-31.
Posse, S. C., Riva-Souza, E. M., Silva, G. M., & Rocha, M. A. (2010). Informações
técnicas para o cultivo do feijoeiro-comum na região central-brasileira: 2009-
2011.
Regione Emilia-Romagna. (2012, Nov 29). Agricoltura e pesca . Produzioni
agroalimentari. Tratto il giorno sept 18, 2015 da QC Qualità Controllata:
http://agricoltura.regione.emilia-romagna.it/produzioni-
agroalimentari/temi/qualita/marchio-qc
Rogers, E. M. (1983). Diffusion of Innovations. New York: McMillan .
Rogers, E. M. (1995). Diffusion of Innovations (4th Ed. ed.). New York: Free Press.
Sá, R. d. (2008). Avaliação dos fatores de qualidade de feijão comum. Relatório de Estágio
Profissionalizante, Universidade Federal de Mato Grosso, Agronomia e Medicina
Veterinária, Cuiabá.
Sá, R. S. (2008). Avaliação dos fatores de qualidade de feijão comum. Cuiabá:
Universidade Federal de Mato Grosso.
Sackett, H. M., Shupp, R. S., & Tonsor, G. T. (2012). Discrete choice modeling of
consumer preferences for sustainably produced steak and apples. Tratto il giorno
08 20, 2015 da AgEcon Search: http://purl.umn.edu/123517
Schmidt, V., Rodrigues, R. G., Celia, A. P., & Gomes, J. B. (2012). Percepção dos
consumidores sobre o consumo de alimentos certificados. In A. C. Dörr, M. V.
Rossato, & A. Zulian, Agronegócio: panorama, perspectivas e influência do
mercado de alimentos certificados (p. 198). Curitiba: Appris.
Schmidt, V., Rodrigues, R. G., Celia, A. P., & Gomes, J. B. (2012). Percepção dos
consumidores sobre o consumo de alimentos certificados. In Agronegócio:
panorama, perspectivas e influência do mercado de alimentos certificados (p. 198).
Curitiba: Appris.
Shepherd, J., & Saghaian, S. (2008, March). Consumer Response to and Trust of
Information about Food-Safety Events in the Chicken and Beef Markets in
Kentucky. Journal of Food Distribuition Research, 39(1), p. 123-129.
Silva, A. M. (2005). A influência do treinamento de usuários na aceitação de sistemas
ERP em empresas no Brasil. Rio de Janeiro: Universidade Federal do Rio de
Janeiro.
Silva, O. F. (2011). Dados de conjuntura da produção de feijão (Phaseolus vulgaris L.) no
Brasil (1985-2010). Tratto il giorno 05 10, 2012 da Embrapa Arroz e Feijão:
www.cnpaf.embrapa.br
Silva, O. F., & Wander, A. E. (2013). Feijão comum no Brasil: passado, presente e futuro.
Documentos 287. Santo Antônio de Goiás, GO, Brasil. Tratto il giorno 04 10, 2014
da
http://www.cnpaf.embrapa.br/transferencia/informacoestecnicas/publicacoesonline/
seriedocumentos_287.pdf
Sinden, J. A., & King, D. A. (1990, Dec). Articles and Notes. Adoption of soil
conservation measures in Manilla Shire, New South Wales. Review of Marketing
and Agricultural Economics, 58(2,3), p. 179-192.
Souza Filho, H. M., Buainain, A. M., Jardim da Silveira, J. F., & Vinholis, M. B. (2011,
jan./abr.). Condicionantes da adoção de inovações tecnológicas na agricultura.
Cadernos de Ciência & Tecnologia, 28(1), p. 223-255.
SPSS Inc. (2013). SPSS for Windows, version 22.0.
112
Sterns, J. A., & Codron, J.-M. (2001). Why adopt integrated crop production? A
perspective from the French fruit sector. American Agricultural Economics
Association's 2001 Annual Meetings, (p. 1-14). Chicago.
Stopher, P. (2012). Collecting, managing, and assessing data using sample surveys.
Cambridge: Cambridge University Press.
Tonsor, G. T., & Shupp, R. (2009, Dec.). Valuations of "sustainably produced" labels on
beef, tomato, and apple products. Agricultural and Resource Economics Review, 38
(3), p. 371-383.
Tonsor, G. T., Schroeder, T. C., Pennings, J. E., & Mintert, J. (2009). Consumer valuations
of beef steak food safety enhacement in Canada, Japan, Mexico, and the United
States. Canadian Journal of Agricultural Economics, 57, p. 395-416.
Troilo, G., & Molteni, L. (2003). Introduzione alla ricerca di marketing. Mc-Graw-Hill.
U.S. Environment Protection Agency. (2011). Heath and safety fact sheets: integrated pest
management principles. Tratto il giorno 09 8, 2012 da
http://www.epa.gov/pesticides/factsheets/ipm.htm
Viana, J. A., & Révillion, J. P. (2010). Qualidade percebida pelo consumidor de produtos
lácteos: modelo teórico e evidências empíricas. 48 Congresso SOBER. Campo
Grande (MS), Brasil.
Vojáček, O., & Pecáková, I. (2010). Comparison of discrete choice models for economic
environmental research. Prague Economic Papers, 1.
Wander, A. E., & Chaves, M. O. (2011). Consumo per capita de feijão no Brasil de 1998 a
2010: uma comparação entre consumo aparente e consumo domiciliar. Congresso
Nacional de Pesquisa de Feijão. Goiânia, GO: Embrapa Arroz e Feijão.
Wander, A. E., Basinello, P. Z., & Ricardo, T. R. (2006, Dez.). Perfil dos consumidores de
arroz e feijão na Região Metropolitana de Goiânia. Comunicado Técnico, 127.
Santo Antônio de Goiás, GO, Brasil: Embrapa Arroz e Feijão.
Wander, A. E., Lacerda, A. V., Freitas, F. C., Didonet, A. D., & Didonet, C. G. (2007,
Abr./Maio/Jun.). Alimentos Orgânicos: oportunidades de mercado e desafios.
Revista Política Agrícola, Ano XVI (2), p. 44-55.
Wongprawmas, R., Canavari, M., & Waisarayutt, C. (2014). Are Thai Consumers willing
to pay for food safety labels? Choice experiment on fresh produce. EAAE 2014
Congress - Agri-Food and Rural Innovations for Healthier Societies. Ljubljana,
Slovenia.

113
7 APPENDIX
APPENDIX 2-A - Qualitative research – eliciting producers’ salient beliefs
Section 1 – Technical aspects related to Integrated Production adoption.
1. Overall impression of the integrated production system.
2. The IP’s agronomic practice that is harder to be put into practice.
3. Some considerations in terms of the managerial point of view.
4. Main reasons to adopt or not the IP.
Section 2 – Economic aspects related to Integrated Production adoption.
1. Main economic advantages of using IP to produce common beans.
2. Main economic disadvantages of using IP to produce common beans.
3. Opinion about the IP benefits/cost relation.
4. Main economic reasons to adopt or not the IP.
Section 3 – Institutional aspects related to Integrated Production adoption.
1. Evaluation of technical assistance (public and private) and extension service to support IP
implementation.
2. Suggestions to public managers to improve technical assistance in order to increase the IP
adoption in the region.
3. Opinion about the creation of an alternative kind of technical assistance focused on IP.
4. Opinion about the essential technical services (training programs, monitoring and forecast
network, etc) available regionally to enable IP usage. Suggestion about new services that
could facilitate the IP usage.
5. The most critical points in terms of training, important to implement IP.
6. Knowledge about public incentives to adopt sustainable agricultural practices.
Section 4 – Market and others aspects related to Integrated Production adoption.
1. The concept of quality beans.
2. Impressions about consumers’ behaviour toward IP certified beans.
3. Importance of beans’ price premium to adopt IP.
4. IP as a strategic way to control pest and diseases in the region.
Personal and professional data.

114
APPENDIX 2-B – Quantitative research – constructs and items
(Final version N = 93; N. Of Items = 31) Descriptive
Statistics
Reliability
Statistics
Cod. Constructs / Items Mean Std.
Dev.
Cronbach's
Alpha
Std.
Cronbach's
Alpha
Perceived Usefulness (PU) 0.708 0.722
PU.1 Using IP in my farm would result more control of
my beans’... (Extremely unlikely/Extremely likely) 5.5 1.2473
PU.2 Using IP in my farm the agronomic effectiveness
would … (Extremely unlikely/Extremely likely) 5.7 1.1608
PU.3 Using IP in my farm would decrease the costs with
inputs ... (Extremely unlikely/Extremely likely) 5.2 1.6807
PU.4 I would find IP useful as crop system. (Extremely
unlikely/Extremely likely) 5.6 1.4254
PU.5
I believe IP can bring more benefits to the
environment than the conventional ... (Extremely
unlikely/Extremely likely)
6.0 1.1652
Perceived Ease of Use (PEOU) 0.711 0.730
PEOU.1 It will be easy for me to learn and apply most of the
IP practices. (Extremely unlikely/Extremely likely) 5.7 1.2783
PEOU.2
It will be easy for me understand and apply the IP
standards for common beans' production.
(Extremely unlikely/Extremely likely)
5.3 1.4263
PEOU.3
It will be easy for me to use IP with the present
availability of basic support services for IP ..
(Extremely unlikely/Extremely likely)
4.5 1.6189
PEOU.4
It will be easy for me to use IP with the present
biological control agents and other IPM supplies
available in my region. (Extremely
unlikely/Extremely likely)
4.7 1.7014
PEOU.5
I would be able to use IP practices in my bean
production without an intensive technical support
around to show me how to use it. (Extremely
unlikely/Extremely likely)
3.6 2.1281
PEOU.6 I would find IP easy to use for producing common
beans. (Extremely unlikely/Extremely likely) 4.6 1.5631
Complexity of using IP 0.709 0.710
CPL.1
In the IP system, an agronomic practice like
Integrated Pest Management (IPM) would be easy to
apply in my farm. (Extremely Unlikely/Extremely
Likely)
5.1 1.4313
CPL.2
It will be easy for me to learn and apply the
procedures of recording and documentation required
by IP system. (Extremely unlikely/Extremely likely)
4.7 1.4962
CPL.3
It will be easy for me to apply all the mandatory
regulations considered by IP system. (Extremely
unlikely/Extremely likely)
4.3 1.5135
CPL.4
It will be easy for me to have a good and well-trained
operational staff for running the IP in my farm.
(Extremely unlikely/Extremely likely)
4.4 1.7708
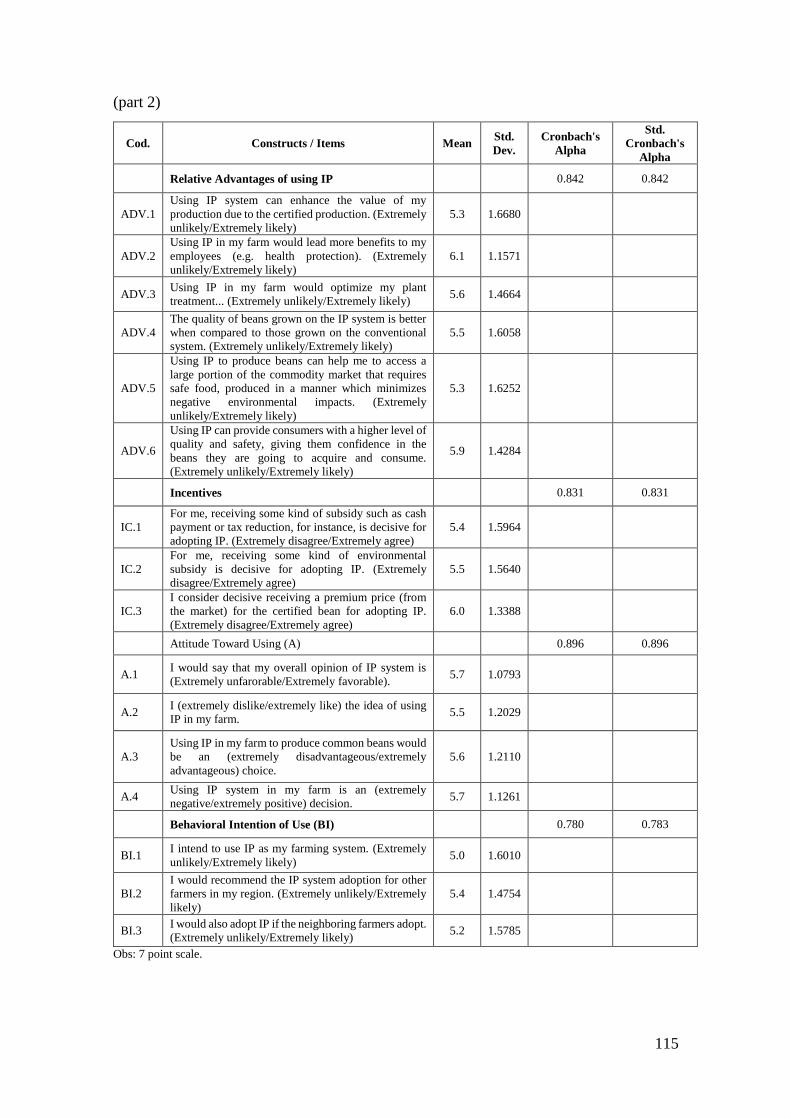
115
(part 2)
Cod. Constructs / Items Mean Std.
Dev.
Cronbach's
Alpha
Std.
Cronbach's
Alpha
Relative Advantages of using IP 0.842 0.842
ADV.1
Using IP system can enhance the value of my
production due to the certified production. (Extremely
unlikely/Extremely likely)
5.3 1.6680
ADV.2
Using IP in my farm would lead more benefits to my
employees (e.g. health protection). (Extremely
unlikely/Extremely likely)
6.1 1.1571
ADV.3 Using IP in my farm would optimize my plant
treatment... (Extremely unlikely/Extremely likely) 5.6 1.4664
ADV.4
The quality of beans grown on the IP system is better
when compared to those grown on the conventional
system. (Extremely unlikely/Extremely likely)
5.5 1.6058
ADV.5
Using IP to produce beans can help me to access a
large portion of the commodity market that requires
safe food, produced in a manner which minimizes
negative environmental impacts. (Extremely
unlikely/Extremely likely)
5.3 1.6252
ADV.6
Using IP can provide consumers with a higher level of
quality and safety, giving them confidence in the
beans they are going to acquire and consume.
(Extremely unlikely/Extremely likely)
5.9 1.4284
Incentives 0.831 0.831
IC.1
For me, receiving some kind of subsidy such as cash
payment or tax reduction, for instance, is decisive for
adopting IP. (Extremely disagree/Extremely agree)
5.4 1.5964
IC.2
For me, receiving some kind of environmental
subsidy is decisive for adopting IP. (Extremely
disagree/Extremely agree)
5.5 1.5640
IC.3
I consider decisive receiving a premium price (from
the market) for the certified bean for adopting IP.
(Extremely disagree/Extremely agree)
6.0 1.3388
Attitude Toward Using (A) 0.896 0.896
A.1 I would say that my overall opinion of IP system is
(Extremely unfarorable/Extremely favorable). 5.7 1.0793
A.2 I (extremely dislike/extremely like) the idea of using
IP in my farm. 5.5 1.2029
A.3
Using IP in my farm to produce common beans would
be an (extremely disadvantageous/extremely
advantageous) choice.
5.6 1.2110
A.4 Using IP system in my farm is an (extremely
negative/extremely positive) decision. 5.7 1.1261
Behavioral Intention of Use (BI) 0.780 0.783
BI.1 I intend to use IP as my farming system. (Extremely
unlikely/Extremely likely) 5.0 1.6010
BI.2
I would recommend the IP system adoption for other
farmers in my region. (Extremely unlikely/Extremely
likely)
5.4 1.4754
BI.3 I would also adopt IP if the neighboring farmers adopt.
(Extremely unlikely/Extremely likely) 5.2 1.5785
Obs: 7 point scale.

116
APPENDIX 4-1 – TPB constructs and items, Pilot-version
Pilot Version (N=24; N. of Items=18) Descriptive
Statistics
Corrected
Item-total
correlation
Cod. Items (Cronbach's Alpha Based on Standardized Items) Mean Std.
Dev.
Attitudes toward the behavior (α = 0.726)
(A.1) Buying IP certified beans could bring (harm/benefits) for my health. 6.63 0.88 0.812
(A.2) Buying IP certified beans, as soon as they become available for sale, means buying
a food that offers (more/less) risk to my health. 6.75 0.44 0.108*
(A.3)
Buying IP certified beans, as soon as they become available for sale, I would be
contributing (negatively/positively) to reduce the negative impacts on the environment.
6.96 0.20 -0.154*
(A.4) Buying IP certified beans, as soon as they become available for sale, would be a (foolish/wise) attitude from my part.
6.71 0.75 0.573
(A.5) Buying IP certified beans, as soon as they become available for sale, means buying
a food (less/more) reliable. 6.63 0.58 0.369*
(A.6) Buying IP certified beans, as soon as they become available for sale, instead of
buying conventional beans would make me feel more (unsatisfied/satisfied). 6.29 1.04 0.689
Subjective Norms (α = 0.785)
(NS.1) Most people who are important to me think that I (should not/should) buy IP certified beans, as soon as they become available for sale.
5.75 1.33 0.477
(NS.2) It is expected of me by the people who I cherish and consider is that I should buy IP certified beans as soon as they become available for sale. (Extremely
unlikely/Extremely likely).
5.46 1.91 0.678
(NS.3) The people in my life whose opinion I value would (disapprove/approve) my choice
of buying IP certified beans, as soon as they become available for sale. 6.50 0.59 0.602
Perceived Behavioral Control (α = 0.558)
(CP.1)
If the IP certified beans' price will be more expensive than the price of the
conventional beans, I would have difficulty for buying them. (Extremely unlikely/Extremely likely)
3.58 1.84 -0.287*
(CP.2) I believe that the IP certified beans will be available for sale at the outlets where I usually purchase food stuffs. (Extremely unlikely/Extremely likely)
5.33 0.96 0.309*
(CP.3) Having clearly and reliable information about IP certified beans available for sale would facilitate my decision of purchasing. (Completely disagree/Completely
agree).
6.92 0.28 0.313
(CP.4) For me, buying IP certified beans as soon as they become available for sale would be (difficult/easy).
5.79 1.28 0.172*
(CP.5) If I want, I can buy IP certified beans, instead of the conventional ones, as soon as
they become available for sale. (Extremely unlikely/Extremely likely) 6.29 1.12 0.759
(CP.6) Buying IP certified beans, as soon as they become available for sale, will be an
entirely my choice. (Completely disagree/Completely agree). 6.17 1.52 0.572
Intention toward behavior (α = 0.946)
(I.1) I consider buying IP certified beans as soon as they become available for sale in the
market from Goiânia. (e) 6.13 1.45 0.783
(I.2) I want to buy IP certified beans as soon as they become available for sale in the market from Goiânia. (e)
6.25 1.11 0.863
(I.3) I intend to buy IP certified beans as soon as they become available for sale in the
market from Goiânia. (e) 6.08 1.32 0.840
(*) Deleted items.

117
APPENDIX 4-2 – TPB constructs and items, Final-version
(N=160; N. of Items=12) Descriptive
Statistics Item-total Statistics
Cod. Items (Cronbach's Alpha Based on
Standardized Items) Mean
Std.
Dev.
Corrected
Item-total
correlation
Cronbach's
Alpha if
Item
deleted
(A) Attitudes toward the behaviour (α = 0.679)
(A.4)
Buying IP certified beans, as soon as they become
available for sale, would be a (foolish/wise) attitude
from my part.
6.7 .7934 .730 .877
(A.6)
Buying IP certified beans, as soon as they become
available for sale, instead of buying conventional
beans would make me feel more
(unsatisfied/satisfied).
6.6 1.0687 .652 .879
(SN) Subjective Norms (α = 0.85)
(NS.2)
It is expected of me by the people who I cherish and
consider is that I should buy IP certified beans as
soon as they become available for sale. (Extremely
unlikely/Extremely likely).
6.3 1.1435 .621 .882
(NS.3)
The people in my life whose opinion I value would
(disapprove/approve) my choice of buying IP
certified beans, as soon as they become available for
sale.
6.1 .8477 .621 .881
(PBC) Perceived Behavioural Control (α = 0.593)
(CP.6)
Buying IP certified beans, as soon as they become
available for sale, will be an entirely my choice.
(Completely disagree/Completely agree).
6.7 .7786 .379 .892
(CP.5)
If I want, I can buy IP certified beans, instead of the
conventional ones, as soon as they become available
for sale. (Extremely unlikely/Extremely likely)
6.3 1.1825 .475 .892
(CP.3)
Having clearly and reliable information about IP
certified beans available for sale would facilitate my
decision of purchasing. (Completely
disagree/Completely agree).
6.3 .7519 .496 .887
(I) Intention toward behaviour (α = 0.893)
(I.2)
I want to buy IP certified beans as soon as they
become available for sale in the market from
Goiânia.
6.7 .8437 .754 .875
(I.1)
I consider buying IP certified beans as soon as they
become available for sale in the market from
Goiânia.
6.6 .9935 .727 .875
(I.3)
I intend to buy IP certified beans as soon as they
become available for sale in the market from
Goiânia.
6.6 1.0369 .682 .877