alkali bulletin - ama-india.org
TRANSCRIPT

Alkali BulletinAlkali Bulletin(For Restricted Circulation) April, 2021Volume XLIII No. 4
Alkali Manufacturers Association of India


Dear Reader,The industry had started showing signs of a gradual return to growth after last year’s covid-induced lockdown. Initial estimates of production output show that the alkali industry was able to recover to a good extent. However, just as the industry was able to derive solace from the strong recovery, the country was hit by a strong and more lethal second wave of covid-19. Infections were intense, spreading from Maharashtra to Delhi and other States. The Centre decided not to impose a nation-wide lockdown and left the decision to individual State governments to take a call on imposing restrictions. This allowed most industrial activities to continue almost uninterrupted, minimizing disruptions.
A new challenge posed by the second wave was its severity. The healthcare system came under severe strain. Lack of availability of adequate medical oxygen for affected patients led to the government seeking industry’s support. Many industries, including chlor-alkali plants, came forward for production of medical oxygen from modified industrial Nitrogen Generation PSA Units.
The government announced its decision to step up monitoring imports of various items, including chemicals. This was based on the data that showed huge quantities entering the country under “Others” category. The Department of Chemicals & Petrochemicals (DCPC) had some time back sought comments from the industry on its proposal to introduce compulsory declaration of CAS number for all chemical imports. This was intended to strengthen monitoring and identify mis-declared imports.
In a related development, the government has made it mandatory for importers, exporters and customs brokers to verify their identity through documents and offer themselves to physical verification of place of business. The rule has become applicable for all new importers, exporters and customs brokers and will be extended to existing entities. The move is intended to arrest revenue leakages, wrongful claim of benefits and malafide misdeclarations in traded goods.
The Jal Shakti Ministry announced that 38% of rural population have been covered under the Jal Jeevan Mission (JJM) and 21.4% population have been provided tap water connection (functional household tap connection or FHTP) since the JJM scheme was launched in August 2019. This is a significant achievement in providing access to piped treated water supply to rural households. Chlorine disinfection is an important contributor to the success of this scheme, ensuring good quality water to rural households.
K. Srinivasan Secretary General

I. ARTICLES & FEATURES Selection of Finned Surface Heat Exchangers - Selection of Surface Area - Dr. Jagjit Singh Sehra, President, CST Associates 01
Lowering the Chilled Water Generation Cost through Vapor Absorption Machine (VAM) Or Vapor Compression Machine (VCM) - Mr Mayank Shukla, Grasim Industries Ltd. 05
Green Hydrogen can Spearhead India’s transition to Clean Energy - Mr. Amitabh Kant, Chief Executive Officer, Niti Aayog 08
The Decarbonisation of Industry: Challenges and Approaches - Mr. Ravi Raghavan, Editor, Chemical Weekly 10
Indian Specialty Chemicals sector poised for double-digit progression - Mr. Shohab Rais, Chief Operating Officer, Tata Chemicals Ltd. 12
Train Crash Spilled Chlorine - An Opinion by Tom Bauer, RL SCHOLL 14
TGV SRAAC Report on Drivers Training Program for Safe Transportation of Hazardous Goods on the Road 16
Report on National Fire Service Day Observation by TGV SARRC Ltd. 17
Retirement of Mr. K. K. Jand 18
Jal Jeevan Mission - An Update 19
Beacon-Messages for Manufacturing Personnel 22
II. NEWS DIGESTGeneral
India GDP growth to rebound to 11% in FY21-22, moderate to 7% in FY22-23: ADB 24India, Japan, and Australia unveil supply chain initiative 24Commerce ministry starts Covid-19 helpdesk to resolve import, export issues 25Carbon Trading: New emission-markets for a new decade 25Amid Covid-19 pandemic, exports could come as a savior for India 26World Bank raises India’s GDP growth forecast to 10% in FY22 27US to halve its carbon emissions, India to go green by 2030 27 India ranks 87th in global energy transition index 27Exporters fret over delay in rebate rates 282021 will not be about Covid despite second wave: Nirmala Sitharaman 28Exports reviving, may be in positive territory in FY22: Commerce Secretary 28Container shortage at ports has eased 28Export subsidies face WTO challenge 29G20, net zero emissions and India’s role 30India should address water management challenge in adding power capacity: IEA 31Exports surge 282%; imports up 205% during April 1-14 32Exports jump 60 pc in March; falls over 7 pc to USD 290 billion in FY21 32India committed to fight climate change, but not under pressure: Prakash Javadekar 3388% Indian CEOs confident on global economic improvement in a year: PWC 33A holistic approach to conserving water 43Indian economy may clock double-digit growth in 2021: Moody’s 34Extend interest subsidy scheme for exporters 35DGFT''s trade facilitation mobile app to improve efficiency of importers, exporters: Goyal 35
CONTENTS
Chlorine Emergency Response Network Toll free no. 1800-11-1735

India's debt-to-GDP rose to 90% during Covid-19 pandemic, says IMF 35Exports surge 297% in the first week of April 36Government seeks to step up monitoring of imports 36IMF projects India’s growth rate to jump to impressive 12.5 per cent in 2021 36Govt makes identity verification mandatory for new importers, exporters 37RoDTEP Scheme: Revenue Dept vetting Pillai panel’s report on refund rates 37India's exports jump 58% to hit all-time high of $34 billion in March 38India, Mauritius FTA to come into effect from April 1 38Trade policy extended by six months to September 30 39Govt surveys to track migrants, map job creation by 150,000 cos 30
Chemicals and Petrochemicals
Production of Medical Oxygen from modified Industrial Nitrogen Plants 40European chemical industry pushes bioeconomy to support the green transition: Cefic 40Plasticizers for the PVC industry are now available based on chemically recycled feedstock 40PVC Pipes an emerging proxy play on housing, construction 41COVID-19 menace: What govt advisory says about spraying of disinfectant on people? 41Govt. to soon set up panel to fast-track push for hydrogen as fuel 42Govt calls for structural changes in domestic chemical industry 42
Member UnitsReliance teams with US engineering company to set up hydrogen alliance 43Chemfab Alkalis to increase caustic soda capacity 43Chemfab Alkalis commissions 2nd production line for PVC-O pipes 43Tamilnadu Petroproducts charts `435-crore capacity expansion 44
III. NOTIFICATIONS/PRESS RELEASES/ MEMORANDA Gazette Notification by Department of Chemicals & Petrochemicals, Ministry of Chemicals & Fertilizers, Government of India has published the Gazette Notification for extension of date for implementation of quality control order of 9 chemicals. 46
https://drive.google.com/drive/folders/1WdnBiXogoq42N6MKRsHXvOe5apIDMuUC?usp=sharing
Draft Notification No. G.S.R. 258(E) dated 22.04.2021 issued by Ministry of Envionment, Forest and Climate Change Regarding Utilisation of Fly Ash by Thermal Power plant. Comment sought within period of sixty days from the date od publication of draft notification
https://[email protected] 47
Public Notice No. 53/2015/20202 dated 09.04.2021 issued by Ministry of Commerce and Industry, Department of Commerce, Directorate General of Foreign Trade regarding late cut for MEIS applications for exports made in the Financial Year 2019-20.
https://content.dgft.gov.in/Website/dgftprod/c3fc5456-d2e4-4a9e-8fbb-86ed294063fb/Public%20Notice%20No%2053%20dt%209%204%2021%20-English.pdf 49
Trade Notice No. 02/2021-2022 dated 24.04.2021 issued by Ministry of Commerce and Industry, Department of Commerce, Directorate General of Foreign Trade regarding Operationalisation of DGFT ‘COVID-19 Helpdesk' for International Trade related Issues
https://content.dgft.gov.in/Website/dgftprod/55a43a38-cc37-471c-9c66-0c52a395245e/Trade%20Notice%2002%20-Covid%20Helpdesk%20Apr%202021.pdf 49
Final Notification No. G.S.R. 228 (F) dated 30.03.2021 issued by Ministry of Environment, Forest and Climate Change regarding Environment Standards for Lead Stabilizer in Polyvinyl Chloride (PVC) Pipes and Fittings Rules, 2021
http://moef.gov.in/wp-content/uploads/2021/04/228E.pdf 49
Notification No. 23/23/2018-R&R dated 27.04.2021 issued by Ministry of Power regarding Inviting suggestions for preparation of Draft National Electricity Policy 2021
https://powermin.gov.in/sites/default/files/webform/notices/Inviting_suggestions_on_draft_NEP_2021_0.pdf
Alkali Bulletin April, 2021
Disclaimer: Information published in this magazine is reproduced from various sources. Every effort is made to minimize errors while reproducing for publication in Alkali Bulletin. However, readers are requested to verify and make appropriate enquiries and satisfy themselves about the veracity of information published in this magazine before use. The publisher or AMAI will not be responsible for decisions taken by readers based on information published in Alkali Bulletin.

Selection of Finned Surface Heat Exchangers - Selection of Surface Area
Dr. Jagjit Singh Sehra, President, CST Associates
In the previous article, we learned how to calculate the heat load of the product. Now in this article, we will cover that how to calculate the air volume required and how to calculate the surface of the heat exchanger.
Understanding the Air Volume:The air volume over any kind of heat exchanger depends on three factors. These are altitude (height), entering air temperature, pressure, and specific heat at which air is entering the heat exchanger. Let us understand one by one.
a) Effect of Altitude:- An atmosphere (atm) is a unit of measurement equal to the average air pressure at sea level at a temperature of 15 ˚C (59 ˚F). One atmosphere is 1,013 millibars or 760 millimeters (29.92 inches) of mercury or 14. 7 pounds per sq. inch. (definition as per Morgan Stanley). Atmospheric Pressure is also known as barometric pressure. This can be explained by the following Equation:-
Ph=Po*(e)(-mgh/kT)
whereas Ph – Pressure at height h, Po is sea level pressure, g- acceleration due to gravity, k - Boltzmann’s constant, T – Absolute Temperature, m – mass of one molecule. Please refer to chart 1.
b) Effect of Inlet Air temperature and pressure:- The air density also changes with the change in temperature. This can also be calculated by the formula
ρ = R/(T*P)
Whereas ρ - density of air, R – gas constant (0.16722 j/kgK), T is the temperature, and P – the pressure of air. Please refer to chart 2
c) Specific Heat of entering air:- This is also a very important factor. Since here we are dealing with the sensible load only, therefore, we will work on the sensible load equation only. The
specific heat keeps on changing with the change in the temperature.
d) The formula calculates air side load is
Ha = Air Quantity (Volume of air ) * Cp* (Ao – Ai)
Alkali Bulletin April 2021 | 1

Ha – heat load on airside, Cp - Specific heat at constant pressure & Ao – Air temperature out from heat exchanger and Ai – Air temperature at the entry of air.
Selection of the Surface required for the heat exchangerTo select the surface required to dissipate the heat can be calculated by the universal equation that has been used for decades together. This universal equation is
Hl = Ux * LMTD * Ax
Hl – heat load here is referred to as the load that we discussed and calculated in our last article. Ux is referred to as heat transfer coefficient, LMTD is the corrected log mean temperature difference. Ax is the surface area required.
Ux heat transfer coefficient:- All heat exchangers whether it is air-cooled or liquid-cooled, one thing is common which is called metal resistance. This a resistance of metal between the two fluids that are exchanging the heat. As a thumb rule please remember higher the metal thickness higher will be the Ux factor. If we look at the formula clearly indicates that the higher the heat transfer coefficient lower will be area required and vice versa.
Factors affecting the Ux, It is not only the metal resistance the u factor is also sensitive to the velocity of the two fluids, one is liquid or steam flowing inside the tubes and the second is the air blowing outside the fins and tubes. The higher the velocities higher will be the Ux. it means the area required will be less and vice versa. But there
is a limitation on the velocities. Since the two fluids to exchange the heat needs some time.
If the velocities are too high either on one side or both sides, then the heat exchange time will not be there and the heat exchanger will not perform as per the design. On a similar theory if the velocities are too low then the LMTD will be highly affected and the results will not come as designed. As per the industrial experience, the airside velocity should be selected in between 500 feet/mins to 800 feet /min for sensible loads and tube velocity should be designed in between 3 feet/sec to 6.5 feet/sec. Please also remember higher the velocities more will be the pressure drop. On the airside pressure drop will go higher and fan or blower capacity has to be increased. On the liquid side, the elevated pressure will demand higher power requirements for the pump.
The other important factor is the Km, factor. This is also the effect of conductivity, the higher the conductivity lesser will be the surface
required, and vice versa. In the conductivity of the commercial metal copper is highest, then aluminum, brass, cupro-nickel, carbon steel, stainless steel 304 & 316. The conductivity is referred as
W-mt /(m2˚C ), (Btu-ft(hr-ft2˚F) )
LMTD- To select the surface of the heat exchanger we first estimate the air outlet temperature and then LMTD is calculated. LMTD is referred to as the log mean temperature difference. The formula for the LMTD is
LMTD = ((HTs- Cte)- (HTe – CTs)) / (LN (HTs-Cte)/(HTe – CTs))
LMTD – Log mean temperature difference, HTs – Hot Stream Starting Temperature, HTe – Hot Steam Entering Temperature, CTs – Cold Stream Starting Temperature, CTe – Cold Stream Ending Temperature. This formula is for counter-current heat exchangers. Please refer chart 3.
Calculation of Surface AreaGoing back to the equation
(Hi=Ux* LMTD * Ax), now we can
2 | Alkali Bulletin April 2021
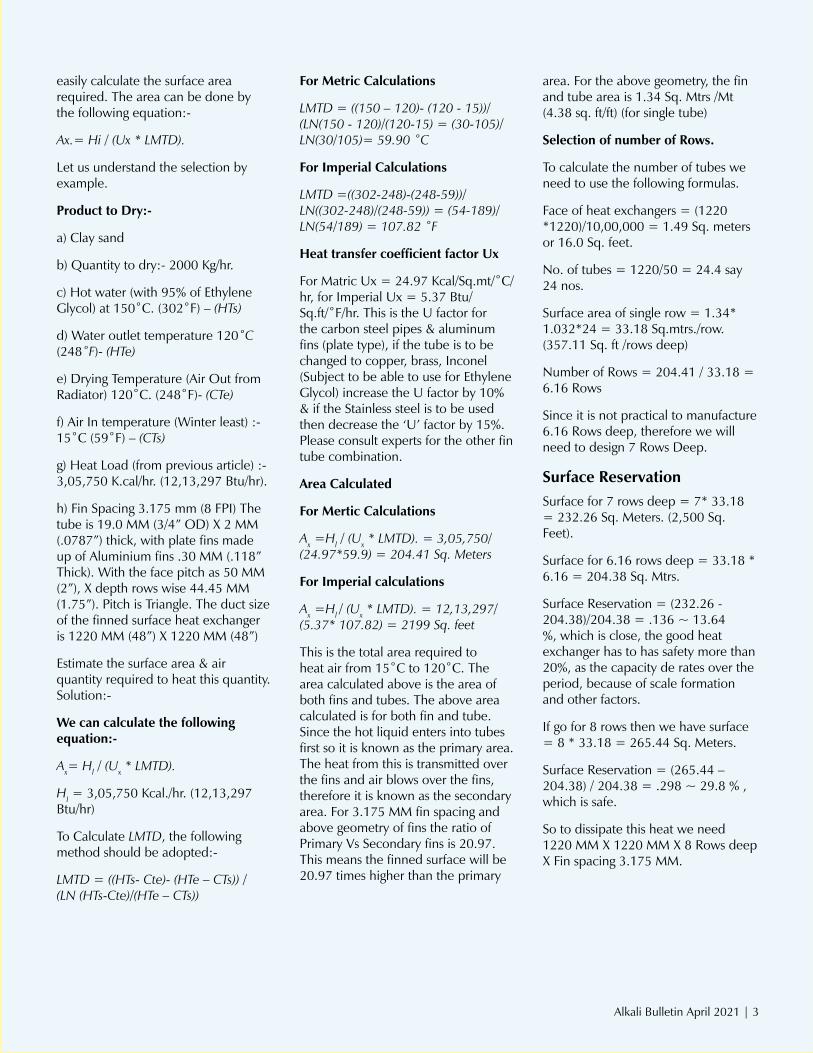
easily calculate the surface area required. The area can be done by the following equation:-
Ax.= Hi / (Ux * LMTD).
Let us understand the selection by example.
Product to Dry:-
a) Clay sand
b) Quantity to dry:- 2000 Kg/hr.
c) Hot water (with 95% of Ethylene Glycol) at 150˚C. (302˚F) – (HTs)
d) Water outlet temperature 120˚C (248˚F)- (HTe)
e) Drying Temperature (Air Out from Radiator) 120˚C. (248˚F)- (CTe)
f) Air In temperature (Winter least) :- 15˚C (59˚F) – (CTs)
g) Heat Load (from previous article) :- 3,05,750 K.cal/hr. (12,13,297 Btu/hr).
h) Fin Spacing 3.175 mm (8 FPI) The tube is 19.0 MM (3/4” OD) X 2 MM (.0787”) thick, with plate fins made up of Aluminium fins .30 MM (.118” Thick). With the face pitch as 50 MM (2”), X depth rows wise 44.45 MM (1.75”). Pitch is Triangle. The duct size of the finned surface heat exchanger is 1220 MM (48”) X 1220 MM (48”)
Estimate the surface area & air quantity required to heat this quantity.Solution:-
We can calculate the following equation:-
Ax= Hl / (Ux * LMTD).
HI = 3,05,750 Kcal./hr. (12,13,297 Btu/hr)
To Calculate LMTD, the following method should be adopted:-
LMTD = ((HTs- Cte)- (HTe – CTs)) / (LN (HTs-Cte)/(HTe – CTs))
For Metric Calculations
LMTD = ((150 – 120)- (120 - 15))/(LN(150 - 120)/(120-15) = (30-105)/LN(30/105)= 59.90 ˚C
For Imperial Calculations
LMTD =((302-248)-(248-59))/LN((302-248)/(248-59)) = (54-189)/LN(54/189) = 107.82 ˚F
Heat transfer coefficient factor Ux
For Matric Ux = 24.97 Kcal/Sq.mt/˚C/hr, for Imperial Ux = 5.37 Btu/Sq.ft/˚F/hr. This is the U factor for the carbon steel pipes & aluminum fins (plate type), if the tube is to be changed to copper, brass, Inconel (Subject to be able to use for Ethylene Glycol) increase the U factor by 10% & if the Stainless steel is to be used then decrease the ‘U’ factor by 15%. Please consult experts for the other fin tube combination.
Area Calculated
For Mertic Calculations
Ax =Hl / (Ux * LMTD). = 3,05,750/(24.97*59.9) = 204.41 Sq. Meters
For Imperial calculations
Ax =Hl / (Ux * LMTD). = 12,13,297/(5.37* 107.82) = 2199 Sq. feet
This is the total area required to heat air from 15˚C to 120˚C. The area calculated above is the area of both fins and tubes. The above area calculated is for both fin and tube. Since the hot liquid enters into tubes first so it is known as the primary area. The heat from this is transmitted over the fins and air blows over the fins, therefore it is known as the secondary area. For 3.175 MM fin spacing and above geometry of fins the ratio of Primary Vs Secondary fins is 20.97. This means the finned surface will be 20.97 times higher than the primary
area. For the above geometry, the fin and tube area is 1.34 Sq. Mtrs /Mt (4.38 sq. ft/ft) (for single tube)
Selection of number of Rows.
To calculate the number of tubes we need to use the following formulas.
Face of heat exchangers = (1220 *1220)/10,00,000 = 1.49 Sq. meters or 16.0 Sq. feet.
No. of tubes = 1220/50 = 24.4 say 24 nos.
Surface area of single row = 1.34* 1.032*24 = 33.18 Sq.mtrs./row. (357.11 Sq. ft /rows deep)
Number of Rows = 204.41 / 33.18 = 6.16 Rows
Since it is not practical to manufacture 6.16 Rows deep, therefore we will need to design 7 Rows Deep.
Surface ReservationSurface for 7 rows deep = 7* 33.18 = 232.26 Sq. Meters. (2,500 Sq. Feet).
Surface for 6.16 rows deep = 33.18 * 6.16 = 204.38 Sq. Mtrs.
Surface Reservation = (232.26 - 204.38)/204.38 = .136 ~ 13.64 %, which is close, the good heat exchanger has to has safety more than 20%, as the capacity de rates over the period, because of scale formation and other factors.
If go for 8 rows then we have surface = 8 * 33.18 = 265.44 Sq. Meters.
Surface Reservation = (265.44 – 204.38) / 204.38 = .298 ~ 29.8 % , which is safe.
So to dissipate this heat we need 1220 MM X 1220 MM X 8 Rows deep X Fin spacing 3.175 MM.
Alkali Bulletin April 2021 | 3

About the Author:-
Dr. Jagjit Singh Sehra’s life was moved by two personalities, one Sikh’s first Guru Nanak Dev Ji & Other Dr. Abdul Kalam, ex-President of India. Guru Nanak Dev Ji wrote a shalok in Japji Sahib ‘Pawan Guru, Pani Pita, Matta Darat Mahat’, which means Air is teacher and water is a father and they both are nurturing mother earth. Till mankind takes care of these resources nothing will happen on earth. The time has come when we need to blend the laws of Physics and Law of Nature and give solutions to the world on how to save water and air. Humans are searching for life on other planets, the first things they look for are water and air. But on our own planet, we are misusing both. Everyone on this planet is for a short span, we need to educate the people to save the natural resources that have been given free to us. As responsible citizens of the global village, it is everyone’s responsibility to take care of these natural resources and handover a clean environment for the next generation.
Dr. Jagjit Singh Sehra invites people to join him and help companies and society to save water or generate water. You can also get connected with him through his website at www.drjagjitsingh.com or send him an email at [email protected].
Air Quantity RequiredIt is clear up to know that how much area is required. Now we need to calculate how much is air quantity is required to be blown over the fins and how much liquid flows inside the tube.
a) Air Quantity Required = (Heat Load)/(Specific heat of entering air * (Air Out – Air IN)
Air Quantity Required = (3,05,750)/(.2402*(120-15)) = 12122.83 Kg/hr (.2402 K.cal/kg˚C Specific
heat of air at 15˚C
4 | Alkali Bulletin April 2021
Dr. Jagjit Singh Sehra, President, CST Associates
Air Quantity Required = 12,122.82 Kg/hr * 1.225 = 14,850 Cubic Mtrs/hr. (8,740 CFM)
b) Face Velocity over the finned surface
The face area of the heat exchanger = 1.49 Sq. Meters (16.0 sq. feet)
Air Velocity = Air Qty/ face area = 14,850/1.49/60/60 = 2.76 Meters /sec (550 Ft/Min.) , which is in the range of our selection.
In this article, we observed the following things:-
i) How to calculate the heat load of the product (March Article).
ii) How to calculate the surface of the heat exchanger required?
iii) How to size the finned surface heat exchangers?
iv) How to calculate the air quantity required to dissipate the heat?
In the coming articles, we will cover the following topics.
i) How to calculate the water/steam required to operate the above-designed heat exchangers.
ii) How to calculate the airside & liquid side pressure drops.

This study reports a comparison between vapor absorption versus vapor compression cycle for generation of chilled water. The two principle type of refrigeration plants are found in industrial use are: Vapor compression refrigeration (VCM) and vapor absorption refrigeration (VAM). VCM uses mechanical energy as the driving force for refrigeration, while VAM uses thermal energy as a driving force. VCM and VAM, both accomplish the removal of heat through the evaporation of refrigerant at low pressure and rejection of the heat through the condensation of refrigerant at high pressure. The method of creating the pressure difference and circulating the refrigerant is the primary difference between the two cycles.
This paper is prepared on the basis of actual data and will provide advantages & disadvantages of both the system. This paper also help to select type of refrigeration suitable for provided conditions. The performance of the system were analyzed double stage Vapor Absorption Machine to single stage Vapor compression cycle with the same heat load condition.
Evaluation Criteria The following heads are considered to compare VAM against VCE
1. First Cost2. Economics3. Operating Cost 4. Maintenance 5. Advantages & Disadvantages
Lowering the Chilled Water Generation Cost throughVapor Absorption Machine (VAM) or Vapor Compression Machine (VCM)
Mayak Shukla, Grasim Industries Ltd.
First Cost The first cost difference between both the equipment is not significant difference. We are considering that chilled water requirment at 7°C. The refrigeration screw chiller flooded cost is 1.3 times of vapor absorption machine. The first cost data for both the machine is given below in the table-1. The capital cost of VAM is lower (at least30%) than compression system but when electric services, transformers, switch gear, cabling, space are significant component in VCM.
Product Cost Capacity
Lacs TR
Vapor Absorption Machine
60 300
Vapor Compression Cycle
90 300
Table-1 First cost difference between both the Machines
An economic comparison is made between VAM & VCM. The comparison between these two technologies is carried out based on energy efficiency, cost, complexity,
and pay back period perspectives.
The results have indicated that either system, VAM or VCM, is cost effective regarding their energy source & cost. The difference in working shown in figure-1.
Economics Selection of the type of refrigeration equipment to meet a given cooling duty depends upon the several variables
1 Refrigeration load 2 Temperature levels3 Energy source of driving 4 Quantity available & temp. of
condensing media 5 Space
The actual operating cost is compared for both the system including actual maintenance cost. Here, we have consider a span of 5 years for NPV calculation.
The critical parameters for both the system are shown in table-2. Cost of Machine per TR is taken from the actual data. The chilled water temperature is designed for 7 & 12°C. The efficiency of VAM is poor
compared to the VCM. Hence, it is always beneficial to consider VAM in case of waste heat, process hot water, and low cost fuel like hydrogen in chlor-Alkali.
In actual operating condition VAM
Vapor Compression (VCM)1. Compressor
Vapor Absorption (VAM)1. Absorb vapor in liquid while removing heat2. Elevate the pressure of liquid with pump3.Release vapor by applying heat
Condenser
Evaporator
Expansion Valve
High Pressure Vapor
Low Pressure Vapor
Figure-1 Basic Difference between VAM and VCM
Alkali Bulletin April 2021 | 5

are observed higher energy consumption against the rated. Hence, 7% higher steam consumption is considered for above operation. The actual cost of operation is shown in table-3.
Operating Cost Comparison It is visible form the table that annual operating cost at provided energy price have 35 Lacs difference between VCM and VAM. The VAM is energy consumption is higher in all aspects. The equivalent operating cost for both the system at steam cost of 850 Rs/ton, either electricity cost at 8 Rs/unit.
The annual maintenance cost also higher in VAM case. The AMC charges for VAM is 1.3 times of flooded chillers due to the complexity of the system.
The NPV of the system is evaluated and presented for 5 years. Which have a difference 21% operating cost. The VAM machines offer less life of the equipment against VCM. The VCM life is suitable for 20-25 Years whereas the VAM life is 15-20 Years.
In practical operation, it is observed that the LTHE & HTHE, and pump failure is common at 5- 8 years’ time line. VAM is using Li-Br Solution, which is corrosive so inhibitor must be added to protect the system against the metal corrosion. Li-Br is also highly viscous.
LiBr absorbent is prone to crystallization. If something goes wrong in the cycle. The salt and water would permanently separate and
the LiBr will crystallize on the wall of the absorber. As it become solid, it will not flow so the chiller will stop working. The cause of crystallization may be lower cooling water temperature. At a concentration of 65% LiBr solution crystallize at 42 °C, with concentration of 60°C at 17 °C and with concentration 55% lower than 15°C
The advantages and disadvantages for VAM and VCM are shown in the table-4 & 5.
The utility consumption is one of factor which required to consider during purchase time as each utility have important factor site to site. The utility consumption for 300 TR machine is provided in table-6.
Maintenance The machine maintenance is critical factor to consider for any site. VAM is a complex machine to maintain. It is made in two part lower and upper shell. Normally opening and closing is not done by the site maintenance team. It is require skill VAM inspection mechanic.
The annual maintenance contract provided by the OEM and it is expensive when compared to VCM maintenance contract. It is 1.4.
The VAM major maintenance is in every 3 -4 years. It is observed the purge pump and HTHE, LTHE failure is very high. The LiBr concentration is critical and crystallization will also cause major maintenance issue.
For VCM, the compressor maintenance and refrigerant leak are the major cost. Normally, it is seen that compressor major maintenance is rare.
The cost of maintenance is 1.6 times against the VCM maintenance cost. For eight year operation, the recurring maintenance cost is shown in figure 2. The 5th, 6th, and 8th year have significant cost difference is due
6 | Alkali Bulletin April 2021

ResultsIt can be seen that each system has some advantages and disadvantages over the other. The total cost of VCM system is about 21% cheaper than the VAM. Although, the payback period is higher for the VCM. The VAM is less noisy than VCM. We would go for an absorption machine only.
• When excess heat source is available, for, e.g. availability of excess steam in boiler.
• LP steam available for dump condenser, this can be used to run the VAM.
• When heat is ineffectively dissipated into atmosphere, for, e.g. exhaust from DG, steam from turbine outlet, flue gas exhaust, water evaporation unit.
• When the operational expenditure is very much lesser than the VCM, for, e.g. when the industry is facing issue with power supply from the grid.
• When the production cost of steam negligible, for, e.g. use of hydrogen to generate steam in chlor-alkali industry.
The summary table is shown the major factors between VAM and VCM.
Conclusion An economic comparison is made between a vapor compression refrigeration system powered by electricity and a vapor absorption system powered by thermal energy. The comparison between these two systems is carried out based on every minor and major aspect like energy efficiency, cost, NPV, maintenance etc.
The data shared in this paper is from actual operating system in India. The results has indicated that either system, VCM and VAM, is cost effective regarding their life cycle cost. Which is critical to consider in any purchase or replacement. However, sometime simple payback period is quite confusing and not provide the real picture.
However, after analyze all of the parameters considered, one would prefer and go for the VCM, although it involves noisy compressors, since it is lower and cheaper operating cost in long run operation. VCM is also less bulky, and easily available in the market, simpler and requires lower maintenance; wide system application in industry and commercial building.
This would also keep in mind that VAM system can used only in case of cheap energy source and waste heat recovery option, in addition to the possibility to combine with domestic hot water system.
AuthorMayank Shukla is BE (Chemical)-AGM (Process Engineer) and working with Technical services in India
largest chlor-alkali business house. He is an Accredited Energy Auditor (Gov. of India). His current role involves process, design, troubleshooting, and project management for Grasim Industries.
He is executed various ENCON, Process improvement, and benchmarking project for ABG Group. Prior to join ABG, he worked in for India Largest refinery, Jamnagar. Technical review for CDU and Utilities off sites. He worked as senior process engineer in Air Liquid INC. (former Lurgi India Pvt. Comp.). Mr. Mayank Shukla has earned his chemical engineering from university of Meerut, India.
to failure of purge canned pump, LTHE, and HTHE. Whereas the VCM have 6th & 7th year high cost due to refrigerant leak. The maintenance cost of VCM has increased from 5th year onward due to maintain and overhaul the compressor every year to maintain the performance.
Figure-2 Maintenance Cost of VAM versus VCM
Alkali Bulletin April 2021 | 7

Energy is a master resource which has the ability to catapult or cripple a growing economy. The rising threat of climate change has transitioned from climate-science conferences to billions being spent on disaster relief expenses. Global markets are increasingly demanding carbon-free products. Realizing the impending threat to their economies, several countries have announced net-zero targets. The top two energy consumers and emitters, the US and China, recently released a joint statement on climate change.
Electricity dominates the public discourse on the energy economy. However, it accounts for only18% of India’s total energy demand. The rest 82%comprises other energy sources
such as coal, oil and gas, and biomass. Unfortunately, our energy sector is heavily import-dependent (85% for crude oil, 53% for gas and 24% for coal). The volatility in the prices of these fuels has a huge impact on the import bill, to the tune of $160 billion. These numbers will double over the next decade as demand grows.
India will overtake the European Union as the world’s third-largest energy consumer by 2030, according to the International Energy Agency (IEA). In its recent forecast, India will account for the biggest share of energy demand growth over the next two decades. This creates challenges but also new avenues of growth. India has the potential to completely
re-imagine its energy economy in consonance with demand for clean and sustainable products. This can be achieved by leveraging the results of decades of innovation in the clean energy sector. In the process, India can show the way to developed countries that sustainability and rapid growth can go hand-in-hand.
Green hydrogen (H2) is made by splitting water (H20) via renewable power. Over time, green hydrogen, as an energy carrier, can replace some of our energy imports. This is feasible, given
India’s record-low renewable power prices (`1.99/$2.7 cents per kWh).The Global Hydrogen Council has in a recent study classified India as a net exporter of green hydrogen from 2030, thanks to cheap renewable tariffs. Hydrogen is also a chemical feedstock with an existing global market of about 70 million tonnes. India already consumes about 6 Mt of hydrogen (8.5% of the global demand) annually that is made by reforming 18 Mt of import-dependent natural gas.
More than 25 nations have set up roadmaps for Green hydrogen, including mandates and financial incentives to accelerate the transition to it. Wind and solar energy can provide the electricity to power homes and electric cars, but green hydrogen could be an ideal power source for energy-intensive industries like refining, steel, cement, heavy mobility and industrial heating.
Green Hydrogen can Spearhead India’s Transition to Clean EnergyAmitabh Kant, Chief Executive Officer, Niti Aayog
8 | Alkali Bulletin April 2021
It has the potential to not just slash imports but also transform the country into a global leader on climate-change mitigation

India is the world’s third-largest emitter, with 3.6 giga tonnes of CO2 equivalent across sectors, and green hydrogen will have to play a role in our development transition.
Globally, governments are pushing to transform the existing hydrogen industry from a dirty/grey hydrogen ecosystem to a clean energy-based green hydrogen ecosystem. Some countries with rich gas and petroleum reserves are also pushing for a blue-hydrogen economy, as it opens up a new market for them. On the other hand, India, with limited local hydrocarbon resources and huge renewable potential, can become a major producer of green hydrogen on account of its low solar prices.
Green hydrogen is critical to meet India’s target of 450 gigawatt of renewable energy by 2030. That target is extremely ambitious. Due to surplus generation of renewables in peak-generation hours, with further addition of renewables to its power grid, India will face a ‘duck curve’, as experienced by California. To utilize cheap solar power, currently at `2.0/kWh, we need to find other uses for solar power during its generation hours. Through the scaling up of green hydrogen from renewables, we will require a significant amount of renewable energy capacity addition to help India march towards its 450GW target. Electricity typically accounts for 70% of the production cost of green hydrogen. Hence, surplus electricity from India’s renewable plants can
augment green hydrogen economics. This will also protect the grid.
West Asian countries, Chile and Australia are aiming to become major players in green hydrogen. An energy consortium in Australia has just announced plans to build a project called the Asian Renewable Energy Hub in Pilbara that would use 1,743 large wind turbines and 30 square miles of solar panels to run a 26-gigawatt electrolysis factory that would create green hydrogen to be sent to Singapore. India can learn from global trends and leverage its vibrant clean energy industry to shape its green hydrogen market.
Green hydrogen is a sunrise industry and will enable Indian entrepreneurs to capture new avenues of growth. Locally-available green hydrogen can attract high-value green industries, like green steel and green chemicals, to shift production to India. Localization of electrolyzer production and development of Green-H2 projects could create a new green technology market worth about $18-20 billion in India and generate domestic jobs. In addition, there is a massive opportunity to create regional hubs to export high-value green products and engineering, procurement and construction services, given the nascent stage this industry is in.
So what should India do to build a global-scale green hydrogen industry? First, it should announce ambitious targets for green hydrogen
and electrolyzer capacity by 2030 on similar lines as renewables. Second, mandate blending a certain percentage of green hydrogen with grey hydrogen for existing applications like oil refining and fertilizers, depending on the viability gap, and mandate new green field capacities of hydrogen applications like oil refining and fertilizers to use only green hydrogen from a future cut-off date (to avoid long term lock-ins). Third, India should aim to build a vibrant hydrogen products export industry, such as green steel, using a phased manufacturing programme. Fourth, India should form a regional alliance with South Korea, Japan and Singapore to export green hydrogen from coastal India to help them reach their net-zero ambitions. Fifth, capital cost contributes around 30% of green hydrogen costs, and dollar-linked contracts for procurement of hydrogen should be explored in relevant demand sectors, as is done for oil and gas. Last, India should plan to roll out a production-linked incentive scheme for electrolyzer manufacturing to address the huge global supply bottleneck.
Green hydrogen is the future of energy. It has the potential to radically reduce imports and catalyse India’s transition to climate-action leadership.
These are the author’s personal views.
(Reproduced with permission from Live Mint 26, April 2021)
Alkali Bulletin April 2021 | 9

Energy is critical to economic growth, and its availability and price in its myriad forms, of which fossil fuels are currently the most dominant, has shaped economies and geopolitics. Increasingly, however, concerns over climate change have brought pressure on major economies, India included, to reshape energy policies, and look to ways to decouple economic growth from consumption of carbon-bearing fuels. This decarbonisation still has a long way to go, mainly due to techno-commercial challenges, but the direction that much of the world has set on is irreversible and will be good for the planet.
Though the term ‘decarbonisation’ has been applied to chemicals as well, it is somewhat of a misnomer. Organic chemicals are by definition based on carbon chemistry, and what can only change is the source of this carbon. And that is happening, as well – albeit in a more cautious and unsteady manner. The transformation of chemical manufacture – call it a recarbonisation – refers to the use of renewable carbon, be it from agricultural biomass or from the recycling of fossil-based carbons. Both trends are gaining momentum – the latter more than the former.
The target of ‘Net Zero’ growthAt the start of the ongoing pandemic, a little more than a year ago, there were concerns that ‘green’ issues would be pushed back, as governments struggled to cope with the onslaught of economic and social challenges. But it hasn’t. 2020 actually saw the convergence of several forces that will drive the energy transformation agenda over the remainder of this decade, and
even further out, at a faster pace than anticipated at the beginning of 2020.
One manifestation of the renewed focus on ‘greening’ energy and industrial production has been the steady roll-out of announcements by some of the major economies and companies to go to ‘net zero’ carbon-based growth. While there is no standard definition of ‘net zero’, the broad understanding is that it involves a combination of approaches targeted at reducing and removing carbon dioxide (CO2) emissions. The idea is to maintain a balance between greenhouse gas (GHG) emissions produced and removed from the atmosphere.
Country level commitmentsWhile the European Union, which accounts for about 7% of global CO 2 emissions, was first off the block with a ‘net zero’ announcement as far back as November 2018, it was China’s announcement in September 2020 that was most significant. The country is the world’s largest CO2 emitter, accounting for a quarter of global emissions, and the stating of a national goal, even in the absence of a clear road-map on what it actually means or how it is to be achieved, is not without significance. Since then, similar goals have been spelt out by Japan, South Korea and Brazil, amongst others. In all, more than 100 countries (covering about twothird of global GHG emissions) have announced this hazy ambition (which is not to say that they are all working to achieve it). The regime change in the US has raised hopes that the country will follow sometime this year. As a first step, it has agreed to re-join the Paris Agreement from which President Trump had infamously
pulled it out.
India – the world’s third largest GHG emitter, behind China and the US – has raised its targets for renewable energy to 450-GW (excluding large hydropower), representing a five-fold increase over the current levels and two and half times the pledge made in the Paris Agreement. For now, India seems to be comfortable with its stated goal of an ensuing 33-35% reduction in CO2 emissions between 2005 and 2030. The reticence to announce something more ambitious stems from the fact per capita energy levels here are still much below global averages, and setting stiffer targets could force the government to rein in energy consumption. Nevertheless, there is pressure mounting on multi-lateral forums for India to also set a ‘net zero’ goal, and an announcement could possibly come sooner than later.
Corporate announcements2020 was also a historic year for corporate ‘net zero’ announcements. In the oil & gas industry, six European international oil companies committed to this goal, albeit at somewhat varying timelines.
Just a couple of weeks ago, China’s Sinopec Corp, Asia’s largest oil refiner, announced that it aims to be carbon-neutral by 2050, with its near-term strategy focused on natural gas development and a long-term pivot to hydrogen, ahead of national deadlines.
Closer home, Reliance Industries Ltd. (RIL), operator of the world’s biggest refining complex, said its non-energy businesses and increased use of renewable power would help it meet a goal of ‘net zero’ by 2035.
The Decarbonisation of Industry: Challenges & ApproachesRavi Raghavan, Editor, Chemical Weekly
10 | Alkali Bulletin April 2021

In the core chemical industry, German chemicals giant, BASF, announced in March this year that it is planning to spend up to `4-bn to cut GHG emissions by a quarter by 2030, on the journey to become carbon-neutral by 2050, despite investments in new
manufacturing assets and expansions of existing ones. The plan draws the company level with promises made over the last two years by rivals such as Dow and DuPont.
In November last year, German speciality chemicals company, Lanxess, said that by 2040 it intends to eliminate GHG emissions, from around 3.2-mt of CO2e today, and get half way there by 2030. Other large chemical companies that have made similar announcements include: UK-based Ineos, which has committed to staying ahead of EU climate and energy targets in the drive to ‘net zero’ GHG emissions across its businesses in the Port of Antwerp, Belgium by 2050 at the latest; and Finland-based water treatment chemicals specialist, Kemira, which announced that it was aiming for a 30% reduction in GHG emissions by 2030, and to be carbon-neutral by 2045.
Multiple approachesSeveral approaches are being taken by the companies to achieve these goals.
The switchover to renewable energy – especially solar, wind and biomass – is an important one. Lanxess, for instance, has stated that one of its major impact projects includes switching the entire energy supply at its Indian sites (including Nagdha and Bharuch) to renewable energy (especially from biomass). BASF was also planning on using renewable energy (solar) at its proposed propylene-derivatives project with the Adani group, but the plans have been put on the back-burner for now.
New technological approaches
are also being taken to lower the carbon-footprint of manufacturing processes. BASF, for example, recently announced it is partnering with engineering company, Linde, and petrochemical major (and competitor in some segments), SABIC, to scale up use of electrical energy (instead of fossil fuels) in steam crackers. If the electricity comes from renewable sources (which is the aim) and the technical challenges (and there are several) are overcome, this will represent a significant advance in the manufacture of basic petrochemical feedstock (olefins), and lay the platform for a range of ‘greener’ petrochemicals. To cite another example, Lanxess has recently brought into operation a facility for the decomposition of nitrous oxide – a notorious GHG that comes as an inevitable by-product in the manufacture of nitric acid and adipic acid – at its Antwerp site. German polymer expert, Covestro, has recently put into operation a pilot plant to produce the rigid foam component, MDI (methylene diphenyl diisocyanate), based on the adiabatic-isothermal phosgenation technology at its Brunsbüttel (Germany) site. The technology has several advantages: up to 40% steam and 25% electricity savings per tonne of MDI produced; CO2 emission reductions by up to 35%; and production output increase by 50% compared to the technology currently in use.
Aside the use of wind and solar energy, the use of ‘green’ hydrogen is also a recurring feature amongst the decarbonisation efforts. In contrast to conventional (‘grey’) hydrogen, which comes from fossil fuels (mainly natural gas), ‘green’ hydrogen comes from the electrolytic splitting of water, with the electricity coming from renewable sources. Several projects – many in collaborative networks with companies having complementary skills – are in the works and the technology is on the cusp of deployment at industry-relevant scale.
In India, RIL, for instance, is working on different options for producing ‘green’ hydrogen, while Indian Oil Corporation has recently signed a preliminary agreement with Norway’s Greenstat to set up a Centre of Excellence on hydrogen, with focus on technology development.
Carbon capture, utilisation and storage projects have a place as well. Covestro, for example, makes a polyurethane foam component (a polyol) using CO2 as a feedstock on industrial scale, and has recently showcased the first CO2-based surfactants with good washing and biodegradation properties. Carbon Recycling International (Iceland), is scaling up production of methanol from CO2 emissions, while LanzaTech (USA) produces ethanol from the CO2 emissions of steel plants by using microorganisms. Carbon capture and sequestration is also being deployed at scale, but its use is limited by the need for nearby underground reservoirs or depleted oil & gas wells into which the GHG can be pumped and locked away for good.
Government support keyAs pressure mounts on the energy, chemicals and materials industries to reduce its carbon emissions, governments and companies are betting on several options. While some of the technologies being deployed have matured and are on the path of rapid commercialisation with falling prices (think solar and wind), others (such as ‘green’ hydrogen) still face uncertainties as regards capital costs and competitiveness, especially when scaled-up. Enabling governmental policies and fiscal support to mitigate risks is critical.
With limited conventional energy resources, India has a lot to gain by engaging substantially in the emerging energy transformations.
(Reproduced with permission from Chemi-cal Weekly, 13 April 2021)
Alkali Bulletin April 2021 | 11

The Indian chemical industry is one of the fastest-growing industries in the world. The specialty chemical segment, at USD 32 billion in 2019, constitutes about 18% of the total chemical industry in India. Chemical manufacturing is one of India’s oldest and most diversified industries. The industry’s growth is mainly driven by consumption growth and export opportunity. In the recently announced Union Budget the Finance Minister has stated for India to become a 5 trillion economy, our manufacturing sector has to grow in double digits on a sustained basis. To achieve this goal, manufacturing
companies need to become an integral part of global supply chains.
Specialty chemicals are driven by extensive product R&D and innovation, which is a significant differentiator over the commoditized chemical industry. These chemicals are derived from basic chemicals and are sold on the basis of their functions. For example, paints, adhesives, electronic chemicals, water management chemicals, oilfield chemicals, flavours and fragrances, rubber additives, paper additives, industrial cleaners, and fine chemicals, sealants, coatings, catalysts, etc. come under this category.
China being the obvious choice of the most international buyers’, it supplies to the majority of nations and industries. China’s low costs and manufacturing prowess have turned the country into a powerhouse exporter of all manner of industrial goods. However, the global Covid-19 pandemic has changed the geopolitical circumstances of the marketplace. Also, China has also become more vigilant about the environmental standards in producing these specialty chemicals resulting in closure or lower operating rates of units that are found flouting these norms further resulting in the disruption of supply chains. The world is now sensitive towards such deliberations and is actively exploring alternate suppliers who are not just adhering to global environmental norms and can be relied upon for the consistency of supply chains. Also, increasingly focus on producing green chemicals is gaining ground. Governments are now pushing the climate change agenda and expect the chemical industry to adhere to the new norms in order to contain air and water pollution.
The new decade will be a new chapter for the entire sector with multiple factors at play. Indian producers have identified the opportunities and so has the Interest in India as an alternative to China spiked following supply disruptions that arose with the COVID-19 pandemic. This was further accelerated with timely Government interventions and the Atmanirbhar Campaign which has enabled Indian players to cater to the demand for Specialty Chemicals in 2020.
Indian Specialty Chemicals Sector Poised for Double-Digit Progression
Mr. Shohab Rais COO (Indian Chemical Business) Tata Chemicals Ltd.
12 | Alkali Bulletin April 2021

Growth drivers of the segmentThe schemes like PLI announced by the government provides opportunities to the manufacturing sector are steps in helping the overall growth of the sector. Many downstream multinational companies that imported the bulk of their chemical requirements from China may consider supplementing this supply from elsewhere and large chemical markets that remain accessible in this scenario could present opportunities for Indian chemical companies.
The shift in production and consumption towards Asian and Southeast Asian countries in all sectors leading to increasing demand for Specialty Chemicals. Also, the number of patents that are being applied increases the scope for launching new products in the market. Changing consumer preferences towards a healthier lifestyle and environment-friendly products has further given a boost to the sector hugely.
Paints, textiles, cosmetics, healthcare, cleaning agents all of these sectors are now opting for ingredients that are environmentally friendly and provide protection from viruses and microbial germs. The demand will further go up as the Finance Minister announced 7 mega investment textile parks to be developed in 3 years. Health and hygiene have taken the centre stage due to the Covid-19 pandemic and this trend is expected to continue even after the vaccine is launched in the future.
Challenges ahead for the sectorA recent report by HDFC Securities said that the growth of specialty chemical companies will depend a lot on their ability to innovate. Indian chemical companies have augmented investments in R&D activities and India’s share in the aggregate R&D spending incurred over the globe by chemical companies has grown from 2.7 percent in CY08 to 3.3 percent in CY18.
One of the major challenges in the sector is due to the large number of unorganised players. About 30% of the sector comprises of the unorganised players today. These players are generally are constrained with resources like finances, talent, system perspective etc. and hence find it challenging to meet the ever changing customer needs and the regulatory norms.
China, which has a 20 percent share of global specialty chemicals revenue, tightened environmental norms resulting in closure or shifting of capacities in 50 chemicals manufacturing clusters. More closures are expected in the Jiangsu province over the next two fiscals. This supply disruption and increasing cost of compliance for Chinese players have meant global end-user industries diversifying their vendor base, including tapping Indian players. But, are Indian producers ready to re-calibrate the scale of their production capacities and supply chain logistics at the required pace to meet the incoming demand.
Conclusion The Specialty Chemicals sector is poised for double digit growth in the coming year. This industry is currently valued at $32 billion and is expected to reach $65 billion by FY25. Amid the COVID-19 crisis, [1] the global market for Specialty Chemicals which was valued at $644.8 bn in 2019, is projected to reach $844.2 billion by 2027, growing at a CAGR of 3.7%.
India still lags behind the major developed nations in chemical consumption on a per capita basis. Growth in disposable income and an increase in urbanization is leading to the growth in the end-user segment like paints, personal care and home care, textiles, and adhesives. This, in turn, is emerging as one of the significant contributors to the top-line growth of specialty chemicals in India.
AuthorShohab Rais is the Chief Operating Officer, Indian Chemical Business, Tata Chemicals Ltd., who oversees the efficient operation, development and growth of the Indian chemical business in India. He has over 33 years of industry experience in diverse fields ranging from chemicals, manufacturing, power plant operations and appliances. He has graduated in Arts after studying mechanical engineering and holds a masters’ degree in marketing management from NMIMS, Mumbai. He has also completed an advanced management programme at the University of Maryland, US, and the executive leadership programme of the Michigan University at TMTC, Pune.
(Reproduced with permission from Chemi-cal Industry Digest April 2021)
Alkali Bulletin April 2021 | 13

April 11 marks the 25th anniversary of the 1996 Alberton, Montana, train derailment and chlorine spill. While Montana Rail Link engineers barely escaped with their lives, a transient rider on the train died from severe chlorine exposure. Across the Clark Fork River, motorists were caught in the spreading chemical fog. An estimated 1,000 residents evacuated, and hundreds sought medical aid in the days to follow. Eventually, 2,000 people filed claims.
Some 130,000 pounds of liquid chlorine leaked, converting to chlorine gas, the largest chlorine spill in U.S. railroad history. Chlorine expands to a gas 460 times the volume of the liquid form. As it mixed with moisture and air, the gas converted to hydrochloric and hypochlorous acid in mists that filled the valley and travelled in all directions, mostly east towards Missoula. Based on models and peoples’ symptoms, dangerously high levels of chlorine spread for miles, often in pockets.
As residents from Cyr to beyond Ninemile Exit fled to Frenchtown and Missoula, they acutely suffered burns to their respiratory tract, eyes and skin. Thanks to the heroic efforts of Alberton volunteer firefighters, with help from some Frenchtown volunteer firefighters and Missoula County sheriff’s deputies, casualties were lessened during evacuations. Many responders had poor or no respiratory
protection, risking their health and lives.
Attached to a string of 90-ton chlorine tanks was a tank of potassium cresylate, a toxic caustic solution used to filter mercaptans from natural gas. During the violent train crash, one end of this tank ripped open, disgorging 17,000 gallons of waste into the ditch alongside the tracks, butting heads with the ruptured chlorine tank. Simultaneously, some chlorine spilled into the ditch, and the two chemicals reacted to form highly toxic chlorinated compounds. Later tests showed no sign of deposition of compounds beyond 250 feet of the site, but residents reported a pesticide-like smell long afterward that matched the smell of chlorinated phenols.
Some 50 tons of liquid chlorine remained in the ruptured tank, with an ice skin periodically thawing and refreezing, releasing fresh bursts of deadly gas, which also vented from iced chlorine trapped in the surrounding soil, during warming rains and disturbance. Day after day, responders struggled to patch the tank and transfer its deadly cargo in Level A protection. Just 10 parts per million concentration of chlorine gas is the IDLH level — immediately dangerous to life and health.
While residents waited in motels for technicians to solve the leaking tank
and the evacuation stretched on, they were allowed limited visitations to evacuated areas outside the designated Hot Zone to care for pets and livestock left behind or retrieve animals and possessions. Back in Missoula, evacuees attended daily public meetings that often became contentious. Many residents were anxious to return home, while others were fearful of possible contamination. Some residents reported exposures and aggravated symptoms during their visits.
After 17 days, the chlorine tank was finally emptied, and all residents allowed to come home. I-90 reopened after the longest closure in history. MRL spent another few week remediating the site before the final removal of hundreds of cubic feet of contaminated soil.
While many residents rushed to settle claims with MRL, others balked, distrusting official assurances that injuries would heal soon or in a few weeks. Many claimed that returning home made them ill, and some stayed out, even abandoning Alberton. The long-term health consequences of the Alberton chlorine spill would reveal itself in the years to come.
(Source: https://missoulian.com/opinion/columnists/opinion-train-crash-spilled-chlo-rine/article_ecf936d5-6459-5df4-8852-9a4215f48f53.html)
Opinion: Train Crash Spilled Chlorine
Ron Scholl is rolling out "Alberton, Montana: A Toxic Train Wreck," about the 1996 train wreck and chlorine spill in blog form over the next three months
Tom Bauer, RL SCHOLL
14 | Alkali Bulletin April 2021

Created for those in search of perfection...!
APPROVED*
&
bellowseal.com

16 | Alkali Bulletin April 2021
Drivers Training Program on Safe Road Transportation of Hazardous GoodsA Report by TGV SRAAC Limited
Driver Training Programme Activities in Progress at TGV SRAAC Ltd.
TGV SRAAC Limited organized 3-day long Drivers Training Program on “Safe Road Transportation of Hazardous Goods” from 07.04.2021 to 09.04.2021 at their works Kurnool, Andhra Pradesh. The program was inaugurated and presided over by Mr. N. Jeswanth Reddy, E.D. (Tech).
During his address, he explained the importance of safe driving & asked to follow COVID guidelines during pandemic time. Mr. G.K. Agarwal, emphasized to follow road safety protocols while carrying hazardous goods on the road. Introduction on training program was given by Mr. B. Sathyanarayana, Director of M/s I Care Services, Anantapur.
129 number of participants attended the program with 123 participants in 3 days fresher and 6 participants in one day refresher program.
During training, various topics were covered including the causes of accidents, accident statistics, highway driving followed by film, heads-on collisions, night driving, various first aid techniques, safety measures to be adopted during transportation of hazardous goods, fire-fighting techniques, UN Classification Numbers, Hazchem Code numbers, TREM CARDS (Transport Emergency Cards), interaction with the drivers, etc.
During the valedictory function held on 09.04.2021, Mr. Reddy stressed the importance of Driver & Safe driving while carrying Hazardous goods on the road with COVID protocols. The program was concluded with vote of thanks by Mr. B. B. Gantayat.

TGV SRAAC Limited observed National Fire Service Day on 19-04-2021 at their works Gondiparla Kurnool, Andhra Pradesh. Mr. N. Jeswanth Reddy, Executive Director (Tech) presided over the program and Mr. B. B. Gantayat, Sr. G. M (Safety) delivered welcome address.
Mr. N. Jayanna, A.D.F.O., Fire Service Department, Kurnool addressed the gathering and explained the importance of Fire Safety, Classification of fire, Preventive measures, Fire Mock Drill, etc.
Mr. Reddy addressed the gathering and talked about need of Fire Safety Awareness for employees & imparting training to down the line personnel. Mr. G.K. Agarwal, E.D (Tech) stressed the importance of Fire Safety in the factory.
Demonstration on use of Fire Fighting System was organized by Mr. G. Prabhakar, Station Fire Officer, Fire Service Department-Kurnool in co-ordination with Fire Department persons of TGV SRAAC Limited. Mr B.B. Gantayat concluded the function with vote of thanks.
National Fire Service Day Observation by TGV SRAAC Limited
Alkali Bulletin April 2021 | 17
TGV SRAAC Safety Day Observation activities in progress

18 | Alkali Bulletin April 2021
MILESTONESRetirement of Mr. K. K. Jand
Mr. K. K. Jand retired from active service on 31st March 2021 after 54 years’ service in the industry including service of about 43 years in Alkali Industry. He retired from Nirma Limited after serving the Company for about 22 years.
Mr. Jand joined Saurashtra Chemicals in February 1978 at Porbandar and served the company till April 1997. Thereafter, he was associated externally for Nirma Ltd. before joining the company in February 1999. Later Nirma Ltd. taken over Saurashtra Chemicals and merged as one company.
Mr. Jand’s long experience in handling hazardous chemicals like Caustic Soda, Soda Ash, Sodium bicarbonate, Chlorine, Phosphoric acid brought him into prominence in the industry. He also has a rich experience in dealing in salt (industrial as well as edible), Linear Alkyl Benzene (LAB), commodities like Limestone, gypsum, soaps & detergents, etc. Mr. Jand was adept at handling various issues. He gained prominence among stakeholders and peers for his quick with persuasive skills.
When Mr. Jand joined Saurashtra Chemicals way back in 1978, there were fewer players, and the industry size was small. The industry size has increased four times since then.
Mr. Jand represented the industry at various forums. He served on government standing committees, ICMI, AMAI and many other projects and programmes besides working closely for many industry reforms.
AMAI wishes him a healthy and long life.

Government working to empower Panchayats, says PM Modi
The Economic Times | 25 April 2021Prime Minister Narendra Modi has said his government is allocating an unprecedented Rs 2.25 Lakh Crore to Panchayats across the country to further empower them through modern governance methods like digitisation and online functioning. Along with these measures, there is also the expectation that these local bodies will become more transparent and accountable in the coming days, he said.
Addressing panchayats nation-wide through videoconferencing on Panchayati Raj Day, Modi spoke on the various steps taken to enhance the role of these rural local bodies. This includes new rights, connectivity through fibre-net, payment of funds through online methods, involvement in the ambitious Jal Jeevan Mission for providing clean drinking water by tap to every household and so on.
The movement to provide pukka village to every poor person or rural employment schemes are also being run through Panchayats. The Prime Minister referred to the growing financial autonomy of the Panchayats, saying the Centre has allocated an unprecedented Rs 2.25 lakh crore to them. “This also leads to higher expectation of transparency in accounts. The Panchayati Raj Ministry has decided of online payment through ‘e-Gram Swaraj’. Now all payments will be through the Public Finance Management System (PFMS). Similarly, online audits will ensure transparency,” Modi said.
https://economictimes.indiatimes.com/news/india/govt-working-to-empower-panchayats-says-modi/articleshow/82234794.cms
Union Jal Shakti Ministry advises Haryana to Monitor Water Supply in Realtime
The Tribune | 18 April 2021The Union Jal Shakti Ministry has advised the state of Haryana to identify sources of convergence and invest
in sensor based IoT technology for real-time monitoring and measurement of water supply under the JJM during a meeting held by the Department of Drinking Water and Sanitation of the Ministry (DDWS) of the Ministry to discuss the JJM Annual Action Plan (AAP) of States for 2021-22.
Haryana presented its AAP JJM via video conferencing charting its plan of action for the financial year 2021-22 as well as the saturation plan for the state.
The state government was advised about the Plan, and to emphasise on well-placed Information, Education and Communication (IEC) strategies to instil behavioural change amongst public.
During the meeting, the Haryana government reiterated its commitment to achieve the JJM target by November 1, 2022, much ahead of the national deadline of 2024.
November 1 marks the Haryana Day—the day the state was carved out from Punjab.
A month-long exercise of taking up the Annual Action Plan of States/ UTs under Jal Jeevan Mission is done by a committee chaired by Secretary, DDWS and with members from different Central Ministries/ Departments and NITI Aayog to do a rigorous scrutiny of the proposed Annual Action Plan (AAP) prepared by States/ UTs before finalizing the same.
Thereafter, funds are released to the states by the Centre throughout the year.
For Haryana, the Committee advised the state to work on water sources sustainability as with increasing tap connections at household level, the load on water requirement must be accounted for. There is an urgent need for grey water management and behaviour change among people so that water, which is a limited resource, is used judiciously.
Haryana State has 31.03 lakh rural households, out of which 26.93 lakh (86.8%) rural households are provided with tap connections as on March 31, 2021. During the meeting, the state government informed that it plans to provide 4.09 lakh tap connections in 2021-22. The
Jal Jeevan Mission - An Update
Alkali Bulletin April 2021 | 19

JJM gives a lot of emphasis on water quality surveillance and monitoring.
It mandates that in every village five persons especially women to be trained for use of Field Test Kits, so that water can be tested in villages. Public Health Engineering Department/ Rural Water Supply department of States are ensuring supply of safe drinking water to rural homes and monitoring water quality on regular basis by testing in the laboratories.
https://www.tribuneindia.com/news/haryana/union-jal-shakti-ministry-advises-haryana-to-monitor-water-supply-in-
real-time-240847
Karnataka to provide tap water to 25 lakh households in FY22
Deccan Herald| 18 April 2021During a discussion on the state’s annual action plan for the year 2021-22 with the Union Jal Shakti Ministry officials about the JJM, Karnataka said that the state has 91.19 lakh rural households, out of which only 28.44 lakh (31.2 per cent) have tap water supply. So far, 23 Panchayats and 676 villages in the state have been declared ‘Har Ghar Jal’ (water in every rural household), the state informed the Centre. So far, 95 per cent schools and 95 per cent Anganwadi centres, 84 per cent Ashramshalas, 91 per cent Gram Panchayat buildings and 92 per cent health centres in the state are provided with piped water connections. “The state is planning to cover 17,111 villages falling under the priority category including droughtprone and desert regions, SC/ ST dominated habitations, aspirational districts in the current financial year,” said the statement from the Jal Shakti Ministry. The national committee of the Jal Shakti Ministry headed by the Secretary of Department of Drinking Water and Sanitation analysed the state’s annual action plan and advised it to gear up and make concerted eorts to not just complete the task from last year but also fast-track work planned for the current year. In 2021-22, out of 30 districts in Karnataka, the state government is planning to provide 100 per cent tap water connections to every rural household in two districts, said the statement. The committee emphasized the need to test schools and anganwadi centres along with households getting water supply. To ensure transparency and accountability, a robust
grievance redressal mechanism has been developed by the state called ‘Bhoomi online – Parihara’. In the previous financial year 2020-21, Rs 1,189 crore Central fund was allocated for the state while in FY22, the state is likely to get Rs 3,000 crore, the statement said. JJM, a Centrally-funded scheme, aims to provide 55 litres of potable water per person per day to every rural household of the country by 2024. The scheme was launched in August 2019. https://www.deccanherald.com/state/top-karnataka-stories/karnataka-to-provide-tap-water-to-25-lakh-households-in-fy22-975857.html
Odisha govt to set up Water Academy at BhubaneswarThe New Indian Express | 14 April 2021
The State government has decided to set up Odisha Water Academy to enhance the quality of service in the water and waste water sector and ensure better health and environment outcome. The academy, to be set up as a Centre of Excellence, will function as the pioneering training and capacity building institution in the field of water and waste water service provision.
Housing and Urban Development (H&UD) Minister Pratap Jena, in a release, said safe drinking water and waste water service provision to each urban household in the State is a priority of the government. “The academy will be beneficial to the personnel working under the Water Corporation of Odisha (WATCO), Public Health Engineering Organisation (PHEO), Odisha Water Supply and Sewerage Board (OWSSB) and other related organisations supporting the sector and services for their capacity development,” Jena said.
The training and capacity building to be undertaken by the academy will be for both managers and workers. It will enable them to remain up-to-date with state-of-the-art, innovative, hi-tech technologies and advanced management skills to run the water and waste water business in the State more efficiently than before, the Minister said.
The academy will be registered as a society under the Societies Registration Act, 1860 and would work under the administrative control of WATCO. It would be managed under its own Memorandum of Association and Rules and
20 | Alkali Bulletin April 2021

Regulations with a governing body headed by the H&UD secretary-cum-chairman WATCO.
Onus of testing tap water quality is on supplying departments: Bureau of Indian Standards (BIS)
The Economic Times | 13 April 2021BIS, the national standards body, said that the onus of testing the quality of tap water lies with Jal Shakti ministry, state governments and respective departments supplying water to households.
“BIS will not test the water unless these bodies request us to do so. We have drafted the quality norms for tap water and have shared it with these bodies. Now the onus is on them,” said P K Tiwari, DG, BIS. The national standards body had drafted norms for piped water under Drinking water supply quality management system for water supplying authorities to adopt. The quality norms outline the requirements for a water supplier or a water utility on how they should establish, operate, maintain and improve their piped drinking water supply service.
https://economictimes.indiatimes.com/news/india/onus-of-testing-tap-water-quality-is-on-supplying-departments-bureau-of-indian-standards/articleshow/82054276.cms
India’s 38% rural population given tap water connection: Jal Shakti ministry
Live Mint | 03 April 2021India’ 38% rural population has been covered under the marquee JJM, with 21.4% rural households been provided with tap water connection since the scheme’s launch in 2019, according to Jal Shakti ministry. Four crore households have been provided with tap water connections since the scheme’ announcement on 15 August 2019.
“So far, 58 districts,711 blocks, 44,459 Panchayat and 87,009 villages have ensured 100% coverage of FHTC (functional household tap connections),” Jal Shakti ministry said in a statement on Friday.
https://www.livemint.com/news/india/indias-38-rural-population-given-tap-water-connection-jal-shakti-ministry-11617437865984.html
Ministry of Jal Shakti Deploys Sensor-Based IoT Devices to Monitor Implementation of Jal Jeevan Mission in Rural Areas
LiveMint | 01 April 2021To monitor the rural drinking water supply systems in villages, the Ministry of Jal Shakti has decided to take the digital route to use sensor-based IoT devices to effectively monitor the implementation of Jal Jeevan Mission (JJM) in more than six lakh villages. For this, National Jal Jeevan Mission in collaboration with Tata Community Initiatives Trust (TCIT) and Tata Trusts completed pilot projects in several remote villages of five States i.e. Uttarakhand, Rajasthan, Gujarat, Maharashtra, and Himachal Pradesh.
https://www.livemint.com/news/india/govt-deploys-sensor-based-iot-devices-to-monitor-rural-drinking-water-11617202052466.html
Alkali Bulletin April 2021 | 21˚

©AIChE 2021. All rights reserved. Reproduction for non-commercial, educational purposes is encouraged. However, reproduction for any commercial purpose without express written consent of AIChE is strictly prohibited. Contact us at [email protected] or 646-495-1371.
www.dekra.us/process-safetyaiche.org/ccps
Nitrogen is often a safeguard, but it also has serious hazards.
• In the US, nitrogen asphyxiation hazards in industry resulted in 80 deaths from 1992 to 2002. These incidents occurred in a variety of facilities, including industrial plants, laboratories, and medical facilities; almost half involved contractors. More recently, fourteen workers in the US, died from asphyxiation linked to nitrogen accidents from 2012 to 2020, according to AP news agency.
• Nitrogen is sometimes called “the silent killer” because it is odorless, colorless, tasteless and gives no warning. People in a nitrogen enriched environment (low in oxygen) simply lose consciousness before realizing they are in danger. Low oxygen can be detected only with the correct gas detectors..
• In addition to its asphyxiation hazards, liquid nitrogen is extremely cold and contact can quickly cause severe frostbite burns.
• Many nitrogen-related fatalities occur when others rush to rescue a worker in an oxygen deficient atmosphere. No one should enter a potentially oxygen deficient space without proper permits, preparation, and breathing apparatus.
Did You Know?
What Can You Do?
This issue sponsored by
Messages for Manufacturing Personnelwww.aiche.org/ccps/process-safety-beacon
April 2021
A recent event in Gainesville, Georgia, US, involved a significant leak of liquid nitrogen. A poultry processing plant used liquid nitrogen to quickly freeze chicken products. This freezing system had only been in operation for 4-6 weeks before the event. Six workers died and 12 others were taken to a hospital. 130 people had to be evacuated. A maintenance manager shut off an external isolation valve, stopping the flow of liquid nitrogen to the process and likely preventing further exposures. While the causes are still under investigation, it serves as a reminder for us to understand the hazards of nitrogen and use extreme caution when working in or around nitrogen consuming operations.
Many other oxygen deficiency incidents have occurred due to nitrogen leaks or purging. Entering a confined space with an oxygen deficient atmosphere without testing or a proper breathing apparatus is one of the most frequent causes of asphyxiations.
• Read the SDS for nitrogen to review its hazards and precautions.
• Review the US Chemical Safety Board’s guidance on nitrogen. Follow the link below for both the Hazards of Nitrogen Asphyxiation bulletin (No. 2003-10-B June 2003) and a PowerPoint presentation on nitrogen hazards.
• (https://www.csb.gov/hazards-of-nitrogen-asphyxiation/)
• Watch the CSB safety video on the Valero Refinery Asphyxiation incident.
• (https://www.csb.gov/valero-refinery-asphyxiation-incident/ )
• Be aware where nitrogen is being used in your area and look for potential release points such as open pipes, relief discharges or other possible leak points.
Past Beacons – April 2004, December 2006, August 2007, April 2015, November 2017, and June 2018 [Beacon Archive: https://www.aiche.org/ccps/resources/process-safety-beacon/archives]
Other references: EIGA: https://www.eiga.eu/publications/safety-leaflets/sl-0117-dangers-of-asphyxiation/CGA: https://www.cganet.com/liquid-nitrogen-safety/
Figure 1. Location of 6 fatalities from a nitrogen leakSource: Insurance Journal
Figure 2. Warning signs for liquid nitrogen hazards
Recent nitrogen fatalities are a vivid reminder

©AIChE 2021. All rights reserved. Reproduction for non-commercial, educational purposes is encouraged. However, reproduction for any commercial purpose without express written consent of AIChE is strictly prohibited. Contact us at [email protected] or 646-495-1371.
www.dekra.us/process-safetyaiche.org/ccps
Nitrogen is often a safeguard, but it also has serious hazards.
• In the US, nitrogen asphyxiation hazards in industry resulted in 80 deaths from 1992 to 2002. These incidents occurred in a variety of facilities, including industrial plants, laboratories, and medical facilities; almost half involved contractors. More recently, fourteen workers in the US, died from asphyxiation linked to nitrogen accidents from 2012 to 2020, according to AP news agency.
• Nitrogen is sometimes called “the silent killer” because it is odorless, colorless, tasteless and gives no warning. People in a nitrogen enriched environment (low in oxygen) simply lose consciousness before realizing they are in danger. Low oxygen can be detected only with the correct gas detectors..
• In addition to its asphyxiation hazards, liquid nitrogen is extremely cold and contact can quickly cause severe frostbite burns.
• Many nitrogen-related fatalities occur when others rush to rescue a worker in an oxygen deficient atmosphere. No one should enter a potentially oxygen deficient space without proper permits, preparation, and breathing apparatus.
Did You Know?
What Can You Do?
This issue sponsored by
Messages for Manufacturing Personnelwww.aiche.org/ccps/process-safety-beacon
April 2021
A recent event in Gainesville, Georgia, US, involved a significant leak of liquid nitrogen. A poultry processing plant used liquid nitrogen to quickly freeze chicken products. This freezing system had only been in operation for 4-6 weeks before the event. Six workers died and 12 others were taken to a hospital. 130 people had to be evacuated. A maintenance manager shut off an external isolation valve, stopping the flow of liquid nitrogen to the process and likely preventing further exposures. While the causes are still under investigation, it serves as a reminder for us to understand the hazards of nitrogen and use extreme caution when working in or around nitrogen consuming operations.
Many other oxygen deficiency incidents have occurred due to nitrogen leaks or purging. Entering a confined space with an oxygen deficient atmosphere without testing or a proper breathing apparatus is one of the most frequent causes of asphyxiations.
• Read the SDS for nitrogen to review its hazards and precautions.
• Review the US Chemical Safety Board’s guidance on nitrogen. Follow the link below for both the Hazards of Nitrogen Asphyxiation bulletin (No. 2003-10-B June 2003) and a PowerPoint presentation on nitrogen hazards.
• (https://www.csb.gov/hazards-of-nitrogen-asphyxiation/)
• Watch the CSB safety video on the Valero Refinery Asphyxiation incident.
• (https://www.csb.gov/valero-refinery-asphyxiation-incident/ )
• Be aware where nitrogen is being used in your area and look for potential release points such as open pipes, relief discharges or other possible leak points.
Past Beacons – April 2004, December 2006, August 2007, April 2015, November 2017, and June 2018 [Beacon Archive: https://www.aiche.org/ccps/resources/process-safety-beacon/archives]
Other references: EIGA: https://www.eiga.eu/publications/safety-leaflets/sl-0117-dangers-of-asphyxiation/CGA: https://www.cganet.com/liquid-nitrogen-safety/
Figure 1. Location of 6 fatalities from a nitrogen leakSource: Insurance Journal
Figure 2. Warning signs for liquid nitrogen hazards
Recent nitrogen fatalities are a vivid reminder

NEWS DIGEST
24 | Alkali Bulletin April 2021
GENERAL
India GDP growth to rebound to 11% in FY21-22, moderate to 7% in FY22-23: ADBBusiness Line | 28 April 2021
The Asian Development Bank (ADB) has projected India’s gross domestic product (GDP) growth to rebound strongly to 11 per cent in current fiscal on the back of continued economic recovery boosted by increased public investment, vaccine rollout and surge in domestic demand.
This forecast assumes that vaccines are deployed extensively across the country and the second wave of the coronavirus (Covid-19) pandemic is contained.
In its latest flagship economic publi-cation, Asian Development Outlook (ADO), ADB forecast India’s econom-ic growth to moderate to 7 per cent in FY 2022 as base effects disappear.
ADB provided $1.5-billion fiscal sup-port to India for pandemic response
Domestic demand is expected to remain the main driver of growth this fiscal. A faster vaccine rollout will boost urban demand for services while rural demand will be boosted by robust agriculture growth and con-tinued government support to farmers by expanding irrigation, improving value chains and increasing farm loan limits.
The economy is expected to have
contracted by 8 per cent in 2019-20 in line with the government ‘s second advance estimate. ADB also said that risks to the outlook tilt to the downside. An uncertain pandemic trajectory with a prolonged second wave despite the vaccination push could affect India’s economic normalisation. The forecast, however, expects, the economic impact of the second wave to be relatively muted compared to the first wave in line with global experience.
Other downside risks include further tightening of global financial condi-tions on fast recovery in developed countries, which would apply pressure on India’s market interest rates.
Increased government expenditure on healthcare, water and sanitation will strengthen the country ‘s resilience against future pandemics, it said.
Private investment is expected to pick up on improving sentiment and risk appetite, as well as accommodative credit conditions.
India, Japan, and Australia unveil supply chain initiativeLive Mint | 28 April 2021
In a move to counter China’s domi-nance of supply chain in the Indo-Pacific region, trade ministers of India, Japan and Australia formally launched the Supply Chain Resilience Initiative (SCRI) in a virtual trilateral ministerial meeting.
“The SCRI aims to create a virtu-
ous cycle of enhancing supply chain resilience with a view to eventually attaining strong, sustainable, balanced and inclusive growth in the region. The ministers consented that expan-sion of the SCRI may be considered based on consensus, if needed, in due course,” the three trade ministers said in a joint statement.
In 2019, the cumulative GDP of the three countries was $9.3 trillion, while cumulative merchandise goods and services trade were $2.7 trillion and $900 billion, respectively.
The meeting held by videoconference was attended by India’s trade minister Piyush Goyal, Australia’s minister for trade, tourism and investment Dan Te-han and Japan’s minister of economy, trade and industry Kajiyama Hiroshi.
They had first met in September to explore the possibility of a supply chain initiative.
“Based on the high-level consulta-tions among Australia, India and Japan since September, the ministers noted the importance of risk management and continuity plans to avoid supply chain disruptions and affirmed their commitment to strengthen resilient supply chains. Possible policy mea-sures may include: (i) supporting the enhanced utilization of digital tech-nology; and (ii) supporting trade and investment diversification,” said the joint statement by the ministers.
Initially, SCRI will focus on sharing best practices on supply chain resil-ience and holding investment promo-tion events and buyer-seller matching events to provide opportunities for

Alkali Bulletin April 2021 | 25
stakeholders to explore the possibility of diversification of their supply chains. The ministers instructed officials to implement the initial projects and further develop the initiative.
The ministers decided to convene at least once a year to provide guidance to the implementation of the SCRI as well as to consult on how to develop the initiative.
Commerce ministry starts Covid-19 helpdesk to resolve import, export issuesBusiness Standard | 26 April 2021
The commerce ministry Monday said it has started a COVID-19 helpdesk to help resolve issues of exporters and importers pertaining to international trade such as customs clearance delays and banking matters.
The Directorate General of Foreign Trade (DGFT), an arm of the ministry, took this initiative to monitor the status of exports and imports, and difficulties being faced by trade stakeholders in view of the surge in COVID-19 cases.
It added that the helpdesk would investigate issues relating to import and export licensing, customs clear-ance delays and complexities arising thereon, import/export documenta-tion, and banking matters.
“Helpdesk would also collect and collate trade related issues concerning other ministries/departments/ agencies of central and state governments and will coordinate to seek their support and provide possible resolution,” it said.
Stakeholders can submit information on the DGFT website about their is-sues on which support is required.
“The status of resolutions and feed-back may be tracked using the Status tracker under the DGFT Helpdesk
Services. Email and SMS would also be sent as and when the status of these tickets are updated,” the ministry said.
Carbon Trading: New emission-markets for a new decadeFinancial Express | 26 April 2021
As the world gets closer to the upcom-ing climate conference in Glasgow later this year, pressure is mounting on countries to restate their climate goals. Many want that countries revise their earlier commitments made at the time of the Paris Agreement, in December 2015, and do more to cut emissions.
India is likely going to be long on its climate commitment. Discussions at home have moved from how much re-newable energy to inject into the grid to how big a limiting factor the grid is for injecting more. Discussions are also underway around the creation of new markets, premised on the assumption that nudging companies would inspire them to voluntarily seek to enhance their energy efficiency or GHG reduc-tion targets and hence create demand for a market for energy efficiency certificates. If successful, this could be-come an important impetus to trigger the development of a domestic market for GHG reductions. Trading in energy certificates is, after all, not new. The Perform, Achieve, Trade scheme of the Bureau for Energy Efficiency provided enough experience and confidence during its time for policy makers, scheme operators, auditors and the companies themselves on whom the targets were applied.
Albeit preliminary, there are consid-erations around a domestic emissions trading scheme. As India contemplates the creation of a domestic emissions trading scheme, a number of things should be kept in mind—given the enormous precedence and experience there is to borrow from.
The first emissions trading scheme
was in 1995. It addressed acid rain in California and reduced air pollution significantly. Compliance costs were less than half of those predicted by the US Environmental Protection Agency, and many times lower than those predicted by industry. Emissions trad-ing for climate change has been going on since 2005, and today, there are at least 45 schemes across the world that put a price on carbon. The current carbon market is valued at USD 277 Bn and the average price of allowances in the European Union is Euro 35/ton. The design of trading programmes is critical to their success, as they will end up determining the transaction costs as well as the uncertainty and risk inherent in the trading system. There are plenty of learnings to use—from regulators, scheme operators, partici-pants, auditors and financiers.
So, here are five design principles worth considering:
One, design for maximum reach. This means having to decide if the scheme is an allowance trading or a credit trading scheme, or both. Credit trading allows emissions reductions above and beyond business-as-usual to be certified as tradable. Allowance trading works by defining an aggregate emissions cap and authorizes tradable quantities of emissions under the cap. Schemes that have allowed both have been the most successful, though care ought to be taken to reduce the regu-latory barriers to credit trading. Allow-ing opt-ins would be a good idea. This is a provision that allows otherwise un-covered sources to enter the program once their uncertainties have been resolved with the regulator. When the time is right, allow for international linkages. Permitting linkages with other international schemes will allow for the discovery of the lowest transaction costs, increase liquidity and options for participation. All this will eventu-ally maximise the scope of scheme coverage, and provide other benefits—such as international markets, access

to other forms of capital and so on. All these mechanisms will ultimately result in maximizing the total quantity of greenhouse gas emissions capped and reduced.
Two, design for flexibility. Since the carbon price can vary, costs to participants can be unknown. Allow-ing mechanisms such as banking of emissions reductions, or the use of offsets gives participants flexibility to decide which option to use. Banking of credits over a (regulated) period of time allows industries the flexibility to decide things like the price of acquisi-tions, timing of major investments, or their (degree of) competitiveness in the marketplace. Depending on the scheme, fungibility with other environmental commodities, such as energy efficiency certificates, can be used to meet compliance needs, at least to the extent it is not detrimental to environmental performance, i.e., it does not dilute the cap.
Three, keep it dynamic and in sync with the economy. Carbon credit pric-es in the EU emissions trading scheme fell from Euro 30 each to an all-time low of Euro 3 in 2013. Chief amongst the reasons that led to this drop was the economic recession that preceded it, and the subsequent drop in emis-sions—and hence a (reduced) need for allowances. It was not until 2015 that the EU introduced a corrective measure, and not until 2018 where appropriate revisions were made that allowed prices to come back up again. (This was done by adjusting the supply of allowances to be auctioned). Prices have since been on the rise—deliver-ies on March 29, 2021, closed at 42 euros.
Four, think long, think stable. One of the shortcomings of the Kyoto regime is that the commitment period was not long enough. By the time com-panies started to integrate the notion of a carbon price to their decision-making and discussions reached boardrooms, there were only a few years of the market left. For clean en-
ergy projects where gestation periods were long, the lack of a long enough runway triggered discussions around market continuity barely a few years after the scheme started. In contrast, the EU emissions trading scheme had/has compliance periods that progres-sively increased—giving companies enough certainty to plan, integrate and make investment decisions know-ing regulators treated the carbon price seriously and the market was there to stay. Businesses need long time hori-zons to plan, make investments and decide corporate strategy. Institutions and policy makers need to design; ac-cordingly, the climate problem is long term issue, anyway.
And five, keep it simple and trans-parent. Historic evidence is clearly in favor of simple. The transaction costs associated with implementing and managing an emissions trading scheme rise with the number of rules, exceptions to rules and constraints. As transaction costs rise, the number of trades fall—and as the number of trades fall, the cost savings achieved by the program also decline. Devia-tions from simplicity should only be allowed when such deviations further climate goals.
Amid Covid-19 pandemic, exports could come as a savior for IndiaBusiness Standard | 25 April 2021
The alarming rise in Covid-19 infec-tions in recent weeks and partial lockdowns and restrictions in many parts of the country have increased uncertainty regarding the pace of economic revival.
Given the strong possibility of modest-to-severe disruptions in domestic sup-ply chains and contraction in domes-tic demand, the best hope for posting reasonable economic growth comes from improved export prospects.
The global trading environment, how-ever, is very encouraging. Developed
countries have increased the pace of vaccinations and are reporting lesser numbers of infections, hospitalization, and Covid-related deaths. They are relaxing the restrictions on economic activity at a faster rate than expected. The United States is in the cusp of a booming economy and China has already posted a robust economic recovery. Most countries in East Asia and West Europe have shown strong economic recovery.
So, the global demand for consumer goods, intermediates and commodi-ties is growing at a fast pace, as their rise in prices show. Most exporters are flushed with orders.
The freight rates have gone up across the board for road, air and sea transportation of goods. The demand-supply mismatches in transportation services and container shortages persist. It takes over a week to get containers and over two weeks to get shipping space. However, exporters and logistic service providers have learnt to plan better and minimize the scope for disruptions. Most exporters have managed to renegotiate with buyers and get better prices that take into consideration the higher logistics costs. However, the exporters of low-value items find that buyers abroad in-creasingly prefer geographically closer alternative sources at higher prices and lower transportation costs.
The recent depreciation of the rupee vis-à-vis the dollar by about 3 per cent has helped exporters. Productivity gains due to increased adoption of information technology, lower interest rates, easier availability of credit and various cost-cutting initiatives have helped exporters.
The government can facilitate ex-ports by releasing the legitimate dues of exporters quickly. Last year, the government disenabled the facility of filing the applications under the Mer-chandise Exports from India Scheme (MEIS) for exports made in 2019-20 and 2020-21. Earlier this month, the
26 | Alkali Bulletin April 2021

government allowed MEIS applica-tions to be filed for exports made in 2019-20. The government should immediately allow exporters to file MEIS applications for exports made in 2020-21 also. The government should swiftly finalize the rates under the Refund of Duties and Taxes on Export Products (RoDTEP) scheme and notify the scheme.
Last month, merchandise exports increased to $34.5 billion, a rise of about 60 per cent over exports dur-ing March 2020, with 28 of the 30 sectors showing impressive growth. This growth momentum needs to be sustained to counter the effects of a possible domestic demand contrac-tion.
World Bank raises India’s GDP growth forecast to 10% in FY22The Hindustan Times | 22 April 2021
Private consumption and pub-lic investment will see the Indian economy likely growing by 10.1% in 2021-22 (FY22), the World Bank said, although, in a sign of all-around uncertainty caused by the Covid-19 pandemic, it said India’s economic growth in FY22 would be in the broad range from 7.5% to 12.5%.
However, the Bank also expects the Indian economy to contract by 8.5% in FY21, higher than the government’s own estimate of 8%.
The International Monetary Fund (IMF) has projected India’s economy will grow by 11.5% over 2021 and 6.8% over 2022, painting a rosier picture.
US to halve its carbon emissions, India to go green by 2030The New Indian Express | 23 April 2021
US President Joe Biden said America will cut its carbon emissions by up to 52% by the end of this decade, to
bring them down to the levels in year 2005.
In his address to the Leaders’ Summit on Climate, hosted by the US, Biden said the US and other big economies have an obligation to bring down greenhouse gas emissions.
The announcement marks the US’ return to global climate efforts after four years of withdrawal under former president Donald Trump.
America believes its ambitious new plan will encourage other polluting majors such as China to take impact-ful steps.
However, experts think the US may not be able to achieve the long-term target given the constantly shifting political environment.
Addressing the summit, Prime Min-ister Narendra Modi announced the launch of India-US Climate and Clean Energy Agenda 2030 Partnership to mobilize investments and enable green collaborations.
“In its new nationally determined contribution, the US has set an econo-my-wide target of reducing its net greenhouse gas emissions by 50-52 per cent below 2005 levels in 2030. As part of its climate mitigation efforts, India has set a target of installing 450 GW of renewable energy by 2030... Through this collaboration, India and the US aim to demonstrate how the world can align swift climate action with inclusive and resilient economic development, considering national circumstances and sustainable devel-opment priorities,” a joint statement read.
India ranks 87th in global energy transition indexFinancial Express | 21 April 2021
India has been ranked at the 87th po-sition among 115 countries in the En-ergy Transition Index (ETI) that tracks nations on the current performance of their energy systems across various
aspects, according to a report.
The report from the World Economic Forum (WEF) prepared in collabora-tion with Accenture also draws on insights from ETI.
The top 10 countries in the index are Western and Northern European countries, and Sweden is in the first position followed by Norway (2nd) and Denmark (3rd).
“China (68) and India (87), which col-lectively account for a third of global energy demand, have both made strong improvements over the past de-cade, despite coal continuing to play a significant role in their energy mix,” the report said.
As per the report, India has tar-geted improvements through subsidy reforms and rapidly scaling energy access, with a strong political commit-ment and regulatory environment for the energy transition.
“China’s improvements primarily re-sult from reducing the energy intensity of the economy, gains in decarboniz-ing the energy mix through the expan-sion of renewables and strengthening the enabling environment through investments and infrastructure,” it added.
The index benchmarks 115 countries on the current performance of their energy systems across three dimen-sions — economic development and growth, environmental sustainability, and energy security and access indica-tors — and their readiness to transi-tion to secure, sustainable, affordable, and inclusive energy systems.
The latest report is based on a revised ETI methodology that takes into ac-count recent changes in the global energy landscape and the increasing urgency of climate change action.
As per the report, 92 out of 115 countries tracked on the ETI increased their aggregate score over the past 10 years, which affirms the positive direc-tion and steady momentum of the
Alkali Bulletin April 2021 | 27

global energy transition.
Other countries in the top 10 are Switzerland (4), Austria (5), Finland (6), the United Kingdom (7), New Zealand (8), France (9) and Iceland (10).
Exporters fret over delay in rebate ratesThe Hindu| 21 April 2021
Even as exporters fret over an inordi-nate delay in notification of the rates under a new WTO-compliant scheme for rebating taxes and duties to the export sector, they are also seeking greater clarity from the government on some grey areas in the scheme’s functioning, according to tax consul-tancy firm RSM Astute.
Commerce Secretary Anup Wadha-wan had said that the rates under the RoDTEP (Remission of Duties and Taxes on Export Products) scheme, which came into effect on January 1, would be notified in the ‘very, very near future’. Exporters have been urg-ing the government to lift the uncer-tainty over the benefits that would accrue to them under the scheme, as they are it finding it difficult to price fresh global orders in the absence of the crucial information especially in sectors with thin margins.
The consultancy flagged the power given to Customs officers to suspend the scrips or refund credits or even to bar exporters from utilizing these scrips especially as the grounds on which such suspensions could be done have not been spelt out.
As per government statements, the refund of taxes on exports would be credited to exporters’ ledger account with the Customs department, which could be utilized to pay basic customs duty on imported goods. “Clar-ity would be required whether the refund could be utilized to pay other taxes on imported goods such as IGST and Social Welfare Surcharge,” the tax consultant said. Under the MEIS
scheme, which RODTEP has replaced, these refund credits could be used to pay customs duty, additional customs duty (with some exceptions) as well as central excise duties.
The delay in operationalizing the scheme is affecting the exporters by restricting their ability to price prod-ucts competitively and the uncertainty was making it harder to finalize con-tracts, RSM Astute pointed out.
2021 will not be about Covid despite second wave: Nirmala SitharamanBusiness Standard | 21 April 2021
Union Finance Minister Nirmala Sith-araman assured industry that despite a raging second wave of infections, 2021 will not be about Covid-19, and the economic revival will continue.
Pointing to the steps taken by the government, she said, “Revival was happening, is happening and will continue to happen.”
There should be complete trust be-tween the government and industry and vice versa to sustain growth, she said, while talking about “Sustain-ing growth momentum during Covid times”.
Exports reviving, may be in positive territory in FY22: Commerce SecretaryThe Times of India | 20 April 2021
The country’s exports are reviving, and the shipments are expected to be in the “solid” positive territory in this financial year, commerce secretary Anup Wadhawan said.
He said that exports recorded a sig-nificant contraction in April last year but gradually things started improving and the shipments have entered the positive territory.
“So, I am quite positive and hopeful
that in 2021-22, we will be in solid positive territory. I have no doubts about that. But I do not want to pre-dict numbers and make any targeted projections,” the secretary said.
Since December 2020, the country’s merchandise exports are recording growth. In March this year, the exports rose by 60.29 per cent to $34.45 billion. However, in 2020-21, the shipments dipped by 7.26 per cent to $290.63 billion.
Product categories that recorded positive growth during March include oilmeals, iron ore, carpet, gems and jewellery, engineering goods, rice, spices, pharmaceuticals, chemicals, marine products, petroleum products, coffee, and tea.
When asked about India’s trade gap with the US and China, the secretary said that trade surplus with the US and deficit with China has improved in 2020-21.
India’s exports to the US stood at $53 billion in 2019-20 and $51 billion in 2020-21. Imports from the US aggre-gated at $35.8 billion in 2019-20 as compared to $28 billion in 2020-21.
The country’s exports to China in 2019-20 were at $16.6 billion and $21.2 billion in 2020-21. Imports from China were worth $65 billion in 2019-20 while the numbers were roughly the same for 2020-21.
Container shortage at ports has easedBusiness Line | 20 April 2021
Shortage of containers has now eased in the country, said Pawan Agarwal, Special Secretary in the Logistics Division, Ministry of Commerce and Industry, during a press meet.
In March, almost 58 per cent addi-tional (year-on-year) exports has been handled, which is about 17-18 per cent more than the level seen during March 2019 (pre-Covid), according to the Container Shipping Lines Associa-
28 | Alkali Bulletin April 2021

tion (India) (CSLA).
During a review with the Federation of Indian Export Organisations (FIEO) and CSLA on April 15, the exporters body said that due to coordinated ef-forts, the issue of shortage of contain-ers has almost been sorted out, except some shortage of food-grade contain-ers for export of tea, coffee, or spices. This is localised to southern ports (Kochi/Tuticorin/Chennai/Mangalore), which CSLA apprised is a long-term issue due to import deficit at these ports.
Further, CSLA said that the impact of Suez Canal blockade has subsided. The bunching was handled well by Indian ports mainly due to timely advance intimation, after the meeting on March 26.
With effect from April 1, 2021, the haulage charges of empty containers from port to hinterland have been reduced by 50 per cent by the Con-tainer Corporation of India (Concor) through a discount scheme. This is ex-pected to result in reduction of overall shipping cost.
In early 2020, the quarantine period applicable on ships arriving from China was 14 days. Quarantine period — which is the time spent by seafarers on board in isolation after departure from China — was reduced to the extent of five-seven days, after a detailed discussion with the Ministry of Shipping, Ports and Waterways and Ministry of Health and Family Wel-fare.
In coordination with customs, a spe-cial drive was launched for expedited clearance of unclaimed or uncleared cargo. Consequently, more than 2000 empty containers were released.
The Logistics Division in partnership with FIEO, EPCs and shipping lines has also coordinated the development of a portal for matching demand and supply of containers.
The first version of this portal has
been made available on FIEO website and has received excellent response from exporters. The portal has been a significant contributor in planning sup-ply of containers during March 2021.
Concor has already issued an order of 2000 containers to BHEL, and Braithwaite and Co. Ltd. Discussions are on with steel manufacturers for producing COR-TEN steel in India at competitive prices and with Railway wagon manufacturers or BHEL or pri-vate manufacturers (DCM-Hyundai, Balmer and Lawrie) to set up produc-tion lines for indigenous manufactur-ing of containers.
Export subsidies face WTO challengeThe Pioneer | 20 April 2021
The Coronavirus pandemic played havoc with the economy of the country during the first half of last year. However, exports were begin-ning to look up in March — touch-ing a record $34 billion which was higher than $33 billion in March 2019 — and signalling a sharp increase during the current fiscal. But now, the exporters face a triple whammy. First, they have not received export ben-efits worth approximately Rs 35,000 crore under the Merchandise Export from India Scheme (MEIS). Under the MEIS, which was withdrawn on Janu-ary 1 this year, exporters were eligible for duty credit scrip — a jargon to compensate for their loss on payment of duties — amounting to two-five per cent of the freight-on-board value of the shipment. Against a total approved amount of Rs 55,000 crore, the Union Government has released just about Rs 20,000 crore (mostly claims for 2019-20) thereby leaving a gap of Rs 35,000 crore.
This has led to a liquidity crunch. And, with the Budget provision for export subsidy during 2021-22 being just Rs 13,000 crore, the situation is unlikely to improve and will seriously impede the exporters’ capacity to ramp up supplies to meet the resur-
gent demand from key global markets, particularly the US and EU.
Second, the Government has not yet notified the refund rates under the Remission of Duties and Taxes on Exported Products (RoDTEP) scheme, which replaced the MEIS in January. Under the RoDTEP, exporters are eligible for reimbursement of various embedded taxes and levies paid on inputs consumed in exports — but not subsumed by the Goods and Services Tax (GST). A committee headed by former Commerce Secretary GK Pillai tasked with determining the refund rates, after an exhaustive exercise involving scrutiny of embedded levies on 8,000-9,000 tariff lines, had sub-mitted its recommendations in March.
However, it will be some time before the Finance Ministry’s Revenue Department — currently vetting the recommended tax remission rates — notifies them. The exporters need to factor in these while firming up contracts for supplies to importers. Although, eventually they will get the refunds retrospectively (from Janu-ary 1) once the rates are notified, not knowing them in advance creates un-certainty about their ability to decide what price to charge. If, the notified rate turns out to be lower than what the exporter has built into the offer price, he will be subjected to a loss.
The above two factors i.e., the delay in release of pending dues under the erstwhile MEIS and the delay in notification of refund rates under the RoDTEP, make for a deadly combina-tion hampering the ability of export-ers to sustain the tempo of revival in exports, buoyant demand conditions notwithstanding. Add to this a third factor which relates to the vulner-ability of the Indian export subsidy regime to challenge at the World Trade Organisation (WTO). In early 2018, the US had challenged at least half a dozen of India’s export subsidy schemes, including the MEIS. The US Trade Representative (USTR) argued that the schemes provide financial
Alkali Bulletin April 2021 | 29

benefits to Indian exporters, creating an “uneven playing field”, thereby enabling them to sell goods at a cheaper rate, which was detrimental to the interests of US manufacturers and workers. Even as export subsidies violate the WTO’s rules, a limited ex-ception was made for specified devel-oping countries that may continue to provide export subsidies temporarily until they reach a defined economic benchmark of $1,000 per capita gross national income (GNI). Further, developing countries that had a GNI of over $1,000 per capita at the time when the WTO was set up in 1995, were allowed eight years to wind up their export promotion schemes.
India’s GNI being below the $1,000 per capita mark, it initially availed of the exemption from no export subsidy obligation. But in 2015, it surpassed the threshold, thereby pushing it into the “no-exemption” zone. The USTR has accused India of not just continu-ing with subsidies, but further expand-ing their scope (the MEIS launched in 2015 was rapidly expanded to include more than 8,000 eligible products, nearly double the number of products covered at its inception).
Accordingly, it wanted India to withdraw the subsidies. But the latter insisted on a transition period of eight years that, too, from 2017 when the WTO notified the fact of its crossing the threshold. The Indian stance is anomalous.
India has abolished the MEIS and launched RoDTEP. The official think tank may feel that the new scheme is “compliant” with the WTO’s norms. But Damocles’ sword still hangs over us as the US has already asked the Government to explain this scheme and its structure and may even follow this up by challenging it at the WTO.
The confidence stems from the fact that the RoDTEP is a scheme only for the reimbursement of duties on exported products; hence, there is no financial support from the Govern-
ment. The duties considered in fixing the refund rates include all the levies that are not subsumed by the GST. These are taxes on crude oil, natural gas, petroleum products such as pet-rol, diesel, ATF, electricity, mandi tax, stamp duty, besides embedded central GST and compensation cess (under GST, the cess is levied on the so-called demerit products in the highest slab of 28 per cent and the proceeds thereof to be used for compensating the States for the shortfall in revenue).
Given the highly complex nature of these duties and the wide variations between the Centre and the States, it may not be easy to justify giving re-mission for each one of them. A better way of ensuring that exports are not hamstrung is to bring all the products under the GST, besides abolishing all local taxes. The compensation cess will anyway go on March 31, 2022 — as per the extant law. As for the em-bedded central GST, mechanisms are available for its refund under the GST scheme which treats exports as zero rated. This will require a fundamental change in the extant approach of “first burdening exporters with taxes, then refunding” to one whereby “taxes are not levied in the first place or their burden is kept at a bare minimum.” While, this transition may take some time, in the interregnum, remission rates under the RoDTEP should be notified without any further delay. All outstanding dues to exporters should be promptly cleared to enable them to ramp up supplies for catering to the resurgent demand.
G20, net zero emissions and India’s roleFinancial Express | 19 April 2021
When it comes to global warming, it is not just carbon dioxide (CO2) that we talk about, but we also include other greenhouse gases (GHGs) such as methane, nitrous oxide and a few fluorinated gases. If we add up all GHGs in terms of their potential to make the planet warmer, no doubt
CO2 is the most dominant, estimated at about 76%. While CO2 can remain in the atmosphere for hundreds of years, the lifespan of gases such as methane is about 12 years and that of nitrous oxide is about 114 years. Fluorinated gases can survive for more than 250 years in the atmosphere.
Since the CO2 is the most dominant, when we speak of climate change issues, we tend to speak of CO2 only. Besides, the estimates of CO2 are more accurate and up to date when compared to other GHGs. The International Energy Agency (IEA) maintains detailed data on CO2 emis-sions on a countrywide/sector basis which are reasonably up to date as figures for 2019 for most countries are already available on their web-site. According to the IEA, the G20 countries collectively accounted for 85% of the CO2 emissions for 2019, and this figure was about 92% in 1990. If we look at individual country CO2 emissions for 2019 (2018 for some countries since 2019 was not available), it ranged from 171 MT-CO2e (Argentina) to 9,802 MTCO2e (China). There are only five countries whose yearly CO2 emissions are more than 1,000 MTCO2e, and these are China (9,802), the USA (4,766), India (2,309), Russia (1,587) and Japan (1,066). These five countries account for almost 70% of the emissions from G20 countries, and about 58% of the world’s emissions.
Much of the climate change debate, however, is about which parameter to use—the absolute emissions or per capita emissions since it has different implications for different countries. In terms of per capita, amongst the G20 countries, Australia and Canada emerge as the countries with the high-est figure (about 15.3 tCO2), whereas India has the lowest per capita emis-sion (1.7 tCO2). With a per capita world average of 4.4 tCO2, there are only five G20 countries whose emissions are less than this (Argentina, Brazil, India, Indonesia, and Mexico).
30 | Alkali Bulletin April 2021

How serious a country is about its car-bon emissions can be judged by what are the targets it has kept for itself in its Nationally Determined Contribu-tions (NDCs). The NDCs were to be filed by all countries who are party to the Paris Agreement of 2015 which would cite the steps the country pro-poses to take to tackle global warm-ing. The NDCs are also supposed to be revised every five years, bringing in stiffer targets. While about 191 NDCs were filed after the Paris Agreement, the next round was due in 2020 but has gotten delayed because of the pandemic. It would be interesting to note that only eight countries have filed their second NDCs and the only G20 country to have done so is Ar-gentina. The other countries that have filed are Grenada, Marshall Islands, Nepal, Papua New Guinea, Suriname, Tonga and the UAE.
Many of the G20 countries, how-ever, have filed what is termed as an updated version of the first NDC. What is the difference between the updated version of the first NDC and the second NDC is not clarified by the UNFCCC, the UN entity created to monitor climate change? A quick reading of the updated version of the NDCs does not really inspire confi-dence as to whether we are serious about global warming. While some countries/regions have introduced stiffer targets (like Brazil, the EU and the UK), many others have made no changes in their targets (like Australia, Japan, Mexico, Canada and Russia). The remaining G20 countries have not even made any fresh NDC docu-ment till now, which includes China, the US and India.
The latest buzzword for climate change issues is ‘net zero’. Simply put, it means that whatever carbon footprints that one is putting into the atmosphere is being neutralised by carbon sinks which absorb CO2 (the example being afforestation) or being sucked out and stored (the example being the carbon capture, utilisation and storage technology, or
CCUS). Several G20 countries have announced their intention to turn net zero by 2050/2060. While some have already passed laws to this effect (like the UK and France), there are others who have proposed legislations (like the EU, Canada, and South Korea). Then there are others who have quot-ed about their desire to turn net zero by 2050/2060 in some policy docu-ment (like China, Germany, Japan and the US), and finally there are the ones who have not yet given any indication of turning net zero (India being one such example).
The race to net zero by 2050/2060 has put a lot of pressure on India to declare similar ambitions. There are, of course, differing views on this. Some feel that it would be impos-sible for India to turn net zero by 2050/2060, whereas some others feel that it is at least technically feasible. While no judgement is being passed whether India can do it or not, some facts need to be highlighted. First, be-fore turning net zero, one has to reach the peak emission level, and many of the G20 countries (13 of them) reached their peak long back (ranging from 1990 to 2017). G20 countries that are yet to peak include India, China, Australia, Indonesia, and Mex-ico. South Korea peaked in 2018 and, hence, it is too early to say anything. Second, just because several coun-tries have declared their ambition of turning net zero does not mean that they are well on their way to achieve this. The fact is that the NDCs which exist as on date clearly fall short of all that is required to be done to turn net zero. In fact, it is said that, barring India, all the other NDCs are not even 2-degree-Celsius-compliant, what to talk of 1.5-degree Celsius.
To conclude, it would be irrational to expect all the countries to reach net zero level of emissions by 2050/2060 given the fact that they are at different points of economic development with a large population not having access to basic energy needs. This is not to suggest that countries like India should
do nothing. We must keep striving on how to reduce our dependence on fossil fuels and work on other areas like reducing our energy intensity and explore possibilities of adopting stor-age technology and material reuse. We would also need to concentrate on our renewable capacity addition targets and ensure that these targets are met. It is no secret that we appear to be slipping in meeting our target of having a renewable capacity of 175 GW by 2022.
India should address water management challenge in adding power capacity: IEABusiness Line | 17 April 2021
With India’s power sector develop-ment over the next two decades set to take place against a backdrop of increasing water stress, the Interna-tional Energy Agency (IEA) has advised that water management challenges be addressed while boosting power ca-pacity. The agency has come out with two key priorities to ensure a more resilient power sector.
“Shifting to dry and non-freshwater cooling to improve the thermal fleet’s resiliency to water stress and fully in-tegrating water-energy linkages in In-dia’s technology choices and policies will help meet power demand while reducing pressure on precious water resources,” said Tomás de Oliveira Bredariol, IEA Energy and Environ-mental Policy Analyst; Molly Walton, Independent consultant and Vaibhav Chaturvedi, Economist at the Council on Energy, Environment and Water in an IEA note. With just 4 per cent of the world’s water supply but 18 per cent of its population, India counts as one of the world’s most water stressed coun-tries. But its rapid economic ascent in recent years has put more pres-sure on energy and water resources. Coal-fired power generation, which makes up about 70 per cent of elec-
Alkali Bulletin April 2021 | 31

tricity generation in India, accounts for 80 per cent of the energy sector’s water withdrawals. It is essential that operators increase the share of dry or non-freshwater cooling in new ther-mal plants, retrofit old ones and make better use of water-recycling.
India is already using non-freshwater cooling in some of its plants. For example, Mundra UMPP, third largest coal power plant in the country, was built in a drought-prone area and uses desalinated seawater for cooling and other applications. Indian government has also mandated coal plants to use recycled sewage water if they are located close to municipal treatment plants. However, just 5-8 per cent of all coal plants in India have access to treated waste water.
Meanwhile, dry cooling has a higher capital cost and reduces power pro-duction by 7-8 per cent as well as the efficiency of the plant. Thus, only 2 per cent of the coal power plants use the technology.
Upscaling of this technology will require supporting policies, such as dedicated government financing or an adjustment of power prices in water-stressed areas, the note said.
A preference for clean energy tech-nologies can be of help, but not all low-carbon technologies and fuels have low minimal water requirements. A proper planning is required while considering plant design and location. For example, the government can pri-oritise the development of renewable energy in water-stressed areas.
Managing water use patterns in other sectors can also help. In Gujarat, agricultural pumping accounts for more than 20 per cent of the State’s energy demand and shifting this load to the daytime would help align peak demand with solar output. This is pos-sible because the State has a dedicat-ed agricultural feeder system, which allows the interruption of agricultural supply without impacting other con-sumers. Shifting today’s, the predomi-
nantly nighttime scheduling to the day would reduce the startup needs from thermal generation sources by about 40 per cent and cut operating costs by about 10 per cent.
Another promising option for power sector balancing is pumped-storage hydroelectricity, which involves pumping from a reservoir at a lower elevation to an upper storage facility during periods when there is excess power generation. This technology can constitute a cost-effective way of providing storage capacity, with limit-ed energy losses, and help to manage power supply for both peak demand hours and longer duration needs.
Exports surge 282%; imports up 205% during April 1-14Business Line | 16 April 2021
Exports of goods shot up by 282.2 per cent during April 1-14, 2021 (year-on-year) to $13.72 billion on account of last year’s low base and due to an improvement in global demand for Indian goods, according to provisional estimates made by the Commerce Ministry.
Imports during the first two weeks of April 2021 increased 204.88 per cent to $19.93 billion, per estimates. While much of the rise in both exports and imports is accounted for by last year’s low base — in April 2020 exports fell by 60.9 per cent and imports by 59.69 per cent — part of the increase is also due to better export perfor-mance.
In fact, exports in the first two weeks of April 2021 were also higher by 11.81 per cent when compared to the comparable period of April 2019. Imports, too, were higher by 2.94 per cent in April 1-14, 2021 as opposed to the same period in April 2019. Export, excluding POL (Petroleum, Oil and Lubricants), has also increased in the first two weeks of April 2021 by 284.98 per cent over same period of 2020-21 and by 13.16 per cent over
same period of 2019-20, the provi-sional estimates revealed. Imports, excluding petroleum, also increased in April 1- 14 by 259.65 per cent over same period of 2020-21 and up by 10.92 per cent over same period of 2019-20.
After registering sharp decline in the initial months of 2020-21 due to the Covid-19 pandemic disrupting pro-duction and supplies, Indian exports started somewhat stabilising in the later months. In March 2021, exports posted a record monthly growth of 60.29 per cent (year-on-year) to $34.45 billion pushed by sectors such as engineering goods, electronics, petroleum products, gems & jewellery and pharmaceuticals. In the fiscal year April-March 2021, however, exports declined by 7.26 per cent to $290.63 billion compared to the previous fis-cal.
Exports jump 60 pc in March; falls over 7 pc to USD 290 billion in FY21Financial Express | 15 April 2021
The country’s exports jumped by 60.29 per cent to USD 34.45 billion in March even as the outbound ship-ments contracted by 7.26 per cent during the full 2020-21 fiscal to USD 290.63 billion.
Imports too grew by 53.74 per cent to USD 48.38 billion in March but dipped by 18 per cent to USD 389.18 billion during April-March 2020-21, according to the government data released on Thursday.
Trade deficit during March 2021 wid-ened to USD 13.93 billion from USD 9.98 billion in March 2020. The trade deficit during the full fiscal, however, narrowed to USD 98.56 billion as against USD 161.35 billion during 2019-20, the data showed.
Pharmaceuticals (48.49 per cent), chemicals (46.5 per cent), marine products (40.81 per cent), petroleum products (35.52 per cent), coffee
32 | Alkali Bulletin April 2021

(23.27 per cent), and tea (8 per cent) were also among the segments that recorded growth.
India committed to fight climate change, but not under pressure: Prakash JavadekarIndian Express | 15 April 2021
Observing that underdeveloped coun-tries have a right to develop, Union Minister of Environment, Forest and Climate Change Prakash Javadekar said that India will “overachieve” its commitment made in Paris, but not under any pressure.
“We will complete our commitments. We will raise our own ambitions, but not at behest of or under pressure. We will also ask countries to finance and to provide technology support, and will ask countries of their ac-tions,” Javadekar said during a panel discussion on ‘From Paris to Glasgow: Stepping up global action on climate change’.
Javadekar made these remarks at the event, held after his meeting with vis-iting French Foreign Minister Jean-Yves Le Drian. The event was organised by the French Embassy in India.
Official spokesperson of the Environ-ment Ministry, Gaurav Khare, soon clarified that Javadekar had said that India will “overachieve” its commit-ment made in Paris, and not said that the country will “raise its ambitions.”
Javadekar said, “(Other) countries start saying, ‘raise ambitions. (But) first follow the ambitions – what you have promised in Paris. Everybody is talking about 2050, and not of 2025 (or) of 2030.”
Discussing the historical perspective of climate change, the minister said, “What we are suffering today was caused a hundred years ago. What the (developed) countries — Euro-pean, American, and (over the) last 30-40 years China — they emitted.
Therefore, the world is suffering, India is suffering, because of the actions of others. That is the real context.
“Therefore, in climate debate, histori-cal responsibility is a very important aspect. We cannot just forget it and we will not allow anybody to forget it. The historical responsibility today is — China 28 per cent; USA 40 per cent; Europe 10 per cent; and India is just 3 per cent. So we are not responsible for the climate change that is happen-ing.”
With this “historical responsibil-ity”, Javadekar said, the Principle of Common but Differentiated Respon-sibilities (CBDR) emerged. “We all will have to act, but those who have polluted will have to act more. That’s why they committed $100 billion in Copenhagen… but where is the money?”
Making a case for access to cheaper, clean technology, he said, “The al-ternative technology has to be much cheaper than coal. Then only people will do away with coal.”
He said, “India is not a major emitter. People say in the sequence that we are the fourth largest emitter. How? Coal consumption of China is 4 bil-lion tonnes; ours is not even 1 billion tonnes —it is 850 million tonnes.”
Underlining the importance of the principle of equity in the fight against climate change, the minister said, “The poor of this world have the right to grow, have right for development. How will they achieve? They need power.”
Stating that Europe’s per capita an-nual power consumption is 10,000 kilowatts, Javadekar said, “My (India’s) per capita per year power consump-tion is 1,200 kilowatts. Doesn’t Indian people or the poor of the world require the facility which others are enjoying? My main issue is that the poor of this world have a right to grow. We will ensure the sustainable growth path. That is what is needed.”
He also said, “Fighting climate change is not a business. Fighting climate change is our duty…climate change is a disaster. We should not profit from disaster.”.
88% Indian CEOs confident on global economic improvement in a year: PWCFinancial Express | 15 April 2021
With the markets recovering gradually, India’s chief executive officers (CEO) are gearing up to ride the consump-tion wave, which is seeing a return, through improved operational effi-ciencies leading to higher profitability.
According to the PWC’s 24th Global CEO Survey, 88% of India CEOs are confident about global economic growth improving over the next 12 months, while 70% are confident about their revenue growth in the same period.
While Indian CEOs is undoubtedly poised for recovery and profitable growth, they are equally aware and ready for the challenges of a post-pandemic world. It reveals that organisations have also witnessed an accelerated pace of digital adoption along with emerging new business models. That explains why 93% of Indian CEOs are willing to invest long-term in digital transformation, and an almost equal percentage – 90% – would like to invest in leadership and talent development over the next three years. Initiatives to realise cost efficiencies also top the priority list for 88% of India CEOs, while 80% are set to invest in cybersecurity.
Given the pace at which technology is being embraced and the fact that or-ganisations are witnessing year worth of transformation and adoption of technology within months, the cyber threat as a major concern comes as no surprise. A majority of Indian CEOs see the US as their largest export growth market.
Alkali Bulletin April 2021 | 33

In fact, for Indian CEOs, the top terri-tories of growth other than the US are the UK, China, Bangladesh, Germany, and the UAE. The strong economic performance of the US on the back of a large stimulus and less disrup-tive decision-making will provide an additional boost to the exporting companies.
The CEO Survey findings reveal that the pandemic has accelerated the pace of digital adoption. It also highlights the need for improved op-erational efficiencies and alternative delivery models. While 85% of Indian CEOs are seeking operational efficien-cies to drive growth, in many compa-nies the pandemic has catapulted the mindset of Gen X decision-makers to that of the Gen Y and Gen Z digital natives.
A holistic approach to conserving waterBusiness Line | 14 April 2021
Water is not only an essential resource for agriculture and industrial sectors, but also is a basic necessity for all living beings. Changing patterns of climate, intensity of precipitation, and rates of discharge of rivers, show that it can no longer be assumed that the water cycle operates within an invari-ant range of predictability. With water tables falling and water quality dete-riorating, a radical change is needed in the approach to water manage-ment. In this context, rainwater during the monsoon periods, which is the primary source of water in India, has to be conserved.
Prime Minister Narendra Modi launched ‘Jal Shakti Abhiyan Phase-II’ on March 22, 2021, the World Water Day.
On this occasion, he addressed all the District Magistrates and sarpanches of the country. He made a call to all to make the jal-sanchay (water conserva-tion) endeavour a jan-andolan (peo-ple’s movement).
Phase-I of ‘Jal Shakti Abhiyan’ (JSA) was a time-bound, mission mode water conservation campaign, imple-mented in July-November 2019 , in 1,592 blocks of the 256 water-stressed districts of the country. These blocks fell under critical or over-ex-ploited groundwater category, where groundwater was being exploited faster than it could be replenished. JSA was a collaborative effort of vari-ous ministries of the Central and State Governments.
JSA focussed on five aspects — water conservation and rainwater harvest-ing, renovation of traditional and other water bodies, reuse of water and recharging of structures, water-shed development, and intensive af-forestation. Teams of technical officers from the Central government, led by Additional/Joint Secretaries, were mapped to the 256 JSA districts.
The teams made three visits to their allotted districts/blocks. The district administration provided the baseline data for all the interventions and continues to update data on progress under the key interventions. With this campaign, huge awareness was gener-ated among various stakeholders — government departments, agencies, NGOs, officials, panchayats, indi-viduals, etc. — in these 256 districts. About 3.3 lakh water harvesting and watershed development structures were constructed, about 16,000 tra-ditional water bodies were restored, and 228 districts developed district water conservation plans under this JSA phase-I campaign.
In JSA phase-II, “Catch the Rain” campaign with the tag-line. “Catch the rain, where it falls, when it falls” will be taken up by all the States and all stakeholders to create rain water harvesting structures (RWHS) suitable to the climatic conditions and sub-soil strata, with people’s active participa-tion before the onset of monsoon to ensure storage of rainwater.
Under this campaign, drives to make
RWHS like ponds, water harvesting pits, check dams, rooftop RWHS, etc., enumeration and geo-tagging of all water bodies in the districts, removal of encroachments and de-silting of tanks, etc., will be taken up in all 729 districts (rural as well as urban areas) of the country.
Indian economy may clock double-digit growth in 2021: Moody’sFinancial Express | 13 April 2021
The second wave of COVID-19 infections presents a risk to India’s growth forecast as the reimposition of measures to curb the spread of the virus will hit economic activity, but a double-digit GDP growth is likely in 2021 given the low level of activity last year, Moody’s said.
Moody’s expects that given the focus on ‘micro-containment zones’ to deal with the current wave of infections, as opposed to a nationwide lockdown, the impact on economic activity would be less severe than that seen in 2020. “India’s very low coronavirus death count (only about 1,70,179 deaths have been recorded as of April 12) and relatively very young popula-tion also help mitigate risks. GDP is still likely to grow in double digits in 2021 given the low level of activity in 2020,” Moody’s Investors Service said. In its commentary on India, Moody’s said the countermeasures to combat the second wave some of which are due to remain in place at least until the end of April risk weak-ening the economic recovery. Howev-er, the targeted nature of containment measures and rapid progress on vac-cinating the population will mitigate the credit-negative impact.
In February, Moody’s had bettered In-dia’s growth projection for the current fiscal year, which began on April 1, to 13.7 per cent as economic activ-ity gathered pace. For the calendar year 2021, Moody’s has projected economic growth rate at 12 per cent.
34 | Alkali Bulletin April 2021

As per official estimates, the Indian economy contracted 8 per cent in 2020-21 fiscal year, which ended on March 31, 2021.
‘Extend interest subsidy scheme for exporters’Business Line | 12 April 2021
To help Indian exporters struggling to conduct their business in the uncer-tain global market, the Commerce Ministry is trying to ensure that the interest equalisation scheme, which lapsed on March 31, is extended by the Reserve Bank of India (RBI) with-out curtailments.
The interest equalisation scheme, introduced on April 1, 2015, extends a subsidy on interest provided on pre- and post-shipment export credit rang-ing between 3 per cent and 5 per cent to exporters. The banks provide credit at the lower interest rate to exporters and the differential amount is later reimbursed by the government. In ad-dition to MSME exporters of all items, exporters of 416 identified products are eligible for the benefit.
Since the budgetary allocation for 2021-22 set aside by the Finance Min-istry for the scheme at `1,900 crore is more than the revised estimates for last year, there is a general optimism that there will be no rude surprises in store for exporters.
Last year, following the one year extension of the old five-year Foreign Trade Policy till March 31, 2021, the RBI also issued a notification for a one-year extension of the interest equalisation scheme.
Now that the government has given a second extension to the old FTP, this time by six months (till Septem-ber 30, 2021), there are speculations about the period of extension of the scheme.
“There is uncertainty whether the government wants the interest equali-sation scheme to be part of the next
five year FTP. As some experts feel the scheme has the potential of getting identified as an export subsidy at the WTO and, therefore, create possible conflict in the future, it may be better to extend it on a piece-meal basis,” the official said.
DGFT’’s trade facilitation mobile app to improve efficiency of importers, exporters: GoyalThe Times of India | 12 April 2021
The trade facilitation mobile app of the Directorate General of Foreign Trade (DGFT) is a state-of-the-art system and it will help improve the ef-ficiency of both importers and export-ers, Commerce and Industry Minister Piyush Goyal said.
The app would provide real-time trade policy updates, notifications, ap-plications, status alerts and real-time data, he said while launching the app.
It would also enable exporters and importers to explore item wise exim (export-import) data, policy, and sta-tistics. Besides, it would provide artifi-cial intelligence-based 24x7 assistance and all services of the DGFT.
“It will help improve the efficiency of both importers and exporters,” Goyal said adding that easy accessibility of information will also “break the walls of traditional and opaque processes which often are not equally fair to all our participants”.
He also said mobile governance will enable the creation of quality-con-scious and cross competitive domestic industry and help significantly con-tribute to the export target of USD 1 trillion by 2025.
The app will be available on Android and iOS platforms. It can also be downloaded from the DGFT website.
It has been developed by Tata Con-sultancy Services (TCS), as per the directions of the DGFT.
The new app provides features such as all services offered by DGFT, track-ing IEC Portfolio – IEC, applications, authorisations; raise and track help requests in real-time and share trade and public notices.
India’s debt-to-GDP rose to 90% during Covid-19 pandemic, says IMFBusiness Standard | 09 April 2021
India’s debt to GDP ratio increased from 74 per cent to 90 per cent dur-ing the COVID-19 pandemic, the International Monetary Fund has said, noting that it expects this to drop down to 80 per cent as a result of the country’s economic recovery.
Paolo Mauro, Deputy Director, IMF’s Fiscal Affairs Department told report-ers at a news conference, “In the case of India, the debt ratio at the end of 2019, prior to the pandemic, was 74 per cent of Gross Domestic Product (GDP), and at the end of 2020, it is almost 90 per cent of GDP. So, that’s a very large increase, but it is something that other emerging markets and ad-vanced economies have experienced as well.”
“And, for the case of India going forward, in our baseline forecast, we expect that the debt ratio will gradu-ally come down as the economy re-covers. In our baseline forecast under the assumption of healthy economic growth in the medium term, we see debt returning to about 80 per cent over time,” Mauro said.
Vitor Gaspar, Director of IMF’s Fiscal Affairs Department, said that given widening deficits and contraction in economic activity, debt worldwide increased sharply to 97 per cent of GDP in 2020.
It will increase slower to 99 per cent in 2021 before stabilising below but close to 100 per cent of GDP, he added.
In 2020, fiscal policy also contributed
Alkali Bulletin April 2021 | 35

to mitigate falling economic activity and employment. It avoided falls on the scale of the great depression.
Gaspar said that that countries with better access to financing, countries with stronger buffers, countries with stronger fundamentals have been able to give more fiscal support during 2020. They can sustain that fiscal sup-port for longer, and they have more options in terms of policymaking.
It is very clear when we focus on the group of emerging markets specifi-cally, he said.
Exports surge 297% in the first week of AprilBusiness Line | 09 April 2021
Engineering goods, gems and jewel-lery, petro-products drive exports to $6.79 b; imports rise 244% Bringing shine into the new fiscal, In-dian goods exports posted a 297.2 per cent increase (year-on-year) in the first seven days of April 2021-22 to $6.79 billion, led by engineering goods, gems and jewellery, and petroleum products.
Imports during April 1-7 increased 244.2 per cent to $ 9.66 billion, owing largely to a spurt in import of petroleum and crude and electronics, according to initial data collated by the Commerce and Industry Ministry.
The US and China accounted for most of India’s rise in exports during the seven-day period, while the UAE and China were responsible for a large part of the increase in imports, the data showed.
Much of the rise in exports in the first week of April of 2021-22 could be attributed to a low-base effect, as exports in the first week of April had fallen 72.7 per cent to $1.71 billion due to the Covid-19 lockdown.
However, exports in April 1-7 were higher by 8.42 per cent even when compared to exports in the compara-
ble period of 2019-20 ($6.27 billion) when there were no pandemic-relat-ed disruptions.
Imports in April 1-7 2021-22 were low by a marginal 0.65 per cent com-pared with exports in the comparable period of 2019-20.
Government seeks to step up monitoring of importsThe Times of India | 09 April 2021
The government is looking to expand the import monitoring system to electrical machinery, machinery and mechanical appliances, certain met-als, chemicals and plastics as it seeks to devise strategy to better under-stand imports, a lot of which is being shipped under the radar, and co-relate it with domestic manufacturing capability and capacity utilisation. This data is seen to be crucial for impos-ing trade remedial measures in case a surge is noticed.
For every product category, there is an “others” group, where items are not properly classified. An analysis undertaken by the commerce depart-ment showed that close to 80% of the imports under 10 segments were imported under the “others” category and their total value added up to $128 billion, which was a third of the shipments into the country.
Between January 2020 and January 2021, 55% of India’s imports were in the “others” group, the analysis showed. As much as 97% of the metal scrap entered via the others route during this period. Similarly, 60% of the auto components came in this segment, providing little information to the government on the kind of auto parts that came into the country.
As a result, the government has devised a multipronged strategy, including issuing HSN Codes to clas-sify these goods for better monitor-ing. Besides, an import monitoring system has been put in place for iron
and steel products, which requires advance information to be submit-ted online by the importer and the payment of registration fee. The mines ministry has also recommended a similar mechanism for certain non-ferrous metals.
Sources said that commerce and in-dustry minister Piyush Goyal has held detailed discussions on the issue with various ministries and the system will be ramped up in coming days. Data available with commerce department showed that South Korea was the largest source for imports under the “others” category.
IMF projects India’s growth rate to jump to impressive 12.5 per cent in 2021The Indian Express | 07 April 2021
The IMF projected an impressive 12.5 per cent growth rate for India in 2021, stronger than that of China, the only major economy to have a positive growth rate last year during the CO-VID-19 pandemic.
The Washington-based global financial institution, in its annual World Eco-nomic Outlook ahead of the annual Spring meeting with the World Bank, said the Indian economy is expected to grow by 6.9 per cent in 2022.
Notably in 2020, India’s economy contracted by a record eight per cent, the International Monetary Fund (IMF) said as it projected an impressive 12.5 per cent growth rate for the country in 2021.
China, on the other hand, which was the only major economy to have a positive growth rate of 2.3 per cent in 2020, is expected to grow by 8.6 per cent in 2021 and 5.6 per cent in 2022.
Chief Economist at IMF Gita Gopinath said: “We are now projecting a stron-ger recovery in 2021 and 2022 for the
36 | Alkali Bulletin April 2021

global economy compared to our pre-vious forecast, with growth projected to be 6 per cent in 2021 and 4.4 per cent in 2022.”
In 2020, the global economy contract-ed by 3.3 per cent.
According to the report, after an estimated contraction of 3.3 per cent in 2020, the global economy is pro-jected to grow at 6 per cent in 2021, moderating to 4.4 per cent in 2022.
The contraction for 2020 is 1.1 per-centage points smaller than projected in the October 2020 World Economic Outlook (WEO), reflecting the higher-than-expected growth outturns in the second half of the year for most regions after lockdowns were eased and as economies adapted to new ways of working.
The projections for 2021 and 2022 are 0.8 percentage point and 0.2 percentage point stronger than in the October 2020 WEO, reflecting additional fiscal support in a few large economies and the anticipated vac-cine-powered recovery in the second half of the year, the report said.
Global growth is expected to moder-ate to 3.3 per cent over the medium term, reflecting projected damage to supply potential and forces that pre-date the pandemic, including aging-related slower labour force growth in advanced economies and some emerging market economies.
Govt makes identity verification mandatory for new importers, exportersMillennium Post | 06 April 2021
The government has made it manda-tory for new importer, exporter and customs broker to verify their identity, including incorporation document, PAN, Aadhaar as well as physical verification of place of business. The Customs (Verification of Identity and Compliance) Regulations, 2021, also
gives customs authorities power to undertake identity verification of existing importers, exporters and customs brokers. The person selected for verification would have to furnish to the Customs authorities documents or information on the Common Portal within 15 days of such intimation of selection. These include document of incorporation, document evidencing appointment of authorised signatories, if applicable, Permanent Account Number; GST Identification Number; document such as bank statement, Income Tax Return etc. evidencing financial standing of the person. “...a person who is newly engaging in im-port or export activity after the com-mencement of these regulations shall furnish the said documents not later than 30 days of engaging in import or export activity,” the regulations said.
“In case any default is discovered, clearance of goods, drawbacks, re-funds, etc. can be suspended. Further, the Customs authorities have also been granted power to undertake this identity verification for existing players as well. “Overall, this is a good move on the part of the Government from perspective of preventing revenue leakage and with GST collections on rise with the introduction of preven-tive regulations, it is hoped that these rules would lead to better Customs duty collection as well. Having said this, the Government will have to en-sure that genuine taxpayers don’t face unnecessary hassles,” EY Tax Partner Abhishek Jain said.
RoDTEP Scheme: Revenue Dept vetting Pillai panel’s report on refund ratesBusiness Line | 04 April 2021
The Department of Revenue is vetting the duty refund rates for exporters proposed by the GK Pillai Committee in its full report on the new Remis-sion of Duties and Taxes on Exported Products (RoDTEP) scheme and will take a call on whether to go with the
suggested rates or lower them to keep expenditure in check, sources tracking the development have said.
“As long as the Department of Rev-enue sticks to the refund rates that have been proposed by the GK Pillai Committee, the Commerce Depart-ment should not have a problem in supporting and notifying them, as these have been scientifically calcu-lated. In that case, the exporters’ wait for the rates would soon be over,” an official source told BusinessLine.
The RoDTEP rates have been calcu-lated by the Pillai Committee based on all input taxes paid by exporters, including embedded taxes that have not been refunded under any other scheme.
However, if the Department of Rev-enue decides to lower the rates, there is a possibility that the Commerce Department may have issues with it, the official added.
Exporters are aware that under the RoDTEP scheme, most sectors would not be eligible for a refund as high as the one they were enjoying under the Merchandise Exports from India Scheme (MEIS) that was discontinued from January 1, 2021 (simultaneously with the implementation of RoDTEP). However, they don’t want cuts be-yond the rates suggested by the Pillai Committee.
“Exporters understand that RoDTEP is not the same as MEIS which was basi-cally an incentive scheme and, there-fore, an export subsidy disallowed by the WTO. But they want all their input levies to be refunded fully under the scheme, as recommended by the Pil-lai committee,” the official said.
Under the MEIS, exporters from a number of sectors would get refunds ranging from 2-4 per cent of the value of the exported goods. However, this calculation was not based strictly on input taxes paid.
Alkali Bulletin April 2021 | 37

The Pillai Committee’s suggested refund rates may be lower than the MEIS rates, but it may still be dif-ficult for the Revenue Department to implement them within the budgeted ₹13,000 crore. The Finance Min-istry had initially projected that the revenue foregone towards the scheme would be ₹50,000 crore annually.
“The funds could be increased if the Finance Ministry wishes,” the official said.
Exporters body FIEO wants the government to provide enough funds for RoDTEP and announce the rates soon. “RoDTEP is a scheme that is here to stay for some time. It is one of the few instruments available to sup-port exports. Under all pragmatism, one should look into that aspect,” said Ajay Sahai, Secretary General, FIEO.
With exports of goods estimated to fall by 7.4 per cent (year-on-year) to $289.92 billion in fiscal year 2021, and outlook for the new fiscal still being uncertain due to the rising wave of the Covid-19 pandemic, exporters have been asking the government for more support.
India’s exports jump 58% to hit all-time high of $34 billion in MarchBusiness Standard | 02 April 2021
India’s merchandise exports witnessed a huge jump of 58 per cent year-on-year (YoY) and touched a record $34 billion in March, indicating a recovery in demand, preliminary data released by the government showed. Sequen-tially, the growth in merchandise exports was 21 per cent.
However, for the whole of financial year 2020-21 (FY21) exports contract-ed 7.4 per cent YoY to $290.18 billion because of the disruption caused by the Covid-19 pandemic.
Imports grew 52.89 per cent YoY in March to $48.12 billion, compared with $31.47 billion a year ago. For the whole of FY21, it contracted 18.07 per cent to $388.92 billion.
“India is, thus, a net importer in March, with a trade deficit of $14.11 billion, as compared to a trade deficit of $9.98 billion, an increase of 41.4 per cent,” said an official state-ment.
Ajai Sahai, director-general (DG) and chief executive officer (CEO), Federa-tion of Indian Export Organisations (FIEO), said the turnaround in exports was remarkable, despite challenges because of a shortage of containers and hike in freight.
“Exports are generally much higher during March, which is generally the peak season. Unfortunately, last year (in March) exports fell due to the lockdown. The growth (this year) is impressive despite the logistics-related challenges. We can look forward to taking our exports to $340-350 billion in the next financial year. We should aim for double-digit growth next year,” Sahai told Business Standard.
He also cautioned that such a high level of exports may not be sustain-able every month. “But even if we have $30 billion of exports every month, we can reach $350 billion easily,” he said.
India, Mauritius FTA to come into effect from April 1Business Standard | 01 April 2021
Several Indian products will enjoy the benefit of greater market access at concessional duties in Mauritius as the free trade agreement signed
between the two countries will come into effect from April 1, the commerce ministry said. India and Mauritius signed the Comprehensive Economic Cooperation and Partnership Agree-ment (CECPA), a kind of free trade pact, on February 22.
“Both sides have completed their internal legal procedures and the India-Mauritius CECPA will enter into force on Thursday, 01 April 2021,” the ministry said.
The pact covers 310 export items for India, including food and bever-ages, agricultural products, textile and textile articles, base metals, electri-cals and electronic item, plastics and chemicals, and wood.
It said that Mauritius will benefit from preferential market access into India for its 615 products, including frozen fish, speciality sugar, biscuits, fresh fruits, juices, mineral water, beer, alcoholic drinks, soaps, bags, medical and surgical equipment, and apparel.
As regards trade in services, Indian service providers will have access to around 115 subsectors such as pro-fessional services, computer related services, research and development, telecommunication, construction, education, environmental, financial, tourism, yoga, and audio-visual.
On the other hand, India has offered around 95 sub-sectors from the 11 broad services sectors, including R&D, telecommunication, financial, distri-bution, higher education, environ-mental, health, and transport services.
It added that Indian exporters have to obtain a Certificate of Origin (CoO) from the authorised Indian agencies to avail the preferential benefits under the agreement.
An exporter has to submit this certifi-cate at the landing port of the import-ing country. The document is impor-tant to claim duty concessions under a free-trade agreement. It is essential to
38 | Alkali Bulletin April 2021

prove where their goods come from.
“The online application for CoO for the India-Mauritius CECPA can be made from 01 April 2021 through the common digital platform for issuance of certificate of origin of the Director-ate General of Foreign Trade (DGFT),” the ministry said.
In such an agreement, two trading partners cut or eliminate duties on a host of products besides liberalising norms to promote services trade.
Trade policy extended by six months to September 30Financial Express | 01 April 2021
The government further extended the validity of the current foreign trade policy (FTP), which provides a road map for boosting external commerce in goods and services, by six months through September 30.
The latest move will enable exporters to continue to get incentives under a clutch of extant programmes — in-cluding the Remission of Duties and Taxes on Exported Products (which replaced the flagship Merchandise Exports From India Scheme, or MEIS, from January 1), interest equalisation scheme and transport subsidy scheme (for farm exports) — without any hic-cups.
The validity of the FTP for 2015-20 was already extended by a year through March 31, 2021 in the wake of the Covid-19 pandemic, mainly to maintain policy stability and soften the blow to exporters.
Exemption from the payment of IGST and compensation cess on the imports made under the advance/EPCG authorisations and by the export-oriented units has also been extended by six months through September 30. Similarly, the validity of “status holder” certificates for exporters will also be extended up to end-September. Such
a certificate suggests an entity is recog-nised by the government as export house/trading house or star trading House. A statement by the commerce ministry suggested that the exten-sion is aimed at providing “continuity in the policy regime” in view of the unprecedented situation arising out of the pandemic.
The government has budgeted Rs 13,000 crore for the RoDTEP scheme for FY22. But the actual outgo will likely far exceed the budgetary al-location, exporters have said. Simi-larly, under the interest equalisation scheme, the government has bud-geted `1,900 crore for FY22, against Rs 1,600 crore (RE) for FY21. This scheme usually allows manufacturing and merchant exporters an interest subsidy of 3% on pre-and-post-ship-ment rupee credit for exports of 416 products (tariff lines).
The incentives are crucial to keep exports from sliding further in the aftermath of the pandemic, as supply chains have been hit and demand from key markets, too, has faltered. Goods exports in February grew by 0.7% on-year, although the contrac-tion in the first 11 months of this fiscal was still to the tune of 12%.
Govt surveys to track migrants, map job creation by 150,000 cosLive Mint | 01 April 2021
The Union government launched two national surveys—one to track migrants, their socio-economic conditions and shifting preference for jobs, and the other to gather primary job creation numbers from 150,000 companies.
The move comes against the back-drop of the unprecedented flight of migrants from workplaces to their homes following the outbreak of the coronavirus pandemic. Uncertainty persists on their numbers, work and living conditions, spurring the govern-
ment plans to gather data.
The labour bureau said that while it will track a significantly high number of migrants in the sample survey to be conducted over a period of six months, the quarterly employment survey will track firms across sectors.
“For the migrants’ survey we are taking a sample size of 300,000 households and for the establishments we are taking 150,000 companies’ quarter-on-quarter. This is huge for any type of survey conducted in the country,” said D.P.S Negi, director general of the labour bureau.
India witnessed a massive jobs crisis both in the formal and informal sector post the pandemic-induced lock-down. According to the Centre for Monitoring the Indian Economy, the unemployment rate in April–May last year hovered between 20-25%.
Though the situation has improved, the job market is still shaky. “There is widespread underemployment and disguised employment. All the migrants have not returned as yet as the decent jobs are still missing,” said Rahul Sapkal, assistant professor at the Tata Institute of Social Science.
While the government estimates nearly 10 million people went back home, experts and observers argue the real figure could be much higher.
Talking about the employment survey, Negi said it will expand the scope of jobs mapping as firms having 10 or more workers will give a real picture of jobs growth. It will also give an idea of the problems faced by vari-ous sectors including micro, medium and small enterprises (MSMEs) and what action is required to solve these problems.
“These surveys will prove highly useful in providing the government crucial data on migrant workers and the employment situation in formal and informal enterprises,” Negi said.
Alkali Bulletin April 2021 | 39

CHEMICALS AND PETROCHEMICALSProduction of Medical Oxygen from modified Industrial Nitrogen PlantsPress Release | 01 May 2021Considering the COVID-19 pandemic situation and to further augment availability of oxygen for medical purposes in the country, the Central Government had asked Central Pollu-tion Control Board (CPCB), which has comprehensive database of industrial units, to identify the industries having spare nitrogen plants and explore the feasibility of converting of existing Nitrogen plants to produce oxygen. CPCB with the help of State Pollu-tion Control Boards (SPCBs) have identified such potential industries, wherein existing Nitrogen generation plants may be spared for production of oxygen. Consultation have been held with potential industrial units and experts
About 30 industries have been identi-fied, and efforts have begun to modify nitrogen plants for the production of medical oxygen. Some of these plants can be shifted to nearby hospitals for supplying oxygen and some plants, where it is not feasible to shift the plants, can produce oxygen on-site.
M/s UPL Ltd converted one 50 Nm3/hr capacity Nitrogen plant to produce oxygen using Zeolite Molecular Sieve, and installed it at L G Rotary Hospital, Vapi (Gujarat). This plant is producing 0.5 ton/day oxygen and is operational since 27.04.2021. UPL Ltd. is also under process of conversion of three more plants. On conversion to oxygen plants, these plants will be installed at hospitals in Surat and Ankaleshwar.
In the existing nitrogen plants, replac-ing Carbon Molecular Sieve (CMS) with Zeolite Molecular Sieve (ZMS)
and few other changes such as instal-lation of oxygen analyzer, change in control panel system, flow valves etc., oxygen for medical use can be pro-duced. With the availability of ZMS, such modified plant can be set-up in 4-5 days while installation of new oxygen plant may take minimum 3-4 weeks.
Oxygen produced in on-site plants has to be compressed and filled in cylinders/special vessels using high pressure compressor for transporting to hospitals. Facilitation is being pro-vided to these industries for comple-tion of work at the earliest.
European chemical industry pushes bioeconomy to support the green transition: CeficIndian Chemical News | 19 April 2021
Europe’s growth strategy, with the Green Deal and the Recovery and Resilience plan, provides an impor-tant opportunity for the bioeconomy to scale up, as investments in new innovative and (more) sustainable bio-based industries can play a critical role to support the green transition. The Commission’s 2020 Strategic Foresight Report mentions the potential of a sustainable bioeconomy, to transform Europe’s agricultural and industrial base and create new jobs, whilst enhancing our natural resources and ecosystems.
“Sustainable bioeconomy activities are a pre-requisite to remain below the 1.5°C limit of global temperature rise, as well as to work towards the EU Green Deal’s ultimate goal of climate neutrality by 2050” according to a new Cefic paper on how the Euro-pean chemical industry can boost its bioeconomy sector. Regardless of their key role, Cefic’s paper reveals that bio-based products (BBPs) from the chemicals and plastics sector currently only represent a small portion of the whole European bioeconomy sector:
they generate approximately 2.5% of the total bioeconomy turnover.
In its Mid-Century Vision, Cefic predicts that biomass consumption for production of chemicals will have doubled by 2050 with respect to 2018. To meet this forecast, both the chemical industry and EU policymak-ers will need to take certain measures to scale up the bioeconomy.
Cefic believes that renewable resourc-es of biological origin offer the chemi-cal industry an opportunity to diversify its feedstocks to produce bio-based product (BBPs). A Joint Research Cen-tre (JRC) study identified 10 potential BBP categories. Two of these catego-ries, referred to as ‘platform’ and ‘bio-based plastics’ represent only 3% of the bio-based industry, yet speak for 75% of the total chemical production, meaning both bio and fossil. Cefic considers it essential to increase the share of bio-based products primarily in these two categories to enhance the overall share of bio-based products.
Not only does the chemical industry commit to increasing its share of bio-based products, it intends to do so with an improved sustainability profile and a performance and functional-ity which is at least equal to or better than existing alternatives which are currently mostly fossil derived. In turn, Cefic calls upon the policymakers to provide a supportive policy frame-work to bring the bio-based produc-tion at scale.
Plasticizers for the PVC industry are now available based on chemically recycled feedstockIndian Chemical News | 19 April 2021
BASF now offers part of its plasticizer portfolio based on circular feedstocks. For this purpose, either renewable or chemically recycled feedstock is used at the beginning of the value chain in-stead of fossil resources. The alterna-
40 | Alkali Bulletin April 2021
tive feedstock is allocated to the sales products according to a mass balance approach.
BASF has launched biomass balanced (BMB) plasticizers based on renewable raw materials under the names Hex-amoll DINCH BMB, Palatinol N BMB, Palatinol 10-P BMB and Plastomoll DOA BMB. Instead of fossil resources, the required amount of bio-naphtha or biogas is used. These materials are derived from organic waste or veg-etable oils. Biomass balanced plasti-cizers have a lower carbon footprint than the conventional ones and help save fossil resources. Both, BASF’s mass balance approach and BMB plasticizers are certified according to REDcert2.
With Hexamoll DINCH CcycledTM, BASF additionally launched its trusted non-phthalate plasticizer based on chemically recycled feedstock. In the manufacturing process, BASF uses pyrolysis oil obtained from previously non-recycled plastic waste instead of fossil resources at the beginning of the value chain. The oil is sup-plied by partners as part of BASF’s ChemCycling project. The allocation to CcycledTM sales products is also done by using a third-party certified mass balance approach. The resulting products contribute to the recycling of plastic waste.
“The mass balance approach enables us to process renewable and recycled feedstocks together with fossil raw materials in our existing efficient pro-duction network and to allocate their share to specific products,” explains Diana Brunnenkant, Head of Market-ing Plasticizers EMEA. “The principle is similar to that of green electricity. Consumers can be sure that the share of green energy in the overall electric-ity grid increases due to their decision to purchase it. However, the electric-ity they use in their homes is not only generated from renewable energy sources.”
“Our customers are increasingly facing pressure with regards to resource-efficient products,” says Dr. Matthias Pfeiffer, Head of Technical Marketing Plasticizers EMEA. “With these prod-ucts we offer a more sustainable solu-tion and make another step towards a circular economy.”
For customers it does not take ad-ditional effort to either switch the production to the new plasticizers or to produce special editions. Thanks to the same specifications and technical properties as regular plasticizers, there is no need for additional sampling or release testing of the new plasticizers. Transportation and warehousing can also be done together with the regular products.
Plasticizers are used in many different applications, including films, insula-tion for cables and ducts, coatings, flooring, hoses and profiles. They are also an essential part of sensitive applications such as toys, medical products, sports and leisure equip-ment as well as food packaging. They give flexibility to PVC products and at the same time they offer protection against the effects of weathering and temperature, thereby helping to main-tain the products’ functionality.
PVC Pipes an emerging proxy play on housing, constructionEconomic Times | 19 April 2021
Investors scouting for beneficiaries of the government’s push for housing and construction sectors are looking at makers of PVC pipes.
While the crop season is expected to see strong demand from agriculture-related industries, these companies are expected to gain market share with increases in input prices mak-ing it tougher for unorganised players to survive. Astral, Supreme Indus-tries, Finolex Industries, Prince Pipes & Fittings and Apollo Pipes are among
the top beneficiaries, according to analysts. “We are positive on the PVC pipe sector led by multiple initiatives of the government such as housing for all by 2022, ‘Nal se Jal’ by 2024, project AMRUT and Swachh Bharat Mission,” said Arafat Saiyed, analyst, Reliance Securities. “While the organised play-ers gained the market share in FY21, the demand outlook for non-agri pipes seems to be good for the next few quarters with major urban realty markets showing signs of sustainable recovery.”
The sector is expected to clock a 10 per cent compounded annual growth till FY25 from Rs 30,000 crore to Rs 50,000 crore, according to analysts’ estimates. Supreme Industries, which enjoys a competitive advantage over its organised peers owing to its scale of operations, extensive distribution reach and healthy balance sheet, is the top pick. The debt-free company with a cash balance of Rs 432 crore as of December 31, 2020, is currently trading at 36 times its FY22 estimated earnings, a 55 per cent discount to Astral — the most expensively valued in the industry.
COVID-19 menace: What govt advisory says about spraying of disinfectant on people?Times Now News | 10 April 2021
There was an outrage when some stranded migrant labourers in Ut-tar Pradesh capital Lucknow were sprayed with disinfectant during the peak of COVID-19 pandemic in May last year. The video of the incident had gone viral leading to angry reac-tions.
The Lucknow Municipal Corpora-tion had sacked the employees who sprayed the harmful liquid directly at the labourers.
Alkali Bulletin April 2021 | 41
Even before this incident came to light, the Ministry of Health and Family Welfare had received several queries regarding the efficacy of the use of disinfectants such as Sodium hypochlorite over the individuals to disinfect them to mitigate COVID situation. The matter had also gained traction after local bodies in several districts used disinfectants on people last year.
According to the ministry guidelines, chemical disinfectants are recom-mended for cleaning and disinfection of areas or surfaces that are frequently touched by people who are suspected or confirmed to have COVID-19.
After the cases of disinfectants being used on individuals rose, the minis-try had issued the guidelines in this regard.
Spraying of individuals or groups is not recommended under any cir-cumstances. Spraying an individual or group with chemical disinfectants is physically and psychologically harm-ful.
Even if a person is potentially exposed to COVID-19 virus, spraying the external part of the body does not kill the virus that has entered your body. Also, there is no scientific evidence to suggest that they are effective even in disinfecting the outer clothing/body in an effective manner.
Spraying of chlorine on individuals can lead to irritation of eyes and skin and potentially gastrointestinal effects such as nausea and vomiting.
Inhalation of sodium hypochlorite can lead to irritation of mucous mem-branes to the nose, throat, respiratory tract and may also cause broncho-spasm.
Use of such measures may in fact lead to a false sense of disinfection and safety and actually hamper public ob-servance to hand washing and social distancing measures.
Govt. to soon set up panel to fast-track push for hydrogen as fuelChemical Weekly | 06 April 2021
The Prime Minister’s Office (PMO) is reportedly close to finalising a high-level committee – likely to be chaired by NITI Aayog Vice Chairman, Mr. Rajiv Kumar – that will work on fast-tracking development and usage of hydrogen as a fuel.
The expert committee will include scientists, industry leaders and policymakers from across stakeholder ministries. Mr. Kumar is said to have had two rounds of discussions with experts and stakeholder ministries on developing a roadmap for introducing hydrogen as a fuel.
Internal estimates show that even with the existing technology, cost of production of one kilogram of hydro-gen using solar energy will be Rs. 70 compared with current fuel prices ranging over Rs. 80 per litre. More-over, hydrogen can be indigenously produced with no imports needed, unlike India’s heavy dependence on imported fuel as of now.
Policymakers are of the view that hy-drogen is the cleanest fuel and is three times more energetic than gasoline and diesel.
“The National Hydrogen Mission is a work in progress,” said NITI Aayog member Dr. V.K. Saraswat. According to him, technology is being developed to reduce the cost of production of hydrogen. “While storage of hydro-gen remains a challenge, production of hydrogen fuel will be completely indigenous with India having enough solar production capacity as well as electrolysers,” Mr. Saraswat said.
Finance Minister, Ms. Nirmala Sithara-man had said in her Budget speech that the government proposes to launch a Hydrogen Energy Mission in
2021-22 for generating hydrogen from green power sources. The commit-tee will review the status and explore complete feasibility of application, production, transportation, handling, use, safety aspects of hydrogen fuel, and suggest a clear roadmap.
Govt calls for structural changes in domestic chemical industryMillennium Post | 06 April 2021
The domestic chemical industry, which is optimistic despite the uncertain global situation amid the pandemic, should bring structural changes taking advantage of the cur-rent opportunity, Fertilizer Minister D V Sadananda Gowda said.
Gowda, addressing a virtual event, said the Indian chemicals industry is expected to reach USD 304 billion by 2025 from USD 178 billion in 2019. The demand for chemicals is expected to expand by nine per cent per annum by 2025.
Achieving the industry›s ambitious growth targets will require a combina-tion of policy intervention, company-level initiatives, industry-academic partnerships, wise investments, and greater international access, he said in a statement.
The minister, further said, the do-mestic industry is feeling much more confident and optimistic in spite of an uncertain global situation and CO-VID-19 pandemic.
Asserting that the chemicals and petrochemical sector will play an important role in achieving the goal of USD 5 trillion economy, the minister urged Indian companies and chemi-cal industries to take advantage of this opportunity and bring about structural changes in the chemical industry.
The minister also hoped that the Unit-ed Nations Industrial Development Organization (UNIDO) will support
42 | Alkali Bulletin April 2021

domestic industry with international best practices and policy and techni-cal assistance.
He was speaking at an event organ-ised by UNIDO under ‹›Clean Manu-facturing in India›› (Swachh Udyog) and National Dialogue on ‹›Excellence and Innovation for Competitive and Sustainable Chemicals Manufacturing in India››.
MEMBER UNITSReliance teams with US engineering company to set up hydrogen allianceChemical Weekly | 20 April 2021
Reliance Industries Ltd. (RIL) and US-based engineering company, Chart Industries, have formed an energy transition coalition – the India H2 Alliance (IH2A) – to commercialise hydrogen technology and systems to help develop a net-zero carbon path-way in India.
The IH2A aims to build a hydrogen economy and supply chain in India, as well as develop blue and green hydrogen production and storage, in addition to hydrogen-use clusters and transport powered by hydrogen fuel cells. It did not provide details of its other members or a timeline for these plans. The alliance will focus on industrial clusters, specifically for steel, refineries, fertilizers, cement, ports and logistics, as well as heavy-duty transport. It aims to establish standards for storing and transporting pressurised and liquefied hydrogen.
The IH2A is seeking to work with the Indian government in five areas, the first of which is to develop a hydrogen policy and 2021-30 roadmap. This will be followed by the creation of a national hydrogen taskforce and the identification of large demonstration projects in the country. “By prioritis-ing national hydrogen demonstration projects, innovations to further reduce
the cost of hydrogen will become prominent locally,” said Chart Indus-tries’ chief executive and president, Ms. Jillian Evanko.
India also needs “hydrogen valley”-style national initiatives like a high-traffic industrial freight corridor, said Mr. Anurag Pandey, RIL’s research and development team lead. “Such hydrogen-related systems projects are strategic for India’s energy transition plans, linking closely with renewables and battery technology,” he said.
The final two areas involve creating a national hydrogen fund and hydro-gen-linked capacity covering produc-tion, storage and distribution, among others.
The IH2A’s overall aim is to help India achieve its net-zero carbon ambitions by developing a hydrogen economy that complements its renewable energy, electric vehicle and battery technology plans. New Delhi made an international commitment in 2015 that as much as 40% of its overall gen-eration capacity would be based on cleaner energy sources by 2030. The government is also considering setting a target for achieving net-zero carbon emissions, an area where it lags the US, China and other Asia-Pacific na-tions.
RIL, India’s biggest private-sector refiner, is in the process of spinning off its oil and petrochemical operations to attract outside investment. The com-pany this year set out a vision to be a net-zero carbon company by 2035.
Chemfab Alkalis to increase caustic soda capacityIndian Chemical News | 10 April 2021
Chemfab Alkalis Limited has got consent to enhance its caustic soda capacity from 45,600 TPA to 56,575 TPA. Consent capacities of all co-products have also been enhanced.
All Capex has been funded through internal accruals says company spokesperson.
Chemfab Alkalis Limited (CCAL) has established the first membrane cell plant for Chloralkali production in In-dia. The company has also built a long legacy of sustainability and diversity in the workplace.
CCAL is one of the first major chemi-cal organisations in India to introduce and implement innovative tech-nologies successfully, and stay at the forefront of the industry. With consid-erable investment in processes and quality improvement, CCAL’s opera-tions have been at the cutting-edge of technology since its inception.
CCAL, established by Dr. Rao in 1985, has many ‘first’ to its credit and has received numerous patents and worldwide recognition for the viability and implementation of various inno-vative technologies in the Chloralkali sector.
Notably, adoption of Membrane Tech-nology for Chloralkali production in its Kalapet facility has resulted in nation-wide reform of the sector. Today, all new and expanding Chloralkali plants in India must implement Membrane Technology – that was once believed to be unviable and impractical.
Chemfab Alkalis commissions 2nd production line for PVC-O pipesIndian Chemical News | 01 April 2021
Chemfab Alkalis Limited (CCAL) has successfully commissioned a second production line for manufacture of PVC-O Pipes with a capacity of 3,000 TPA.
Oriented Poly Vinyl Chloride (PVC-O) Pipe with homogenous Spigot is a new-generation polymer product used in pumping mains for high pressure water conveyance. This pipe has en-
Alkali Bulletin April 2021 | 43
tered the Indian market very recently and been designed for application in high-pressure water conveying.
PVC-O is a plastic with the properties of metal and its properties compare very well with metal pipes, and offers a host of advantages over metal as well.
CCAL has set up a facility to manu-facture top-quality PVC-O pipes. The facility is a zero discharge plant, with absolutely no waste generated during the manufacturing process. This fits in with CCAL’s culture of sustainability and care for the environment.
This new PVC-O plant is established at Sri City, TADA. Sri City is an in-tegrated business township located 55 km north of Chennai on NH 16 in Nellore district, state of Andhra Pradesh. With two lines operational, the total production capacity has increased to 6,000 MTA of PVC-O.
The company has established the first membrane cell plant for Chloralkali production in India and was estab-lished by Dr. Rao in 1985. CCAL has many ‘first’ to its credit and has re-ceived numerous patents and world-wide recognition for the viability and implementation of various innovative technologies in the Chloralkali sector.
Notably, adoption of Membrane Tech-nology for Chloralkali production in its Kalapet facility has resulted in nation-wide reform of the sector. Today, all new and expanding Chloralkali plants in India must implement Membrane Technology – that was once believed to be unviable and impractical.
Tamilnadu Petroproducts charts 435-crore capacity expansionBusiness Line | 01 April 2021
Chennai-based Tamilnadu Petroprod-ucts Ltd (TPL) will be embarking on an expansion-cum-modernisation programme at an investment of `435 crore.
Under the proposed expansion, the three-decade-old company, which is a manufacturer of linear alkyl benzene (LAB), heavy chemicals and propylene oxide, will undertake a capacity aug-mentation of its LAB division, revamp of caustic soda facilities and setting up of a propylene recovery unit (PRU).
A significant part of the expansion will be funded via internal resources, and the remaining through other sources.
“TPL will be the first Indian non-refin-ing company in the private sector to build a propylene recovery unit plant. It shows our commitment to bring manufacturing efficiencies by continu-ous upgrading and introducing state-of-art technology solutions. It is in line with our group philosophy to maxi-mise margins by introducing process efficiency and value additions,” said Ashwin Muthiah, Vice-Chairman, TPL, and Founding Chairman, AM Interna-tional (TPL’s parent company).
The LAB capacity would be increased from 1,20,000 tpa (tonnes per an-num) to 1,45,000 tpa at an estimated cost of about `240 crore. The project would be commissioned in about 24 months, after regulatory approvals, according to a statement.
For the heavy chemicals division (HCD), the company will invest `165 crore to modernise the caustic soda and chlorine unit by replacing the mo-no-polar membrane technology with a more advanced bipolar membrane technology.
On completion, in about 18 months after approvals, the production capac-ity for caustic soda will go up to 250 tonnes per day from the current 150 tonnes. At the present price levels, ad-ditional revenue of about 70 per cent is expected from the project, with improved value-addition.
The propylene recovery unit (PRU), the first-of-its-kind in India by a pri-vate sector player in the non-refining sector, will be established at an outlay of about `30 crore. Propylene, a bulk chemical intermediate, is the raw material for propylene oxide and is derived from LPG. The company is in advanced talks with various domestic and international vendors for LPG for this project.
The project, the technology for which has been developed in-house by the company’s R&D team of engineers and environmental scientists, will be implemented in about 12-18 months, post-approvals.
“The projects would make the country self-reliant in this segment by meeting the domestic demand. It is our way of ensuring that our manufacturing prowess supports the ‘Vocal for Local’ mission,” said M Ravi, Group CEO, Petrochemicals, AM International.
Muthiah said the projects would meet the best environmental, health and safety standards.
44 | Alkali Bulletin April 2021


Gazette Notification
Department of Chemicals & Petrochemicals, Ministry of Chemicals & Fertilizers, Government of India has published the Gazette Notification for extension of date for implementation of quality control order of some chemicals.
A list of these 9 chemicals along with their Order No. and extended date of implementation is given in below table :
S. No. Quality Control Order Order No. Extended date for implementation
1. Acetic Acid (Quality Control), Order, 2019 S.O. 1676 (E) dated 19th April 2021 3rd February 2022
2. Aniline (Quality Control), Order, 2019 S.O. 1677 (E) dated 19th April 2021 3rd February 2022
3. Beta Picoline (Quality Control), Order, 2020 S.O. 1678 (E) dated 19th April 2021 13th March 2022
4. Gamma Picoline (Quality Control), Order, 2020 S.O. 1679 (E) dated 19th April 2021 13th March 2022
5. Hydrogen Peroxide (Quality Control), Order, 2020 S.O. 1680 (E) dated 19th April 2021 13th March 2022
6. Methanol (Quality Control), Order, 2019 S.O. 1681 (E) dated 19th April 2021 3rd February 2022
7. Potassium Carbonate (Quality Control), Order, 2020 S.O. 1683 (E) dated 19th April 2021 13th March 2022
8. Pyridine (Quality Control), Order, 2020 S.O. 1682 (E) dated 19th April 2021 13th March 2022
9. Sodium Tripolyphosphate (Quality Control), Order, 2020 S.O. 1684 (E) dated 19th April 2021 13th March 2022
A copy of all these above-mentioned orders published in the Gazette, can be downloaded from the given below LINK
https://drive.google.com/drive/folders/1WdnBiXogoq42N6MKRsHXvOe5apIDMuUC?usp=sharing
This is for your information and necessary action please.
Thanks & regards,
H. S. KARANGLE Director General
46 | Alkali Bulletin April 2021

Alkali Bulletin April 2021 | 47

Alkali Bulletin April 2021 | 49

50 | Alkali Bulletin April 2021

Alkali Bulletin April 2021 | 51

52 | Alkali Bulletin April 2021

Alkali Bulletin April 2021 | 53
NOTIFICATIONS/PRESS RELEASES/MEMORANDA
1. Late cut for MEIS applications for exports made in the Financial Year 2019-20 - 09/04/2021
https://content.dgft.gov.in/Website/dgftprod/c3fc5456-d2e4-4a9e-8fbb-86ed294063fb/Public%20Notice%20No%2053%20dt%209%204%2021%20-English.pdf
2. Operationalization of DGFT 'COVID-19 Helpdesk' for International Trade related Issues' - 26/04/2021
https://content.dgft.gov.in/Website/dgftprod/55a43a38-cc37-471c-9c66-0c52a395245e/Trade%20Notice%2002%20-Covid%20Helpdesk%20Apr%202021.pdf
3. Final Notification of Environment Standards for Lead Stabilizer in Polyvinyl Chloride (PVC) Pipes and Fittings Rules, 2021 - G.S.R 228(E)-Date-[30th March, 2021] - 07/04/2021
http://moef.gov.in/wp-content/uploads/2021/04/228E.pdf
4. Inviting suggestions on draft NEP 2021 – 24/04/2021
https://powermin.gov.in/sites/default/files/webform/notices/Inviting_suggestions_on_draft_NEP_2021_0.pdf

1 Alkali Imports (MT)
KEY INDICATORS MARCH 2021Qty (Mar
2021)Qty (Mar
2020)% Difference
(Y-o-Y)Qty (Feb 2021) % Difference
(M-o-M)FY 2020-21 (upto Mar)
FY 2019-20 (upto Mar)
% Difference Total Imports 2019-20
Caustic Soda 18,550 37,498 -50.5% 28,114 -34.0% 314,110 374,976 -16.2% 374,976
Soda Ash 39,237 60,462 -35.1% 67,817 -42.1% 705,966 946,031 -25.4% 946,031
Average Price in Jan 2021: Caustic Soda - 291 USD/MT (Lye) & 208 USD/MT
2 Foreign Trade - Merchandise (US$ billion)
Mar 2021 Mar 2020 % Difference FY 2020-21(upto Mar) FY 2019-20(upto Mar) % Difference Total Imports 2019-20
Imports 48.4 31.5 53.7% 389.2 474.7 -18.0% 474.7
Exports 34.5 21.5 60.3% 290.6 313.4 -7.3% 313.4
Surplus/Deficit -13.9 -10.0 -98.6 -161.4 -161.4
Mar 2021 Mar 2020 % Difference
Mining 139.0 131.0 6.1%
Manufacturing 140.4 111.6 25.8%
Electricity 180.0 146.9 22.5%
Mar 2021 Mar 2020 % Difference
Chemical & Chemical Products 127.4 101.1 26.0%
Textiles 116.8 100.3 16.5%
Paper & Paper Products 89.6 69.2 29.5%
Basic Metals 180.5 143.0 26.2%
Mar 2021 Mar 2020 % Difference
India NA NA -
Russia 114.2 113.6 0.5%
Brazil 96.7 89.1 8.5%
European Union (27) 104.5 94.5 10.6%
USA 101.4 100.4 1.0%
3 Exchange Rate (Rs./USD)
Mar 2021 Feb 2020 % Difference
Net Foreign Direct Investment
1,971 -2,891 -
Net Portfolio Investment
3,634 2,845 27.7%
Total 5,605 -46 -
11 Foreign Investment Inflows (US$ Million)
4 Index of Industrial Production (Base: 2011-12=100)
5 Index of Core Industries (Base: 2011-12=100)
6 Index of Industrial Production - Broad Sectors (Base: 2011-12=100)
7 Index of Industrial Production - Manufacturing Sub-groups (Base: 2011-12=100)
8 Index of Industrial Production Country-wise Comparisons (Base: 2015=100)
Mar 2021 Feb 2020 Jan 2020
72.79 72.76 73.11
10 Consumer Price Inflation - Industrial Workers (Base: 2016=100)
Mar 2021 Mar 2020 % Difference
119.6 120.3 -0.6%
Mar 2021 Mar 2020 % Difference
143.4 117.2 22.4%
Mar 2021 Mar 2020 % Difference
143.1 134.0 6.8%
12 Foreign Investment Promotion Board (FIPB) Approvals (US$ Million)
Mar 2021 Feb 2021 Jan 2021
6 36 585
13 Foreign Exchange Reserves (US$ billion)
Feb 2021 (as on 29 Jan 2021)
Jan 2021 (as on 25 Dec 2020)
% Difference
579 585 -0.9%
14 Fiscal Deficit (Apr 2020-Jan 2021)
% of Actuals to Budget Estimates FY 2020-21*
% of Actuals to Budget Estimates FY 2019-20
98.5% 121.8%
15 Purchasing Managers Index (PMI)
Mar 2021 Feb 2021 Jan 2021
55.4 57.5 57.7
Index over 50 shows expansion, while below 50 means contraction
9 All India Inflation Rates (Base: 2012=100)
Mar 2021 Mar 2020 % Difference
156.8 148.6 5.5%
Data Source: GOI, OECD, IHS & AMAI Research
The fiscal deficit for FY21 is 9.3 % of GDP, lower than revised estimate of 9.5 %.
54 | Alkali Bulletin April 2021

The Emerson logo is a trademark and a service mark of Emerson Electric Co. © 2021 Emerson Electric Co.
new ways to extend the useful life of chlor-alkali production equipment.Run-to-failure typically costs 50% more to repair than servicing equipment before it breaks. Emerson offers you PeakVue™ Technology for your rotating equipment, providing earlier, more accurate indications of developing issues in your compressors and pumps. Using Emerson’s Plantweb™ digital ecosystem to transform historical data into actionable information, we can provide predictive maintenance and monitor the energy efficiency of your heat exchangers, detect corrosion in your equipment and prevent process upsets.
Learn how to plan for, predict, and prevent reoccurring incidents to improve equipment reliability. You can email our experts at [email protected].
We see

Published by ALKALI MANUFACTURES ASSOCIATION OF INDIA 3rd Floor, Pankaj Chambers, Preet Vihar Commercial Complex, Vikas Marg, Delhi 110092 Ph: 011-22432003, Email:[email protected]; [email protected]; website: www.ama-india.org
desi
gned
by
GEN
ESIS
/ g
enes
isad
vt@
hotm
ail.c
om /
gen
esis
onlin
e.in
/ 9
8100
3368
2
Corporate Office: Nuberg House, A38 H, Sector 64, Noida 201301, Delhi NCR, India
NUBERG EPCMaking Ideas Happen
ENGINEERING TECHNOLOGY KNOW-HOW PROCUREMENT CONSTRUCTION PROJECT MANAGEMENT
TURKEYSulfuric Acid EPC Project
ABU DHABICalcium Chloride EPC Project
INDIAHydrogen Peroxide EPC Project
PARAGUAYChlor Alkali EPC Project
EGYPTSulfuric Acid EPC Project
SAUDI ARABIAAnisole EPC Project
SWEDENChlor Alkali EPC ProjectChlor Alkali EPC Project
ABU DHABI
Nuberg EPC is a global EPC and turnkey project management company providing soluons with basic engineering and process know-how
either from its own intellectual property or licensed from technology suppliers. Having set up 60+ greenfield projects worldwide with modern
technology, Nuberg is one of the fastest growing EPC companies in Chlor Alkali, Hydrogen Peroxide, Sulfuric Acid and Calcium Chloride. With
in-house engineering set up of over 300000 available man-hours, construcon team, state-of-the-art fabricaon facility and Sweden based
R&D centre, Nuberg EPC provides services for industrial plants with modern skid mounted technology. The company also offers EDC, VCM
and PVC plants which can use chlorine for EDC producon.
AK TYAGICMD, Nuberg Group
India based Global EPC Company
Operang in 32+ Countries
115000 sqm. Manufacturing Facility in Gujarat
750+ Engineering Professionals
R&D Facility in Sweden
TURNKEY PROJECTS DELIVERED IN 32+ COUNTRIES
www.nubergepc.com | [email protected]
Chemicals & Fertilizers
Steel
Hydrocarbons
Nuclear & Defence
EPC & LSTK SOLUTIONS DELIVERED ACROSS INDUSTRIES
SINGLE POINT SOLUTION EPC COMPANY