algebra i part ii - suffolk teaching activities & resourcesstar.spsk12.net/math/algebra...
TRANSCRIPT

STANDARDS OF LEARNING
CONTENT REVIEW NOTES
ALGEBRA I
Part II 1
st Nine Weeks, 2016-2017

2
OVERVIEW
Algebra I Content Review Notes are designed by the High School Mathematics Steering Committee as a
resource for students and parents. Each nine weeks’ Standards of Learning (SOLs) have been identified and a
detailed explanation of the specific SOL is provided. Specific notes have also been included in this document
to assist students in understanding the concepts. Sample problems allow the students to see step-by-step models
for solving various types of problems. A “ ” section has also been developed to provide students with
the opportunity to solve similar problems and check their answers. The answers to the “ ” problems are
found at the end of the document.
The document is a compilation of information found in the Virginia Department of Education (VDOE)
Curriculum Framework, Enhanced Scope and Sequence, and Released Test items. In addition to VDOE
information, Prentice Hall textbook series and resources have been used. Finally, information from various
websites is included. The websites are listed with the information as it appears in the document.
Supplemental online information can be accessed by scanning QR codes throughout the document. These will
take students to video tutorials and online resources. In addition, a self-assessment is available at the end of the
document to allow students to check their readiness for the nine-weeks test.
To access the database of online resources scan this QR code,
or visit http://spsmath.weebly.com
The Algebra I Blueprint Summary Table is listed below as a snapshot of the reporting categories, the number of
questions per reporting category, and the corresponding SOLs.
Algebra I Blueprint Summary Table
Reporting Categories No. of Items SOL
Expressions & Operations 12 A.1
A.2a – c
A.3
Equations & Inequalities 18 A.4a – f
A.5a – d
A.6a – b
Functions & Statistics 20 A.7a – f
A.8
A.9
A.10
A.11
Total Number of Operational Items 50
Field-Test Items* 10
Total Number of Items 60
* These field-test items will not be used to compute the students’ scores on the test.
It is the Mathematics Instructors’ desire that students and parents will use this document as a tool toward the
students’ success on the end-of-year assessment.

3
4
Expressions and Order of Operations A.1 The student will represent verbal quantitative situations algebraically and evaluate these
expressions for given replacement values of the variables.
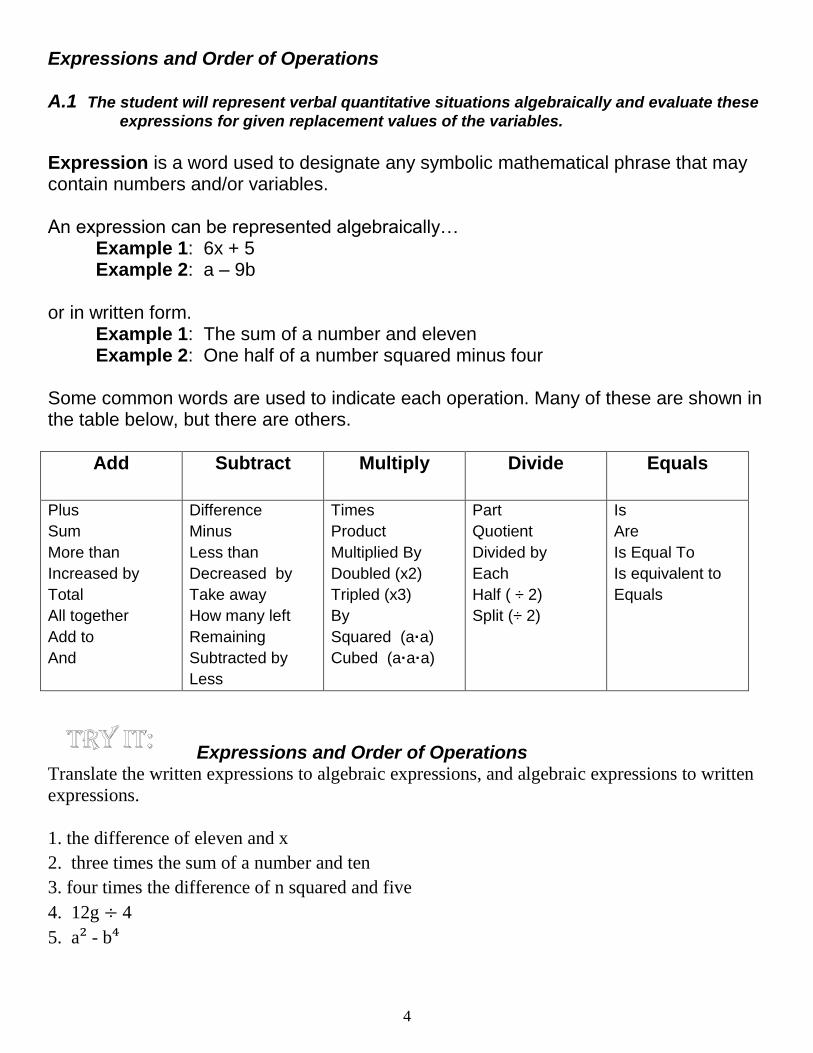
Expression is a word used to designate any symbolic mathematical phrase that may contain numbers and/or variables. An expression can be represented algebraically… Example 1: 6x + 5 Example 2: a – 9b or in written form. Example 1: The sum of a number and eleven Example 2: One half of a number squared minus four Some common words are used to indicate each operation. Many of these are shown in the table below, but there are others.
Add Subtract Multiply Divide Equals
Plus
Sum
More than
Increased by
Total
All together
Add to
And
Difference
Minus
Less than
Decreased by
Take away
How many left
Remaining
Subtracted by
Less
Times
Product
Multiplied By
Doubled (x2)
Tripled (x3)
By
Squared (a·a)
Cubed (a·a·a)
Part
Quotient
Divided by
Each
Half ( ÷ 2)
Split (÷ 2)
Is
Are
Is Equal To
Is equivalent to
Equals
Expressions and Order of Operations Translate the written expressions to algebraic expressions, and algebraic expressions to written
expressions.
1. the difference of eleven and x
2. three times the sum of a number and ten
3. four times the difference of n squared and five
4. 12g ÷ 4
5. a² - b⁴

5
Expressions are simplified using the order of operations and the properties for operations with real numbers. The order of operations is as follows: First: Complete all operations within grouping symbols. If there are grouping symbols within other grouping symbols, do the innermost operation first. Grouping symbols
include parentheses (a), brackets [a], radical symbols , absolute value bars ,
and the fraction bar
.
Second: Evaluate all exponents. Third: Multiply and/or divide from left to right. Fourth: Add and/or subtract from left of right. To evaluate an algebraic expression substitute in the replacement values of the variables and then evaluate using the order of operations.
Example 1:
Step 1: Step 2: Step 3:
Step 4: The answer is 14
Example 2:
Step 1:
Step 2: Step 3: Step 4: Step 5: Step 6: The answer is 82
Scan this QR code to go to an
order of operations video tutorial!

6
Example 3:
Step 1:
Step 2: Step 3: Step 4: The answer is 29
Expressions and Order of Operations Evaluate each expression. a=2, b=5, x= - 4, and n=10.
6.
7.
8. 9.
Evaluate each expression using the order of operations.
10.
11.
12.
13.
Scan this QR code to go to a video for more complicated order
of operations help.

7
Properties of Real Numbers A.4 The student will solve multistep linear and quadratic equations in two variables,
including b) justifying steps used in simplifying expressions and solving equations, using field
properties and axioms of equality that are valid for the set of real numbers and its subsets;
A.5 The student will solve multistep linear inequalities in two variables, including
b) justifying steps used in solving inequalities, using axioms of inequality and properties
Property Definition Examples
Multiplicative Property
of Zero
Any number multiplied by zero
always equals zero.
Additive Identity Any number plus zero is equal
to the original number.
Multiplicative Identity Any number times one is the
original number.
Additive Inverse A number plus its opposite
always equals zero.
Multiplicative Inverse
A number times its inverse
(reciprocal) is always equal to
one.
Associative Property
When adding or multiplying
numbers, the way that they are
grouped does not affect the
outcome.
Commutative Property
The order that you add or
multiply numbers does not
change the outcome.
Distributive Property
For any numbers a, b, and c:
a(b + c) = ab + ac

8
Substitution property of
equality
If a = b, then b can replace a.
A quantity may be substituted
for its equal in any expression.
Reflexive Property of
Equality Any quantity is equal to itself.
Transitive Property of
Equality
If one quantity equals a second
quantity and the second
quantity equals a third, then the
first equals the third.
Symmetric Property of
Equality
If one quantity equals a second
quantity, then the second
quantity equals the first.
Properties of Real Numbers Match the example on the left to the appropriate property on the right.
1.
2.
3.
4. – –
5.
6.
7.
8.
9.
10. If one dollar is the same as four quarters,
and four quarters is the same as ten dimes,
then ten dimes is the same as one dollar.
A. Multiplicative Property of Zero
B. Additive Identity
C. Multiplicative Identity
D. Additive Inverse
E. Multiplicative Inverse
F. Associative Property
G. Commutative Property
H. Distributive Property
I. Substitution Property of Equality
J. Reflexive Property of Equality
K. Transitive Property of Equality
L. Symmetric Property of Equality

9
Solving Equations
A.4 The student will solve multistep linear and quadratic equations in two variables,
including d) solving multistep linear equations algebraically and graphically; f) solving real-world problems involving equations and systems of equations.
You will solve an equation to find all of the possible values for the variable. In order to solve an equation, you will need to isolate the variable by performing inverse operations (or ‘undoing’ what is done to the variable). Any operation that you perform on one side of the equal sign MUST be performed on the other side as well. Drawing an arrow down from the equal sign may help remind you to do this.
Example 1:
Check your work by plugging your answer back in to the original problem.
Example 2:
Check your work by plugging your answer back in to the original problem.
Scan this QR code to go to a video tutorial on two-step
equations.

10
You may have to distribute a constant and combine like terms before solving an equation.
Example 3:
Check your work by plugging your answer back in to the original problem.
If there are variables on both sides of the equation, you will need to move them all to the same side in the same way that you move numbers. Example 4:
Check your work by plugging your answer back in to the original problem.
Scan this QR code to go to a video tutorial on multi-step
equations.

11
Example 5:
You can begin this problem by cross multiplying!
Check your work by plugging your answer back in to the original problem.
Solving Equations
Solve each equation 1.
2.
3.
4.
5.
6.
7.
8.
Scan this QR code to go to a video tutorial on equations with
variables on both sides.

12
Transforming Formulas A.4 The student will solve multistep linear and quadratic equations in two variables,
including a) solving literal equations (formulas) for a given variable;
Transforming Formulas is done the same way as solving equations. Treat the variables the same way that you treat numbers, being sure to combine like terms when you can. Remember that in order to be like terms, both terms need to have the same variables, and those variables have to have the same exponent.
Example 1:
Example 2:
Example 3:
We will have to “un-distribute” the a from each term on the left.
Scan this QR code to go to a video tutorial on transforming
formulas.

13
Example 4:
You can cross multiply to rewrite this problem without fractions.
Don’t forget to simplify your fractions!
Example 5:
To divide by
, you can multiply by the reciprocal, which is
, or just 2.
Transforming Formulas Solve each equation for the stated variable.
1.
2.
3.
4.
5.

14
Inequalities A.5 The student will solve multistep linear inequalities in two variables, including
a) solving multistep linear inequalities algebraically and graphically; c) solving real-world problems involving inequalities
An inequality is solved the same way as an equation. The only important thing to remember is that if you multiply or divide by a negative number, you need to switch the direction of the inequality sign. A proof of this is included in the online video tutorials or on the top of page 179 in your text book. You will also need to know how to graph inequalities on the number line. If the inequality has a greater than or equal to ( ) or less than or equal to ( ) sign, then you will use a closed point to mark the spot on the number line. This closed point indicates that the number that the point is on IS included in the solution. For a greater than ( ) or less than ( ) sign, you will use an open point on the number line. This open point indicates that the number that the point is on is NOT included in the solution. Example 1: Solve and graph the following inequality.
Graph:
Example 2: Solve and graph the following inequality.
Don’t forget to switch the sign direction!
Graph:
0 3 6 9 120–3–6–9
0 3 6 90–3–6–9
Scan this QR code to go to a video tutorial on solving and
graphing inequalities.

15
Example 3:
Example 4: Dan’s math quiz scores are 88, 91, 87, and 85. What is the minimum score he would need on his 5th quiz to have a quiz average of at least 90?
The average of his 5 quiz scores must be greater than or equal to 90.
Dan needs to score a 99 or better on his final quiz to have a 90% quiz average.
Inequalities 1. Solve and graph: 2. Solve and graph: 3. Solve: 4. Solve: 5. A salesman earns $410 per week plus 10% commission on sales. How many dollars in sales will the salesman need in order to make more than $600 for the week?
Scan this QR code to get help on setting up and solving
inequalities word problems.

16
Justifying Steps using Properties A.4 The student will solve multistep linear and quadratic equations in two variables, including
b) justifying steps used in simplifying expressions and solving equations, using field properties and axioms of equality that are valid for the set of real numbers and its subsets;
You are using the properties of real numbers to solve equations and inequalities, and to simplify expressions. You will need to be able to identify the property that you are using in each step of the simplification or solution. When you solve an equation or inequality and perform the same operation on both sides of the equal sign this is a special property of equality.
Property Equation Example Inequality Example
Addition Property of
Equality and
Inequality
Subtraction Property
of Equality and
Inequality
Multiplication
Property of Equality
and Inequality
*Don’t forget to switch the sign if you multiply or divide
by a negative!
Division Property of
Equality and
Inequality
*Don’t forget to switch the sign if you multiply or divide
by a negative!

17
Example 1: –
Example 2:
Example 3:
Example 4: –

18
Justifying Steps using Properties List the properties used to justify each step in the problems below. 1.
2.

19
Functions and Graphs A.6 The student will graph linear equations and linear inequalities in two variables including
b) writing the equation of a line when given the graph of the line, two points on the line, or the slope and a point on the line.
The set of all solutions of an equation forms the graph of an equation. As an example, if the equation is , you can probably think of a lot of values that could satisfy x and y. Some examples are listed below in the t-chart.
x y
5 0
0 5
2 3
4 1
7 -2
To graph an equation, you can simply create a table of values by choosing values to plug in for x, and solve for the resulting y-values. Once you have x and y values, you can plot the ordered pairs and connect them with a line or curve that best fits.
Example 1: Graph
We will now plot each of these points on the coordinate plane to reveal the graph of . We will find that this graph forms a straight line, because this is a linear equation.
This line passes through all of the solutions to this linear equation, including the ones that we did not plot, such as (3, 2), (1, 4), (-1, 6) and (6, -1).

20
Example 2: Graph
You could start by transforming the equation for y.
Choose x-values that will work out nicely with the fraction (i.e. even numbers in this case)
Functions and Graphs 1. Graph 2. Complete the function table for the function 3. Which of these is closest to the graph of
x y
-1
0
1
Scan this QR code to go to a video tutorial on graphing
equations using a T-Chart.
A B C

21
Slope A.6 The student will graph linear equations and linear inequalities in two variables including
a) determining the slope of a line when given an equation of the line, the graph of the line, or two points on the line. Slope will be described as rate of change and will be positive, negative, zero, or undefined
The slope of a line is determined by the vertical change divided by the horizontal change (or rise over run). Slope can be positive, negative, zero, or undefined.
Positive Negative Zero Undefined
You can determine slope by counting rise over run, or using the formula:
Example 1: Find the slope of the line that passes through (-3, 9) and (2, 4).
Example 2: Determine the slope of the line graphed below.
By counting rise over run, we can see that the graph goes up
5, and to the right 2.

22
Example 3: Find the slope of the line that passes through (-4, 3) and (-4, 0).
You may also be asked to find the missing coordinate of a point given the slope and a different point on the line. To do this, plug in all of the given values into the slope formula, and solve for the missing value. Example 4: The slope of the line passing through and is . Solve for . and
Example 5: The slope of the line passing through and is
. Solve for .
and
Now you can cross multiply!
Now you can cross multiply!
Scan this QR code to go to a
video tutorial on slope.
Write the slope in a ratio format.

23
Slope 1. Find the slope of the line that passes through and . 2. Find the slope of the line that passes through and
3. The slope of the line passing through and is
. Solve for .
4. The slope of the line passing through and is 3. Solve for . Slope-Intercept and Transformations If you are asked to translate (or shift) a line, just move two points on the line the specified units and draw a new line. Remember, the new line should be parallel to the original line. This means the slope should remain the same. Only the y-intercept will change.
Example 1: Shift the line
down 5 units and right 2 units.
Example 2: The function is displayed on the graph below. Graph the function .
Choose two points on the line
. From each point, count
down 5 units and right 2 units. Plot a new point. Then, draw a line through the two new points. The equation of
the translated line is
.
Notice that the slopes of the lines are the same.
Choose two points on the function f(x), which is . From each
point, count up 3 units. Plot a new point. Then, draw a line through the two new points. The equation of the translated line is . Notice that the slopes of the lines are the
same.

24
Slope-Intercept A.7 The student will investigate and analyze function (linear and quadratic) families and
their characteristics both algebraically and graphically, including d) x- and y-intercepts;
The intercept of a graph is where it crosses the axis. The x-intercept is where a graph crosses the x-axis, and the y-intercept is where a graph crosses the y-axis.
A special form of a linear equation is called slope-intercept form: . Where is the slope of the line and is the y-intercept (0, ).
Example 1: What are the slope and y-intercept of
?
The slope is the coefficient of x, and the y-intercept is the constant.
The slope of the line is
, and the y-intercept is 4.
Example 2: What is the equation of the line with a slope of and a y-intercept of ?
It is often easier to graph an equation when it is written in slope-intercept form. You can start by plotting a point on the y-axis for the y-intercept, and then count the slope as rise over run, from the y-intercept.
Scan this QR code to go to a video tutorial on graphing linear
equations in slope-intercept form.
x-intercept
y-intercept

25
Example 3: Graph the equation
Sometimes, you will be asked to graph an equation that is not in slope-intercept form. You can transform an equation into slope-intercept form by solving for y. Example 4: Put in slope-intercept form, state the slope and the y-intercept, and graph.
The slope is 4, and the y-intercept is (0, -3).
You can find the equation of a line given two points on the line by first finding the slope. Once you have the slope and one point, you can plug this information into slope-intercept form and solve for the y-intercept ( ).
To graph the equation above, put a point on the y-axis at -3, and
then count the slope by going up 4 and to the right 1. Put a second
point there and draw a line through the two points.
To graph the equation above, put a point on the y-axis at 2, and then count the slope by going
down 1 and to the right 3. Put a second point there and draw a
line through the two points.

26
Example 5: What is the equation of the line that passes through and ? First find the slope:
Now you can use the slope and either of the points to solve for b.
Now that you have and you can write an equation in slope intercept form.
Slope-Intercept Form
1. What is the slope and y-intercept of ?
2. What is the equation of a line whose y-intercept is and slope is
?
3. What is the equation of the line that passes through and whose slope is ?
4. What is the y-intercept of the equation ?
5. Graph
6. Which of these equations has a slope of -2 ?
A. B. C. – D.
7. What is the equation of the line that passes through (3, 4) and has a slope of -2 ?
8. What is the equation of the line that passes through (3, -2) and (9, -4)?
9. Graph
10. Graph

27
11. The function is displayed on the graph below. What is the equation of the
function ?

28
Direct and Inverse Variation A.8 The student, given a situation in a real-world context, will analyze a relation to
determine whether a direct or inverse variation exists, and represent a direct variation algebraically and graphically and an inverse variation algebraically.
If the ratio between two variables is a constant, then a direct variation exists. A direct variation can be written in the form , where is the constant of variation. If the product of two variables is a constant, then an inverse variation exists. An
inverse variation can be written in the form
or .
Example 1: Determine if each relation is a direct variation, inverse variation, or neither.
To write an equation of a direct variation, use a given point (other than ) to plug into , to solve for .
To write an equation of an inverse variation, use a given point to plug into , to solve for .
x y
1 3
2 4
3 5
x y
-1 2
0 0
1 -2
x y
3 4
1 12
-2 -6
First check the ratios:
Does the ratio
? NO! Therefore this is NOT a direct variation!
Next check the products: Does ? NO! Therefore this is NOT an inverse variation!
First check the ratios:
Does the ratio
? NO! Therefore this is NOT a direct variation!
Next check the products: Does ? Does this also equal ? YES! Therefore this IS an inverse variation!
First check the ratios:
Does the ratio
? YES! Therefore this IS a direct variation!
Notice that we did not use the ordered pair to check the ratios. It is impossible to divide by zero, therefore we used the other points.

29
Example 2: Suppose varies directly with , and when . What direct variation equation relates and ?
Start with . We are given a value for and , so plug those in and solve for .
Once you have a direct variation equation, you can use that equation to determine other values. Example 3: The distance that you jog, , varies directly with the amount of time you jog, . If you can jog 9 miles in 1.5 hours, how long will it take you to jog 4 miles? Jogging varies directly with time
Now we need to solve for k in order to write a direct variation equation. Use the values that are related to one another.
Now, we can use this equation to solve for the time it takes to jog 4 miles. We are given that you jog 4 miles. This will be plugged in for j. Then, solve for t.
Therefore, it would take you
of an hour to jog 4 miles.
This is the constant of variation!
This is the direct variation equation!
This is the constant of variation!
This is the direct variation equation!
Scan this QR code to go to a video tutorial on direct and
inverse variations.

30
Direct and Inverse Variation 1. Determine if each of the following relations are a direct variation, an inverse
variation, or neither. 2. Suppose varies directly with , and when . What direct variation
equation relates and ? 3. Suppose varies directly with , and when . What will be when
? 4. The amount of money spent at the mall varies directly with the amount of time you
spend shopping. If you spend $90 when you are in the mall for 2.5 hours, how much time did you spend in the mall when you spent $340?
5. Jason’s earnings ( ) during his summer job is directly proportional to the amount of hours he worked ( ). When , , what is the constant of variation?
6. The time it takes to complete a job ( ) is inversely proportional to the amount of workers assigned to the job ( ). What value would accurately represent this relationship?
x y
2 4
0 0
1 8
x y
-4 -20
5 16
8 10
Time (t) Amount of Workers (w)
3 10
5 ?
15 2
A B

31
Systems of Equations A.4 The student will solve multistep linear and quadratic equations in two variables,
including e) solving systems of two linear equations in two variables algebraically and graphically; and f) solving real-world problems involving equations and systems of equations.
A system of equations is two or more equations, whose solution is any point that each of the equations has in common. This can be seen on a graph as the intersection point of the lines. Systems of two linear equations can have no solutions, one solution, or infinitely many solutions.
No Solutions One Solution Infinitely Many Solutions
Two lines that are parallel.
These lines have the same
slope, but different y-intercepts. They will
never intersect. Therefore, there is no solution.
Two lines that intersect.
These lines have different slopes, which causes them to intersect in one place. Therefore, there is one
solution. In this example, the solution is (2, 3).
Two lines that are the same.
These lines have the same
slope and the same y-intercept. This means
they are the same line and will share all points. Therefore, there are
infinitely many solutions.

32
Example 1: Systems of equations can also be solved algebraically by substitution or elimination. It is often easier to use substitution when one of the equations has a variable on the side by itself. If this is the case, you can substitute the ‘value’ of that variable into the other equation. This will allow you to solve for one variable. Example 2: Solve the system of equations by substitution.
Since , you can replace the in the second equation with !
Remember that the solution to a system of equations is an ordered pair! You have a y-value, so use that to help you solve for x.
What is the solution to the system of equations
pictured here?
The graphs intersect at the point .
Therefore, the solution is
.
Remember that an ordered pair is always (x, y)!

33
Example 3: Solve the system of equations by substitution.
You can substitute the ‘value’ of y from the first equation into the second equation.
Remember that the solution to a system of equations is an ordered pair! You have an x-value, so use that to help you solve for y.
Another method of solving a system of equations is called elimination. This is often easier when both equations are written in standard form ( ). To use the elimination method, you will add or subtract the two equations, or some multiple of them, to get one of the variables to cancel out. Example 4: Solve this system of equations by elimination.
Notice that the y terms have equal and opposite coefficients!
If you add these two equations together the y-term will cancel out! + –
Don’t forget to solve for y! Plug the x-value
back into one of the original equations.

34
You can always check your work when solving a system of equations by transforming both equations and graphing them in your calculator. The two lines should intersect at the ordered pair that you found. Below, you will see the calculator check for Example 4.
You can also check your work by plugging your values in for x and y to verify that both equations are true for those values. Sometimes the system of equations will not have variables that immediately cancel out (like the y-term did in Example 4). When this happens, you may have to multiply one or both of the equations by a constant to get two variables to have equal and opposite coefficients. Example 5: Solve this system of equations by elimination.
Scan this QR code to go to a video tutorial on solving systems
of equations.
Notice that the x terms have opposite coefficient signs. What can you do to
make the coefficients equal?
Multiply the first equation by 2, then the x-terms will have equal and
opposite coefficients. +
Don’t forget to solve for x! Plug the y-value back into one of the original equations.
The calculated intersection is
Which is the same thing as

35
Example 6: Solve this system of equations by elimination.
Systems of equations are often presented as word problems. In these cases, you will often not be given the equations, and you will be responsible for setting those up. Once you have two equations set up, you can solve the system of equations using any method that you prefer.
What can you do to make two of the coefficients equal?
Multiply the first equation by 3, and the second equation by 2, then the y-terms will have equal coefficients.
_
Don’t forget to solve for y! Plug the x-value back into one of the original equations.
Now you can subtract to get the y’s to cancel!

36
Example 7: A class of 148 students went on a field trip. They took 10 vehicles, some cars and some buses. Find the number of cars and buses they took if each car holds 4 students and each bus holds 40 students.
Don’t forget that you can check your work by graphing! Just solve both equations for one of the variables.
We know total number of vehicles, and total number of students. We can set up two equations where those are our totals.
The number of cars plus the number of
buses equals 10 total vehicles.
4 students per car plus 40 students per bus equals 148 total students.
Now we have two equations. We can solve this system using any method that we’ve learned.
Multiply the first equation by , then the c-terms will have equal
and opposite coefficients. +
So now we know that they took 3 buses. We can plug this value into one of the other
equations to solve for the number of cars!
They took 3 buses and 7 cars!
Scan this QR code to go to a video tutorial on solving systems
of equations word problems.

37
Example 8: Lauren is raising pot-bellied pigs and ostriches for fun. Among her animals, she has 17 heads and 56 legs in all. How many of each animal does she have?
Systems of Equations Solve each system using whatever method you prefer. 1. 2.
3. 4. The admission fee at a small fair is $1.75 for children and $3.00 for adults. On a
certain day, 1700 people enter the fair and $3375 is collected. How many children and how many adults attended?
5. Kris spent $144 on shirts. Dress shirts cost $19 and t-shirts cost $7. If he bought a total of 12, then how many of each kind did he buy?
We know total number of heads, and total number of legs. We can set up two equations where those are our totals.
Each pig has one head plus each
ostrich has one head equals 17 total heads.
4 legs per pig, plus 2 legs per ostrich
equals 56 legs total.
Be careful using as a variable! Don’t confuse it with 0. Now we have two equations. We can solve this equation using any method that we’ve learned.
Multiply the first equation by , then the -terms will have equal
and opposite coefficients. +
So now we know that she has 11 pigs. We can plug this value into one of the other
equations to solve for the number of ostriches! She has 11 pigs and 6 ostriches!

38
Systems of Inequalities A.5 The student will solve multistep linear inequalities in two variables, including
c) solving real-world problems involving inequalities; and d) solving systems of inequalities.
A linear inequality can be formed by replacing the equal sign in any linear equation
with an inequality symbol. The solutions for a linear inequality are any ordered pairs
that make it a true statement.
Example 1: Identify which ordered pairs are a solution of .
This is true, therefore
is a solution.
This is false, therefore
is NOT a solution.
This is true, therefore
is a solution.
As you can see from the last example, linear inequalities will have more than one solution. In fact, they will have infinitely many solutions. The graph of a linear inequality will indicate all of the solutions, and it is called a half-plane, and is bounded by a boundary line. All of the points on one side of this boundary are solutions, while all of the points on the other side of the boundary are not solutions. You graph a linear inequality the same way that you graph a linear equation. The line that you graph will either be dashed or solid depending on the inequality symbol. Dashed lines are used for < and >. This indicates that the points on the line are not part of the solution set. Solid lines are used for and . This indicates that the points on the line are part of the solution set. To determine which half-plane to shade in, you can select one point that is not on the graph and determine if it is a solution or not. If it is a solution, shade that side of the boundary. If it is not a solution, shade the other side. The point (0, 0) is often an easy point to check with.

39
Example 2: Graph
First, determine if you will be using a dashed or solid line (dashed in this case because you have < ) Then, graph the equation of the line by plotting the y-intercept and counting the slope as rise over run. Once you have a couple of points graphed, connect them with a dashed line. Finally, figure out which half-plane to color in. Select a point to see if it works.
This is false. Therefore, is NOT a solution. So, we will shade the other side.
All of the points on the shaded side will satisfy the inequality.
Scan this QR code to go to a video tutorial on graphing linear
inequalities.

40
Example 3: Graph
First, determine if you will be using a dashed or solid line (solid in this case because you have greater than or = equal to. Before we graph this equation, we should put it in slope intercept form! Remember that if you multiply or divide by a negative number you will have to switch the inequality symbol’s direction.
Now we can put a point at the y-intercept, and count the slope as rise over run. Finally, figure out which half-plane to color in. Select a point to see if it works. You can plug this point into the original equation or the transformed equation.
This is true. Therefore, is a solution. So, we will shade that side.
All of the points on the shaded side will satisfy the inequality.
You divided by
here! Don’t forget to
switch the sign!

41
To solve a system of linear inequalities, you will graph both inequalities on the same
coordinate plane. The solution is any area that is shaded for both inequalities.
Example 4: Solve the system of inequalities by graphing.
First, graph the first equation with a solid line and determine which half-plane you
should shade by choosing a point and verifying.
Now, graph the second equation on the same graph and determine which side to shade.
Does the point (0, 0) work?
No, so shade the other side!
Does the point (0, 0) work?
No, therefore shade the other side!
The solutions to the system of
inequalities are all of the points that are shaded
from both inequalities.
Scan this QR code to go to a video tutorial on systems of
inequalities.

42
Systems of Inequalities 1. Is a solution to the inequality ? 2. Is a solution to the inequality ? 3. Is (2, 2) a solution to this system of inequalities? 4. Graph . 5. Graph . 6. Write the inequality that is graphed here
7. Solve the system of inequalities by graphing.

43
Answers to the problems: Expressions and Order of Operations 1.
2.
3.
4. The product of twelve and a number
divided by four
5. a squared minus b to the fourth power
6.
7.
8.
9.
10.
11.
12.
13.
Properties of Real Numbers 1. F - Associative 2. E - Multiplicative Inverse 3. G - Commutative 4. H - Distributive 5. B - Additive Identity 6. G - Commutative 7. A - Multiplicative Property of Zero 8. D - Additive Inverse 9. J - Reflexive Property of Equality 10. K - Transitive Property of Equality
Solving Equations 1. 2. 3.
4.
5. 6.
7.
8.
Transforming Formulas
1.
or
2.
3.
4.
5.
or
Inequalities 1.
2.
3. 4. 5. Justifying Steps using Properties 1. Distributive Commutative Subtraction (Substitution) Subtraction (Substitution) 2. Associative Addition (Substitution) Subtraction Property of Inequality Subtraction (Substitution) Division Property of Inequality Divide (Substitution)
0 3 6 9 120–3–6–9
0 3 6 90–3–6–9

44
Functions and Graphs 1.
2.
x y
-1 -3
0 -5
1 -3
3. B Slope 1.
2.
3. 4. Direct and Inverse Variation 1. A ; B 2. 3. 4.
5.
6.
Slope-Intercept and Transformations 1.
2.
3. 4. 5. 6. B 7.
8.
9. 10.
11.

45
Systems of Equations
1.
2.
3.
4. 1380 Children
320 Adults
5. 5 dress shirts
7 t-shirts
Systems of Inequalities
1. No
2. Yes
3. Yes
4.
Systems of Inequalities 5.
6. 7.