alf254 units -mtdora 2015execsumm (1)
TRANSCRIPT

PEBBLE CREEK
MOUNT DORA SPRINGS
at
PEBBLE CREEK
108 Units –Phase I
254 Total Unit Senior Housing Project
PEBBLE CREEK 1

PEBBLE CREEK
EXECUTIVE SUMMARY
Pebble Creek, LLC is actively engaged identifying debt financing, preferred equity investment or Joint
Venture for the development of a 254 unit Senior Community featuring a mixture of Independent, Assisted and Dementia units. Affiliates of Pebble Creek owns and has substantially developed a 30 acre parcel located in the quaint city of Mt Dora, Lake County, Florida. The current property is divided into two zoning sectors, a 20 acre Residential / Multi-family site and a 10 acre commercial site. The commercial site features over 1,200 feet of frontage on State Road 44 and offers two, highly visible, commercial sites at the intersection of State Road 44 and 44B. We are currently positioned and ready to complete the balance of the infrastructure and begin development.
The current value of the 30 acre, 254 unit project is estimated at $6.5 which takes into consideration the cost of substantially completed infrastructure, the valuation of a per unit assessment and the increasing value of quality commercial property with considerably high visible frontage. The 20 acre Residential / Multi-family parcel will be developed over two phases that will ultimately feature a total of 293,000 square feet of senior housing with approximately 112 independent residence, 83 assisted units, 25 dementia units and 34 cottages for a total of 254 units. The first phase will feature 112,000 square feet, 32 ILU, 61 ALU and 15 Dementia units for a total of 108 residences and over 22,000 square feet of common area. Phase two will offer 102,900 square feet, 80 ILU, 22 ALU and 15 Dementia units for a total of 117 residences. The cottages will be sold on a per unit basis. The buyer will provide the required funding for the construction of the cottage which will be reimbursed on a pre-determined basis and over the period buyer resides at Pebble Creek. As the buyer graduates from the cottage to Independent living to assisted living and, if necessary, to Dementia the initial invested funds will be reimbursed to buyer on a monthly living allocation until depleted or until Buyer leaves the community. Ownership of the cottages will always remain with Pebble Creek, LLC during the entire period.
Financial Information Total project capital stack - $34,750,000
Phase I - $20,000,000Phase II - $14,750,000
Current Debt - $5,600,000Discounted Debt - $2,900,000Total amount invested to date in cash in the project is $3,200,000 +Stabilized NOI Completed Project projected to be $3,350,000The portfolio will include the following:
Assisted Living with a total of 83 units at a cost of $12,800,000 Dementia Beds with a total of 25 units / 40 beds at a cost of $3,150,000 Independent Living with a total of 112 units at a cost of $14,400,000 22,000 square feet of common area and community amenities $4,400,000 Cottages / Duplex with a total of 34 - 2 and 3 bedroom units
Project Highlights
PEBBLE CREEK 2

PEBBLE CREEK
Substantially completed infrastructure Complete Site Grading and Clearing Completed Sanitary Sewer Completed Potable Water Completed Storm Water System Completed Reclaimed Water Completed Retention Ponds Completed Underground Utilities Completed off-site Sewer (one mile from property) Completed Road Base Completed Curbs Completed Road Gutters Completed Fire Hydrants Fill Dirt
The property is located within 20 minutes of downtown Orlando and within close proximity to the Central Florida amusement parks.
On site, day-to-day management – Best Life Communities Developer and contractor with combined experience of 70 years Permits require re-instatement
PHASE I will include the payoff of two existing first mortgages at a 50% discount, the completion of the infrastructure, and the construction of 22,000 square feet of common area for the residents, 44,500 square feet that will feature 32 Independent Living Units, 42,500 that will feature 76 units with a mixture of 61 assisted living units and 15 dementia units. Phase one will include a total of 109,000 square feet and 108 units. The construction time frame for Phase one is estimated to be sixteen months which includes the completion of the infrastructure and the construction of the structures and common area. The stabilization period, established at 85% occupancy, is estimated to be 20 months. Initial sales and marketing will take place during the construction phase. It is estimated that 30% of the units will be reserved prior to final occupancy. The total cost of phase one is estimated at $20,000,000.
PHASE II will include the construction of 110,785 square feet that will feature 80 Independent Living Units, 17,800 square feet that will feature 32 units with a mixture of 22 assisted units and 10 dementia units. Phase two will include a total of 128,300 square feet or 112 units. The construction time frame for Phase two is estimated to be fourteen months, while the lease and stabilization period for the entire project is approximately twenty months after completion of Phase two construction. Pre-Leasing of phase two units will take place after stabilization for Phase one has been reached. The total cost of phase two is estimated at $14,750,000.
Furniture, Fixtures and Equipment: The buildings will be fully furnished in all common areas. All assisted living rooms will be furnished with a microwave, small refrigerator, window treatments and shower curtain. We will furnish 25% of the rooms (30 rooms in total), with state required furnishings to include a bed, a chair, lamp, table, bedding, towels, pillow, etc. Common areas (living rooms and TV center) commercial kitchen and dining areas will be completely furnished. State requires back up food
PEBBLE CREEK 3

PEBBLE CREEK
storage, activity supplies, dishware, back up linens will be on site for first survey. Total cost for all furniture, fixture and equipment has been determined.
It is determined that the community shall be completed over two phases based upon the market study for the surrounding area including Orlando. The total time frame to complete Mt Dora Springs including the stabilization of the project at 85 % occupancy is estimated to be 48 months which includes an estimated 36 month lease-up period for both phases. The total estimated cost for the community is $34,750,000 which will be allocated as follows:
Our Amenities include the following: ● Spacious rooms with private baths all ADA compliant ● Service elevators and ADA elevators ● Laundry rooms on every floor and laundry service ● Beautiful front room lobby as well as two sitting rooms on each wing ● Formal dining and room ● Large activity rooms with overflow community area ● Bistro for daily snacks and meals ● Hair salon ● Wellness Center/exercise room ● Physical Therapy Center and pool ● Chef developed menus ● Nursing services ● Secured Courtyards ● Safe Environment with exceptional Psycho– Social programs ● Daily Care consultants ● Community and individual activity programs ● Concierge service with transportation
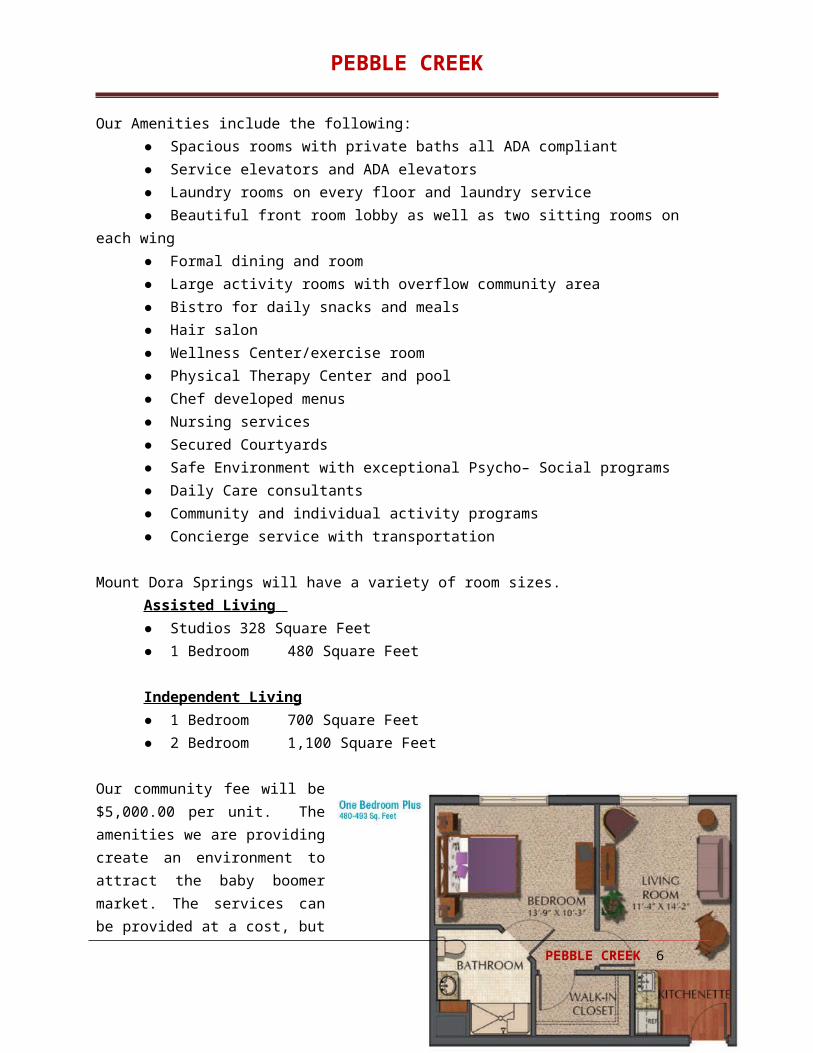
Mount Dora Springs will have a variety of room sizes. Assisted Living ● Studios 328 Square Feet
PEBBLE CREEK 4
Retire Current Loan w/Discount $2,900,000Total Closing Costs $690,000Operating & Debt Service Reserves $2,270,000Complete Infrastructure Costs $700,000Construction Costs Phase I $14,440,000 Phase II $13,750,000 Total Construction Cost $28,190,000
Total Cost $34,750,000

PEBBLE CREEK
● 1 Bedroom 480 Square Feet
Independent Living● 1 Bedroom 700 Square Feet● 2 Bedroom 1,100 Square Feet
Our community fee will be $5,000.00 per unit. The amenities we are providing create an environment to attract the baby boomer market. The services can be provided at a cost, but they are equal to what our competition is providing. One of the most important issues to consider is the opinion of the population and its political representation. Meetings with City Planning and Zoning, the City Manager have been extremely positive. With a continued support from the city, the Assisted Living Center we will be able to provide employment and tax revenue within the city. Currently we have had no adverse responses to the opening of the project. This fact alone will enable us to have a positive market plan and a smooth fill ratio.
Based on a total capitalization for Phase One of $20.0 million and debt financing ratio of 75% of total cost, the required preferred equity contribution is estimated at $5.0 million.
Market
Lake County, located in Central Florida, northwest of Orlando, has 1,156 square miles of which 203 square miles, or 17.58 percent, is water. Historically a rural area, Lake County has experienced more than a 25 percent population growth rate from 2010 to 2014. According to U.S. Census Bureau estimates for 2013, it was ranked as the 23rd fastest growing county in the United States with a population approaching 310,000. This growth has caused the county to struggle to maintain and expand its infrastructure.
Mount Dora is a lakefront town located 25 miles Northwest of Orlando. The city retains the flavor of a small town with hilly terrain, several lakes, large canopy oak trees and historic buildings. The community was named after Dora Ann Dowdy, a resident who provided hospitality to surveyors. After the arrival of the railroad, the local economy prospered with citrus and tourism. This early twentieth century style town, with its gourmet restaurants, unique shops and commitment to the arts has been recognized by the readers of Florida Living Magazine as Florida’s friendliest small town and has been voted among the top places to retire by Money Magazine. Mount Dora is near Orlando and its entertainment, Daytona and Cocoa Beaches and offers the best antique shopping in the state. There are plenty of fascinating
PEBBLE CREEK 5
PEBBLE CREEK
artifacts to observe in the art galleries, historic sites and museums throughout Mount Dora, and the annual art festival which attracts as many as 200,000 visitors to the community. Mount Dora and its surrounding area receive over one million visitors annually with the average age of visitor being over 60 (National tourist static from the Florida Travel Report 2013). Retired seniors enjoy warm temperatures and beautiful views. The city of Mount Dora is located in possibly the most unique setting of any community across the country. Neighbored by Tavares and Eustis, together they form the golden triangle of Lake County. All of the cities are located within a few miles of each other and are connected by land, lakes, rail and road. Each city has its own identity, yet compliments each of the others. Mount Dora offers year-round tennis, swimming, fishing, boating, water-skiing, wind surfing and golf. The city itself contains many parks. Tree shaded Donnelly Park occupies a full block in the center of town. Residents enjoy nearby attractions, such as The Ice House Theatre, complimentary membership at the Mount Dora Golf Club, and multiple local art & cultural festivals.
Pebble Creek’s market analysis includes a discussion of core demographic trends in Lake County and the tri-city area. Key considerations as they relate to the proposed development can be summarized as follows:
Population – The Lake County Market area has expanded from approximately 105,000 residents in 1990 to nearly 316,000 in 2013. The area has a wide-mix of residents by age with a general increase in population among those over the age of 55, the targeted demographic group for those who might consider assisted living. By 2013, nearly 5,500 residents of Mount Dora, or 41% will be over the age of 55. As the population ages, the percentage of persons needing assistance with activities of daily living increases. Florida rates the highest in all states where the percent of the total population of the state is 85years or over at 2.8 percent, North Dakota is second at 2.7 percent.
Income and Net Worth – A prime consideration for assisted living is the financial situation of prospective residents. More than fifteen percent of the Mount Dora households will have an income greater than $100,000 by 2013. Net worth, which more accurately reflects household wealth than income, was nearly twice that of other areas in Lake County.
As the over 65 population in Mount Dora continues to increase (up by 1,750 in 2013) so will the need for assisted living accommodations. The available national data and trends indicate that Mount Dora’s demand for assisted living units will increase to approximately 400 units by 2013 assuming a consistent 95% occupancy rate. This analysis represents an estimated near-term need for 90 to 150 additional assisted living units in Mount Dora. This estimate is conservative since the population increase in the over 65 age group will further increase assisted living demand.
Mount Dora Springs will serve seniors and Veterans in central Florida. This market analysis includes a discussion of core demographic trends in Lake County which will influence the current and future demand for this assisted living facility. This demographic assessment places the proposed development in a broader context to understand trends occurring in Lake County, Mount Dora and Central Florida.
Management Team
PEBBLE CREEK 6

PEBBLE CREEK
We are currently organizing an alliance with Best Life Communities, Inc. for management services. The team will establish a sales office on site to answer community questions and welcome advance reservations. We will have signage placed upon the property to take advantage of local traffic. The Gardens will advertise in the local senior directories. A Best Life Communities consultant will participate in all city planning and zoning meeting, community healthcare event and facilitate all press releases to insure accurate information. The team goal is to have a 50% commitment ratio prior to opening. The company features a highly experienced leadership team committed to setting the industry standard for excellence in senior living. The management company currently provides senior living management and consulting services to several living communities within Central Florida. The companies approach will help boost the property value through increased occupancy, controlled costs and satisfied residents. Over the years this company has refined its services to be the best and offers the most economical operational tools when managing a senior community. In addition, the management firm will offer but not limited; accounting services, sales and marketing, human resources, information technology and licensing.
Additional services offered will be their expertise as senior living operators to the development and construction process. They will assist in community layout, unit mix, amenities and other key functional areas of a successful and efficient senior living community. In doing so the project will be more efficient and much better equipped to address the future demands of the senior living industry.
Some of the many consulting services that the management company will provide include:
Financial forecasting Community size and design Program design Licensing Start-up management
The company offers a complete package of management services for the senior living care. Some of the senior living options that the company specializes in is Alzheimer’s care and has developed a program that is modeled after throughout the industry. In addition to Alzheimer’s care other options that the firm offers expertise in are Assisted Living, Independent Living, Skilled Nursing and Respite Care.
SummaryWe are seeking a Construction to Perm Loan at 40% LTV for a period of 5 to 7 years which would preferably be an interest only balloon loan at an annual interest rate of 6% or better. The loan would be divided into tranches where the first tranche is $20.0M for the first phase. The construction loan balance would roll to the permanent loan once that new loan is originated. Cash on hand and revenues from the project will be used to cover interest payments on the construction loan. Our preference however, would be that the interest would be deferred until the end of construction and included in the final permanent loan amount. The structure we are requesting is our preference, however we are flexible in our approach and would certainly entertain and welcome ideas from the lender on how to revamp parts of our strategy if necessary.
PEBBLE CREEK 7

PEBBLE CREEK
We look forward to hearing from you regarding this proposal. If you need additional information please let us know.
*Sponsor and General Contractor will arrange for a Performance Bond to ensure completion of the Senior Housing project
PEBBLE CREEK 8

PEBBLE CREEK
AERIAL AND SITE PLAN
PEBBLE CREEK 9

PEBBLE CREEK
PEBBLE CREEK 10
ALF/DEMENTIAOne Story60,300 Sq Ft
Approx. 108 units
ILFTwo Story155,000 Sq. Ft112 units
COTTAGES - DUPLEXOne Story56,100 Sq Ft34 - two bedroom, 2 car garage
COMMERCIALOne Story4,000 Sq FtChurch
One Story11,000 Sq FtRetail
One Story15,000 Sq FtRetail

MT DORA SPRINGS
FINANCIAL INFORMATION
PHASE ONEAnnual Operating Property DataCash Flow Resale AnalysisSummary of Cash Flow Analysis
MT DORA SPRINGS 11

MT DORA SPRINGS
PROJECTED INCOME AND EXPENSES Mount Dora Springs
2017 2018 2019 2020 2021 2022 2023 2024 INCOME
Gross Scheduled Rent Income 5,268,000 5,505,060 5,752,788 6,011,663 6,282,188 6,564,886 6,860,306 7,169,020
F&B, Leases, Misc. 526,800 550,506 575,279 601,166 628,219 656,489 686,031 68,603
Community Fee 575,000 373,750 57,500 0 0 0 0 0
TOTAL GROSS INCOME 6,369,800 6,429,316 6,385,566 6,612,829 6,910,407 7,221,375 7,546,337 7,237,623
VACANCY & CREDIT ALLOWANCE 3,821,880 2,250,261 1,596,392 661,283 691,041 722,138 754,634 723,762
GROSS OPERATING INCOME 2,547,920 4,179,055 4,789,175 5,951,547 6,219,366 6,499,238 6,791,703 6,513,861
EXPENSES
Accounting 16,858 17,195 17,711 18,419 19,340 20,307 21,322 22,388
Advertising 56,894 58,032 59,773 62,164 65,272 68,536 71,963 75,561
Insurance (fire and liability) 136,968 139,707 143,899 149,655 157,137 164,994 173,244 181,906
Pest Service 14,750 15,045 15,497 16,117 16,922 17,769 18,657 19,590
Lawn Maintenance 52,680 53,734 55,346 57,559 60,437 63,459 66,632 69,964
Food Services 505,728 515,843 531,318 552,571 580,199 609,209 639,669 671,653
Security Services 84,288 85,974 88,553 92,095 96,700 101,535 106,612 111,942
Nursing Services 195,970 199,889 205,886 214,121 224,827 236,068 247,872 260,266
Property Management 127,396 208,953 239,459 297,577 310,968 324,962 339,585 325,693
Repairs and Maintenance 48,466 49,435 50,918 52,955 55,602 58,383 61,302 64,367
Administrative 231,792 236,428 243,521 253,262 265,925 279,221 293,182 307,841
House Keeping 50,573 51,584 53,132 55,257 58,020 60,921 63,967 67,165
Unit Cleaning Services 50,573 51,584 53,132 55,257 58,020 60,921 63,967 67,165
Nursing Services 84,288 85,974 88,553 92,095 96,700 101,535 106,612 111,942
Pool Service 10,536 10,747 11,069 11,512 12,087 12,692 13,326 13,993
Taxes
Real Estate 105,360 107,467 110,691 115,119 120,875 126,919 133,264 139,928
Personal Property 7,500 7,650 7,880 8,195 8,604 9,035 9,486 9,961
Trash Removal 12,643 12,896 13,283 13,814 14,505 15,230 15,992 16,791
Utilities
Electricity 61,109 62,331 64,201 66,769 70,107 73,613 77,293 81,158
Sewer and Water 31,608 32,240 33,207 34,536 36,262 38,076 39,979 41,978
Telephone 5,000 5,100 5,253 5,463 5,736 6,023 6,324 6,640
TOTAL EXPENSES 1,890,979 2,007,808 2,092,279 2,224,511 2,334,248 2,449,406 2,570,251 2,667,893
NET OPERATING INCOME 656,941 2,171,248 2,696,896 3,727,036 3,885,118 4,049,832 4,221,452 3,845,968
MT DORA SPRINGS 12

MT DORA SPRINGS
Mount Dora Springs SUMMARY CASHFLOW AND RESALE ANALYSIS
2017 2018 2019 2020 2021 2022 2023 2024
GROSS INCOME 6,369,800 6,429,316 6,385,566 6,612,829 6,910,407 7,221,375 7,546,337 7,237,623 - Vacancy & Credit Allowance 3,821,880 2,250,261 1,596,392 661,283 691,041 722,138 754,634 723,762 - Operating Expenses 1,890,979 2,007,808 2,092,279 2,224,511 2,334,248 2,449,406 2,570,251 2,667,893 NET OPERATING INCOME 656,941 2,171,248 2,696,896 3,727,036 3,885,118 4,049,832 4,221,452 3,845,968 - Interest, All Loans 553,501 539,001 523,984 508,434 492,331 973,583 955,623 936,556 - Depreciation and Amortization 754,500 782,667 782,667 676,000 676,000 689,087 689,087 689,087 INCOME OR (LOSS) (651,060) 849,580 1,390,245 2,542,602 2,716,787 2,387,162 2,576,742 2,220,326 (LOSS) UTILIZED THIS YEAR 0 (651,060) 0 0 0 0 0 0 TAXABLE INCOME 0 198,520 1,390,245 2,542,602 2,716,787 2,387,162 2,576,742 2,220,326 NET OPERATING INCOME 656,941 2,171,248 2,696,896 3,727,036 3,885,118 4,049,832 4,221,452 3,845,968 - Debt Service, All Mortgages 961,197 961,197 961,197 961,197 961,197 1,264,769 1,264,769 1,264,769 + Proceeds of Refinance 0 0 0 0 0 2,219,968 0 0 CASH FLOW BEFORE TAXES (304,256) 1,210,051 1,735,698 2,765,839 2,923,921 5,005,031 2,956,683 2,581,200 NET CASH FLOW AFTER UTILIZING RESERVES (304,256) 1,210,051 1,735,698 2,765,839 2,923,921 5,005,031 2,956,683 2,581,200 - Income Tax Attributable to Property 0 55,586 389,268 711,929 760,700 668,405 721,488 621,691 CASH FLOW AFTER TAXES AND RESERVES (304,256) 1,154,465 1,346,430 2,053,910 2,163,220 4,336,625 2,235,195 1,959,508 GAIN OR (LOSS) ON SALE, Real Estate (12,741,741) 3,236,659 9,224,531 20,310,387 22,583,827 24,924,275 27,334,515 24,216,211 GAIN ON SALE, Personal Property 0 0 0 0 0 0 0 0 PROJECTED SELLING PRICE, incl. personal prop. 6,915,200 22,855,200 28,388,400 39,232,000 40,896,000 42,629,800 44,436,300 40,483,900 - Costs of Sale 276,608 914,208 1,135,536 1,569,280 1,635,840 1,705,192 1,777,452 1,619,356 - Mortgage Payoffs 15,592,304 15,170,107 14,732,894 14,280,131 13,811,264 16,067,214 15,758,068 15,429,855 BEFORE-TAX SALE PROCEEDS (8,953,712) 6,770,885 12,519,970 23,382,589 25,448,896 24,857,394 26,900,780 23,434,689 - Total Federal Tax on Sale (235,312) 690,135 1,951,376 4,202,347 4,690,835 4,686,290 5,171,117 4,660,807 AFTER-TAX SALE PROCEEDS (8,718,400) 6,080,750 10,568,594 19,180,242 20,758,060 20,171,104 21,729,662 18,773,882 Internal Rate of Return, Before Tax n/a 32.44% 52.74% 63.53% 55.82% 50.56% 47.66% 43.69%Modified Internal Rate of Return, Before Tax -100.00% 31.54% 49.95% 58.88% 49.81% 43.26% 38.86% 33.44%Internal Rate of Return, After-Tax n/a 25.94% 44.18% 55.04% 48.55% 44.34% 41.86% 38.08%Modified Internal Rate of Return, After Tax -100.00% 25.24% 41.80% 51.03% 43.51% 38.34% 34.63% 29.75%PV, Net Operating Income & Reversion 6,572,552 20,161,873 24,253,078 31,590,733 32,385,755 33,131,933 33,832,257 31,818,487 PV, CFAT and Sale Proceeds after Taxes (8,128,519) 5,598,158 9,375,047 15,634,976 16,603,021 17,386,955 18,145,535 16,676,027 EQUITY, excluding reserves (8,677,104) 7,685,093 13,655,506 24,951,869 27,084,736 26,562,586 28,678,232 25,054,045 RETURN ON EQUITY (CFBT/equity) n/a 15.75% 12.71% 11.08% 10.80% 10.48% 10.31% 10.30%
*NOTE: If this analysis includes a partial first year, then the IRR, MIRR and PV calculations use estimated full year amounts for cash flow and NOI. First-year capital additions andfunded reserves are treated as part of the initial cash investment and do not affect first-year cash flow. Sale-year depreciation is adjusted within the calculation of resale tax and proceeds.
MT DORA SPRINGS 13

MT DORA SPRINGS
CONSTRUCTION COST INFORMATION
PHASE ONE
Project Soft CostProject Hard CostTotal Project Cost
MT DORA SPRINGS 14

Project Soft Costs
Project Hard Costs
MT DORA SPRINGS
ARCHITECTURAL AND ENGINEERINGGeneral architectural & engineering costs 125,000 Blueprints 12,500 Other architectural & engineering costs 0 TOTAL A & E $ 137,500
FINANCING COSTS Loan processing fee 80,400 Development loan fees (points) 312,000 Development loan interest 1,014,950 Land loan interest (during development) 0 Market Study 17,500 Title recording & insurance 26,800 Legal fees, loans 93,800 Appraisal fee 12,500 Course-of-construction insurance 25,000 Imputed interest 0 Other financing costs 12,000 TOTAL FINANCING COSTS $ 1,594,950
LAND SOFT COSTSLand title work 0 Engineering costs 8,500 Land taxes 5,000 Soil tests 0 Land survey 3,500 Other land costs 0 TOTAL LAND SOFT COSTS $ 17,000
DEVELOPMENT COSTSAccounting 7,500 Legal 0 Feasibility 0 Permits 98,000 Marketing 45,000 Signage 3,000 Impact Fees 85,000 Development fee 234,800 Project management 95,000 TOTAL DEVELOPMENT COSTS $ 568,300
MT DORA SPRINGS 15

Total Project Cost
MT DORA SPRINGS
CONSTRUCTION COSTSGeneral Project Costs……………….... Dumpsters 30,700
Portable toilets 16,800 F F & E 489,275 Cleaning 70,480 Transportation 119,770
Site Work……………….... Roads and Curbs 123,380 Sewer, Storm Water repair 75,020 Parking 48,720 Deceleration Lane 275,750 Site electrical utilities 58,420 Entrance cost 91,350 Perimeter Wall 299,420
Substructure……………….... Foundations 909,440 Driveway/Sidewalk Construction 27,000 Elevators 203,000
Shell………………………... Shell superstructure 1,244,800 Windows, Doors & Garage Doors 187,700 Roofing 425,600 Stucco 657,000
Interior…………………...... Interior Trim & doors 480,600 Framing 1,051,000 Interior finishes 1,120,000 Appliances 135,000
Finished Interior……………….... Painting 491,600 Cabinets & Countertops 384,200 Flooring 650,400
Plumbing……………..….... Plumbing 622,900 Interior Sprinkler System 147,700
HVAC…………………....... HVAC 583,300 Other ventilation 34,100
Exterior Improvements…………………....... Sprinkler systems 68,420 Landscaping 160,400
Electrical……………...….... Electric service 77,140 Rough-In Wiring 862,000 Light Fixtures 105,260 Alarm Systems (smoke, fire, intrusion) 96,600
Miscellaneous……………….... Soffits 51,100 Gutters 37,000
Special Construction……………….... Screen Enclosures 52,400 Swimming pools 96,420 Specialty Products 732,870 Reserve 509,440 TOTAL HARD COSTS $ 13,903,475 Square Foot Cost $127.55
MT DORA SPRINGS 16

MT DORA SPRINGS
LAND COST $ 2,900,000 $96,666 per acre
SOFT COSTS $ 2,317,750
HARD COSTS $ 13,903,475 127.55 per SF
CONSTRUCTION CONTINGENCY $ 878,000
TOTAL PROJECT COST before lease-up period costs or income $ 20,000,000 183.48 per SF
Net Lease-up Period Costs $ 423,258 3.88 per SF
TOTAL COST OVERALL (rounded, including lease-up period cost) $ 20,423,258 187.37 per SF
LOANS REQUESTEDDevelopment Loan $ 15,600,000 143.12 per SF Total Loans $ 15,600,000 143.12 per SF
EQUITYDeveloper's cash equity excluding net lease-up income or cost $ 3,600,000 Plus net lease-up period costs $ 423,258
Total development equity (rounded) $ 4,023,580 36.91 per SF
% of Total Cost Overall 20.12%
Cap Rate (Expected First Year NOI / Total Cost Overall) 8.50%
THE INFORMATION, PROJECTIONS, AND CALCULATIONS PRESENTED IN THIS DOCUMENT ARE
BELIEVED TO BE ACCURATE AND CORRECT BUT ARE NOT GUARANTEED.
MT DORA SPRINGS 17

MT DORA SPRINGS
FINANCIAL INFORMATION
COMPLETED PROJECTAnnual Operating Property DataCash Flow Resale AnalysisSummary of Cash Flow Analysis
Mount Dora Springs
MT DORA SPRINGS 18

MT DORA SPRINGS
PROJECTED INCOME AND EXPENSES, in total dollars
2018 2019 2020 2021 2022 2023 2024
INCOME
Gross Scheduled Rent Income 9,817,200 10,209,888 10,618,284 11,043,015 11,484,735 11,944,125 12,421,890
F&B, Leases, Misc. 981,720 1,020,989 1,061,828 1,104,301 1,148,474 1,194,412 1,242,189
Community Fee 157,500 359,000 150,900 0 0 0 0
TOTAL GROSS INCOME 10,956,420 11,589,877 11,831,012 12,147,316 12,633,209 13,138,537 13,664,079
VACANCY & CREDIT ALLOWANCE 4,382,568 2,897,469 1,183,101 1,214,732 1,263,321 1,313,854 1,366,408
GROSS OPERATING INCOME 6,573,852 8,692,408 10,647,911 10,932,585 11,369,888 11,824,684 12,297,671
EXPENSES
Accounting 47,123 48,065 49,507 51,487 53,547 55,689 57,916
Advertising 159,039 162,219 167,086 173,769 180,720 187,949 195,467
Insurance (fire and liability) 382,871 390,528 402,244 418,334 435,067 452,470 470,569
Pest Service 41,232 42,057 43,319 45,051 46,853 48,728 50,677
Lawn Maintenance 147,258 150,203 154,709 160,898 167,334 174,027 180,988
Food Services 1,413,677 1,441,950 1,485,209 1,544,617 1,606,402 1,670,658 1,737,484
Security Services 147,258 150,203 154,709 160,898 167,334 174,027 180,988
Nursing Services 547,800 558,756 575,518 598,539 622,481 647,380 673,275
Property Management 328,693 434,620 532,396 546,629 568,494 591,234 614,884
Repairs and Maintenance 135,477 138,187 142,333 148,026 153,947 160,105 166,509
Administrative 647,935 660,894 680,721 707,950 736,268 765,718 796,347
Housekeeping 141,368 144,195 148,521 154,462 160,640 167,066 173,748
General Expenses 129,587 132,179 136,144 141,590 147,254 153,144 159,269
Capital Reserves 235,613 240,325 247,535 257,436 267,734 278,443 289,581
Pool Service 20,616 21,028 21,659 22,526 23,427 24,364 25,338
Taxes
Real Estate 294,516 300,406 309,419 321,795 334,667 348,054 361,976
Personal Property 16,000 16,320 16,810 17,482 18,181 18,909 19,665
Trash Removal 35,342 36,049 37,130 38,615 40,160 41,766 43,437
Utilities
Electricity 170,819 174,236 179,463 186,641 194,107 201,871 209,946
Sewer and Water 88,355 90,122 92,826 96,539 100,400 104,416 108,593
Telephone 10,000 10,200 10,506 10,926 11,363 11,818 12,291
TOTAL EXPENSES 5,140,578 5,342,743 5,587,762 5,804,210 6,036,379 6,277,834 6,528,947
NET OPERATING INCOME 1,433,274 3,349,665 5,060,149 5,128,374 5,333,509 5,546,850 5,768,724
MT DORA SPRINGS 19

MT DORA SPRINGS
Mount Dora Springs SUMMARY CASHFLOW & RESALE ANALYSIS
2018 2019 2020 2021 2022 2023 2024 2025 2026
GROSS INCOME 10,956,420 11,589,877 11,831,012 12,147,316 12,633,209 13,138,537 13,664,079 14,210,642 14,779,068 - Vacancy & Credit Allowance 4,382,568 2,897,469 1,183,101 1,214,732 1,263,321 1,313,854 1,366,408 1,421,064 1,477,907 - Operating Expenses 5,140,578 5,342,743 5,587,762 5,804,210 6,036,379 6,277,834 6,528,947 6,790,105 7,061,709 NET OPERATING INCOME 1,433,274 3,349,665 5,060,149 5,128,374 5,333,509 5,546,850 5,768,724 5,999,473 6,239,452 - Interest, All Loans 934,032 909,564 884,224 857,982 830,808 1,261,646 1,240,021 1,216,948 1,192,330 - Depreciation and Amortization 1,187,121 1,230,909 1,230,909 1,050,909 1,050,909 1,181,284 1,181,284 1,181,284 1,050,909 INCOME OR (LOSS) (687,879) 1,209,192 2,945,016 3,219,483 3,451,792 3,103,920 3,347,419 3,601,241 3,996,212 (LOSS) UTILIZED THIS YEAR 0 (687,879) 0 0 0 0 0 0 0 TAXABLE INCOME 0 521,313 2,945,016 3,219,483 3,451,792 3,103,920 3,347,419 3,601,241 3,996,212 NET OPERATING INCOME 1,433,274 3,349,665 5,060,149 5,128,374 5,333,509 5,546,850 5,768,724 5,999,473 6,239,452 - Debt Service, All Mortgages 1,622,020 1,622,020 1,622,020 1,622,020 1,622,020 1,584,538 1,584,538 1,584,538 1,584,538 + Proceeds of Refinance 0 0 0 0 0 (4,141,436) 0 0 0 CASH FLOW BEFORE TAXES (188,746) 1,727,644 3,438,128 3,506,354 3,711,489 (179,125) 4,184,186 4,414,935 4,654,914 NET CASH FLOW AFTER UTILIZING RESERVES (188,746) 1,727,644 3,438,128 3,506,354 3,711,489 (179,125) 4,184,186 4,414,935 4,654,914 - Income Tax Attributable to Property 0 145,968 824,604 901,455 966,502 869,098 937,277 1,008,347 1,118,939 CASH FLOW AFTER TAXES AND RESERVES (188,746) 1,581,677 2,613,524 2,604,899 2,744,987 (1,048,222) 3,246,908 3,406,587 3,535,974 GAIN OR (LOSS) ON SALE, Real Estate (18,498,379) 2,994,002 22,290,096 24,068,685 27,307,722 30,634,311 34,051,812 37,564,065 41,174,718 GAIN ON SALE, Personal Property 0 0 0 0 0 0 0 0 0 PROJECTED SELLING PRICE, incl. personal prop. 15,925,300 37,218,500 56,223,900 56,981,900 59,261,200 61,631,700 64,096,900 66,660,800 69,327,200 - Costs of Sale 637,012 1,488,740 2,248,956 2,279,276 2,370,448 2,465,268 2,563,876 2,666,432 2,773,088 - Mortgage Payoffs 26,312,012 25,599,555 24,861,759 24,097,721 23,306,508 19,233,304 18,888,787 18,521,197 18,128,989 BEFORE-TAX SALE PROCEEDS (11,023,724) 10,130,205 29,113,185 30,604,903 33,584,244 39,933,128 42,644,237 45,473,171 48,425,123 - Total Federal Tax on Sale (282,496) 661,373 4,623,537 5,031,801 5,732,153 5,888,678 6,613,897 7,356,171 8,079,652 AFTER-TAX SALE PROCEEDS (10,741,228) 9,468,832 24,489,648 25,573,103 27,852,090 34,044,450 36,030,340 38,116,999 40,345,470 Internal Rate of Return, Before Tax n/a 18.47% 61.39% 50.52% 45.56% 41.96% 39.15% 37.14% 35.64%Modified Internal Rate of Return, Before Tax -100.00% 18.31% 59.54% 47.20% 40.93% 36.26% 32.67% 30.15% 28.15%Internal Rate of Return, After-Tax n/a 14.32% 51.93% 42.93% 38.85% 36.10% 33.60% 31.81% 30.47%Modified Internal Rate of Return, After Tax -100.00% 14.21% 50.36% 40.26% 35.23% 31.69% 27.61% 25.66% 24.11%PV, Net Operating Income & Reversion 15,064,471 33,008,976 47,175,852 47,122,370 48,015,128 48,851,599 49,635,261 50,369,544 51,057,500 PV, CFAT and Sale Proceeds after Taxes (9,846,823) 8,798,799 20,931,289 21,586,392 22,898,473 24,010,744 24,727,408 25,391,276 26,005,643 EQUITY, excluding reserves (10,386,712) 11,618,945 31,362,141 32,884,179 35,954,692 42,398,396 45,208,113 48,139,603 51,198,211 RETURN ON EQUITY (CFBT/equity) n/a 14.87% 10.96% 10.66% 10.32% 9.35% 9.26% 9.17% 9.09%
MT DORA SPRINGS 20

MT DORA SPRINGS
CONSTRUCTION COST INFORMATION
PHASE TWOProject Soft CostProject Hard CostTotal Project Cost
MT DORA SPRINGS 21

Project Soft Costs
MT DORA SPRINGS
ARCHITECTURAL AND ENGINEERINGGeneral architectural & engineering costs 85,000 Blueprints 12,500 Other architectural & engineering costs 0 TOTAL A & E $ 97,500
FINANCING COSTS Loan processing fee 46,473 Development loan fees (points) & Loan Interest 447,039 Title recording & insurance 13,167 Legal fees, loans 54,219 Appraisal fee 10,500 Course-of-construction insurance 25,000 Imputed interest 0 Other financing costs 12,000 TOTAL FINANCING COSTS $ 608,398
LAND SOFT COSTSLand title work 0 Engineering costs 8,500 Land survey 3,500 Environmental survey, Phase 1 0 Environmental survey, Phase 2 0 Other land costs 0 TOTAL LAND SOFT COSTS $ 12,000
DEVELOPMENT COSTSAccounting 7,500 Legal 0 Feasibility 0 Permits 108,000 Marketing 45,000 Signage 0 Impact Fees 93,000 Development fee 185,200 Project management 95,000 TOTAL DEVELOPMENT COSTS $ 533,700
MT DORA SPRINGS 22

Project Hard Costs
MT DORA SPRINGS
CONSTRUCTION COSTSGeneral Project Costs……………….... Dumpsters 26,000
Portable toilets 14,250 F F & E 197,200 Cleaning 79,700 Transportation 119,770 Parking 68,720 Site electrical utilities 48,420
Substructure……………….... Foundations 970,400 Driveway/Sidewalk Construction 34,400 Elevators 403,000
Shell………………………... Shell superstructure 1,270,000 Windows, Doors & Garage Doors 185,300 Roofing 490,000 Stucco 575,400
Interior…………………...... Interior Trim & doors 579,600 Framing 1,185,900 Interior finishes 1,330,500 Appliances 125,000
Finished Interior……………….... Painting 550,400 Cabinets & Countertops 441,000 Flooring 493,700
Plumbing……………..….... Plumbing 685,600 Interior Sprinkler System 155,300
HVAC…………………....... HVAC 580,000 Other ventilation 28,900
Exterior Improvements…………………....... Sprinkler systems 24,175 Landscaping 135,700
Electrical……………...….... Electric service 77,140 Rough-In Wiring 780,550 Light Fixtures 77,300 Alarm Systems (smoke, fire, intrusion) 81,900
Miscellaneous……………….... Soffits 73,300 Gutters 14,400
Special Construction……………….... Screen Enclosures 52,400 Specialty Products 532,875 Reserve 470,400 TOTAL HARD COSTS $12,958,600 Square Foot Cost $116.97
MT DORA SPRINGS 23

Total Project Cost
MT DORA SPRINGS
LAND COST $ 0
SOFT COSTS $ 1,251,600
HARD COSTS $12,958,600 116.97 per SF
CONSTRUCTION CONTINGENCY $ 540,000
TOTAL PROJECT COST before lease-up period costs or income $ 14,750,000 133.14 per SF
Net Lease-up Period Income $ 292,978 2.65 per SF
TOTAL COST OVERALL (rounded, including lease-up period income and) $ 15,042,978 135.78 per SF
LOANS REQUESTEDDevelopment Loan $11,400,000 102.90 per SF Total Loans $11,400,000 102.90 per SF
EQUITYDeveloper's cash equity excluding net lease-up income or cost $ 3,350,000 Minus net lease-up period income $ 292,978
Total development equity (rounded) $ 3,642,978 32.88 per SF
% of Total Cost Overall 22.71%
Cap Rate (Expected First Year NOI / Total Cost Overall) 9.5%
THE INFORMATION, PROJECTIONS, AND CALCULATIONS PRESENTED IN THIS DOCUMENT ARE
BELIEVED TO BE ACCURATE AND CORRECT BUT ARE NOT GUARANTEED.
MT DORA SPRINGS 24

MT DORA SPRINGS
FLOOR PLANS
INDEPENDENT LIVING UNITSASSISTED LIVING UNITS
MT DORA SPRINGS 25

MT DORA SPRINGS
INDEPENDENT LIVING UNITS
One and Two Story Buildings
SAMPLE FLOOR PLANS
Two Bedroom/Two Bath – 1100 Square Feet
One Bedroom/One Bath – 700 Square
Feet
MT DORA SPRINGS 26

MT DORA SPRINGS
ASSISTED LIVING UNITS
MT DORA SPRINGS 27