alberto porta
DESCRIPTION
Assessing complexity of the interactions among cardiovascular variables via multivariate linear model-based approach. Alberto Porta. Department of Biomedical Sciences for Health Galeazzi Orthopedic Institute University of Milan Milan, Italy. Introduction. - PowerPoint PPT PresentationTRANSCRIPT
Alberto Porta
Department of Biomedical Sciences for Health Galeazzi Orthopedic Institute
University of MilanMilan, Italy
Assessing complexity of the interactions among cardiovascular variables via multivariate
linear model-based approach

Introduction
Complexity analysis of cardiovascular control provides important physiological and clinical information
The assessment of complexity of cardiovascular control is mainly based on univariate approaches
Among these approaches fractal analysis is one of the most commonly utilized
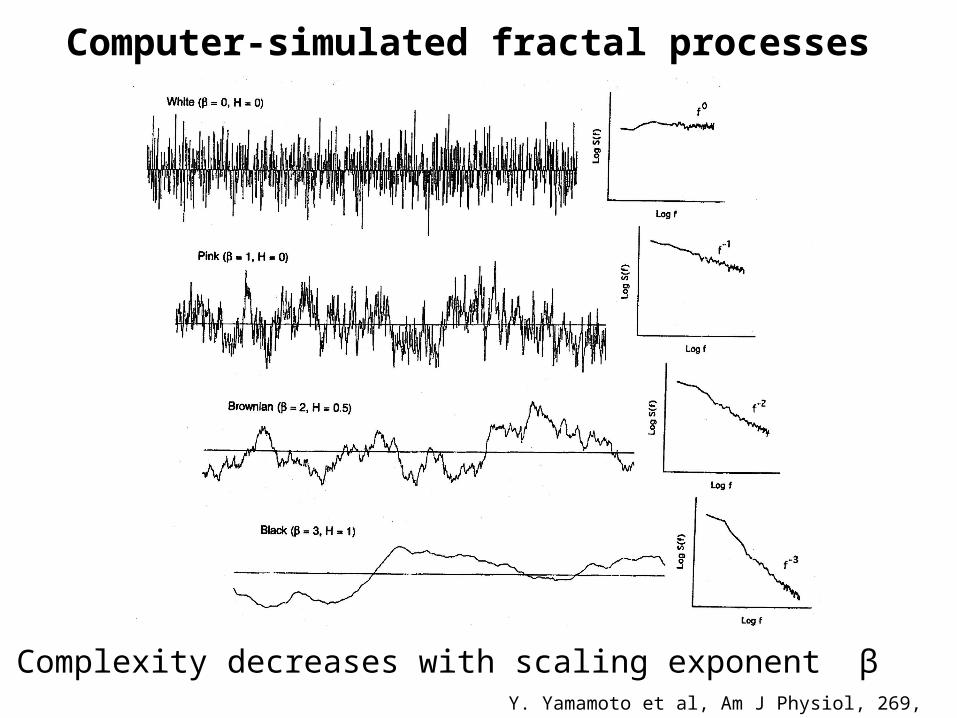
Computer-simulated fractal processes
Complexity decreases with scaling exponent βY. Yamamoto et al, Am J Physiol, 269, R830-R837, 1995

Y. Yamamoto et al, Am J Physiol, 269, R830-R837, 1995
Fractal analysis of heart period variability during vagal blockade

Y. Yamamoto et al, Am J Physiol, 269, R830-R837, 1995
Fractal analysis of heart period variability during β-adrenergic blockade

P. Castiglioni et al, J Physiol, 589, 355-369, 2011
Overall spectrum of the scaling exponents of heart rate variability via detrended fluctuation analysis
White noise .
1/f
Brownian motion
Atropine Propranolol
with α = (β+1)/2
α α

P. Castiglioni et al, J Physiol, 589:355-369, 2011
white noise
1/f
Brownian motion
Overall spectrum of the scaling exponents of heart rate variability via detrended fluctuation analysis
α
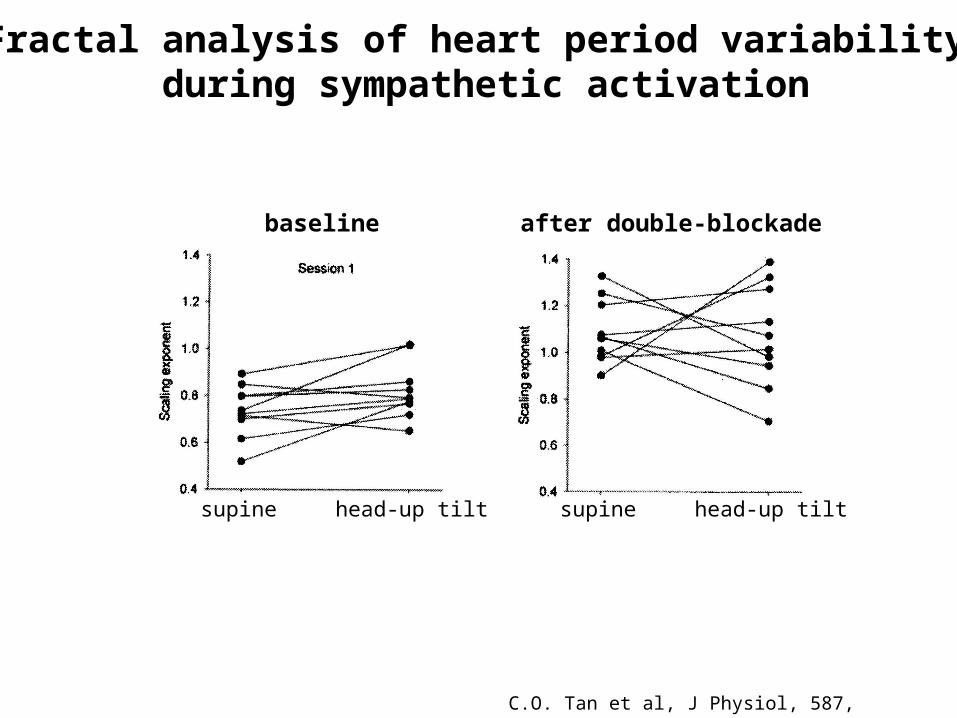
C.O. Tan et al, J Physiol, 587, 3929-3941, 2009
Fractal analysis of heart period variability during sympathetic activation
after double-blockadebaseline
supine head-up tilt supine head-up tilt

N. Iyengar et al, Am J Physiol, 271, R1078-R1084, 1996
Age-related alterations in fractal scaling of heart period variability

Drawback of the univariate approaches for the assessment of complexity of the cardiovascular control
Univariate approaches for the evaluation of complexity of cardiovascular control has a major drawback
They cannot take into account the relations among cardiovascular variables and quantify the contribution of specific physiological mechanisms to the overall complexity
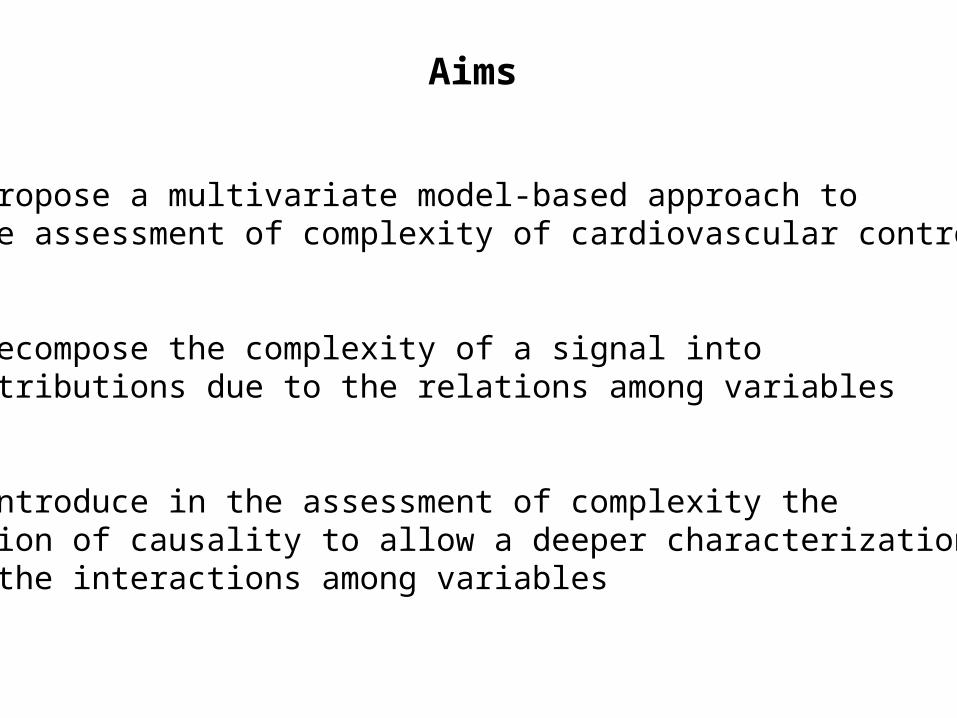
Aims
1) to propose a multivariate model-based approach to the assessment of complexity of cardiovascular control
2) to decompose the complexity of a signal into contributions due to the relations among variables
3) to introduce in the assessment of complexity the notion of causality to allow a deeper characterization of the interactions among variables

Outline
1) Multivariate model-based approach for the assessment of complexity of the cardiovascular system 2) Multivariate model-based approach for the assessment of the contribution of specific mechanisms to the overall complexity in the case of open loop interactions
3) Multivariate model-based approach for the assessment of the contribution of specific mechanisms to the overall complexity in the case of closed loop interactions
4) Granger-causality: a method for the quantification of the contribution of specific mechanisms to the overall complexity
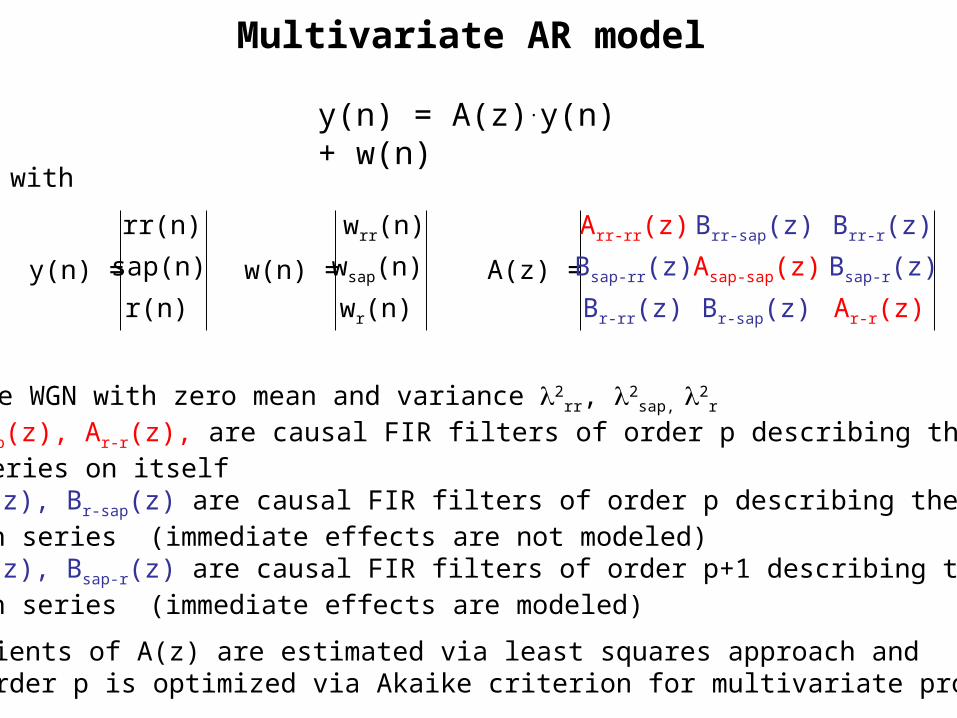
Multivariate AR model
wherewrr, wsap, wr are WGN with zero mean and variance 2
rr, 2sap, 2
r
Arr-rr(z), Asap-sap(z), Ar-r(z), are causal FIR filters of order p describing the auto-link of a series on itself Bsap-rr(z), Br-rr(z), Br-sap(z) are causal FIR filters of order p describing the cross-link between series (immediate effects are not modeled)Brr-sap(z), Brr-r(z), Bsap-r(z) are causal FIR filters of order p+1 describing the cross-link between series (immediate effects are modeled)
y(n) = A(z).y(n) + w(n)
with
y(n) =
r(n)
sap(n)
rr(n)
w(n) =
wr(n)
wsap(n)
wrr(n)
A(z) =
Arr-rr(z) Brr-sap(z) Brr-r(z)
Bsap-rr(z) Asap-sap(z) Bsap-r(z)
Br-rr(z) Br-sap(z) Ar-r(z)
The coefficients of A(z) are estimated via least squares approach andthe model order p is optimized via Akaike criterion for multivariate processes
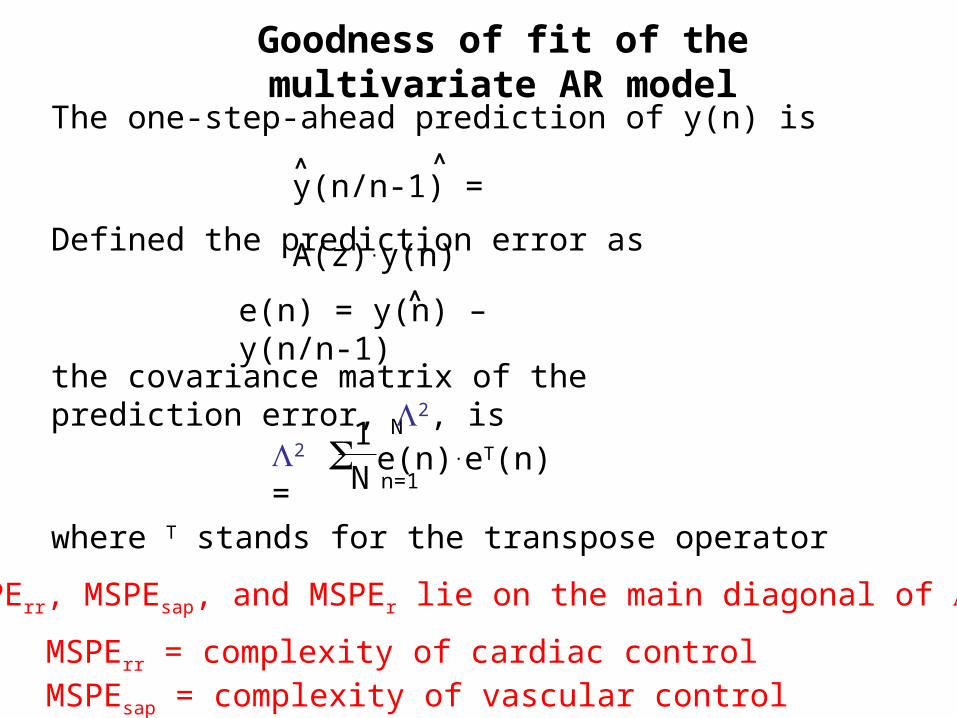
Defined the prediction error as
y(n/n-1) = A(z).y(n)
MSPErr, MSPEsap, and MSPEr lie on the main diagonal of 2
Goodness of fit of the multivariate AR model
The one-step-ahead prediction of y(n) is
e(n).eT(n) n=1
N
N
12 =
where T stands for the transpose operator
MSPErr = complexity of cardiac controlMSPEsap = complexity of vascular control
e(n) = y(n) – y(n/n-1)
the covariance matrix of the prediction error, 2, is
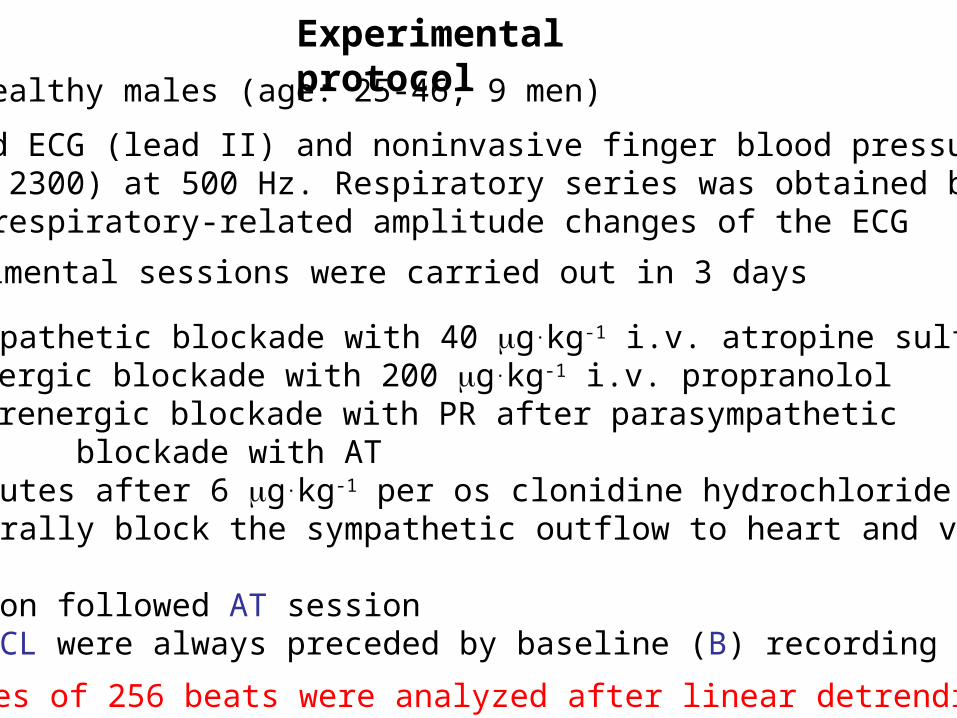
Experimental protocol
9 healthy males (age: 25-46, 9 men)
Experimental sessions were carried out in 3 days
We recorded ECG (lead II) and noninvasive finger blood pressure (Finapress 2300) at 500 Hz. Respiratory series was obtained by assessing respiratory-related amplitude changes of the ECG
AT: parasympathetic blockade with 40 g.kg-1 i.v. atropine sulfate PR: -adrenergic blockade with 200 g.kg-1 i.v. propranololAT+PR: -adrenergic blockade with PR after parasympathetic blockade with ATCL: 120 minutes after 6 g.kg-1 per os clonidine hydrochloride to centrally block the sympathetic outflow to heart and vasculature
AT+PR session followed AT session AT, PR and CL were always preceded by baseline (B) recording
Series of 256 beats were analyzed after linear detrending
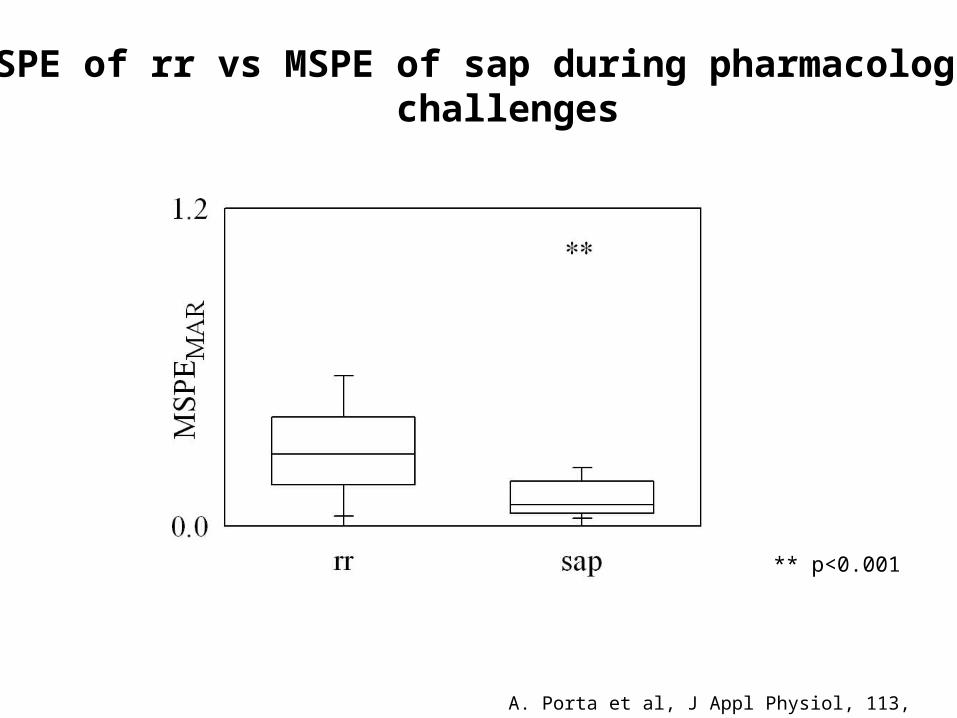
MSPE of rr vs MSPE of sap during pharmacologicalchallenges
** p<0.001
A. Porta et al, J Appl Physiol, 113, 1810-1820, 2012
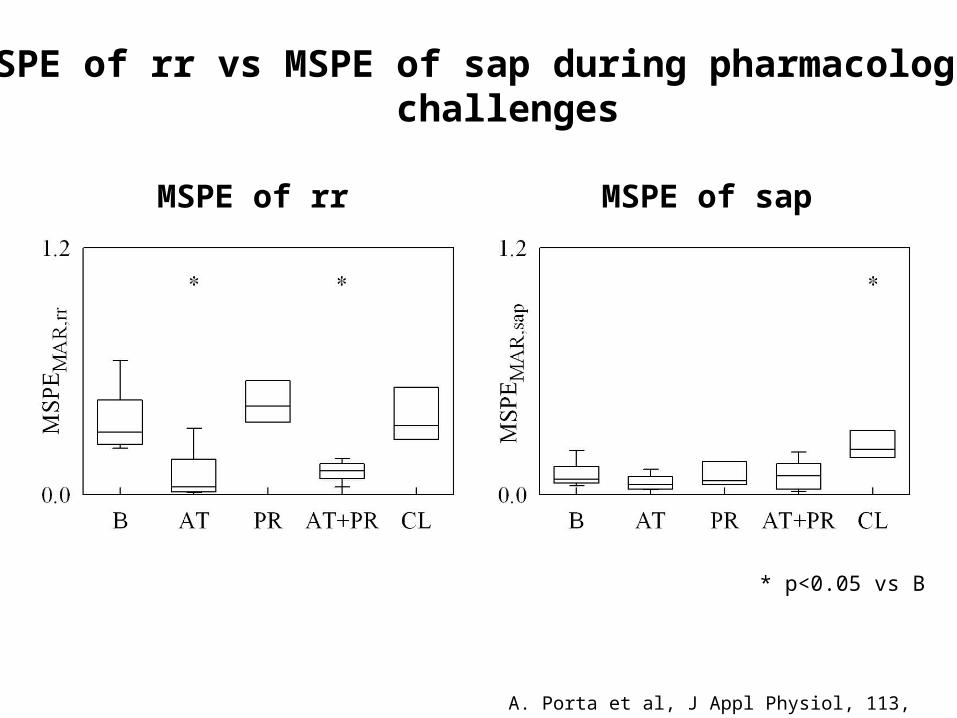
MSPE of rr vs MSPE of sap during pharmacologicalchallenges
MSPE of rr MSPE of sap
A. Porta et al, J Appl Physiol, 113, 1810-1820, 2012
* p<0.05 vs B
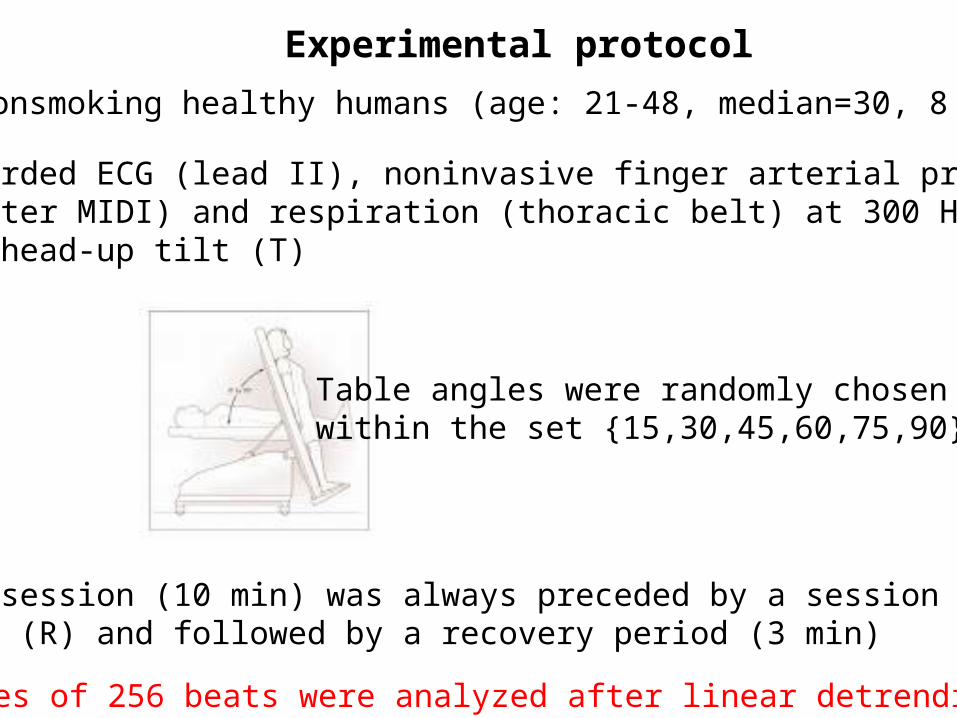
Experimental protocol
19 nonsmoking healthy humans (age: 21-48, median=30, 8 men)
We recorded ECG (lead II), noninvasive finger arterial pressure (Finometer MIDI) and respiration (thoracic belt) at 300 Hzduring head-up tilt (T)
Each T session (10 min) was always preceded by a session (7 min) at rest (R) and followed by a recovery period (3 min)
Table angles were randomly chosen within the set 15,30,45,60,75,90
Series of 256 beats were analyzed after linear detrending

MSPE of rr vs MSPE of sap during graded head-up tilt
** p<0.001
A. Porta et al, J Appl Physiol, 113, 1810-1820, 2012
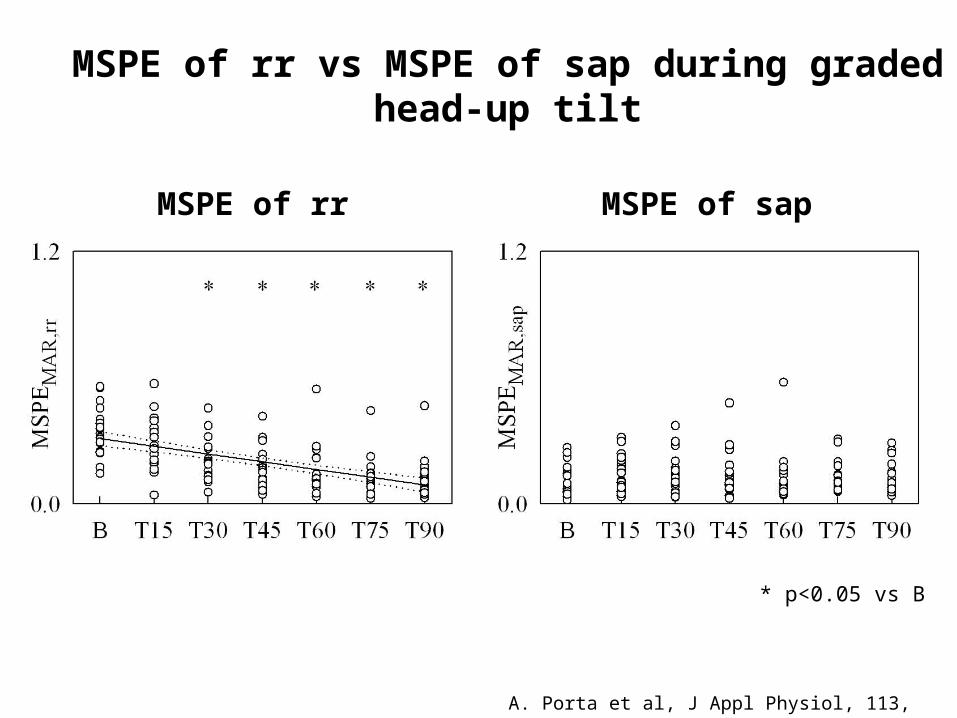
MSPE of rr vs MSPE of sap during gradedhead-up tilt
MSPE of rr MSPE of sap
* p<0.05 vs B
A. Porta et al, J Appl Physiol, 113, 1810-1820, 2012

Experimental protocol
- 12 Parkinson disease (PD) patients without orthostatic hypotension or symptoms of orthostatic intolerance (age: 55-79, median=65, 8 men, Hoehn and Yhar scale=2-4)
- 12 healthy control (HC) subjects (age: 58-72, median=67, 7 men)
We recorded ECG (lead II), noninvasive finger arterial pressure (Finapress 2300) and respiration (thoracic belt) at 300 Hz during 75° head-up tilt (T75)
Each T75 session (10 min) was always preceded by a baseline (B) session (10 min) at rest in supine position
Series of 256 beats were analyzed after linear detrending
MSPE of rr vs MSPE of sap in Parkinsondisease patients
* p<0.05 within population # p<0.05 within series
A. Porta et al, J Appl Physiol, 113, 1810-1820, 2012
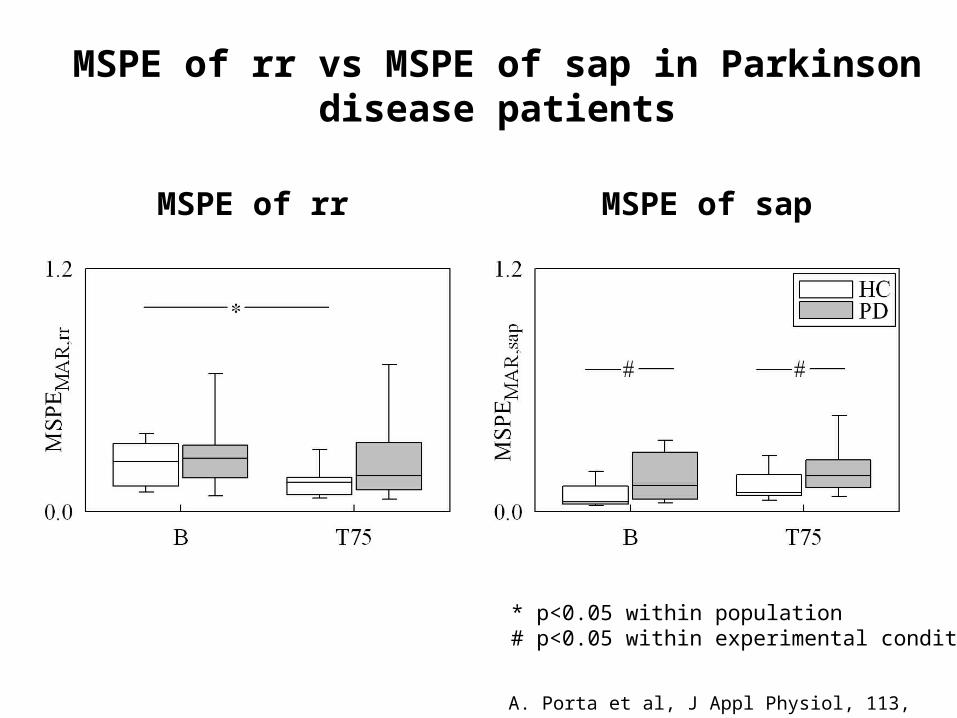
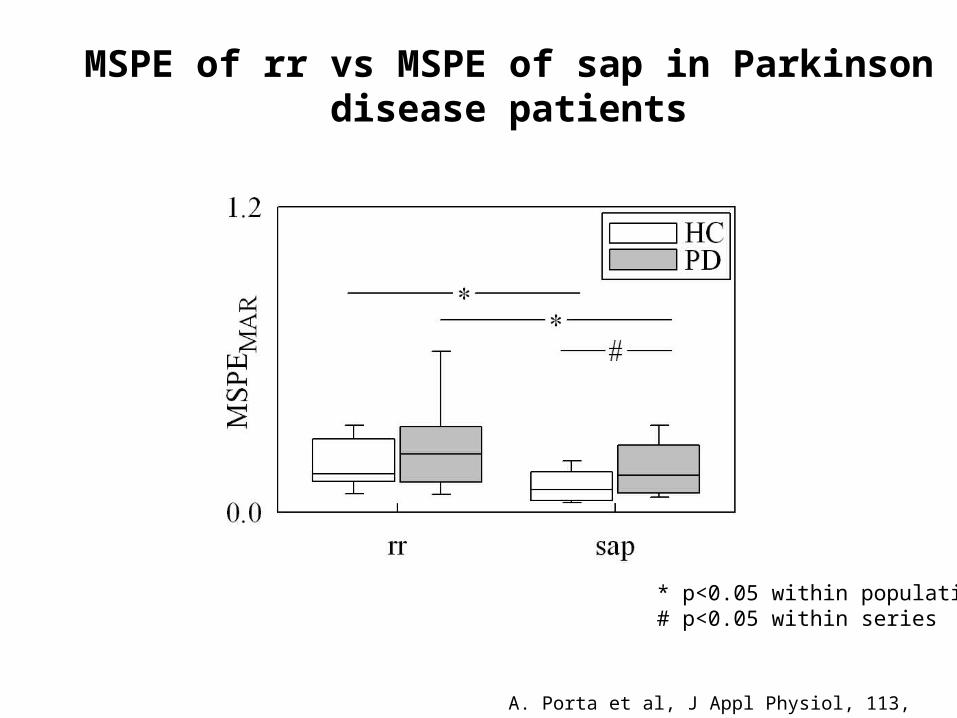
MSPE of rr vs MSPE of sap in Parkinson disease patients
MSPE of rr MSPE of sap
* p<0.05 within population # p<0.05 within experimental condition
A. Porta et al, J Appl Physiol, 113, 1810-1820, 2012
Conclusions (healthy humans)
Complexity of vascular control is smaller than that of cardiac regulation
Vagal activity keeps high the complexity of the cardiac control
Sympathetic activity keeps low the complexity of vascular control
Complexity analyses of cardiac and vascular controls providedifferent information
Conclusions (Parkinson disease patients)
In Parkinson disease patients without orthostatic hypotension or symptoms of orthostatic intolerance the impairment of cardiac control becomes noticeable in response to an orthostatic challenge
In Parkinson disease patients without orthostatic hypotension or symptoms of orthostatic intolerance the impairment of vascular control is noticeable just in baseline condition

Outline
1) Multivariate model-based approach for the assessment of complexity of the cardiovascular system 2) Multivariate model-based approach for the assessment of the contribution of specific mechanisms to the overall complexity in the case of open loop interactions
3) Multivariate model-based approach for the assessment of the contribution of specific mechanisms to the overall complexity in the case of closed loop interactions
4) Granger-causality: a method for the quantification of the contribution of specific mechanisms to the overall complexity

Trivariate open loop model describing heart period variability
Cardiopulmonarypathway
Baroreflex
Pathway modulating RRindependently of SAP and R
A. Porta et al, Am J Physiol, 279, H2558-H2567 , 2000
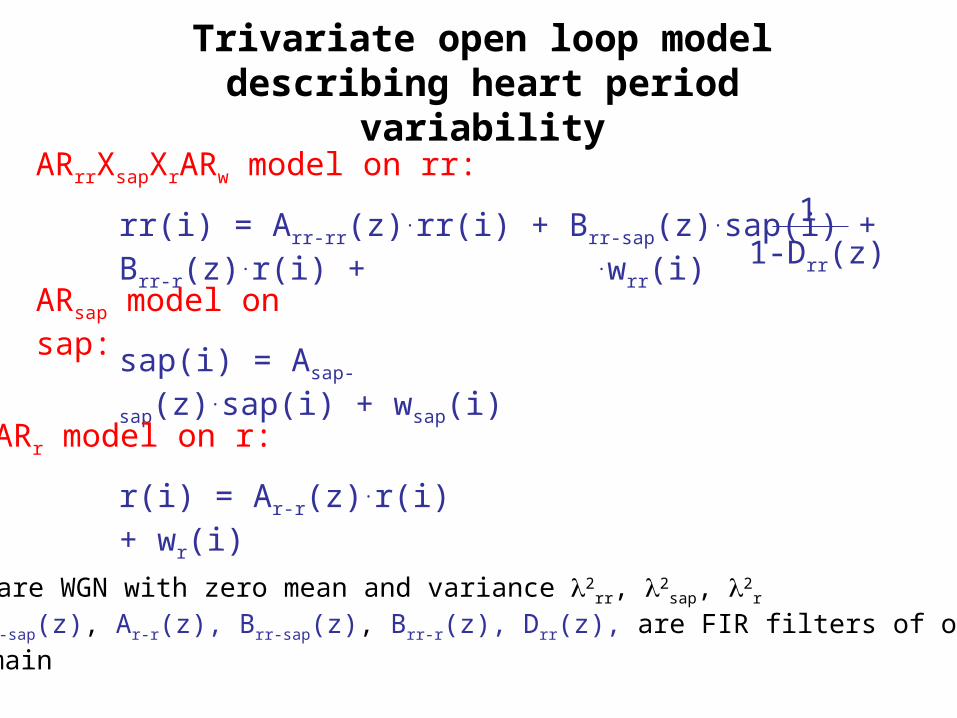
wherewrr, wsap, wr are WGN with zero mean and variance 2
rr, 2sap, 2
r
Arr-rr(z), Asap-sap(z), Ar-r(z), Brr-sap(z), Brr-r(z), Drr(z), are FIR filters of order p in the z-domain
rr(i) = Arr-rr(z).rr(i) + Brr-sap(z).sap(i) + Brr-r(z).r(i) + .wrr(i)1
1-Drr(z)
sap(i) = Asap-sap(z).sap(i) + wsap(i)
r(i) = Ar-r(z).r(i) + wr(i)
ARr model on r:
ARsap model on sap:
ARrrXsapXrARw model on rr:
Trivariate open loop model describing heart period variability

Trivariate open loop model: factorization of heart period variability into partial processes
rr(i)|wsap= . wsap(i)(1-Arr-rr).(1-Asap-sap)
Brr-sap
where
rr(i)|wr= . wr(i)(1-Arr-rr).(1-Ar-r)
Brr-r
rr(i)|wrr= . wrr(i)(1-Arr-rr).(1-Drr)
1
rr(i) = rr(i)|wsap+ rr(i)|wr
+ rr(i)|wrr
baroreflex pathway
cardiopulmonary pathway
Under the hypothesis of uncorrelation among wrr, wsap and wr, the rr series can be factorized as

Trivariate open loop model: heart period variability decomposition
2rr = 2
rr|wsap+ 2
rr|wr + 2
rr|wrr
where
2rr|wsap
is the variance of rr(i)|wsap
2rr|wr
is the variance of rr(i)|wr
2rr|wrr
is the variance of rr(i)|wrr
Under the hypothesis of uncorrelation among wrr, wsap and wr, the variance of rr series can be factorized as

Assessing the contributions of baroreflex and cardiopulmonary pathways to the complexity of heart period variability
Contribution of baroreflex to RR complexity
2rr|wsap
2rr
2rr-sap =
2rr-sap 1
Contribution of cardiopulmonary pathway to RR complexity
2rr|wr
2rr
2rr-r =
2rr-r 1

Baroreflex and cardiopulmonary contributions to the complexity of heart period variability during graded head-up tilt: the open loop trivariate model approach
A. Porta et al, Comput Biol Med, 42, 298-305, 2012
baroreflex contribution cardiopulmonary contribution

Trivariate open loop model describing QT-RR relation
Pathway modulating QTindependently of RR and R
QT-RR relation
QT-R coupling
A. Porta et al, Am J Physiol, 298, H1406-H1414, 2010

Approximation of the QT interval and measurement conventions
The i-th RTe interval follows the i-th RR interval
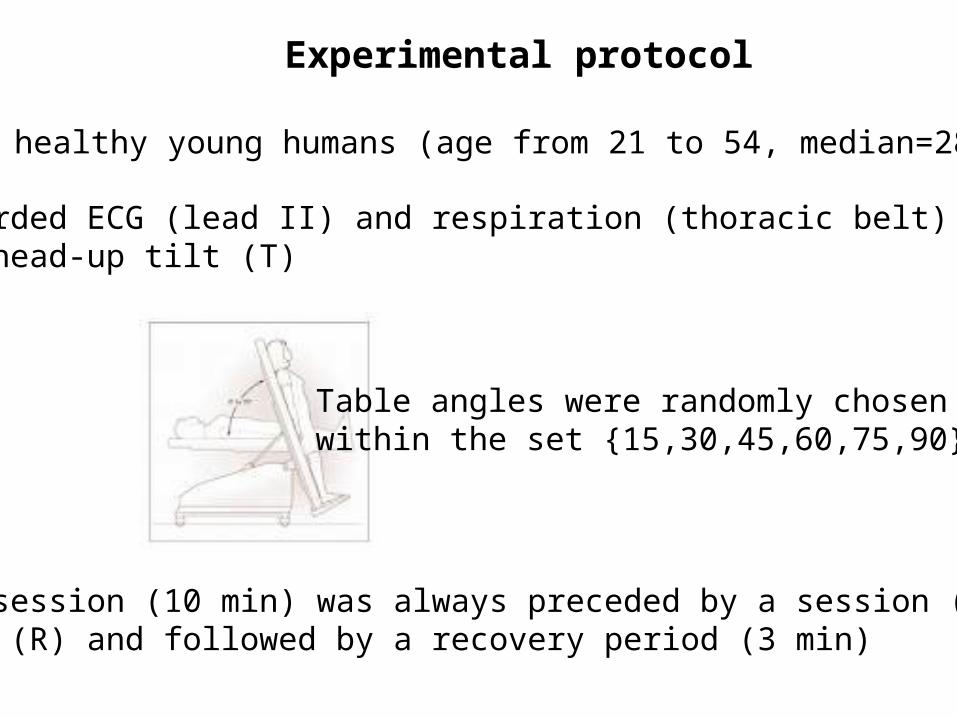
Experimental protocol
17 healthy young humans (age from 21 to 54, median=28)
We recorded ECG (lead II) and respiration (thoracic belt) at 1 kHzduring head-up tilt (T)
Each T session (10 min) was always preceded by a session (7 min) at rest (R) and followed by a recovery period (3 min)
Table angles were randomly chosen within the set 15,30,45,60,75,90
A. Porta et al, Am J Physiol, 298, H1406-H1414, 2010
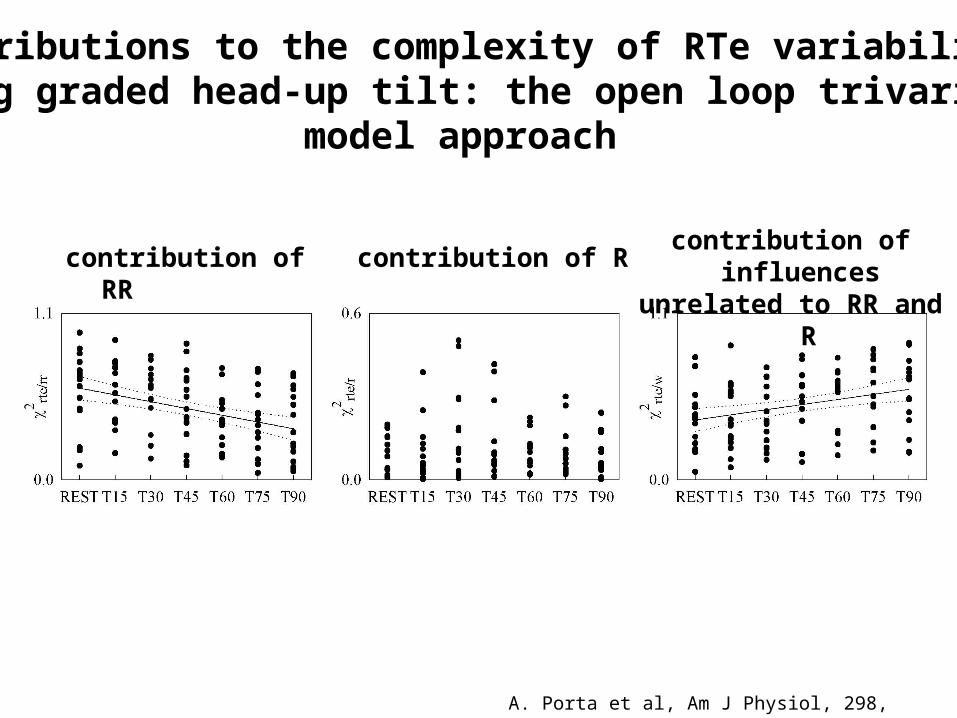
Contributions to the complexity of RTe variability during graded head-up tilt: the open loop trivariate
model approach
contribution of RR contribution of Rcontribution of influences
unrelated to RR and R

Conclusions (open loop model)
The contribution of baroreflex to the complexity of heart period variability gradually increases as a function tilt table angle
The contribution of cardiopulmonary pathway to the complexity of heart period variability gradually decreases as a function of tilt table angle
The contribution of the QT-RR relation to the complexity of QT variability gradually decreases as a function of tilt table angle
The contribution of inputs independent of heart period changes and respiration to the complexity of QT variability gradually increases as a function of tilt table angle
Outline
1) Multivariate model-based approach for the assessment of complexity of the cardiovascular system 2) Multivariate model-based approach for the assessment of the contribution of specific mechanisms to the overall complexity in the case of open loop interactions
3) Multivariate model-based approach for the assessment of the contribution of specific mechanisms to the overall complexity in the case of closed loop interactions
4) Granger-causality: a method for the quantification of the contribution of specific mechanisms to the overall complexity
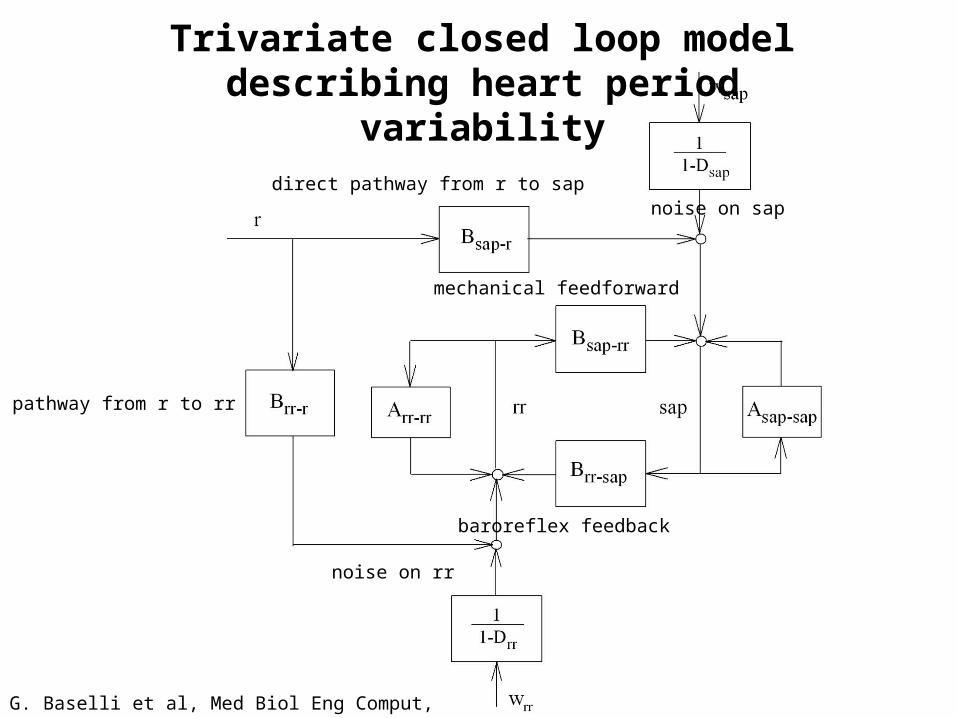
Trivariate closed loop model describing heart period variability
G. Baselli et al, Med Biol Eng Comput, 32, 143-152, 1994
baroreflex feedback
mechanical feedforward
direct pathway from r to sap
direct pathway from r to rr
noise on sap
noise on rr

r(i) = Ar-r(z).r(i) + wr(i)
ARr model on r:
ARrrXsapXrARw model on rr:
ARsapXrrXrARw model on sap:
sap(i) = Asap-sap(z).sap(i) + Bsap-rr(z).rr(i) + Bsap-r(z).r(i) + .wsap(i)1
1-Dsap(z)
rr(i) = Arr-rr(z).rr(i) + Brr-sap(z).sap(i) + Brr-r(z).r(i) + .wrr(i)1
1-Drr(z)
wherewrr, wsap, wr are WGN with zero mean and variance 2
rr, 2sap, 2
r
Arr-rr(z), Asap-sap(z), Ar-r(z), Brr-sap(z), Brr-r(z), Bsap-rr(z), Bsap-r(z), Drr(z), Dsap(z) are FIR filter of order p in the z-domain
Trivariate closed loop model describing heart period variability

rr(i) = rr(i)|wsap+ rr(i)|wr
+ rr(i)|wrr
rr(i)|wsap = . wsap(i)loop
.(1-Dsap)
Brr-sap
where
rr(i)|wr = . wr(i)loop
.(1-Ar-r)
Brr-sap.Bsap-r+Brr-r
.(1-Asap-sap)
rr(i)|wrr = . wrr(i)loop
.(1-Drr)
1-Asap-sap
with loop=(1-Arr-rr).(1-Asap-sap)-Arr-sap.Asap-rr
baroreflex pathway
cardiopulmonary pathway
Trivariate closed loop model: factorization of heart period variability into partial processes
Under the hypothesis of uncorrelation among wrr, wsap and wr, the rr series can be factorized as

Trivariate closed loop model: heart period variability decomposition
2rr = 2
rr|wsap+ 2
rr|wr + 2
rr|wrr
where
2rr|wsap
is the variance of rr(i)|wsap
2rr|wr
is the variance of rr(i)|wr
2rr|wrr
is the variance of rr(i)|wrr
Under the hypothesis of uncorrelation among wrr, wsap and wr, the variance of rr series can be factorized as

Assessing the contributions of baroreflex and cardiopulmonary pathways to the complexity of heart period variability
Contribution of baroreflex to RR complexity
2rr|wsap
2rr
2rr-sap =
2rr-sap 1
Contribution of cardiopulmonary pathway to RR complexity
2rr|wr
2rr
2rr-r =
2rr-r 1

A. Porta et al, Comput Biol Med, 42, 298-305, 2012
Baroreflex and cardiopulmonary contributions to the complexity of heart period variability during graded
head-up tilt: the closed loop trivariate model approach
baroreflex contribution cardiopulmonary contribution

A. Porta et al, Comput Biol Med, 42, 298-305, 2012
Decomposition of cardiopulmonary contributions to the complexity of heart period variability during graded
head-up tilt: the closed loop trivariate model approach
cardiopulmonary contribution mediated by SAP
direct cardiopulmonary contribution

Conclusions (closed loop model)
The contribution of baroreflex to the complexity of heart period variability gradually increases as a function tilt table angle
The contribution of cardiopulmonary pathway to the complexity of heart period variability was unaffected by the orthostatic challenge
The contribution of cardiopulmonary pathway to the complexity of heart period variability can be decomposed into two terms, related to direct link from respiration to heart period and to indirect link mediated by systolic arterial pressure changes
The direct contribution of cardiopulmonary pathway to the complexity of heart period variability decreases, while the indirect one increases with tilt table angles
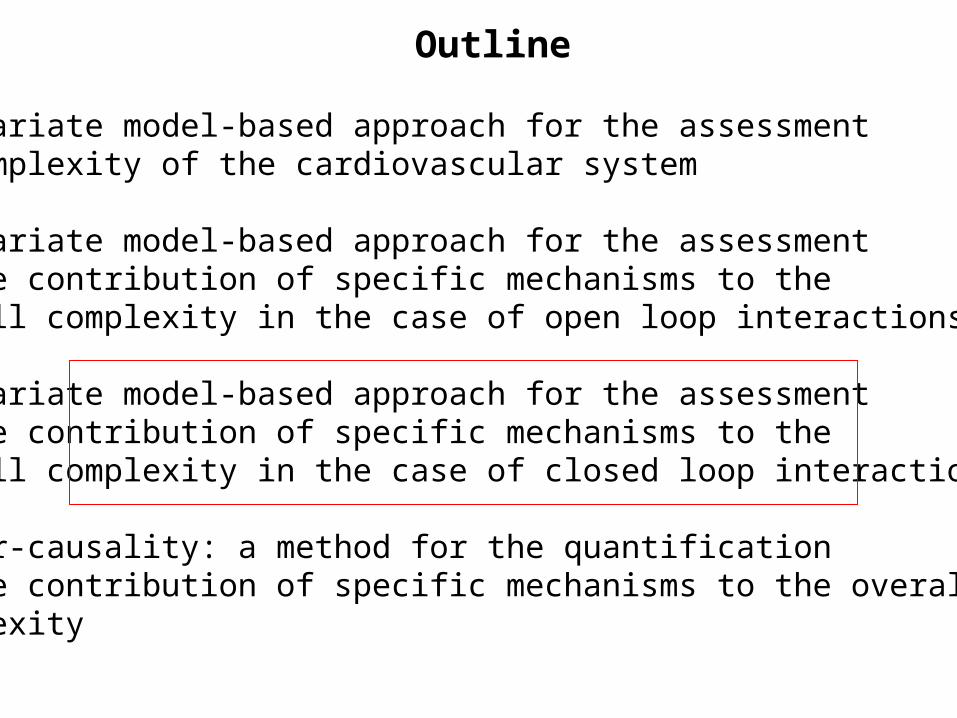
Outline
1) Multivariate model-based approach for the assessment of complexity of the cardiovascular system 2) Multivariate model-based approach for the assessment of the contribution of specific mechanisms to the overall complexity in the case of open loop interactions
3) Multivariate model-based approach for the assessment of the contribution of specific mechanisms to the overall complexity in the case of closed loop interactions
4) Granger-causality: a method for the quantification of the contribution of specific mechanisms to the overall complexity

Granger causality: definition
Given Ω = x1, …, xi, …, xM the set formed by M signals with xi = xi(n), n=1, …, N
xj is said to Granger-cause xi if xi is better predicted in Ω than in Ω after excluding xj (i.e. Ω-xj)
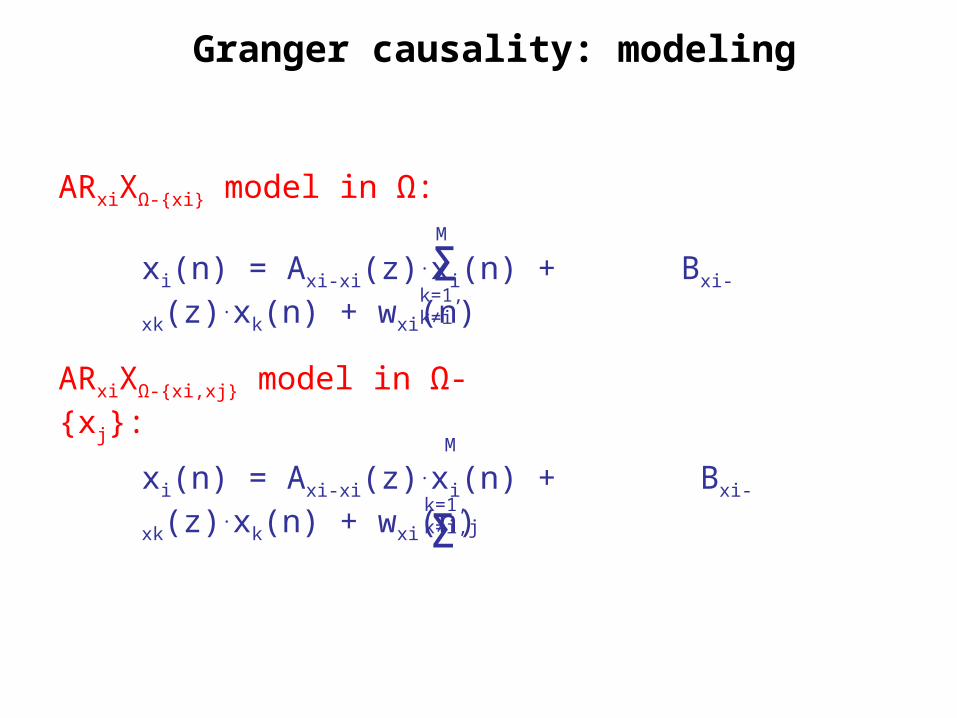
Granger causality: modeling
ARxiXΩ-xi model in Ω:
ARxiXΩ-xi,xj model in Ω-xj:
xi(n) = Axi-xi(z).xi(n) + Bxi-xk(z).xk(n) + wxi(n)k=1, k≠i
M
Σ
xi(n) = Axi-xi(z).xi(n) + Bxi-xk(z).xk(n) + wxi(n)k=1, k≠i,j
M
Σ
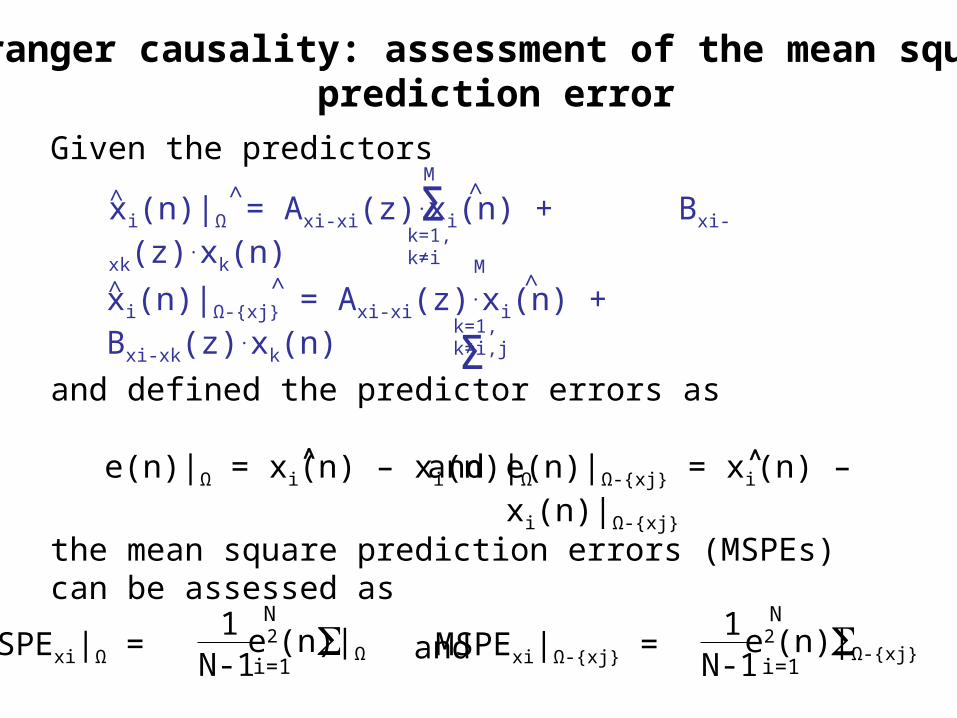
Granger causality: assessment of the mean squareprediction error
Given the predictors
xi(n)|Ω = Axi-xi(z).xi(n) + Bxi-xk(z).xk(n) k=1, k≠i
M
Σ ^ ^ ^
xi(n)|Ω-xj = Axi-xi(z).xi(n) + Bxi-xk(z).xk(n) k=1, k≠i,j
M
Σ
^ ^ ^
and defined the predictor errors as
the mean square prediction errors (MSPEs) can be assessed as
e(n)|Ω = xi(n) – xi(n)|Ω
MSPExi|Ω = 1
N-1 i=1
N
e2(n)|Ω
e(n)|Ω-xj = xi(n) – xi(n)|Ω-xj
and
and MSPExi|Ω-xj = 1
N-1 i=1
N
e2(n)|Ω-xj
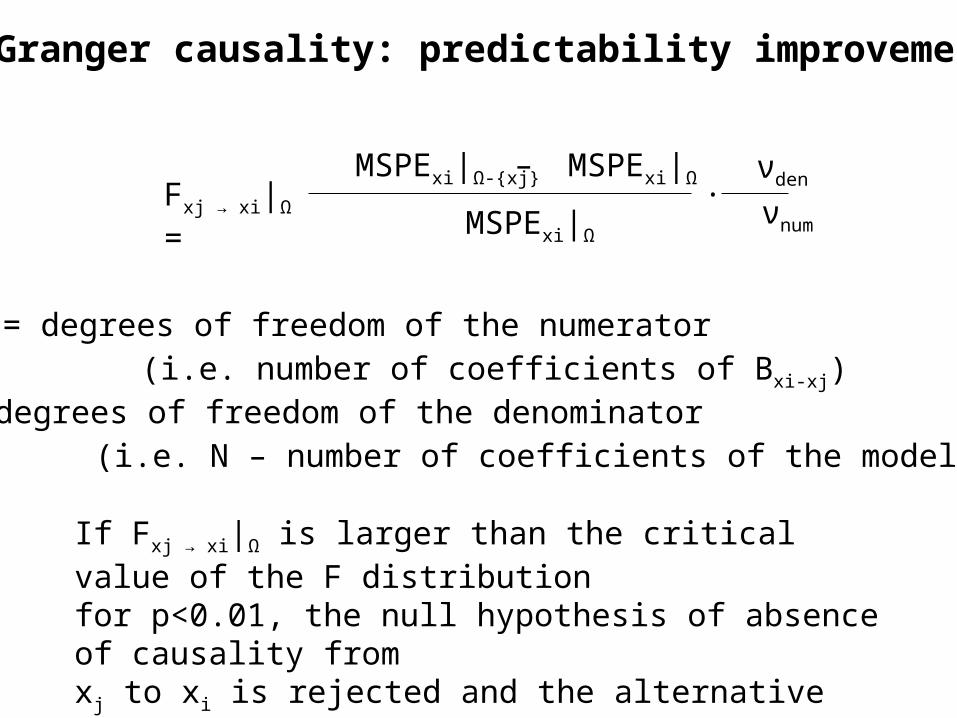
Granger causality: predictability improvement
Fxj → xi|Ω =– MSPExi|Ω MSPExi|Ω-xj
MSPExi|Ω νnum
νden.
νnum = degrees of freedom of the numerator (i.e. number of coefficients of Bxi-xj) νden = degrees of freedom of the denominator (i.e. N – number of coefficients of the model ARxiX|Ω-xi)
If Fxj → xi|Ω is larger than the critical value of the F distribution for p<0.01, the null hypothesis of absence of causality fromxj to xi is rejected and the alternative hypothesis, xj → xi, is accepted
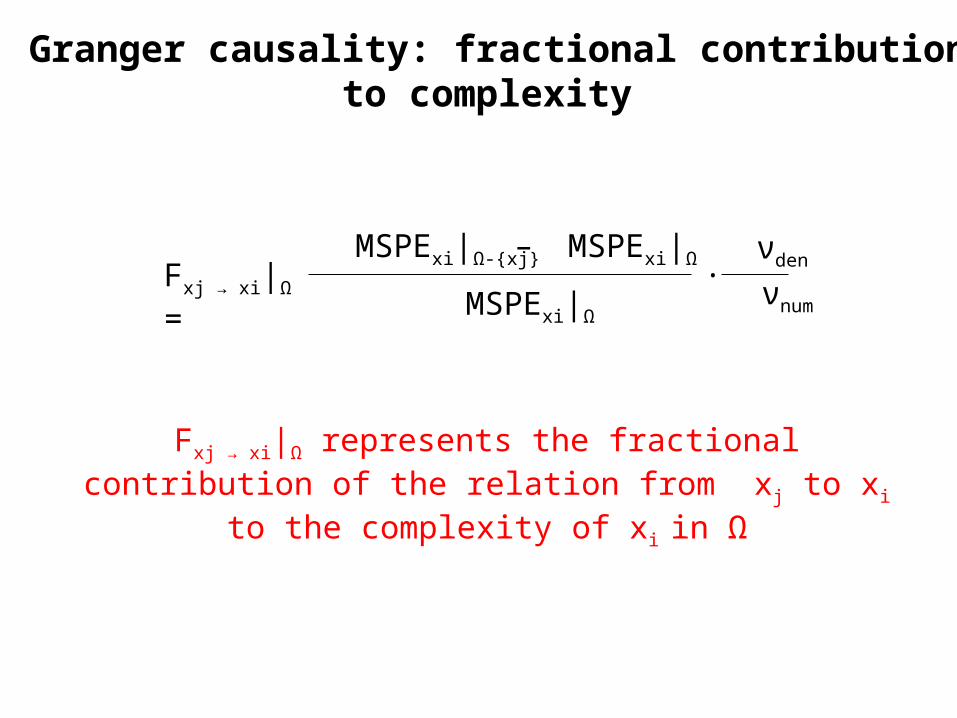
Fxj → xi|Ω represents the fractional contribution of the relation from xj to xi to the complexity of xi in Ω
Granger causality: fractional contributionto complexity
Fxj → xi|Ω =– MSPExi|Ω MSPExi|Ω-xj
MSPExi|Ω νnum
νden.
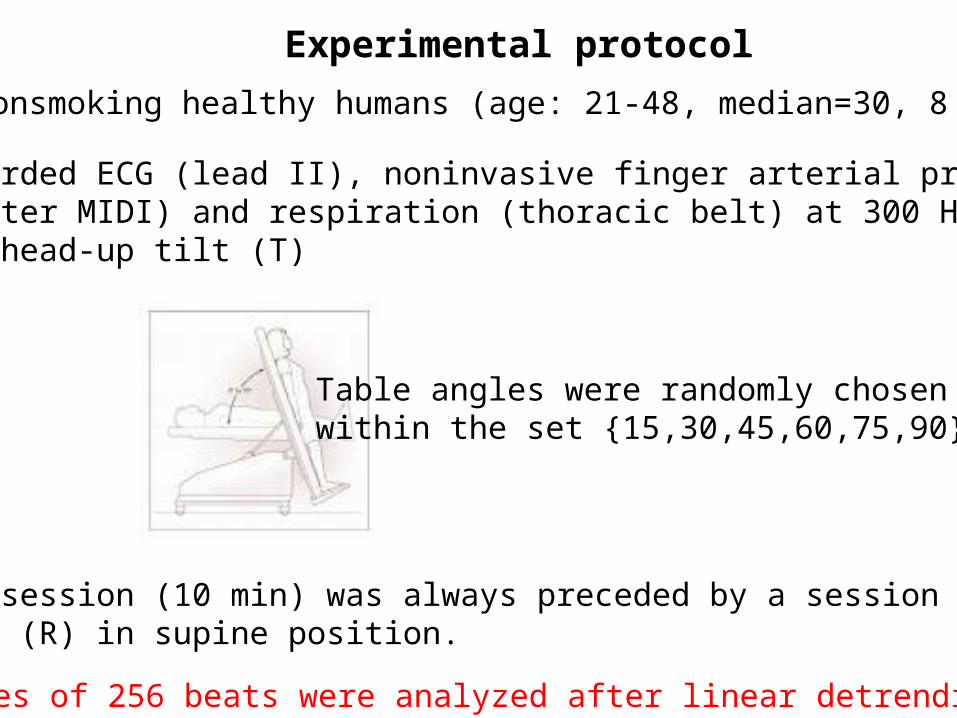
Experimental protocol
19 nonsmoking healthy humans (age: 21-48, median=30, 8 men)
We recorded ECG (lead II), noninvasive finger arterial pressure (Finometer MIDI) and respiration (thoracic belt) at 300 Hzduring head-up tilt (T)
Each T session (10 min) was always preceded by a session (7 min) at rest (R) in supine position.
Table angles were randomly chosen within the set 15,30,45,60,75,90
Series of 256 beats were analyzed after linear detrending

Granger causality: fractional contributionto complexity of heart period variability
Given Ω=rr, sap, r
A. Porta et al, In: “Methods in brain connectivity inference through multivariate time series analysis”, CRC Press, Chapter 15 , in press

Conclusions
Complexity of the cardiovascular control can be assessedthrough a multivariate model-based approach
This approach is particularly helpful to asses the contributionsto complexity of physiological variables given the presence ofcausal relations with others
Since this approach assesses the interactions between variables in specific time directions (e.g. along baroreflex), it allowsthe characterization of specific relations among variables