albert 2004
TRANSCRIPT

8/9/2019 Albert 2004
http://slidepdf.com/reader/full/albert-2004 1/11
400 Commonwealth Drive, Warrendale, PA 15096-0001 U.S.A. Tel: (724) 776-4841 Fax: (724) 776-5760 Web: www.sae.or
SAE 2004-32-0029
JSAE 20044316
Residual Gas Measurements in a Utility Engine
B. P. Albert and J. B. GhandhEngine Research Center, University of Wisconsin-Madison
2004 Small Engine Technology ConferenceGraz, Austria
September 27-30, 2004

8/9/2019 Albert 2004
http://slidepdf.com/reader/full/albert-2004 2/11
All rights reserved. No part of this publication may be reproduced, stored in a retrieval system, or
transmitted, in any form or by any means, electronic, mechanical, photocopying, recording, or otherwise,without the prior written permission of SAE.
For permission and licensing requests contact:
SAE Permissions400 Commonwealth Drive
Warrendale, PA 15096-0001-USAEmail: [email protected]: 724-772-4028
Tel: 724-772-4891
For multiple print copies contact:
SAE Customer ServiceTel: 877-606-7323 (inside USA and Canada)
Tel: 724-776-4970 (outside USA)Fax: 724-776-1615
Email: [email protected]
Copyright © 2004 SAE International
Copyright © 2004 Society of Automotive Engineers of Japan, Inc.
Positions and opinions advanced in this paper are those of the author(s) and not necessarily those of SAE.The author is solely responsible for the content of the paper.
Printed in USA

8/9/2019 Albert 2004
http://slidepdf.com/reader/full/albert-2004 3/11
ABSTRACT
The residual gas fraction was measured in an air-cooledsingle-cylinder utility engine by directly sampling thetrapped cylinder charge during a programmed misfire.Tests were performed for a range of fuel mixturepreparation systems, cam timings, ignition timings,engine speeds and engine loads. The residual fractionwas found to be relatively insensitive to the fuel mixturepreparation system, but was, to a moderate degree,sensitive to the ignition timing. The residual fraction wasfound to be strongly affected by the amount of valveoverlap and engine speed. The effects of engine speedand ignition timing were, in part, due to the in-cylinderconditions at EVO, with lower temperatures favoringhigher residual fractions. The data were compared toexisting literature models, all of which were found to belacking. The effect of the threshold value used to definelift was investigated, and a modified form of the Yun andMirsky correlation, which was relatively insensitive to lift
threshold, was proposed.
INTRODUCTION
Small engine applications often demand engine designsthat emphasize power, which is governed by theengine’s ability to breathe at wide-open throttle (WOT).Thus, small engines are equipped with cams designedto ensure maximum charging efficiency at WOT. Theresulting valve lift, phasing, and timing of highperformance cam profiles correspond to poor engineperformance at low speeds and light loads, whichmanifests itself in poor combustion stability and high
pollutant emissions. The poor performance at lowspeeds and light loads can, in part, be attributed to thepresence of high levels of exhaust gas residuals (EGR)trapped in the cylinder. It is important to understandhow EGR affects the combustion process and pollutantemissions during light load operation since residual-tolerant cam designs could help improve the combustionprocess and resulting emissions from small engines.
Previous research has documented how EGR affectscombustion stability and pollutant emissions, however,the majority of past research has been conducted on
automotive engines [1]. Small engine intakecomponents and geometries are considerably differenthan automotive engine intake systems. Automotiveapplications typically have an intake plenumdownstream of the throttle from which individual intakerunners feed each cylinder. Small engine intakesystems do not incorporate a “large” intake plenum. Inaddition, the throttle on small engines is typicallymounted directly to the intake runner, as close as 10 cmfrom the intake valve. This introduces variations inintake fluid flow, flow control, and overall in-cylindecharge mixing.
At part load operation the intake plenum on large multi-cylinder engines is at a known vacuum. The vacuum othe intake plenum in relation to the barometric pressureof the engine exhaust produces a known pressuregradient. The pressure gradient acts as the primarydriver to backflow exhaust gases from the exhausrunner back into the cylinder and intake runners. The
only intake component on a small engine that realizes avacuum is the intake runner. The relatively smalvolume of the intake runner on a small engine negatessome of the potential for exhaust to backflow into theintake system. This may introduce some variation inregards to controlling trapped EGR, relative to the betteunderstood control of trapped EGR in automotiveapplications. It is of interest to understand how well thevariables used to predict trapped EGR in automotiveengines work with small engines.
The objective of this paper is to investigate the effect ovalve timing on trapped residual fraction in a small utility
engine, and to assess how residual gas fraction modelsformulated from automotive engine data fare for smalengines. The three models used for comparativeanalysis include: Yun and Mirsky [2], Fox, Cheng andHeywood [3], and an ideal gas model. An in-cylindesampling valve was used to directly measure theresidual fraction in engine equipped with an adjustablecam. Steady-state emission measurements of nitrogenoxides (NOx), unburned hydrocarbons (uHC), carbonmonoxide (CO), carbon dioxide (CO2), and oxygen (O2
were made for each test condition. In additionmeasurement of the in-cylinder CO2 concentration wasperformed to determine the residual fraction. Finally
Residual Gas Measurements in a Utility Engine
Engine Research Center, University of Wisconsin-Madison
Copyright © 2004 SAE International and Copyright © 2004 Society of Automotive Engineers of Japan, Inc.
B. P. Albert and J. B. Ghandhi
2004-32-0029 / 20044316

8/9/2019 Albert 2004
http://slidepdf.com/reader/full/albert-2004 4/11
different fuel mixture preparation systems and sparktimings were tested to investigate how combustionprogress and charge mixedness influence EGR.
EXPERIMENTAL APPARATUS
ENGINE
The test engine used was a Briggs and Stratton Intek
engine (Model 110600). This is an air-cooled, single-cylinder, four-stroke, vertical shaft, overhead valveengine that is rated at 4.8 kW. The engine specificationsare listed in Table 1.
Table 1 Engine Specifications
Bore 68.26 mm 2.6875 in
Stroke 46.00 mm 1.7969 in
Connecting Rod Length 88.57 mm 3.487 in
Displacement 167.4 cm3 11.58 in
3
Compression Ratio 7.0:1
The engine used for this experiment was equipped withan adjustable cam that allowed the opening and closingtiming of the cam lobes to be varied via an access panelon the side of the engine. The production cam lobeswere split in half, giving two halves each having thestock cam profile, that butterfly apart to vary the timing
and overall duration. Each lobe was limited to 60 ofadvance or retard. Rotating the lobes clockwise orcounter-clockwise retards or advances the camtiming/phasing relative to the stock design.
The engine head for this study was modified toaccommodate an in-cylinder pressure transducer andthe sampling valve. The sampling valve was installed inthe stock spark plug location. The engine head wasmodified to allow a new spark plug location. Due tospace constraints a Champion RDJ7Y spark plug wasused in place of the standard Champion RC12YC sparkplug. A spark gap of 0.76 mm was used for all tests.Tests were performed on the engine to compare theperformance of the new spark plug and its locationrelative to the production plug and location. Ignitiontiming and energy were held constant. The engine
suffered poorer performance at WOT with the new sparkplug and location, however, all part-load conditionstested produced similar performance for both plugs.Since the scope of this project was to investigate theeffect of EGR at part-load conditions, the new spark plugand location was used for all tests in order toaccommodate the sampling valve.
Engine speed and load were controlled by a DC electricdynamometer. Combustion air to the engine wasdelivered from compressed, dried shop air that wasregulated and filtered. The airflow rate was measuredwith a Merriam laminar flow element (LFE) (model
50MH10). The test fuel was an EPA Tier II EEE fuesupplied by Haltermann Products. Air-to-fuel ratios(AFR) were measured with a wideband AFR analyze(Horiba model MEXA-110). In addition, a Horibaemissions console measured the dry concentration oNOx, uHC, CO, CO2, and O2. Both the AFR analyzeand exhaust concentration measurements were used tocalculate fuel flow from the measured air flow.
Engine events and parameters were controlled using aMotoTron engine control system. The MotoTron enginecontrol system was comprised of a Motorola PCM0312Mengine control unit (ECU), MotoTune version 8.4.2.5software, and a RS232 communications cable. Theengine control system allowed for full control of theengine events and parameters. For the scope of thisproject, it was used for fuel injection timing and durationair injection timing and duration (using the air-assist fueinjection, see below), ignition timing and energy, and toactivate the in-cylinder sampling valve.
The cylinder pressure was measured with a Kistler 6061piezoelectric transducer coupled with a Kistler 5010
charge amplifier. The entire system was calibratedusing a dead-weight tester. The intake port pressurewas measured downstream of the throttle using anOmega PX303-200A5V absolute pressure transducerThe intake port pressure was used to peg the cylindepressure at BDC of the intake/compression stroke. Theratio of the intake runner volume to displaced volumewas 0.21.
FUEL SYSTEMS
Three different fuel mixture preparation systems wereinvestigated. The objective of the different fueling
strategies was to investigate how in-cylinder fuedistribution affects the amount of trapped EGR. Thedifferent fuel systems were a carburetor, a carburetormounted liquid fuel injection system (CMLFI), and ahomogeneous mixture system (HMS). All three fuesystems were supplied by the same fuel system.
The first mixture preparation system was a modifiedstock carburetor. The main jet was replaced with amodified jet that incorporated a needle valve for fuel flowcontrol. The carburetor had an idle bypass circuit toallow operation at low loads; however, the idle bypasshad no flow control. The idle bypass circuit therefore
controlled the AFR at highly throttled conditions. As aresult, AFRs were typically lean of stoichiometric whenthe idle bypass was fueling the engine.
The second mixture preparation system investigatedwas a carburetor-mounted liquid fuel injector (CMLFI)The objective of the CMLFI system was to mimiccarburetor fuel delivery, but with the precise meteringcapabilities of a fuel injector. The CMLFI wasconstructed from a carburetor body and a four-holeautomotive-type fuel injector. The fuel injector was ratedat 8.62 kg/hr at 241 kPa gage fuel pressure. The floabowl, float, float needle valve, and spring retaining

8/9/2019 Albert 2004
http://slidepdf.com/reader/full/albert-2004 5/11
system of the stock carburetor were all removed toinstall the injector, and all air bleed holes in thecarburetor were sealed with high temperature epoxy. Aretaining bracket was constructed to hold the fuelinjector in place and supply fuel to the fuel injectororifice. The retaining bracket also integrated a siphontube that replaced the emulsion tube of the stockcarburetor. The siphon tube was approximately 20 mmin length with a residence volume of 38 mm
3. The
retaining bracket/siphon tube was mounted to thecarburetor throttle body. By mounting the fuel injector tothe throttle body of the carburetor via a siphon tube, fueldelivery similar to the stock carburetor has beenobserved [4].
Control of the fuel injector timing and pulse width wasaccomplished via the engine control system. The fuelinjector timing and duration was calibrated to occurcentered on the intake stroke, at the time of maximumpiston speed. The injection duration was limited to 120crank angle degrees by adjusting the fuel pressure (34.5
– 103.4 kPa gage) in order to maintain a fuel flow eventsimilar to a stock carburetor.
The third mixture preparation system investigated was ahomogeneous mixture system (HMS). The objective ofthe HMS was to produce a completely vaporized, wellmixed mixture of air and fuel in order to ensure therewas no fuel/air stratification of the intake charge. Ahomogeneous prevaporized mixture was achieved byusing an Orbital air-assist direct in-cylinder injector toinject a well atomized spray approximately one meterupstream of the throttle. The air-assist injector wasdirected upstream into the air stream at a 45° angle.The fuel-air mixture then entered a chamber that wasexternally heated to promote vaporization. A similar
system has been found to produce excellent results inoptical studies [5]. The air injector duration and the fuel-air delay (FAD) were maintained at 3 and 4 ms,respectively. The fuel injector controlled the mass offuel delivered. An intake charge temperature (measured
just upstream of the throttle) of 52 °C was found to besufficient to ensure complete vaporization. This intaketemperature was, therefore, used for all of the mixturesystems tested for consistency.
SAMPLING VALVE SYSTEM
An in-cylinder sampling valve (SV) was used to acquire
a sample of the trapped cylinder contents during firedoperation. The SV was designed to capture a samplelarge enough to be representative of the in-cylindercontents. The complete characterization of the SV canbe seen in [6, 7]. The SV was a poppet-style, solenoid-actuated valve, constructed primarily from stainless steelto reduce heat transfer to the solenoid. The SV installsinto a 14 mm spark plug hole and has a 10 mm diameterpoppet. The maximum lift of the poppet was limited to 1mm due to the flow restriction within the valve body. AKaman Instruments model 0.5U displacement sensorwas mounted to the SV to monitor the poppet lift. The
sensor range was only 0.5 mm, therefore, it was onlyused to determine valve opening and closing times.
The SV actuator was a Ledex-Dormeyer model 5SF-2Xlow-profile linear solenoid. The engine control systemwas programmed to actuate the SV during thecompression stroke of a programmed misfire. Theprogram would inhibit the spark while simultaneouslyactivating the SV. The number of fired cycles betweenthe sampled cycles was user adjustable. In this studythere were 15 and 10 fired cycles between sampledcycles for wide open throttle (WOT) and part loadoperation, respectively. The opening time and durationwere adjusted for each running condition to maximizethe sample flow through the CO2 analyzer.
A soap-bubble leak test was performed on the SV duringengine operation to assess the sealing of the valve seatThe maximum speed (3060 RPM) and load (100%operating condition, which was considered to be theworst case for leaks, was tested. The measured leakflow rate was less than 2% of the sample flow rate, andwas deemed to be sufficient.
ENGINE OPERATING CONDITIONS
The engine was tested over a wide range of operatingconditions, see Table 2. Three speeds (3060, 17501200 RPM), and three loads (WOT, 25, 10%) weretested. For each speed/load condition, four valveoverlap periods were tested (0, 50, 90, 130 degrees)and they are discussed more fully below. All three fuedistribution strategies (carburetor, CMLFI, HMS) weretested for each speed/load/valve timing condition. Thepart load values were referenced to a maximum loadcondition, which was defined as: 3060 RPM, WOT, AFR
of 12.5:1, carburetor fuel delivery, no intake air heatingand an intake surge tank pressure at standard pressure(101.3 kPa). The following conditions were heldconstant for all operating conditions: AFR of 12.5:1intake surge tank pressure at standard pressure (101.3kPa), intake air temperature of 52 °C, and exhaust surgetank pressure at 1 bar (100.0 kPa).
Table 2 Operating Conditions
Ignition Fixed / Optimized
Cam Zero / Stock / Intermediate / Max
Fuel System Carburetor / CMLFI / HMS
Speeds (RPM) 3060 1750 / 1200
Load (%) 100 25 10 25 10
The production version of this engine has a fixed ignitiontiming of 19 °BTDC. In this study tests were performedfor both the production ignition timing and an optimizedignition timing for each operating condition. The ignitiontiming for a given operating condition was optimized bymaximizing the load for a given engine speed andthrottle position, then re-adjusting the throttle with fixed

8/9/2019 Albert 2004
http://slidepdf.com/reader/full/albert-2004 6/11
ignition timing to achieve the targeted load. Table 2summarizes all of the operating conditions for this study.
The four cam timings tested will be termed the zero,stock, intermediate, and maximum cases, respectively,which refers to the amount of valve overlap. Table 3summarizes the resulting cam events for each case,where a valve lift of 0.25 mm (0.010 in) was chosen asthe reference value for determining the opening andclosing events. For this study, the valve overlap periodwas symmetrically adjusted; for a given amount exhaustvalve close (EVC) advance there was an equal amountof intake valve open (IVO) retard. The exhaust valveopen (EVO) and intake valve close (IVC) timings weremaintained constant for all cases with the exception ofthe zero overlap case. Due to the design of theadjustable cam, in order to achieve zero degrees ofoverlap the exhaust cam lobe was slightly retarded andintake cam lobe was slightly advanced. The full liftprofiles for the four cases can be seen in Fig. 1.
The WOT performance varied significantly with the camtiming. The indicated mean effective pressures at 3060
RPM and WOT condition were 562, 740, 732, and 679kPa for the zero, stock, intermediate and maximumtimings, respectively.
RESIDUAL GAS ANALYSIS
RESIDUAL GAS FRACTION
The residual gas mole fraction, x r , can be determinedfrom the ratio of the mole fraction of CO2 in the
compressed charge,2 ,CO cc x , to the mole fraction of CO2
in the raw engine-out exhaust,2 ,CO exh x via
2
2
,
,
CO cc
r
CO exh
x x
x (1)
where the compressed charge includes the inducted airand fuel plus the trapped exhaust gas, and correspondsto the sample that was acquired by the SV. The molefractions of CO2 in the compressed charge and exhaustwere determined from the measured concentrations ofCO2 in the compressed charge and exhaust. Since theNDIR used to measure the CO2 concentration requiredthe measurements be performed on a “dry” basis, both
concentrations were corrected by a dry-to-wet factorThe dry-to-wet factor for the exhaust measurement, K exh
was determined from the 5-gas emission measurementsin the standard method [6], but the dry-to-wet factor forthe compressed charge, K cc , had to be evaluated basedon K exh and equation (1) since CO2 was the only gasconstituent measured in the compressed charge. Thecompressed charge dry-to-wet factor is then
1
1EXH r
CC
r
K x K x
(2
The derivation for equation (2) can be seen in Appendix A. Under the standard assumption that the moleculaweight of the trapped and exhaust mixtures are thesame, the residual mole fraction is equivalent to theresidual mass fraction, y r .
RESIDUAL GAS FRACTION MODELS
The three residual gas fraction models investigated forcomparative analysis relative to the measured EGR
included: Yun and Mirsky [2], Fox, Cheng and Heywood[3], and an ideal gas model.
The Yun and Mirsky correlation for estimating thetrapped residual fraction is
1
enEVC EVC EVC EVC
r
EVO EVO EVO EVO
V P V y
V P V (3
Table 3 Cam timings tested. All crank angle values arereferenced to TDC of the compression stroke.
Case IVO IVC EVO EVC
OF
[/m]
Zero 358 629 79 361 0.11
Stock 335 602 106 385 3.66
Int. 311 602 106 406 12.31
Max 297 602 106 425 27.26
6
4
2
0
L i f t ( m m )
7203600
CA (deg)
Ex In 6
4
2
0
7203600
CA (deg)
Ex In
6
4
2
0
L i f t ( m m
)
7203600
CA (deg)
Ex In6
4
2
0
7203600
CA (deg)
Ex In
Figure 1 Cam profiles investigated.

8/9/2019 Albert 2004
http://slidepdf.com/reader/full/albert-2004 7/11
where V EVC and V EVO are the cylinder volume at EVCand EVO, P EVC and P EVO are the cylinder pressure EVCand EVO, and ne is the polytropic coefficient for theexpansion. For this study the expansion polytropiccoefficient was assumed equal to the compressionpolytropic coefficient because of the retarded heatrelease for the high residual fraction, part-loadconditions.
The Fox, Cheng, and Heywood correlation for estimatingthe trapped residual fraction is
0.74
int0.87
intint1.266 0.632
exh
r exh
exh c
P P P OF
y P P N P r
(4)
where N is the engine speed, OF is the overlap-factor
defined below, is the equivalence ratio, and r c is thecompression ratio. The overlap factor is given by
int int
IV EV EVC
exh exh
IVO IV EV
dis
D L d D L d
OF V (5)
where Dint and Dexh are the intake and exhaust innervalve seat diameters, Lint and Lexh are the lift of theintake and exhaust valves, and V dis is the displacedvolume of the engine.
The ideal gas model is a simple method to predictresidual gas fraction based on partial pressures. Thebasic assumptions are that the fresh charge temperatureis equal to the measured intake temperature, and theresidual gas temperature is equal to the measured
exhaust temperature. It also relies on the measuredmass of fuel and air delivered to the engine. Underthese assumptions, the residual mass fraction is givenby
r r
r air fuel
my
m m m (6)
with the residual mass, mr , determined from successiveapplication of the ideal gas law
air fuel INT IVC r IVC
exh IVC
m m RT V m P
RT V
. (7)
The second term in the brackets represents the partialpressure of the fresh charge at IVC, with the gasconstant, R , evaluated using the molecular weight of air.
It is important to note that the pressure values in all ofthe above residual fraction models is the absolutepressure. Thus, pegging the cylinder pressure correctlyis imperative in using these correlations.
RESULTS
EFFECT OF FUEL SYSTEM
The effect of the fuel system on the measured residuafraction can be seen in Figs. 2 and 3. The data for theHMS was chosen for the abscissa because the HMSwas found to produce the widest stable operating rangefor the engine. The results from the CMLFI, Fig. 3, werefound to be in excellent agreement with the HMS resultsfor all of the conditions tested. At low to moderateresidual fractions the carburetor results agree very welwith the HMS results. However, for conditions with arelatively high residual fraction the carburetor providesslightly lower values of residual fraction. The differenceis, in part, thought to be the result of the poorer (relativeto the HMS) combustion quality observed with thecarburetor at high residual fractions.
EFFECT OF VALVE OVERLAP
Changing the valve overlap effect produced theexpected results – higher levels of overlap producedhigher residual fractions. These results can be seen inFig. 4 for the HMS data. The effect of overlap was more
pronounced at the higher valve overlap conditions. Theeffects of speed and ignition timing, which are includedin Fig. 4, are discussed separately below.
0.4
0.3
0.2
0.1
0.0
y r , c a r b
0.40.30.20.10.0yr,HMS
Figure 2 Comparison of measured residual fraction forthe HMS and carbureted fuel delivery cases.
8/9/2019 Albert 2004
http://slidepdf.com/reader/full/albert-2004 8/11
0.4
0.3
0.2
0.1
0.0
y r , C M L F I
0.40.30.20.10.0yr,HMS
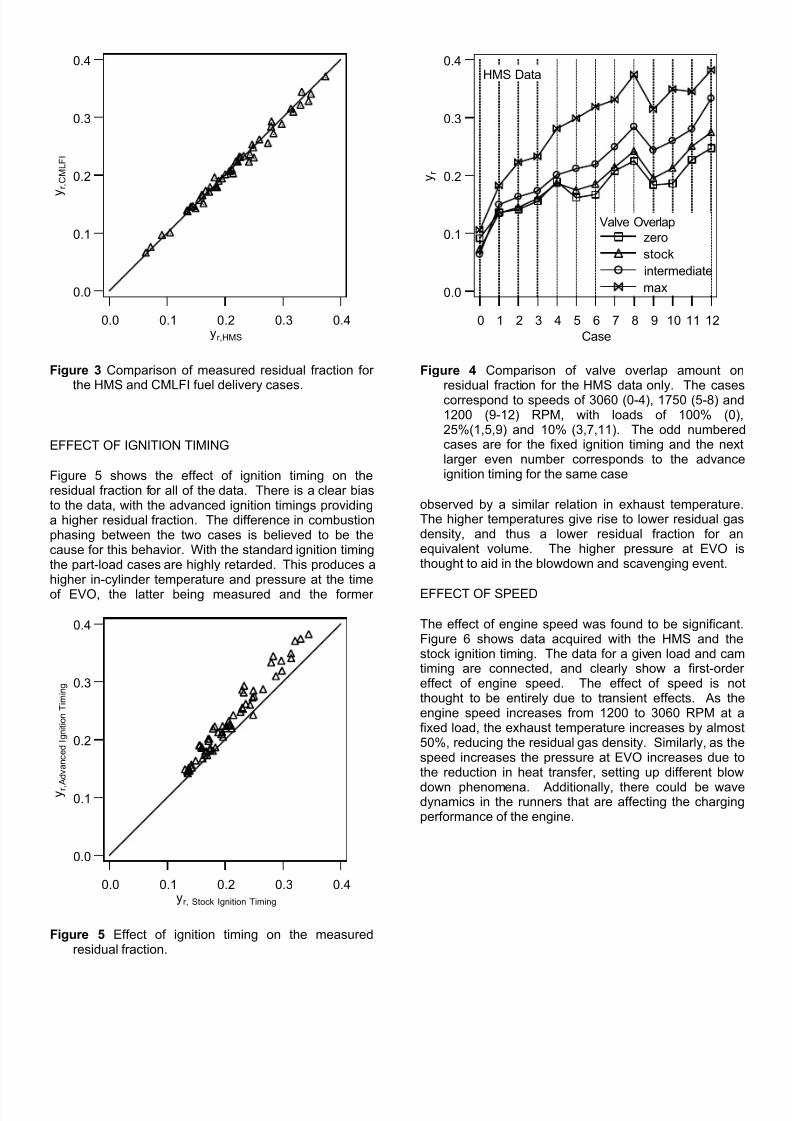
Figure 3 Comparison of measured residual fraction forthe HMS and CMLFI fuel delivery cases.
EFFECT OF IGNITION TIMING
Figure 5 shows the effect of ignition timing on theresidual fraction for all of the data. There is a clear biasto the data, with the advanced ignition timings providinga higher residual fraction. The difference in combustionphasing between the two cases is believed to be thecause for this behavior. With the standard ignition timingthe part-load cases are highly retarded. This produces ahigher in-cylinder temperature and pressure at the timeof EVO, the latter being measured and the former
observed by a similar relation in exhaust temperatureThe higher temperatures give rise to lower residual gasdensity, and thus a lower residual fraction for anequivalent volume. The higher pressure at EVO isthought to aid in the blowdown and scavenging event.
EFFECT OF SPEED
The effect of engine speed was found to be significantFigure 6 shows data acquired with the HMS and thestock ignition timing. The data for a given load and camtiming are connected, and clearly show a first-ordereffect of engine speed. The effect of speed is nothought to be entirely due to transient effects. As theengine speed increases from 1200 to 3060 RPM at afixed load, the exhaust temperature increases by almos50%, reducing the residual gas density. Similarly, as thespeed increases the pressure at EVO increases due tothe reduction in heat transfer, setting up different blow
down phenomena. Additionally, there could be wavedynamics in the runners that are affecting the chargingperformance of the engine.
0.4
0.3
0.2
0.1
0.0
y r
1211109876543210
Case
HMS Data
Valve Overlap
zero
stock
intermediate
max
Figure 4 Comparison of valve overlap amount onresidual fraction for the HMS data only. The casescorrespond to speeds of 3060 (0-4), 1750 (5-8) and1200 (9-12) RPM, with loads of 100% (0)25%(1,5,9) and 10% (3,7,11). The odd numberedcases are for the fixed ignition timing and the nextlarger even number corresponds to the advanceignition timing for the same case
0.4
0.3
0.2
0.1
0.0
y r , A d v a n c e d I g n i t i o n T i m i n g
0.40.30.20.10.0yr, Stock Ignition Timing
Figure 5 Effect of ignition timing on the measuredresidual fraction.

8/9/2019 Albert 2004
http://slidepdf.com/reader/full/albert-2004 9/11
0.40
0.35
0.30
0.25
0.20
0.15
0.10
y r
350030002500200015001000
Speed [RPM]
Figure 6 Effect of engine speed on residual fraction.The data are from the HMS, the filled symbols are10% load and the open symbols are 25% load. Thevalve overlap conditions are zero (square), stock(circle), intermediate (hourglass) and maximum(triangle).
COMPARISON OF MODEL PERFORMANCE
As described above, three models were evaluated fortheir ability to predict the residual fraction. The Yun andMirsky and Ideal Gas models were implemented directlyas described. The Fox, Cheng and Heywood model,however, could not be directly implemented because theintake pressure, P int , is not uniquely defined for smallengines with limited intake volume. For this model theintake pressure was taken to be the pressure at bottomdead center of the compression stroke.
The results of the Ideal Gas model, y r,IG, are plotted inFig. 7 against the measured residual fraction. Thecorrelation between the Ideal Gas prediction andmeasured residual fraction is, in general, quite poor. Atlow residual fraction the Ideal Gas model over-predictsthe residual fraction, while at high residual fraction themodel under-predicts the value.
The cause for this behavior is believed to be theassumptions made regarding the temperatures of thefresh and residual charges. The measured intake gastemperature will be lower than the trapped fresh chargetemperature due to heat transfer from the hot wallsduring the intake stroke. Therefore, the partial volume ofthe intake charge is under-estimated resulting in ahigher than expected residual fraction. This problem isexpected to be worse at low residual fraction, and this isconsistent with the observation in Fig. 7. Also, theresidual gas temperature is expected to be lower than
the exhaust temperature due to heat transfer to the wallsduring gas exchange. This effect would result in anunder-estimation of the residual mass, and would bemore pronounced at high residual fraction, which isconsistent with Fig. 7. Attempts to improve theprediction capability of the Ideal Gas model using themeasured oil temperature as a surrogate for thechamber wall temperature did not produce significantlyimproved results.
0.4
0.3
0.2
0.1
0.0
y r , I G
0.40.30.20.10.0yr
Figure 7 Comparison of ideal gas model to measuredresults.
The comparison of the Yun & Mirsky model prediction tothe measured residual is shown in Fig. 8. The trend in
the results is captured reasonably by the Yun & Mirskymodel, but the model substantially under-predicts theresidual fraction. The basic premise of the Yun & Mirskymodel is that the residual gas undergoes a polytropicexpansion from EVO to EVC. The EVC to EVO densityratio is then given by the second term in Eq. 3, andwhen coupled with the cylinder volumes it results in thenecessary mass ratio. The use of the polytropiccoefficient instead of the isentropic coefficient accountsto a small degree for the effect of heat transfer.
In the real case, however, the effects of heat transfer wilbe more significant. Therefore, the second term of Eq. 3
under-predicts the residual gas density. This result isreflected in the trends of Fig. 8 where the predictedresidual fraction lies below the measured value.

8/9/2019 Albert 2004
http://slidepdf.com/reader/full/albert-2004 10/11
0.4
0.3
0.2
0.1
0.0
y r , Y & M
0.40.30.20.10.0yr
Figure 8 Comparison of Yun and Mirsky model tomeasured results.
The results from the Fox, Cheng and Heywood modelare not very good, as shown in Fig. 9. The modelsignificantly over-predicts the residual fraction for all ofthe valve overlap conditions except for the zero overlapconfiguration. This poor agreement is not overlysurprising given that the model has been applied welloutside its intended range. The overlap factor of thedata used in [3] was 0.52 < OF < 1.43, which is similar tothe zero overlap case, but well below the other camphasings considered here, see Table 3. Other factors,such as the choice of the intake pressure, also affectedthe results, but detailed investigation revealed that the
first term in Eq. 4, which contains OF, was dominating
the results.
MODEL SENSITIVITY
The prediction capabilities of all of the models was lessthan desired, so an attempt was made to assess whatthe best implementation of the model was within givenconstraints. The two main factors that were investigatedwere the threshold value used to define of valve openingand closing, and the polytropic exponent used in the Yunand Mirsky model.
The effect of these parameters was assessed byinvestigating the root mean square (RMS) error for amodel. The RMS error was calculated for a data set as
2
,
1
1n
i i RMS r r p
i
Error y y n
(8
where n (=140) is the number of operating conditionsand y r,p is the residual fraction predicted by the model
The data, normalized by the value obtained with a 0.25mm lift, are shown in Fig. 10. It is observed that theRMS error decreases for lift thresholds less than 0.25mm for both the Yun & Mirsky model and the Ideal Gasmodel, therefore, better accuracy is obtained for lowthreshold lift values.
As discussed previously, the polytropic exponent in theYun & Mirsky model does not accurately take intoaccount the heat transfer from the residual gas. A besfit value for the exponent, nbf , in Eq. 3 was determinedfor each value of lift threshold, and the results are shownin solid lines on Fig. 10. The RMS error for theoptimized case was normalized by the value from the
direct implementation of the Yun and Mirsky model at alift threshold of 0.25 mm. There are two things to noteFirst, the RMS error for the optimized Yun & Mirskymodel is everywhere lower than the standardimplementation. Further, the error is relativelyinsensitive to the lift threshold chosen. Secondly, thebest-fit exponent is always larger than the isentropicvalue of 1.4. This indicates that the heat transfer isunder-predicted in this simple model as argued above.
1.2
1.0
0.8
0.6
0.4
0.2
0.0
y r , F C H
0.40.30.20.10.0yr
0
0 00
00
00 0
0
0 00
00
0
00
0
0
0
0
0
0 00
0
0
0
00
00
0
0
1
1
11
1
1
11 1
1
1
1
1
11
1
1
11
1
1
1
1
1
1
1
11
1
1
11
11
1
2
2
2
2
2
2
2
2
2
2
2
2
2
2
2
2
2
2
2
2
2
2
2
2
3
3
3
3
3
33
3
3
33Overlap
0 - zero
1 - stock
2 - alternate
3 - max
Figure 9 Comparison of Fox, Cheng and Heywoodmodel to measured results.

8/9/2019 Albert 2004
http://slidepdf.com/reader/full/albert-2004 11/11
1.3
1.2
1.1
1.0
0.9
0.8
0.7
0.6
E r r o r R M S /
E r r o r R M S
( 0 . 2
5 m m )
0.60.50.40.30.20.10.0
Lift [mm]
2.6
2.4
2.2
2.0
1.8
1.6
n b f
Yun & Mirsky
Ideal Gas
Optimized Y&M
Figure 10 Comparison of the lift threshold level on theRMS error of the residual gas predictions. TheOptimized Y&M model exponent is shown on the
right axis.
CONCLUSION
The residual gas fraction was measured in an air-cooledsingle-cylinder utility engine by directly sampling thetrapped cylinder charge during a programmed misfire.The residual fraction was determined by comparing thetrapped CO2 concentration to that in the exhaust. Testswere performed for a range of fuel mixture preparationsystems, cam timings, ignition timings, engine speedsand engine loads. The results were compared topredictions from models available in the literature.
The residual fraction was found to be relativelyinsensitive to the fuel mixture preparation system, butwas to a moderate degree sensitive to the ignitiontiming. The residual fraction was found to be stronglyaffected by the amount of valve overlap and enginespeed. The effects of engine speed and ignition timingwere, in part, due to the in-cylinder conditions at EVO,with lower temperatures favoring higher residualfractions.
None of the three models investigated was able toaccurately predict the residual fraction over the entire
range of conditions tested. The Fox, Cheng andHeywood model performed well for very low overlapconditions, but at the cam timing of the productionversion of this engine it predicted values approximately
2 too high. The performance deteriorated at higheroverlap conditions due to the extrapolation of the modelpast the calibration data set. The Ideal Gas and Yunand Mirsky models were inherently limited due to heattransfer to the cylinder walls during the gas exchangeperiod. An optimized exponent for the Yun and Mirskymodel was proposed as a function of the lift thresholdused to define the valve events. The accuracy of the
modified Yun and Mirsky method was relativelyinsensitive to the value of lift threshold chosen.
ACKNOWLEDGMENTS
Support for this work was provided by the WisconsinSmall Engine Consortium. The efforts of Matt Mantheyand Blake Suhre of MotoTron are gratefullyacknowledged.
REFERENCES
1. Heywood, J.B., Internal Combustion EngineFundamentals. 1988: McGraw-Hill Inc.
2. Yun, H.J. and W. Mirsky, Schlieren-streak measurements of instantaneous exhaust gasvelocities from a spark-ignition engine. SAEPaper 741015, 1974.
3. Fox, J.W., W.K. Cheng, and J.B. Heywood, Amodel for predicting residual gas fraction inspark-ignition engines. SAE Paper 931025,1993.
4. Strauss, S. and J.K. Martin, An investigation ofthe intake manifold fuel transfer characteristicsof a four stroke engine. SAE Paper 2001-01-1213, 2001.
5. Probst, D.M. and J.B. Ghandhi, An experimentalstudy of spray mixing in a direct injection engine.Int. J. Engine Res., 2003. 4(1): p. 27-45.
6. Foudray, H.Z., Scavenging measurements in adirect-injection two-stroke engine, in MechanicalEngineering . 2002, University of Wisconsin-Madison: Madison.
7. Foudray, H.Z. and J.B. Ghandhi, Scavenging Measurements in a Direct-Injection Two-StrokeEngine. SAE Paper 2003-32-0081, 2003.
APPENDIX
Starting from the overall stoichiometric balance
2, , ,air dry fuel exh exh dry exh H On n n n n (A1
the exhaust stream dry-to-wet factor is
2
,
, ,
exhdry
EXH
exh dry exh H O
nK
n n. (A2
By definition, the residual fraction is
,
r
r air dry fuel r
n
x n n n (A3
from which one can write the compressed-charge dry-to-wet correction factor
2
, ,
, , ,
[ ]
[ ]
air dry fuel r exh dry
CC
air dry fuel r exh dry exh H O
n n x nK
n n x n n (A4
Dividing the numerator and denominator by nexh,dry +nexh,H2O and simplifying gives Eq. 2