alaha/hfma audit summit: bundled payments lessons learned€¦ · alaha/hfma audit summit: bundled...
TRANSCRIPT

Page 1
AlaHA/HFMA Audit Summit:
Bundled Payments Lessons
Learned
Mary Beth Briscoe, CFO
April 21, 2016
Page 2
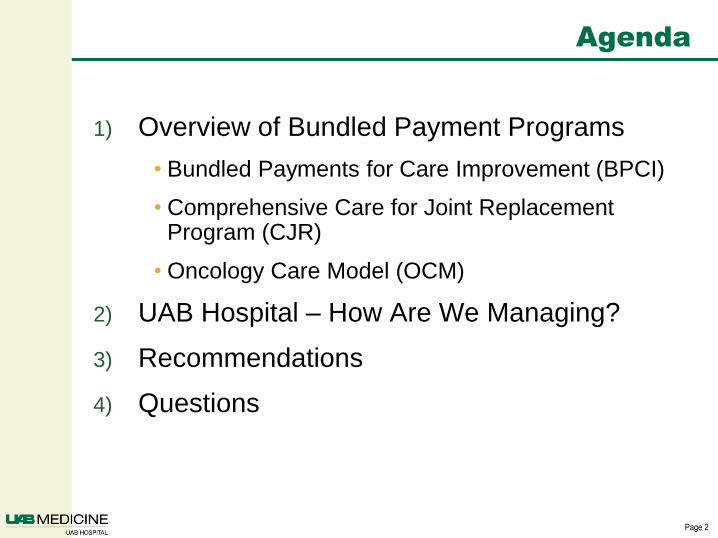
Agenda
1) Overview of Bundled Payment Programs
• Bundled Payments for Care Improvement (BPCI)
• Comprehensive Care for Joint Replacement Program (CJR)
• Oncology Care Model (OCM)
2) UAB Hospital – How Are We Managing?
3) Recommendations
4) Questions

Page 3
Background
Traditional Medicare Model = fragmented care with minimal coordination across providers and health care settings
Rewards for Volume instead of Quality
Research has shown that bundled payments can align incentives for providers – hospitals, post-acute care providers, physicians, and other practitioners – allowing them to work closely together across all specialties and settings throughout the continuum of care.

Page 4
CMS Accelerates the Tipping Point for Everyone
0%
20%
40%
60%
80%
100%
2011 2015 2016 2018
Alternative Payment Models
Traditional, Fee for Service
“…HHS goal of 30 percent traditional FFS Medicare payment through alternative payment models by the end of 2016… 50 percent by the end of 2018”
HHS Press Office 1-26-15
Background

Page 5
BPCI OVERVIEW
- OPTIONAL
- MANDATED

Page 6
Bundled Payments for Care Improvement

Page 7
BPCI: Where are we?
Two cohorts so far…will there be another?
As of 1/1/16, there are 1,574 participants in Phase 2 comprised of 337 Awardees and 1237 Episode Initiators
409 hospitals
700 skilled nursing facilities
288 physician practices
100 home health agencies
9 inpatient rehabilitation facilities
1 long term care hospital

Page 8
Two Types of Gain Sharing
Net Payment Reconciliation Amount
• Medicare Spend Reduction
Internal Cost Savings
• Hospital Expense Reduction

Page 9
CJR OVERVIEW “MANDATED”

Page 10
Why CJR?
$12.299 Billion Total Episode Spending
$343 Million Savings to Medicare
2.8% Overall CJR Savings to
Medicare

Page 11
CJR moved forward with 67 MSAs April 1
Tuscaloosa:
Hale, Pickens,
Tuscaloosa
Montgomery:
Autauga, Elmore,
Lowndes,
Montgomery
Dothan:
Geneva,
Henry,
Houston

Page 12
Stop-Loss & Stop-Gain Limits Narrowed
CJR will phase in stop-gain limits, rather than static 20% stop-gain limits in all 5 years.
Less potential loss in Years 2 and 3.
Rural hospital, SCH, MDH, RRC participant have the same stop-gain limits but different stop-loss limits:
2016: N/A, no downside
2017: -3%
2018-2020: -5%

Page 13
OCM OVERVIEW
OPTIONAL

Page 14
OCM Overview
Episode-based
• Payment model targets chemotherapy and related care during a 6-
month period following the initiation of chemotherapy treatment
Emphasizes practice transformation
• Physician practices are required to engage in practice transformation
to improve the quality of care they deliver
Multi-payer model
• Includes Medicare fee-for-service and other payers working in tandem
to leverage the opportunity to transform care for oncology patients
across the population
UAB Status
• In process of data review
• Assessing financial implications / learning opportunities
• Impact on MACRA

Page 15
OCM Payment Approach
Two-part payment approach:
1) A monthly $160 per-beneficiary care management payment for
Medicare FFS beneficiaries
1) A performance-based payment for OCM episodes.
• The performance-based payment will be determined based on
the practice’s achievement and improvement on quality
measures
• Participants will receive regular Medicare FFS payments during
the model.
• Performance-based payments will be calculated retrospectively
following the completion of a 6-month episode

Page 16
OCM - Risk Arrangements
1. One sided arrangement
• Available throughout the five year period and includes only the PBPM
payments and performance based payments if required reductions
achieved
• One sided risk arrangements are set at 4% discount - maximum
performance payment set at 20% of benchmark before taking the
CMS discount.
2. Phased-in two-sided risk arrangement
• One-sided risk in the first two performance years and symmetric two-
sided risk thereafter (requires the participant to pay back
expenditures over the target price)
• Optional and is a 2.75% discount after year 2
• The maximum performance payment is set at 20% of the benchmark
before taking the CMS discount. Maximum payback in the two sided
arrangement is also set at 20%.

Page 17
OCM Modeling
* includes additional program costs and potential IP and drug cost reductions
EXAMPLE

Page 18
UAB BUNDLE PARTICIPATION

Page 19
Why Bundles?
Bundled payments provided a counterstrategy to ACOs and
provides management experience across the continuum of
care
Bundled payments are now becoming mandatory models and
CMS and our participation positions organizations for
success in this new care delivery system
COPD, being a chronic disease, is difficult to manage across
a 90 day episode but gives UAB valuable experience that will
translate across all diseases

Page 20
How Did We Make the Decision?
Measured the financial risk involved with participating in each
bundle
Selected a small cohort (COPD/Asthma)
Interested in learning to manage bundles that are voluntary,
and could become mandatory in the future
Cross-functional teams reviewed bundle participation
requirements and risk

Page 21
BPCI Bundles
Currently participating in three bundles:
1. Chronic obstructive pulmonary disease,
bronchitis/asthma
2. Cardiac valve
3. Stroke
Also modeling for Comprehensive Care for Joint Replacement
(CJR)
Application accepted to the Oncology Care Bundle (OCM)

Page 22
COPD Asthma Bundle Participation
Starting January 2013, entered Phase 1 (no-risk) of COPD/Asthma
bundled payment pilot with CMS
Bundle includes COPD and Asthma DRGs and any activity at any
location 90 days post discharge
Target price includes a 2% discount from historical average payments
by DRG
CMS will reconcile every quarter to see if payment is owed by CMS
or UAB
Improvement in key quality metrics provides an opportunity to
gainshare with physicians and post acute partners
Formed collaboration with home care agent
Formally went at risk (Phase 2) with CMS in January 2014
Page 23
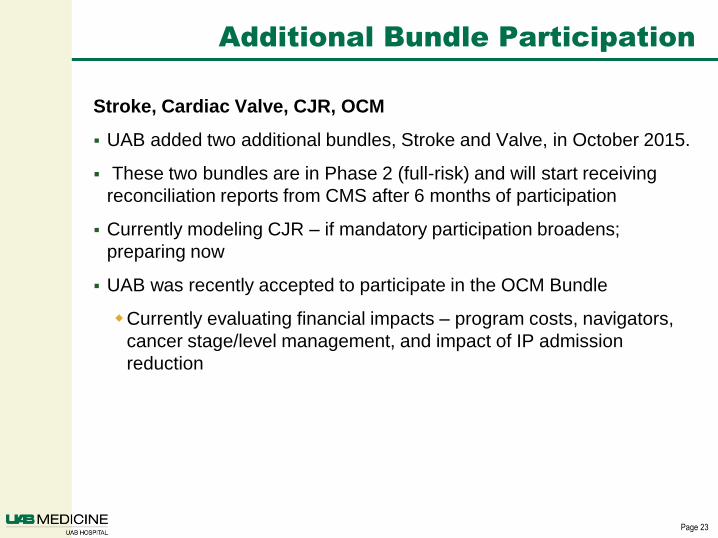
Additional Bundle Participation
Stroke, Cardiac Valve, CJR, OCM
UAB added two additional bundles, Stroke and Valve, in October 2015.
These two bundles are in Phase 2 (full-risk) and will start receiving
reconciliation reports from CMS after 6 months of participation
Currently modeling CJR – if mandatory participation broadens;
preparing now
UAB was recently accepted to participate in the OCM Bundle
Currently evaluating financial impacts – program costs, navigators,
cancer stage/level management, and impact of IP admission
reduction

Page 24
HOW ARE WE MANAGING
ALTERNATIVE PAYMENT MODELS

Page 25
How Are We Managing?
Administration established committees for each bundle to
develop processes to manage each bundle
Clinical teams provided clinical data and helped to manage
patients currently receiving care through the development of
care pathways
Finance partnered with each bundle committee to provide
financial P/L information for each bundle based on both the
target price and the internal costs of the organization
Patient Services worked with external partners identified
trends in post-acute provider performance through MSPB
analysis to begin the process of developing a preferred
provider network of SNFs and HH

Page 26
How Are We Managing?
External partners helped to identify patients that were higher risk for
complications and developed methods to better manage their care,
included VIVA in any discussions/partnerships
Other aspects of the program include:
Multi-disciplinary clinic that includes home health, DME, and
palliative care
Real-time notification of readmitted patients
Both the Stroke and Valve bundles are working through clinical
redesign, patient engagement, post acute provider engagement, and
identifying other major opportunities for improvement

Page 27
How Are We Managing?
Stoplight Forms
Patients receive a stoplight form that helps them recognize symptoms
and notify their physician before symptoms become unable to manage
at home and hospitalization is required

Page 28
How Are We Managing?
Post-Acute Performance SNF Scorecard
Page 29
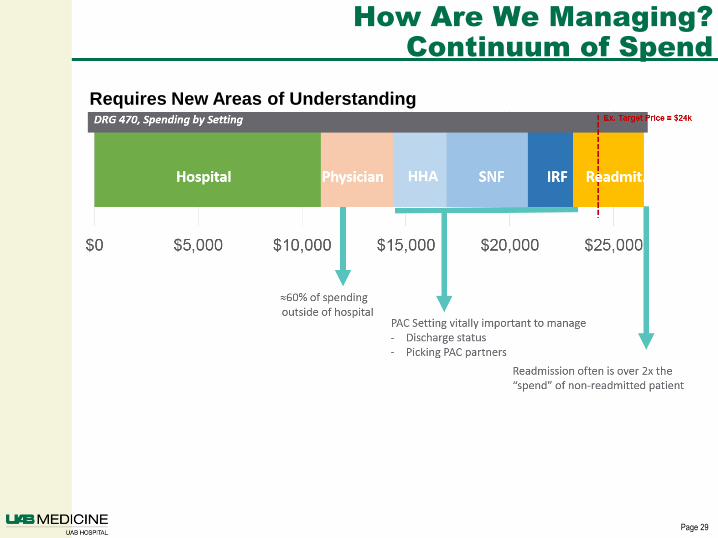
How Are We Managing?
Continuum of Spend
Readmission often is over 2x the
“spend” of non-readmitted patient
Requires New Areas of Understanding

Page 30
How Are We Managing?
Data: Episode Drilldown
EXAMPLE

Page 31
How Are We Managing?
Data: Performance Summary - COPD
Average Estimated P&L per Episode
“Bundle
Busters”
EXAMPLE

Page 32
How Are We Managing?
Data: Discharge Trends Report
EXAMPLE

Page 33
How Are We Managing?
Data: Discharge Destinations - COPD
Page 34
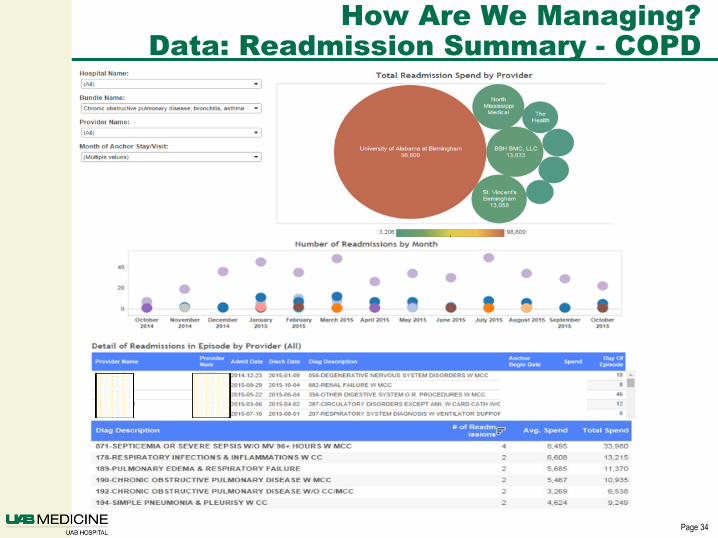
How Are We Managing?
Data: Readmission Summary - COPD

Page 35
How Are We Managing?
Data: Physician Scorecard

Page 36
How Are We Managing?
Data: Diagnosis Dashboard- COPD

Page 37
Holistic View
Baseline Oct Nov Dec
Cost per Discharge
LOS
HAC
PSI
Mortality
Patient Satisfaction
Gainsharing Metrics
Patient Satisfaction
Quality
Financial

Page 38
Advanced Payment Model Profitability:
Monthly Reporting
Bundled Payment Models Example Reporting
Bundles Cases UH Payments
UH Direct
Cost
UH Indirect
Cost UH Total Cost
UH Encounter
Net
Bundle NPRA
Gain / Loss
UH Total
Bundle
Gain / Loss
COPD 42 $42,000 $36,330 $5,040 $41,370 $630 $14,000 $14,630
Stroke 17 $17,000 $18,700 $2,040 $20,740 ($3,740) $0 ($3,740)
Valve 26 $26,000 $22,490 $3,120 $25,610 $390 $0 $390
85 $85,000 $77,520 $10,200 $87,720 ($2,720) $14,000 ($3,350)
• Final reconciliation occurs 15 months from anchor date.
Gains are shared between the hospital, physicians and
external providers.
• Important for financial statement purposes

Page 39
Pros/Cons of Bundled Payments
Pros:
Pricing, Transparency & Invoicing
Quality of Care
Coordination & Accountability Among Providers
Simplification
Financial Risks on the Provider
Cons:
Limitation of Effectiveness
Payment Distribution Difficulties
Financial Risks on the Provider

Page 40
Challenges
Aligning internal and external data in a meaningful way in order to
provide reporting to the organization
Identifying “potential participants” within the organization
Managing post-acute spend
Defining roles and responsibilities in areas that we are “learning as we
go”

Page 41
Recommendations
Technology – collecting and understanding data is key to managing
any initiative in healthcare today
Tracking – develop a tracking/reporting system that meets the needs
of the organization
Combining internal cost data with BPCI data to report not only the
P/L of BCPI participation, but also the overall P/L of the bundles
including internal costs
Clinical engagement is critical to your success
Internal Skills – outsourcing can also be beneficial
Actuarial
Collaboration

Page 42
Recommendations
Retrospective data review is only part of the solution – it
provides a snapshot of possible process improvements
Using internal clinical data assists in improving quality of
care being delivered to our patients
Utilizing data to predict and model future patient episodes
to proactively provide care to our patients

Page 43
QUESTIONS?