aix 5l/6 performance tuning part i: tactics for ... -...
TRANSCRIPT

© 2010 IBM Corporation
AIX 5L/6 Performance Tuning Part I: Tactics for Monitoring Indications of Performance IssuesEarl JewIBM Field Technical Sales Specialist for Power Systems and StorageIBM Regional Designated Specialist - Power/AIX Performance and Tuning400 North Brand Blvd., Suite 700 c/o IBM, Glendale, CA, USA [email protected] (310)251-2907
AIX Virtual Users Group presentation July 29, 2010

© 2010 IBM Corporation
AIX Virtual Users Group presentation July 29, 2010
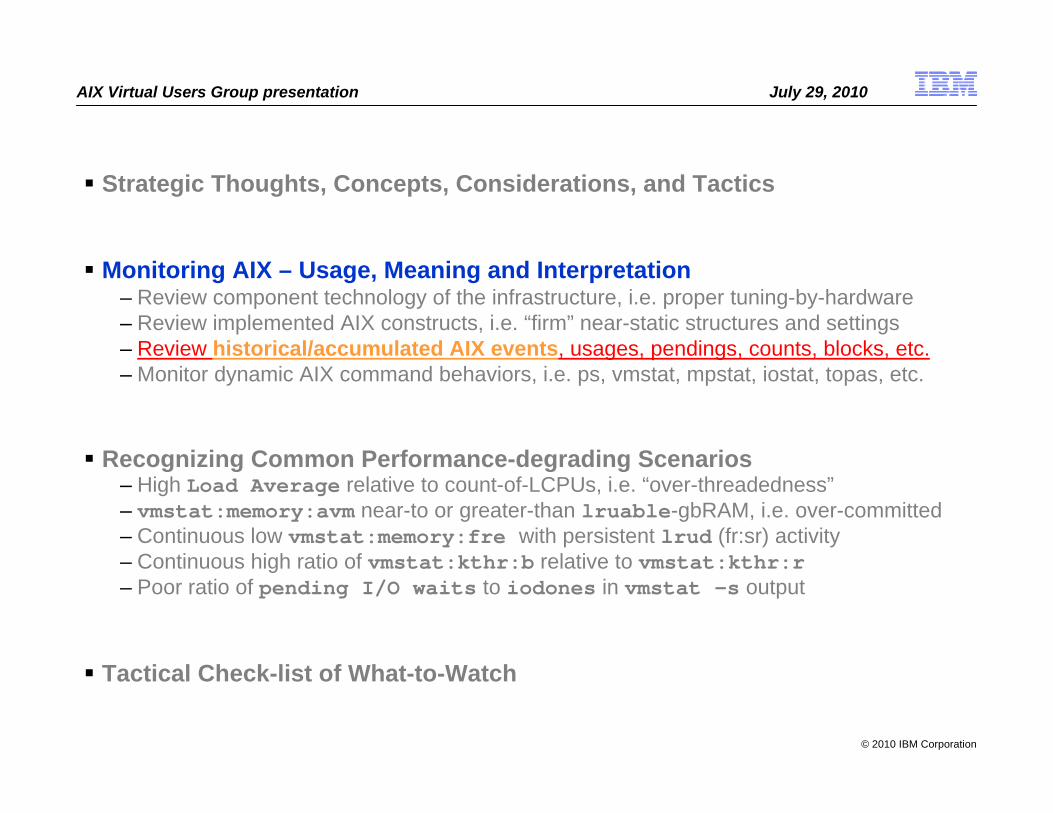
Strategic Thoughts, Concepts, Considerations, and Tactics
Monitoring AIX – Usage, Meaning and Interpretation– Review component technology of the infrastructure, i.e. proper tuning-by-hardware– Review implemented AIX constructs, i.e. “firm” near-static structures and settings– Review historical/accumulated AIX events, usages, pendings, counts, blocks, etc.– Monitor dynamic AIX command behaviors, i.e. ps, vmstat, mpstat, iostat, topas, etc.
Recognizing Common Performance-degrading Scenarios– High Load Average relative to count-of-LCPUs, i.e. “over-threadedness”– vmstat:memory:avm near-to or greater-than lruable-gbRAM, i.e. over-committed– Continuous low vmstat:memory:fre with persistent lrud (fr:sr) activity– Continuous high ratio of vmstat:kthr:b relative to vmstat:kthr:r– Poor ratio of pending I/O waits to iodones in vmstat -s output
Tactical Check-list of What-to-Watch

© 2010 IBM Corporation
AIX Virtual Users Group presentation July 29, 2010
Strategic Thoughts: Monitoring AIX 5L/6.1 LPARs
Many AIX performance-degrading scenarios can be readily characterized by monitoring AIX dynamically (real-time) as well as cumulatively (ie. vmstat –sv).
By understanding and interpreting the output of mundane AIX commands better&deeper, areas of resource exhaustion, limitation and over-commitment, as well as, resource under-utilization, surplus and over-allocation, can be distinguished.
This presentation focuses on the tactical -- meaning your daily “keyboard awareness”.
This will explain the numbers presented by AIX commands (vmstat, mpstat, iostat, ps, etc.) and formulate the severity of performance issues, if any.
Most cumulative indicators are counts-per-scale over days-uptime.
Many dynamic indicators are comparing ranges&ratios of system resources.
Scaled-definitions define blue/surplus, green/normal, yellow/warning, red/serious and Flashing-Red-with-Sirens/critical status-conditions.
© 2010 IBM Corporation
AIX Virtual Users Group presentation July 29, 2010
Strategic Concepts: Monitoring AIX 5L/6.1 LPARs
Can the capabilities&capacities (C&C) of the infrastructure manage the workload?
Is there an appropriate balance of hardware capabilities&capacities for the workload?
To answer, AIX must be monitored relative to its hardware resources&infrastructure.
Note the size, scale, technology and implementation of the given LPAR
Note the LPAR’s ratio-of-resources, ie. CPU-to-RAM-to-SAN I/O for the workload
Note the same of other same-frame “sibling” LPARs, if any
Review the historical/accumulated count-of-events over days-uptime
Determine points of exhaustion, limitation, and over-commitment
Determine surplus resources: CPUcycles, RAM, SAN I/O throughput, etc.
Review exhaustions and surpluses in-light of workload expectations
Monitor dynamic AIX behaviors to characterize the given workload
For example: Is this a Think-Think or a Move-the-Data workload?
© 2010 IBM Corporation
AIX Virtual Users Group presentation July 29, 2010
Strategic Considerations: Monitoring AIX 5L/6.1 LPARs
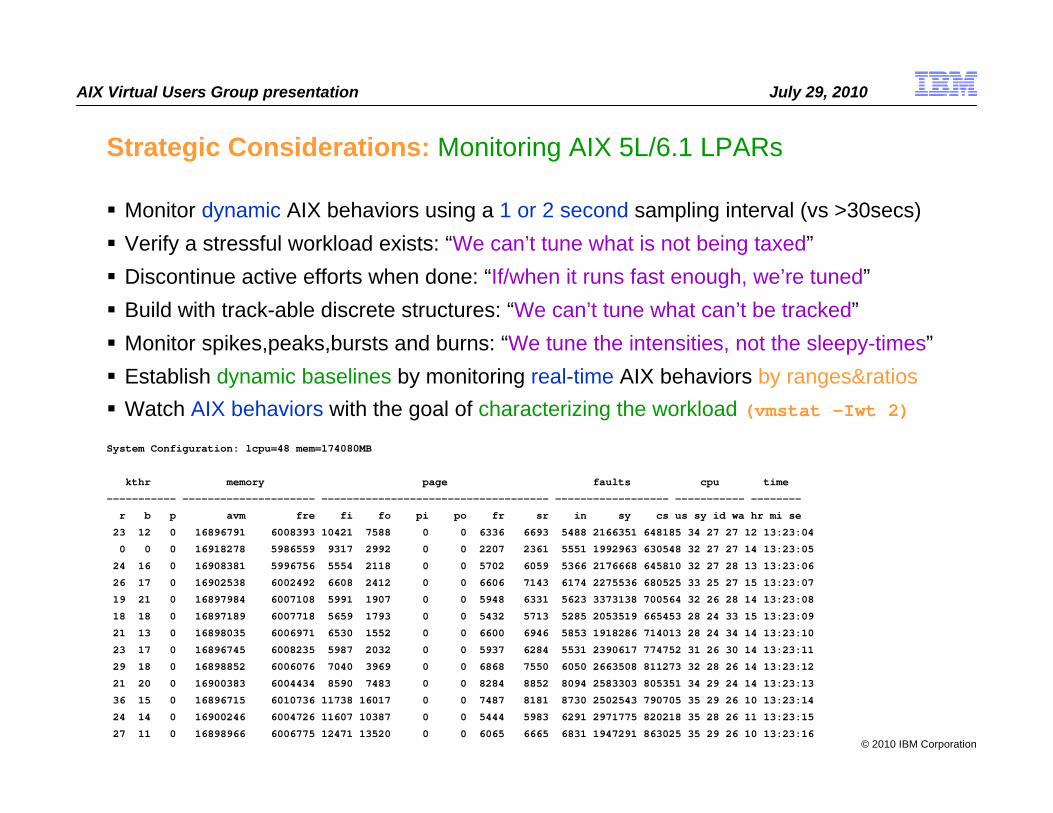
Monitor dynamic AIX behaviors using a 1 or 2 second sampling interval (vs >30secs) Verify a stressful workload exists: “We can’t tune what is not being taxed” Discontinue active efforts when done: “If/when it runs fast enough, we’re tuned” Build with track-able discrete structures: “We can’t tune what can’t be tracked” Monitor spikes,peaks,bursts and burns: “We tune the intensities, not the sleepy-times” Establish dynamic baselines by monitoring real-time AIX behaviors by ranges&ratios Watch AIX behaviors with the goal of characterizing the workload (vmstat –Iwt 2)
System Configuration: lcpu=48 mem=174080MB
kthr memory page faults cpu time
----------- --------------------- ------------------------------------ ------------------ ----------- --------
r b p avm fre fi fo pi po fr sr in sy cs us sy id wa hr mi se
23 12 0 16896791 6008393 10421 7588 0 0 6336 6693 5488 2166351 648185 34 27 27 12 13:23:04
0 0 0 16918278 5986559 9317 2992 0 0 2207 2361 5551 1992963 630548 32 27 27 14 13:23:05
24 16 0 16908381 5996756 5554 2118 0 0 5702 6059 5366 2176668 645810 32 27 28 13 13:23:06
26 17 0 16902538 6002492 6608 2412 0 0 6606 7143 6174 2275536 680525 33 25 27 15 13:23:07
19 21 0 16897984 6007108 5991 1907 0 0 5948 6331 5623 3373138 700564 32 26 28 14 13:23:08
18 18 0 16897189 6007718 5659 1793 0 0 5432 5713 5285 2053519 665453 28 24 33 15 13:23:09
21 13 0 16898035 6006971 6530 1552 0 0 6600 6946 5853 1918286 714013 28 24 34 14 13:23:10
23 17 0 16896745 6008235 5987 2032 0 0 5937 6284 5531 2390617 774752 31 26 30 14 13:23:11
29 18 0 16898852 6006076 7040 3969 0 0 6868 7550 6050 2663508 811273 32 28 26 14 13:23:12
21 20 0 16900383 6004434 8590 7483 0 0 8284 8852 8094 2583303 805351 34 29 24 14 13:23:13
36 15 0 16896715 6010736 11738 16017 0 0 7487 8181 8730 2502543 790705 35 29 26 10 13:23:14
24 14 0 16900246 6004726 11607 10387 0 0 5444 5983 6291 2971775 820218 35 28 26 11 13:23:15
27 11 0 16898966 6006775 12471 13520 0 0 6065 6665 6831 1947291 863025 35 29 26 10 13:23:16
© 2010 IBM Corporation
AIX Virtual Users Group presentation July 29, 2010
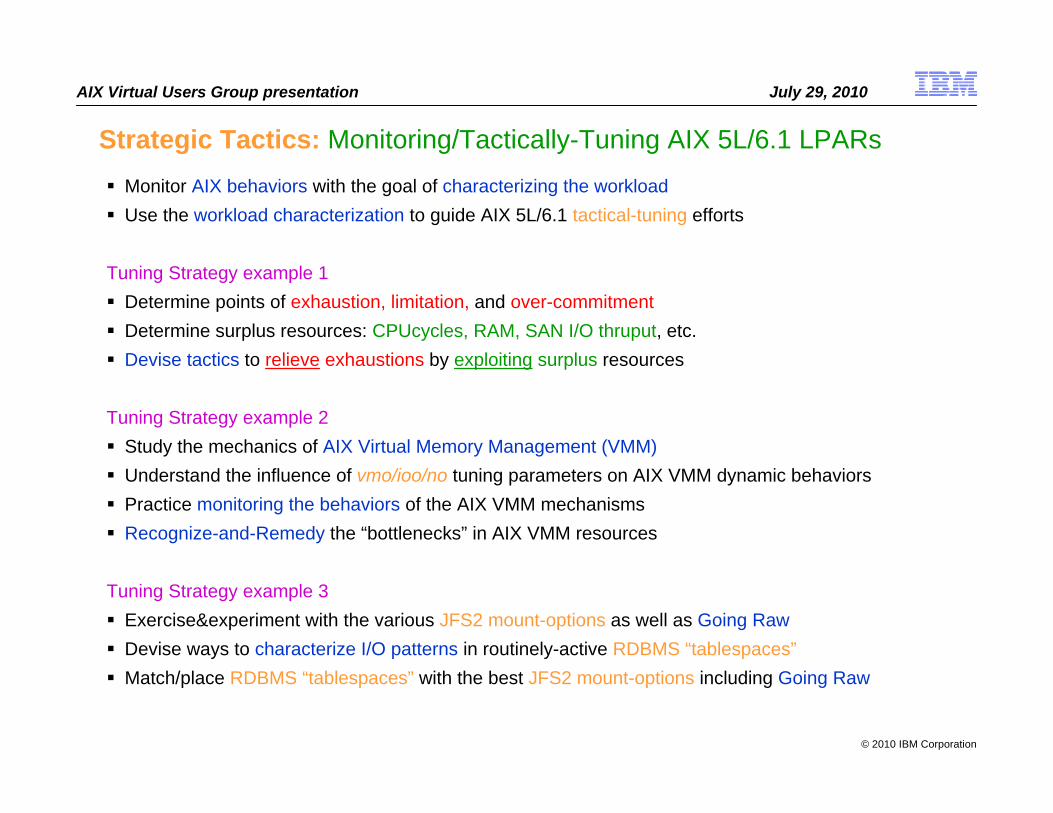
Strategic Tactics: Monitoring/Tactically-Tuning AIX 5L/6.1 LPARs Monitor AIX behaviors with the goal of characterizing the workload Use the workload characterization to guide AIX 5L/6.1 tactical-tuning efforts
Tuning Strategy example 1 Determine points of exhaustion, limitation, and over-commitment Determine surplus resources: CPUcycles, RAM, SAN I/O thruput, etc. Devise tactics to relieve exhaustions by exploiting surplus resources
Tuning Strategy example 2 Study the mechanics of AIX Virtual Memory Management (VMM) Understand the influence of vmo/ioo/no tuning parameters on AIX VMM dynamic behaviors Practice monitoring the behaviors of the AIX VMM mechanisms Recognize-and-Remedy the “bottlenecks” in AIX VMM resources
Tuning Strategy example 3 Exercise&experiment with the various JFS2 mount-options as well as Going Raw Devise ways to characterize I/O patterns in routinely-active RDBMS “tablespaces” Match/place RDBMS “tablespaces” with the best JFS2 mount-options including Going Raw

© 2010 IBM Corporation
AIX Virtual Users Group presentation July 29, 2010
Strategic Thoughts, Concepts, Considerations, and Tactics
Monitoring AIX – Usage, Meaning and Interpretation– Review component technology of the infrastructure, i.e. proper tuning-by-hardware– Review implemented AIX constructs, i.e. “firm” near-static structures and settings– Review historical/accumulated AIX events, usages, pendings, counts, blocks, etc.– Monitor dynamic AIX command behaviors, i.e. ps, vmstat, mpstat, iostat, topas, etc.
Recognizing Common Performance-degrading Scenarios– High Load Average relative to count-of-LCPUs, i.e. “over-threadedness”– vmstat:memory:avm near-to or greater-than lruable-gbRAM, i.e. over-committed– Continuous low vmstat:memory:fre with persistent lrud (fr:sr) activity– Continuous high ratio of vmstat:kthr:b relative to vmstat:kthr:r– Poor ratio of pending I/O waits to iodones in vmstat -s output
Tactical Check-list of What-to-Watch

© 2010 IBM Corporation
AIX Virtual Users Group presentation July 29, 2010
Note the size, scale, technology and implementation of the given LPARNote the LPAR’s ratio-of-resources, i.e. CPU-to-RAM-to-SAN I/O
$ date ; uname -a ; id ; oslevel –s; lparstat -iWed Sep 17 12:21:20 EDT 2008AIX alamogordo 3 5 00XXXXXXXX00uid=0(root) gid=0(system) groups=2(bin),3(sys),8(cron),10(audit),301(udmin),11(lp),401(multiud),303(cognos)5300-07-03-0811Node Name : alamogordoPartition Name : alamogordoPartition Number : 3Type : Shared-SMTMode : UncappedEntitled Capacity : 15.20Partition Group-ID : 32771Shared Pool ID : 0Online Virtual CPUs : 32Maximum Virtual CPUs : 32Minimum Virtual CPUs : 2Online Memory : 126464 MBMaximum Memory : 131072 MBMinimum Memory : 2048 MBVariable Capacity Weight : 255Minimum Capacity : 2.00Maximum Capacity : 16.00Capacity Increment : 0.01Maximum Physical CPUs in system : 64Active Physical CPUs in system : 16Active CPUs in Pool : 16Shared Physical CPUs in system : -Maximum Capacity of Pool : -Entitled Capacity of Pool : -Unallocated Capacity : 0.00Physical CPU Percentage : 47.50%Unallocated Weight : 0
© 2010 IBM Corporation
AIX Virtual Users Group presentation July 29, 2010
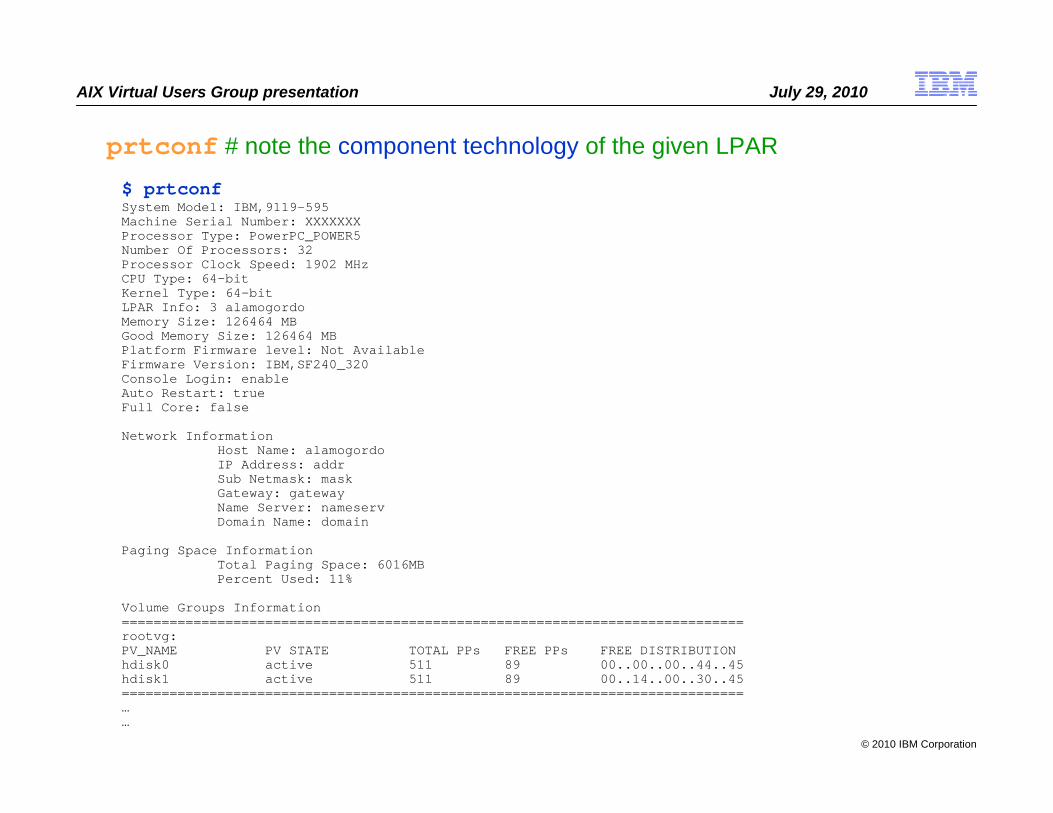
prtconf # note the component technology of the given LPAR
$ prtconfSystem Model: IBM,9119-595Machine Serial Number: XXXXXXXProcessor Type: PowerPC_POWER5Number Of Processors: 32Processor Clock Speed: 1902 MHzCPU Type: 64-bitKernel Type: 64-bitLPAR Info: 3 alamogordoMemory Size: 126464 MBGood Memory Size: 126464 MBPlatform Firmware level: Not AvailableFirmware Version: IBM,SF240_320Console Login: enableAuto Restart: trueFull Core: false
Network InformationHost Name: alamogordoIP Address: addrSub Netmask: maskGateway: gatewayName Server: nameservDomain Name: domain
Paging Space InformationTotal Paging Space: 6016MBPercent Used: 11%
Volume Groups Information============================================================================== rootvg:PV_NAME PV STATE TOTAL PPs FREE PPs FREE DISTRIBUTIONhdisk0 active 511 89 00..00..00..44..45hdisk1 active 511 89 00..14..00..30..45============================================================================== ……

© 2010 IBM Corporation
AIX Virtual Users Group presentation July 29, 2010
lscfg # note the placement of components in the implementation of the LPAR
$ lscfgINSTALLED RESOURCE LIST
The following resources are installed on the machine.+/- = Added or deleted from Resource List.•= Diagnostic support not available.
Model Architecture: chrpModel Implementation: Multiple Processor, PCI bus
+ sys0 System Object+ sysplanar0 System Planar* pci11 U5791.001.99205Z4-P1 PCI Bus* pci12 U5791.001.99205Z4-P1 PCI Bus+ ent6 U5791.001.99205Z4-P1-C04-T1 10 Gigabit Ethernet-SR PCI-X 2.0 DDR Adap* pci4 U5791.001.99205Z4-P1 PCI Bus* pci7 U5791.001.99205Z4-P1 PCI Bus+ fcs3 U5791.001.99205Z4-P1-C05-T1 FC Adapter* fcnet3 U5791.001.99205Z4-P1-C05-T1 Fibre Channel Network Protocol Device* fscsi4 U5791.001.99205Z4-P1-C05-T1 FC SCSI I/O Controller Protocol Device* pci8 U5791.001.99205Z4-P1 PCI Bus+ fcs4 U5791.001.99205Z4-P1-C06-T1 FC Adapter* fcnet4 U5791.001.99205Z4-P1-C06-T1 Fibre Channel Network Protocol Device* fscsi3 U5791.001.99205Z4-P1-C06-T1 FC SCSI I/O Controller Protocol Device* hdisk15 U5791.001.99205Z4-P1-C06-T1-W50050768014044F1-LD000000000000 MPIO FC 2145* hdisk16 U5791.001.99205Z4-P1-C06-T1-W50050768014044F1-LE000000000000 MPIO FC 2145* hdisk17 U5791.001.99205Z4-P1-C06-T1-W50050768014044F1-LF000000000000 MPIO FC 2145* pci10 U5791.001.99205Z4-P1 PCI Bus* pci3 U5791.001.99205Z4-P2 PCI Bus* pci6 U5791.001.99205Z4-P2 PCI Bus+ fcs2 U5791.001.99205Z4-P2-C05-T1 FC Adapter* fcnet2 U5791.001.99205Z4-P2-C05-T1 Fibre Channel Network Protocol Device* fscsi2 U5791.001.99205Z4-P2-C05-T1 FC SCSI I/O Controller Protocol Device* hdisk14 U5791.001.99205Z4-P2-C05-T1-W5005076801104417-LC000000000000 MPIO FC 2145* pci2 U5791.001.99205Z4-P2 PCI Bus* pci5 U5791.001.99205Z4-P2 PCI Bus+ fcs1 U5791.001.99205Z4-P2-C02-T1 FC Adapter* fcnet1 U5791.001.99205Z4-P2-C02-T1 Fibre Channel Network Protocol Device* fscsi1 U5791.001.99205Z4-P2-C02-T1 FC SCSI I/O Controller Protocol Device* hdisk2 U5791.001.99205Z4-P2-C02-T1-W50050768013044F1-L0 MPIO FC 2145* hdisk3 U5791.001.99205Z4-P2-C02-T1-W50050768013044F1-L1000000000000 MPIO FC 2145* hdisk4 U5791.001.99205Z4-P2-C02-T1-W50050768013044F1-L2000000000000 MPIO FC 2145* hdisk5 U5791.001.99205Z4-P2-C02-T1-W50050768013044F1-L3000000000000 MPIO FC 2145* hdisk6 U5791.001.99205Z4-P2-C02-T1-W50050768013044F1-L4000000000000 MPIO FC 2145* hdisk7 U5791.001.99205Z4-P2-C02-T1-W50050768013044F1-L5000000000000 MPIO FC 2145……

© 2010 IBM Corporation
AIX Virtual Users Group presentation July 29, 2010
lsdev # note the count&capacity of the component technology of the LPAR
$ lsdevL2cache0 Available L2 Cacheaio0 Available Asynchronous I/O (Legacy)en0 Available 08-08 Standard Ethernet Network Interfaceen1 Defined 0K-08 Standard Ethernet Network Interfaceen2 Defined 0K-09 Standard Ethernet Network Interfaceen3 Defined 0L-08 Standard Ethernet Network Interfaceen4 Defined 0L-09 Standard Ethernet Network Interfaceen5 Available Standard Ethernet Network Interfaceen6 Available Standard Ethernet Network Interfaceen7 Defined 0L-09 Standard Ethernet Network Interfaceent0 Available 08-08 10/100/1000 Base-TX PCI-X Adapter (14106902)ent1 Available 0K-08 2-Port 10/100/1000 Base-TX PCI-X Adapter (14108902)ent2 Available 0K-09 2-Port 10/100/1000 Base-TX PCI-X Adapter (14108902)ent3 Available 0L-08 2-Port 10/100/1000 Base-TX PCI-X Adapter (14108902)ent4 Available 0L-09 2-Port 10/100/1000 Base-TX PCI-X Adapter (14108902)ent5 Available EtherChannel / IEEE 802.3ad Link Aggregationent6 Available EtherChannel / IEEE 802.3ad Link Aggregationet0 Defined 08-08 IEEE 802.3 Ethernet Network Interfaceet1 Defined 0K-08 IEEE 802.3 Ethernet Network Interfaceet2 Defined 0K-09 IEEE 802.3 Ethernet Network Interfaceet3 Defined 0L-08 IEEE 802.3 Ethernet Network Interfaceet4 Defined 0L-09 IEEE 802.3 Ethernet Network Interfaceet5 Defined IEEE 802.3 Ethernet Network Interfaceet6 Defined IEEE 802.3 Ethernet Network Interfaceet7 Defined 0L-09 IEEE 802.3 Ethernet Network Interfacefcnet0 Defined 05-08-01 Fibre Channel Network Protocol Devicefcnet1 Defined 07-08-01 Fibre Channel Network Protocol Devicefcnet2 Defined 0A-08-01 Fibre Channel Network Protocol Devicefcnet3 Defined 0D-08-01 Fibre Channel Network Protocol Devicefcnet4 Defined 0G-08-01 Fibre Channel Network Protocol Devicefcnet5 Defined 0H-08-01 Fibre Channel Network Protocol Devicefcnet6 Defined 0I-08-01 Fibre Channel Network Protocol Devicefcnet7 Defined 0J-08-01 Fibre Channel Network Protocol Devicefcs0 Available 05-08 FC Adapterfcs1 Available 07-08 FC Adapterfcs2 Available 0A-08 FC Adapterfcs3 Available 0D-08 FC Adapterfcs4 Available 0G-08 FC Adapterfcs5 Available 0H-08 FC Adapter……

© 2010 IBM Corporation
AIX Virtual Users Group presentation July 29, 2010
Strategic Thoughts, Concepts, Considerations, and Tactics
Monitoring AIX – Usage, Meaning and Interpretation– Review component technology of the infrastructure, i.e. proper tuning-by-hardware– Review implemented AIX constructs, i.e. “firm” near-static structures and settings– Review historical/accumulated AIX events, usages, pendings, counts, blocks, etc.– Monitor dynamic AIX command behaviors, i.e. ps, vmstat, mpstat, iostat, topas, etc.
Recognizing Common Performance-degrading Scenarios– High Load Average relative to count-of-LCPUs, i.e. “over-threadedness”– vmstat:memory:avm near-to or greater-than lruable-gbRAM, i.e. over-committed– Continuous low vmstat:memory:fre with persistent lrud (fr:sr) activity– Continuous high ratio of vmstat:kthr:b relative to vmstat:kthr:r– Poor ratio of pending I/O waits to iodones in vmstat -s output
Tactical Check-list of What-to-Watch

© 2010 IBM Corporation
AIX Virtual Users Group presentation July 29, 2010
lsps ; mount # review the implemented construction of “firm” AIX structures
$ lsps -aPage Space Physical Volume Volume Group Size %Used Active Auto Typepaging01 hdisk80 pagingvg 32736MB 1 yes yes lvpaging01 hdisk81 pagingvg 32736MB 1 yes yes lvpaging00 hdisk78 pagingvg 32736MB 1 yes yes lvpaging00 hdisk79 pagingvg 32736MB 1 yes yes lvhd6 hdisk0 rootvg 512MB 0 no yes lv
$ lsps -sTotal Paging Space Percent Used
130944MB 1%
$ mountnode mounted mounted over vfs date options
-------- --------------- --------------- ------ ------------ ---------------/dev/hd4 / jfs Oct 20 22:06 rw,log=/dev/hd8/dev/hd2 /usr jfs Oct 20 22:06 rw,log=/dev/hd8/dev/hd9var /var jfs Oct 20 22:06 rw,log=/dev/hd8/dev/hd3 /tmp jfs Oct 20 22:06 rw,log=/dev/hd8/dev/hd1 /home jfs Oct 20 22:08 rw,log=/dev/hd8/proc /proc procfs Oct 20 22:08 rw/dev/hd10opt /opt jfs Oct 20 22:08 rw,log=/dev/hd8/dev/lvsapcds /sapcds jfs2 Oct 20 22:08 rw,log=/dev/lv00/dev/lvcnvbt /cnv jfs2 Oct 20 22:20 rw,log=/dev/lvjfs00/dev/lvhrtmpbt /hrtmp jfs2 Oct 20 22:20 rw,log=/dev/lvjfs00/dev/lvoraclebt /oracle jfs2 Oct 20 22:20 rw,log=/dev/lvjfs00/dev/lvorapr1bt /oracle/PR1 jfs2 Oct 20 22:20 rw,log=/dev/lvjfs00/dev/lvmirrlogAp /oracle/PR1/mirrlogA jfs2 Oct 20 22:20 rw,log=/dev/lvjfs20/dev/lvmirrlogBp /oracle/PR1/mirrlogB jfs2 Oct 20 22:20 rw,log=/dev/lvjfs20/dev/lvoriglogAp /oracle/PR1/origlogA jfs2 Oct 20 22:20 rw,log=/dev/lvjfs20/dev/lvoriglogBp /oracle/PR1/origlogB jfs2 Oct 20 22:20 rw,log=/dev/lvjfs20/dev/lvsaparchbt /oracle/PR1/saparch jfs2 Oct 20 22:20 rw,log=/dev/lvjfs00/dev/lvsapdata1bt /oracle/PR1/sapdata1 jfs2 Oct 20 22:20 rw,log=/dev/lvjfs01/dev/lvsapdata18bt /oracle/PR1/sapdata10 jfs2 Oct 20 22:20 rw,log=/dev/lvjfs10/dev/lvsapdata11bt /oracle/PR1/sapdata11 jfs2 Oct 20 22:20 rw,log=/dev/lvjfs11/dev/lvsapdata24bt /oracle/PR1/sapdata12 jfs2 Oct 20 22:20 rw,log=/dev/lvjfs12/dev/lvsapdata2bt /oracle/PR1/sapdata2 jfs2 Oct 20 22:20 rw,log=/dev/lvjfs02/dev/lvsapdata3bt /oracle/PR1/sapdata3 jfs2 Oct 20 22:20 rw,log=/dev/lvjfs03/dev/lvsapdata14bt /oracle/PR1/sapdata4 jfs2 Oct 20 22:20 rw,log=/dev/lvjfs04/dev/lvsapdata23bt /oracle/PR1/sapdata5 jfs2 Oct 20 22:20 rw,log=/dev/lvjfs05/dev/lvsapdata16bt /oracle/PR1/sapdata6 jfs2 Oct 20 22:20 rw,log=/dev/lvjfs06/dev/lvsapdata7bt /oracle/PR1/sapdata7 jfs2 Oct 20 22:20 rw,log=/dev/lvjfs07
……

© 2010 IBM Corporation
AIX Virtual Users Group presentation July 29, 2010
df -k # review the implemented construction of “firm” AIX structures; observe count-of-inodes per GBs(used) of each application’s data filesystems
$ df -kFilesystem 1024-blocks Free %Used Iused %Iused Mounted on/dev/hd4 262144 129016 51% 3777 3% //dev/hd2 3932160 544280 87% 42721 5% /usr/dev/hd9var 1048576 334980 69% 4293 2% /var/dev/hd3 1048576 731832 31% 519 1% /tmp/dev/hd1 262144 63632 76% 2622 5% /home/proc - - - - - /proc/dev/hd10opt 262144 213832 19% 849 2% /opt/dev/lvsapcds 2097152 456840 79% 1246 2% /sapcds/dev/lvcnvbt 20480000 16993664 18% 715 1% /cnv/dev/lvhrtmpbt 524288 506984 4% 30 1% /hrtmp/dev/lvoraclebt 524288 436808 17% 2938 3% /oracle/dev/lvorapr1bt 8978432 3838252 58% 21476 3% /oracle/PR1/dev/lvmirrlogAp 3080192 2567348 17% 6 1% /oracle/PR1/mirrlogA/dev/lvmirrlogBp 3080192 2567348 17% 6 1% /oracle/PR1/mirrlogB/dev/lvoriglogAp 3080192 2567348 17% 6 1% /oracle/PR1/origlogA/dev/lvoriglogBp 3080192 2567348 17% 6 1% /oracle/PR1/origlogB/dev/lvsaparchbt 14680064 14296480 3% 7176 1% /oracle/PR1/saparch/dev/lvsapdata1bt 268173312 73734764 73% 116 1% /oracle/PR1/sapdata1/dev/lvsapdata18bt 268173312 73751196 73% 108 1% /oracle/PR1/sapdata10/dev/lvsapdata11bt 268173312 77027948 72% 108 1% /oracle/PR1/sapdata11/dev/lvsapdata24bt 268173312 75455208 72% 108 1% /oracle/PR1/sapdata12/dev/lvsapdata2bt 268173312 76225148 72% 110 1% /oracle/PR1/sapdata2/dev/lvsapdata3bt 268173312 75569716 72% 110 1% /oracle/PR1/sapdata3/dev/lvsapdata14bt 268173312 74930816 73% 108 1% /oracle/PR1/sapdata4/dev/lvsapdata23bt 268173312 77814376 71% 108 1% /oracle/PR1/sapdata5/dev/lvsapdata16bt 268173312 79387368 71% 108 1% /oracle/PR1/sapdata6/dev/lvsapdata7bt 268173312 74013420 73% 108 1% /oracle/PR1/sapdata7/dev/lvsapdata8bt 268173312 75192876 72% 108 1% /oracle/PR1/sapdata8/dev/lvsapdata19bt 268173312 74668728 73% 108 1% /oracle/PR1/sapdata9/dev/lvsapreorgbt 25165824 19272876 24% 1153 1% /oracle/PR1/sapreorg/dev/lvostage 2097152 1957092 7% 794 1% /oracle/stage/dev/lvsapmntbt 2097152 1447736 31% 357 1% /sapmnt/PR1……

© 2010 IBM Corporation
AIX Virtual Users Group presentation July 29, 2010
df –k # review the implemented construction of “firm” AIX structures; observe count-of-inodes per GBs(used) of each application’s data filesystems using Excel
1,834,710,130 1791709.1193504584/oracle/PR1/sapdata910874668728268173312/dev/lvsapdata19bt
1,829,740,430 1786855.9192980436/oracle/PR1/sapdata810875192876268173312/dev/lvsapdata8bt
1,840,923,420 1797776.8194159892/oracle/PR1/sapdata710874013420268173312/dev/lvsapdata7bt
1,789,970,432 1748018.0188785944/oracle/PR1/sapdata610879387368268173312/dev/lvsapdata16bt
1,804,884,727 1762582.7190358936/oracle/PR1/sapdata510877814376268173312/dev/lvsapdata23bt
1,832,225,147 1789282.4193242496/oracle/PR1/sapdata410874930816268173312/dev/lvsapdata14bt
1,792,964,385 1750941.8192603596/oracle/PR1/sapdata311075569716268173312/dev/lvsapdata3bt
1,786,862,909 1744983.3191948164/oracle/PR1/sapdata211076225148268173312/dev/lvsapdata2bt
1,827,253,134 1784426.9192718104/oracle/PR1/sapdata1210875455208268173312/dev/lvsapdata24bt
1,812,341,229 1769864.5191145364/oracle/PR1/sapdata1110877027948268173312/dev/lvsapdata11bt
1,843,409,692 1800204.8194422116/oracle/PR1/sapdata1010873751196268173312/dev/lvsapdata18bt
1,716,423,044 1676194.4194438548/oracle/PR1/sapdata111673734764268173312/dev/lvsapdata1bt
54,737 53.5383584/oracle/PR1/saparch71761429648014680064/dev/lvsaparchbt
87,525,376 85474.0512844/oracle/PR1/origlogB625673483080192/dev/lvoriglogBp
avg bytes/inode
avg blocks-per-inode
1024-blocks UsedMounted onIusedFree1024-blocksFilesystem
© 2010 IBM Corporation
AIX Virtual Users Group presentation July 29, 2010
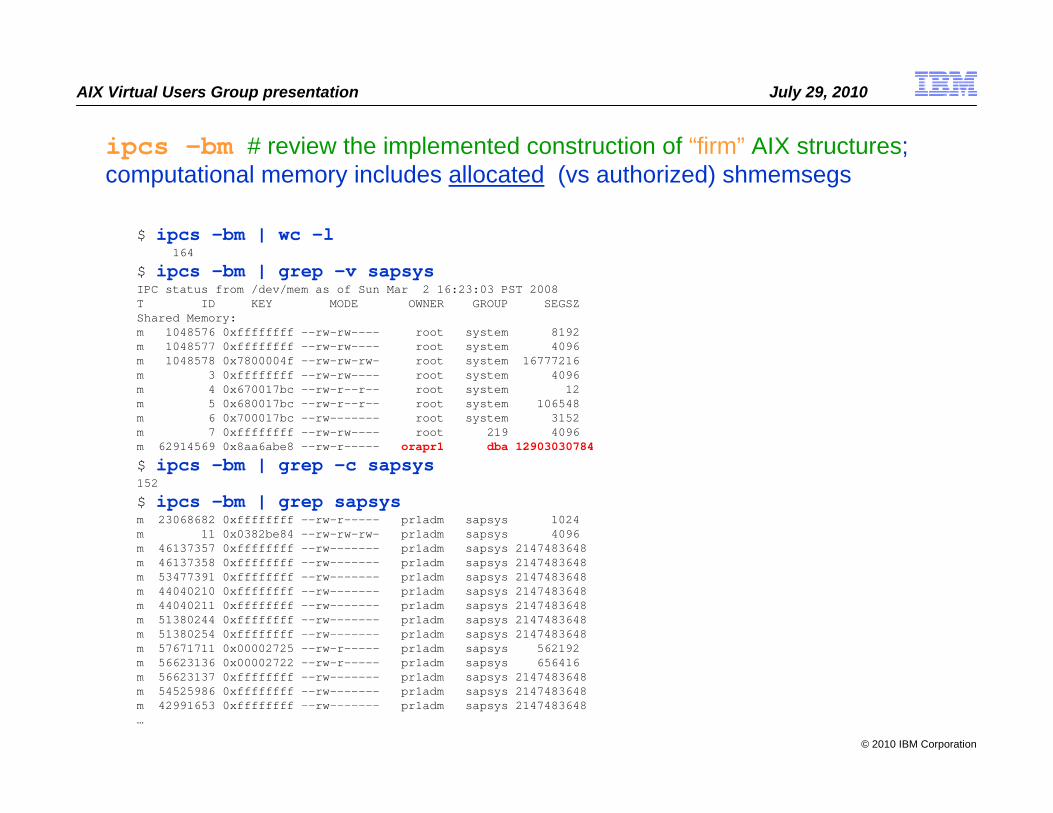
ipcs -bm # review the implemented construction of “firm” AIX structures; computational memory includes allocated (vs authorized) shmemsegs
$ ipcs -bm | wc -l164
$ ipcs -bm | grep -v sapsysIPC status from /dev/mem as of Sun Mar 2 16:23:03 PST 2008T ID KEY MODE OWNER GROUP SEGSZShared Memory:m 1048576 0xffffffff --rw-rw---- root system 8192m 1048577 0xffffffff --rw-rw---- root system 4096m 1048578 0x7800004f --rw-rw-rw- root system 16777216m 3 0xffffffff --rw-rw---- root system 4096m 4 0x670017bc --rw-r--r-- root system 12m 5 0x680017bc --rw-r--r-- root system 106548m 6 0x700017bc --rw------- root system 3152m 7 0xffffffff --rw-rw---- root 219 4096m 62914569 0x8aa6abe8 --rw-r----- orapr1 dba 12903030784
$ ipcs -bm | grep -c sapsys152
$ ipcs -bm | grep sapsysm 23068682 0xffffffff --rw-r----- pr1adm sapsys 1024m 11 0x0382be84 --rw-rw-rw- pr1adm sapsys 4096m 46137357 0xffffffff --rw------- pr1adm sapsys 2147483648m 46137358 0xffffffff --rw------- pr1adm sapsys 2147483648m 53477391 0xffffffff --rw------- pr1adm sapsys 2147483648m 44040210 0xffffffff --rw------- pr1adm sapsys 2147483648m 44040211 0xffffffff --rw------- pr1adm sapsys 2147483648m 51380244 0xffffffff --rw------- pr1adm sapsys 2147483648m 51380254 0xffffffff --rw------- pr1adm sapsys 2147483648m 57671711 0x00002725 --rw-r----- pr1adm sapsys 562192m 56623136 0x00002722 --rw-r----- pr1adm sapsys 656416m 56623137 0xffffffff --rw------- pr1adm sapsys 2147483648m 54525986 0xffffffff --rw------- pr1adm sapsys 2147483648m 42991653 0xffffffff --rw------- pr1adm sapsys 2147483648…

© 2010 IBM Corporation
AIX Virtual Users Group presentation July 29, 2010
vmo; ioo # review the implemented construction of “firm” AIX structures
$ vmo –L ; ioo –L
NAME CUR DEF BOOT MIN MAX UNIT TYPEDEPENDENCIES
--------------------------------------------------------------------------------cpu_scale_memp 8 8 8 1 64 B--------------------------------------------------------------------------------data_stagger_interval 161 161 161 0 4K-1 4KB pages D
lgpg_regions--------------------------------------------------------------------------------defps 1 1 1 0 1 boolean D--------------------------------------------------------------------------------force_relalias_lite 0 0 0 0 1 boolean D--------------------------------------------------------------------------------framesets 2 2 2 1 10 B--------------------------------------------------------------------------------htabscale n/a -1 -1 -4 0 B--------------------------------------------------------------------------------kernel_heap_psize 4K 4K 4K 4K 16M bytes B--------------------------------------------------------------------------------kernel_psize 16M 0 0 0 16M bytes B--------------------------------------------------------------------------------……NAME CUR DEF BOOT MIN MAX UNIT TYPE
DEPENDENCIES--------------------------------------------------------------------------------j2_atimeUpdateSymlink 0 0 0 0 1 boolean D--------------------------------------------------------------------------------j2_dynamicBufferPreallocation
16 16 16 0 256 16K slabs D--------------------------------------------------------------------------------j2_inodeCacheSize 400 400 400 1 1000 D--------------------------------------------------------------------------------j2_maxPageReadAhead 128 128 128 0 64K 4KB pages D--------------------------------------------------------------------------------j2_maxRandomWrite 0 0 0 0 64K 4KB pages D--------------------------------------------------------------------------------j2_maxUsableMaxTransfer 512 512 512 1 4K pages M--------------------------------------------------------------------------------j2_metadataCacheSize 400 400 400 1 1000 D--------------------------------------------------------------------------------…
© 2010 IBM Corporation
AIX Virtual Users Group presentation July 29, 2010
Strategic Thoughts, Concepts, Considerations, and Tactics
Monitoring AIX – Usage, Meaning and Interpretation– Review component technology of the infrastructure, i.e. proper tuning-by-hardware– Review implemented AIX constructs, i.e. “firm” near-static structures and settings– Review historical/accumulated AIX events, usages, pendings, counts, blocks, etc.– Monitor dynamic AIX command behaviors, i.e. ps, vmstat, mpstat, iostat, topas, etc.
Recognizing Common Performance-degrading Scenarios– High Load Average relative to count-of-LCPUs, i.e. “over-threadedness”– vmstat:memory:avm near-to or greater-than lruable-gbRAM, i.e. over-committed– Continuous low vmstat:memory:fre with persistent lrud (fr:sr) activity– Continuous high ratio of vmstat:kthr:b relative to vmstat:kthr:r– Poor ratio of pending I/O waits to iodones in vmstat -s output
Tactical Check-list of What-to-Watch

© 2010 IBM Corporation
AIX Virtual Users Group presentation July 29, 2010
uptime; vmstat –s # Review accumulated count-of-events over days-uptime
10:41AM up 476 days, 13:43, 3 users, load average: 2.83, 3.27, 3.21
2567604831 total address trans. faults
130578171 page ins
316967129 page outs
546 paging space page ins
1543 paging space page outs
0 total reclaims
1092529772 zero filled pages faults
452788 executable filled pages faults
179739818 pages examined by clock
74 revolutions of the clock hand
72866299 pages freed by the clock
27734778 backtracks
300 free frame waits
9 extend XPT waits
14914462 pending I/O waits
406381092 start I/Os
161907544 iodones
13393500872 cpu context switches
1220683619 device interrupts
4305860328 software interrupts
13540901246 decrementer interrupts
71006911 mpc-sent interrupts
71003781 mpc-receive interrupts
10548539 phantom interrupts
0 traps
35581373075 syscalls

© 2010 IBM Corporation
AIX Virtual Users Group presentation July 29, 2010
vmstat –s # Writes to standard output the contents of the sum structure, which contains an absolute count of paging events since system initialization.
address translation faultsIncremented for each occurrence of an address translation page fault. I/O may or may not be required toresolve the page fault. Storage protection page faults (lock misses) are not included in this count.
page insIncremented for each page read in by the virtual memory manager. The count is incremented for page insfrom page space and file space. Along with the page out statistic, this represents the total amount ofreal I/O initiated by the virtual memory manager.
page outsIncremented for each page written out by the virtual memory manager. The count is incremented forpage outs to page space and for page outs to file space. Along with the page in statistic, this representsthe total amount of real I/O initiated by the virtual memory manager.
paging space page insIncremented for VMM initiated page ins from paging space only.
paging space page outsIncremented for VMM initiated page outs to paging space only.
…pages examined by the clock
VMM uses a clock-algorithm to implement a pseudo least recently used (lru) page replacement scheme.Pages are aged by being examined by the clock. This count is incremented for each page examined by the clock.
revolutions of the clock handIncremented for each VMM clock revolution (that is, after each complete scan of memory).
pages freed by the clockIncremented for each page the clock algorithm selects to free from real memory.
[ Continued ]

© 2010 IBM Corporation
AIX Virtual Users Group presentation July 29, 2010
vmstat –s # [continued] Writes to standard output the contents of the sum structure, which contains an absolute count of paging events since system initialization.
backtracksIncremented for each page fault that occurs while resolving a previous page fault. (The new page fault must be resolved
first and then initial page faults can be backtracked.) free frame waits
Incremented each time a process requests a page frame, the free list is empty, and the process is forced to wait while the free list is replenished.
extend XPT waitsIncremented each time a process is waited by VMM due to a commit in progress for the segment being accessed.
pending I/O waitsIncremented each time a process is waited by VMM for a page-in I/O to complete.
start I/OsIncremented for each read or write I/O request initiated by VMM.
iodonesIncremented at the completion of each VMM I/O request.
CPU context switchesIncremented for each processor context switch (dispatch of a new process).
device interruptsIncremented on each hardware interrupt.
software interruptsIncremented on each software interrupt. A software interrupt is a machine instruction similar to a hardware interrupt that
saves some state and branches to a service routine. System calls are implemented with software interrupt instructions that branch to the system call handler routine.
decrementer interruptsIncremented on each decrementer interrupt.
…

© 2010 IBM Corporation
AIX Virtual Users Group presentation July 29, 2010
uptime; vmstat –v # Review accumulated count-of-events over days-uptime
10:41AM up 476 days, 13:43, 3 users, load average: 2.83, 3.27, 3.21
5095423 memory pages
4856881 lruable pages
1521046 free pages
2 memory pools
463852 pinned pages
80.0 maxpin percentage
5.0 minperm percentage
80.0 maxperm percentage
18.5 numperm percentage
901533 file pages
0.0 compressed percentage
0 compressed pages
18.2 numclient percentage
80.0 maxclient percentage
887137 client pages
0 remote pageouts scheduled
2910 pending disk I/Os blocked with no pbuf
0 paging space I/Os blocked with no psbuf
132276 filesystem I/Os blocked with no fsbuf
368343 client filesystem I/Os blocked with no fsbuf
2066915 external pager filesystem I/Os blocked with no fsbuf

© 2010 IBM Corporation
AIX Virtual Users Group presentation July 29, 2010
vmstat –v # Writes to standard output various statistics maintained by the Virtual Memory Manager. The -v flag can only be used with the -s flag.
memory pagesSize of real memory in number of 4 KB pages.
lruable pagesNumber of 4 KB pages considered for replacement. This number excludes the pages used for VMM internal pages, and
the pages used for the pinned part of the kernel text.
free pagesNumber of free 4 KB pages.
memory poolsTuning parameter (managed using vmo) specifying the number of memory pools.
pinned pagesNumber of pinned 4 KB pages.
maxpin percentageTuning parameter (managed using vmo) specifying the percentage of real memory which can be pinned.
minperm percentageTuning parameter (managed using vmo) in percentage of real memory. This specifies the point below which file pages
are protected from the re-page algorithm.
maxperm percentageTuning parameter (managed using vmo) in percentage of real memory. This specifies the point above which the page
stealing algorithm steals only file pages.
numperm percentagePercentage of memory currently used by the file cache.
[ Continued ]
© 2010 IBM Corporation
AIX Virtual Users Group presentation July 29, 2010
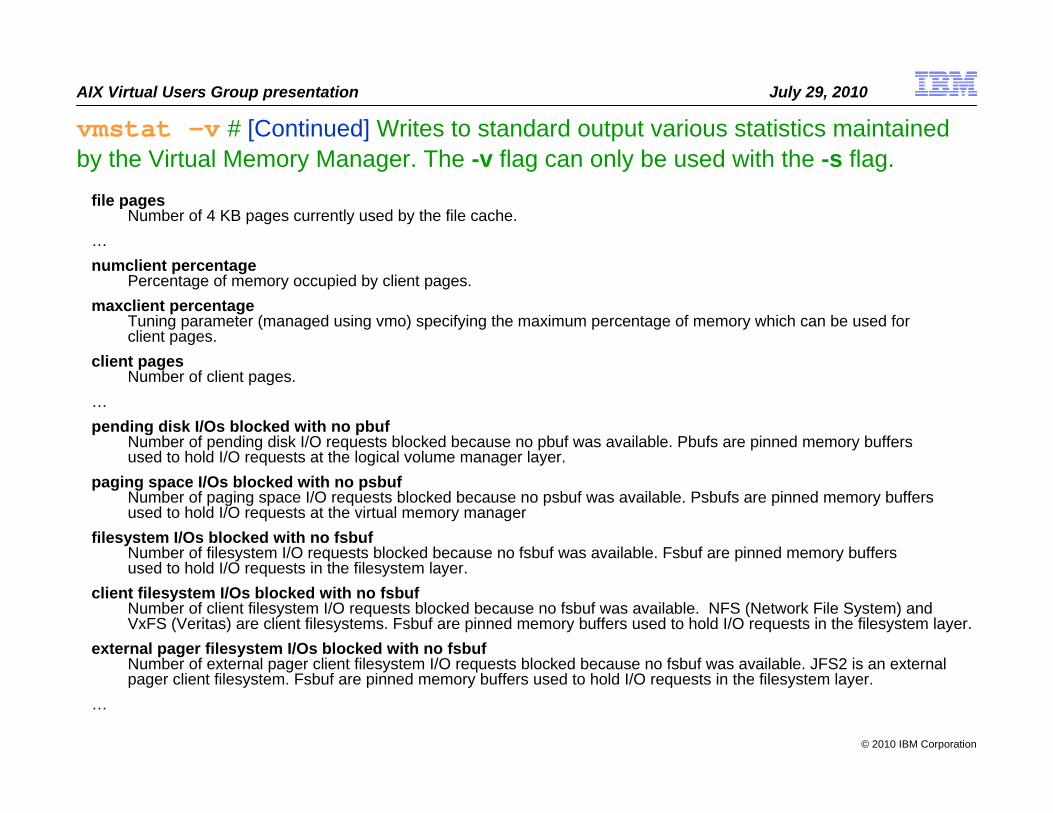
vmstat –v # [Continued] Writes to standard output various statistics maintained by the Virtual Memory Manager. The -v flag can only be used with the -s flag.
file pagesNumber of 4 KB pages currently used by the file cache.
…numclient percentage
Percentage of memory occupied by client pages. maxclient percentage
Tuning parameter (managed using vmo) specifying the maximum percentage of memory which can be used forclient pages.
client pagesNumber of client pages.
…pending disk I/Os blocked with no pbuf
Number of pending disk I/O requests blocked because no pbuf was available. Pbufs are pinned memory buffersused to hold I/O requests at the logical volume manager layer.
paging space I/Os blocked with no psbufNumber of paging space I/O requests blocked because no psbuf was available. Psbufs are pinned memory buffersused to hold I/O requests at the virtual memory manager
filesystem I/Os blocked with no fsbufNumber of filesystem I/O requests blocked because no fsbuf was available. Fsbuf are pinned memory buffersused to hold I/O requests in the filesystem layer.
client filesystem I/Os blocked with no fsbufNumber of client filesystem I/O requests blocked because no fsbuf was available. NFS (Network File System) andVxFS (Veritas) are client filesystems. Fsbuf are pinned memory buffers used to hold I/O requests in the filesystem layer.
external pager filesystem I/Os blocked with no fsbufNumber of external pager client filesystem I/O requests blocked because no fsbuf was available. JFS2 is an external pager client filesystem. Fsbuf are pinned memory buffers used to hold I/O requests in the filesystem layer.
…

© 2010 IBM Corporation
AIX Virtual Users Group presentation July 29, 2010
ps -ekf # cumulative since last boot; compare CPU-time of key processes$ uptime ; ps -ekf | grep -v grep | egrep "syncd|lrud|nfsd|biod|wait"10:58AM up 133 days, 13:45, 3 users, load average: 19.01, 19.32, 19.28
root 8196 0 0 Oct 20 - 2218:47 waitroot 16392 0 9 Oct 20 - 17178:29 lrudroot 53274 0 0 Oct 20 - 8461:10 waitroot 57372 0 0 Oct 20 - 1335:46 waitroot 61470 0 0 Oct 20 - 6073:45 waitroot 65568 0 0 Oct 20 - 1374:15 waitroot 69666 0 0 Oct 20 - 5560:02 waitroot 73764 0 0 Oct 20 - 1331:34 waitroot 77862 0 0 Oct 20 - 4979:33 waitroot 81960 0 0 Oct 20 - 1260:27 waitroot 86058 0 0 Oct 20 - 4369:40 waitroot 90156 0 0 Oct 20 - 965:50 waitroot 94254 0 0 Oct 20 - 3300:50 waitroot 98352 0 0 Oct 20 - 826:15 waitroot 102450 0 0 Oct 20 - 2657:03 waitroot 106548 0 0 Oct 20 - 681:51 waitroot 110646 0 0 Oct 20 - 2107:25 waitroot 114744 0 0 Oct 20 - 581:12 waitroot 118842 0 0 Oct 20 - 1709:27 waitroot 122940 0 0 Oct 20 - 385:38 waitroot 127038 0 0 Oct 20 - 1047:36 waitroot 131136 0 0 Oct 20 - 294:26 waitroot 135234 0 0 Oct 20 - 731:46 waitroot 139332 0 0 Oct 20 - 185:51 waitroot 143430 0 0 Oct 20 - 382:23 waitroot 266430 1 0 Oct 20 - 1008:28 /usr/sbin/syncd 60root 1429696 0 0 Oct 20 - 0:25 kbiodroot 1540176 1437714 0 Oct 20 - 0:00 /usr/sbin/nfsd 3891root 1646808 1 0 Oct 20 - 506:30 nfsdroot 1728526 1437714 0 Oct 20 - 0:00 /usr/sbin/biod 6
$ uptime ; ps -ekf | grep -v grep | egrep "syncd|lrud|nfsd|biod|wait" | grep -c wait10:58AM up 133 days, 13:45, 3 users, load average: 19.02, 19.32, 19.2824$

© 2010 IBM Corporation
AIX Virtual Users Group presentation July 29, 2010
iostat –a # cumulative since last boot; Create a complete tech-stack map, ie. RAIDset/tech->LUN->[LVMvg:lv::JFS2mtpt w/options]->logical_contentSystem configuration: lcpu=24 drives=48 ent=1.20 paths=268 vdisks=0 tapes=38
tty: tin tout avg-cpu: % user % sys % idle % iowait physc % entc
0.1 35.5 65.7 31.4 1.0 1.9 0.2 17.7
Adapter: Kbps tps Kb_read Kb_wrtn
sisscsia0 2444.4 35.4 25807797 16239911633
Disks: % tm_act Kbps tps Kb_read Kb_wrtn
hdisk1 3.9 1220.1 17.6 789737 8118447840
hdisk0 4.2 1224.2 17.8 25018060 8121463793
Adapter: Kbps tps Kb_read Kb_wrtn
fcs1 26782.8 1440.5 149036558282 29184434960
Disks: % tm_act Kbps tps Kb_read Kb_wrtn
hdisk8 2.2 607.3 1.5 2164957533 1876147460
hdisk12 2.4 607.7 1.3 2065741964 1978282924
hdisk13 2.2 582.8 1.3 2002751079 1875515764
hdisk11 2.1 593.4 1.3 2073048903 1875758716
hdisk4 1.9 216.3 23.9 812230724 626802460
hdisk15 0.0 2.2 0.6 25584 14666516
…
Adapter: Kbps tps Kb_read Kb_wrtn
fcs3 26885.6 1444.5 149683495110 29221969816
Disks: % tm_act Kbps tps Kb_read Kb_wrtn
hdisk8 2.1 622.7 1.5 2176121655 1967240656
hdisk12 2.5 592.0 1.3 2071882880 1867155292
hdisk13 2.2 597.8 1.3 2009693373 1967933716
hdisk11 2.1 608.0 1.3 2077880225 1967693560
hdisk4 1.9 216.7 23.9 813889906 627809836
hdisk15 0.0 2.2 0.6 27670 14749344
…

© 2010 IBM Corporation
AIX Virtual Users Group presentation July 29, 2010
iostat –a # cumulative since last boot; mapping&comparing hdisks stats can be useful in characterizing performance-related I/O patterns&trends
Disks: % tm_act Kbps tps Kb_read Kb_wrtn
hdisk8 2.2 607.3 1.5 2164957533 1876147460
hdisk12 2.4 607.7 1.3 2065741964 1978282924
hdisk13 2.2 582.8 1.3 2002751079 1875515764
hdisk11 2.1 593.4 1.3 2073048903 1875758716
hdisk4 1.9 216.3 23.9 812230724 626802460
hdisk15 0.0 2.2 0.6 25584 14666516
hdisk16 11.5 178.7 23.6 1169343088 19983468
hdisk14 0.0 1.3 0.0 8828331 0
hdisk10 6.3 548.9 7.8 3617545529 35278292
hdisk17 0.0 0.0 0.0 8560 0
hdisk18 0.0 3.0 0.1 9741142 10386688
hdisk7 0.4 53.3 7.6 272419695 82268236
hdisk5 0.6 59.4 6.5 225752039 169601848
hdisk6 2.3 624.3 1.5 2175672098 1978387280
hdisk9 2.3 613.6 1.4 2104140790 1978677528
hdisk20 8.1 228.3 35.1 1511885833 7496668
hdisk21 1.6 99.7 24.8 16230194 647254280
hdisk22 15.9 845.2 58.4 5592808968 31384956
hdisk23 3.5 364.2 60.4 1627955714 795383552
hdisk25 20.3 740.1 36.5 4725304221 199399144
hdisk27 20.1 1015.2 45.8 6675326923 80385252
hdisk26 41.3 2934.5 118.0 18806493859 720917972
hdisk29 19.2 949.4 55.7 6113262738 204348212
hdisk24 25.8 1867.8 59.4 12330198268 98946776
hdisk30 16.9 515.9 38.4 3271643603 161247332
hdisk32 5.1 555.4 34.2 888509245 2807296084
hdisk31 11.7 483.8 71.1 3111959749 107262760
hdisk33 47.2 2760.0 153.7 18308894936 56985180
hdisk36 2.4 597.9 1.3 2103249842 1875221640
hdisk35 2.8 616.8 1.4 2126412342 1977828244
…

© 2010 IBM Corporation
AIX Virtual Users Group presentation July 29, 2010
iostat –D # cumulative since last boot; mapping&comparing hdisks stats is useful in characterizing performance-related I/O patterns&trends
$ iostat -D
System configuration: lcpu=24 drives=87 paths=172 vdisks=0
hdisk0 xfer: %tm_act bps tps bread bwrtn0.8 18.7K 2.3 7.0K 11.7K
read: rps avgserv minserv maxserv timeouts fails0.6 3.0 0.1 267.1 0 0
write: wps avgserv minserv maxserv timeouts fails1.7 5.5 0.3 320.5 0 0
queue: avgtime mintime maxtime avgwqsz avgsqsz sqfull8.8 0.0 291.3 0.0 0.0 6349911
hdisk1 xfer: %tm_act bps tps bread bwrtn0.6 12.9K 1.7 1.2K 11.7K
read: rps avgserv minserv maxserv timeouts fails0.0 4.8 0.1 301.8 0 0
write: wps avgserv minserv maxserv timeouts fails1.7 5.4 0.4 281.1 0 0
queue: avgtime mintime maxtime avgwqsz avgsqsz sqfull11.3 0.0 275.6 0.0 0.0 6102418
…hdisk86 xfer: %tm_act bps tps bread bwrtn
10.2 789.3K 33.1 753.9K 35.4Kread: rps avgserv minserv maxserv timeouts fails
30.6 6.5 0.1 1.3S 0 0write: wps avgserv minserv maxserv timeouts fails
2.5 2.5 0.2 912.0 0 0queue: avgtime mintime maxtime avgwqsz avgsqsz sqfull
4.3 0.0 1.1S 0.0 0.0 73320194hdisk87 xfer: %tm_act bps tps bread bwrtn
10.1 801.6K 33.7 764.2K 37.4Kread: rps avgserv minserv maxserv timeouts fails
31.2 6.3 0.1 1.2S 0 0write: wps avgserv minserv maxserv timeouts fails
2.5 2.5 0.2 913.1 0 0queue: avgtime mintime maxtime avgwqsz avgsqsz sqfull
4.3 0.0 1.2S 0.0 0.0 74160810…
© 2010 IBM Corporation
AIX Virtual Users Group presentation July 29, 2010
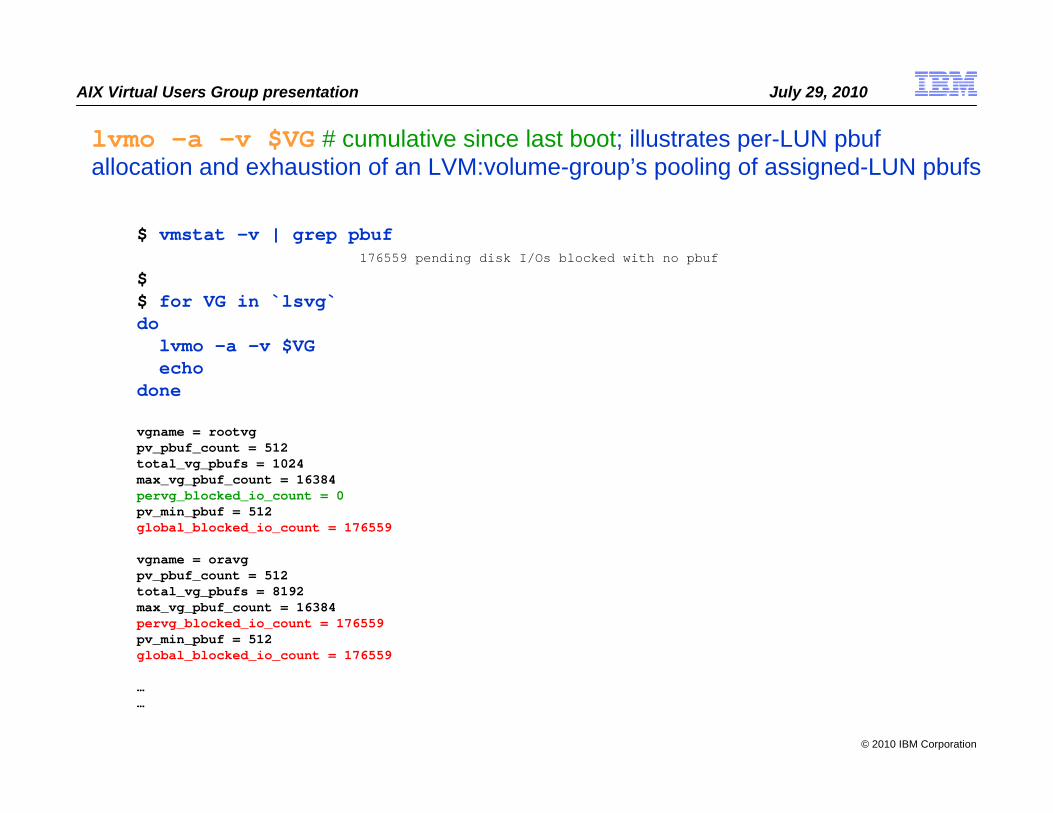
lvmo –a –v $VG # cumulative since last boot; illustrates per-LUN pbufallocation and exhaustion of an LVM:volume-group’s pooling of assigned-LUN pbufs
$ vmstat -v | grep pbuf176559 pending disk I/Os blocked with no pbuf
$$ for VG in `lsvg`do
lvmo -a -v $VGecho
done
vgname = rootvgpv_pbuf_count = 512total_vg_pbufs = 1024max_vg_pbuf_count = 16384pervg_blocked_io_count = 0pv_min_pbuf = 512global_blocked_io_count = 176559
vgname = oravgpv_pbuf_count = 512total_vg_pbufs = 8192max_vg_pbuf_count = 16384pervg_blocked_io_count = 176559pv_min_pbuf = 512global_blocked_io_count = 176559
……

© 2010 IBM Corporation
AIX Virtual Users Group presentation July 29, 2010
netstat –ss # cumulative since last boot; displays only non-zero values (this is an undocumented command-option of netstat)
$ netstat -ssip:
343290037 total packets received257309 fragments received5 fragments dropped after timeout128641 packets reassembled ok98
337255449 packets for this host5871563 packets for unknown/unsupported protocol396 packets not forwardable3083156934 packets sent from this host71209 output datagrams fragmented149137 fragments created2 packets dropped due to the full socket receive buffer2115340 dead gateway detection packets sent
icmp:5884385 calls to icmp_errorOutput histogram:
echo reply: 1792801destination unreachable: 5884312
707 messages with bad code fields1 bad checksumInput histogram:
echo reply: 2118565destination unreachable: 5871963echo: 1792801
1792801 message responses generatedigmp:
6 messages received6 membership reports received6 membership reports received for groups to which we belong4 membership reports sent
tcp:2416410139 packets sent
2830792567 data packets (3879350818 bytes)14816541 data packets (1123365316 bytes) retransmitted614103879 ack-only packets (290291730 delayed)19 URG only packets56895 window probe packets
……

© 2010 IBM Corporation
AIX Virtual Users Group presentation July 29, 2010
netstat –v # cumulative since last boot; verbose display of netstat statistics
$ netstat -v……-------------------------------------------------------------ETHERNET STATISTICS (ent7) :Device Type: EtherChannelHardware Address: 00:14:5e:48:c1:ccElapsed Time: 134 days 0 hours 21 minutes 27 seconds
Transmit Statistics: Receive Statistics:-------------------- -------------------Packets: 34718204002 Packets: 44862435158Bytes: 48050223811333 Bytes: 9016251735773Interrupts: 0 Interrupts: 27620561406Transmit Errors: 0 Receive Errors: 0Packets Dropped: 2 Packets Dropped: 0
Bad Packets: 0Max Packets on S/W Transmit Queue: 227S/W Transmit Queue Overflow: 0Current S/W+H/W Transmit Queue Length: 2
Elapsed Time: 0 days 0 hours 0 minutes 0 secondsBroadcast Packets: 14384 Broadcast Packets: 627555Multicast Packets: 1 Multicast Packets: 3No Carrier Sense: 0 CRC Errors: 0DMA Underrun: 0 DMA Overrun: 0Lost CTS Errors: 0 Alignment Errors: 0Max Collision Errors: 0 No Resource Errors: 0Late Collision Errors: 0 Receive Collision Errors: 0Deferred: 0 Packet Too Short Errors: 0SQE Test: 0 Packet Too Long Errors: 0Timeout Errors: 0 Packets Discarded by Adapter: 0Single Collision Count: 0 Receiver Start Count: 0Multiple Collision Count: 0Current HW Transmit Queue Length: 2
General Statistics:-------------------No mbuf Errors: 0Adapter Reset Count: 0Adapter Data Rate: 2000……
© 2010 IBM Corporation
AIX Virtual Users Group presentation July 29, 2010
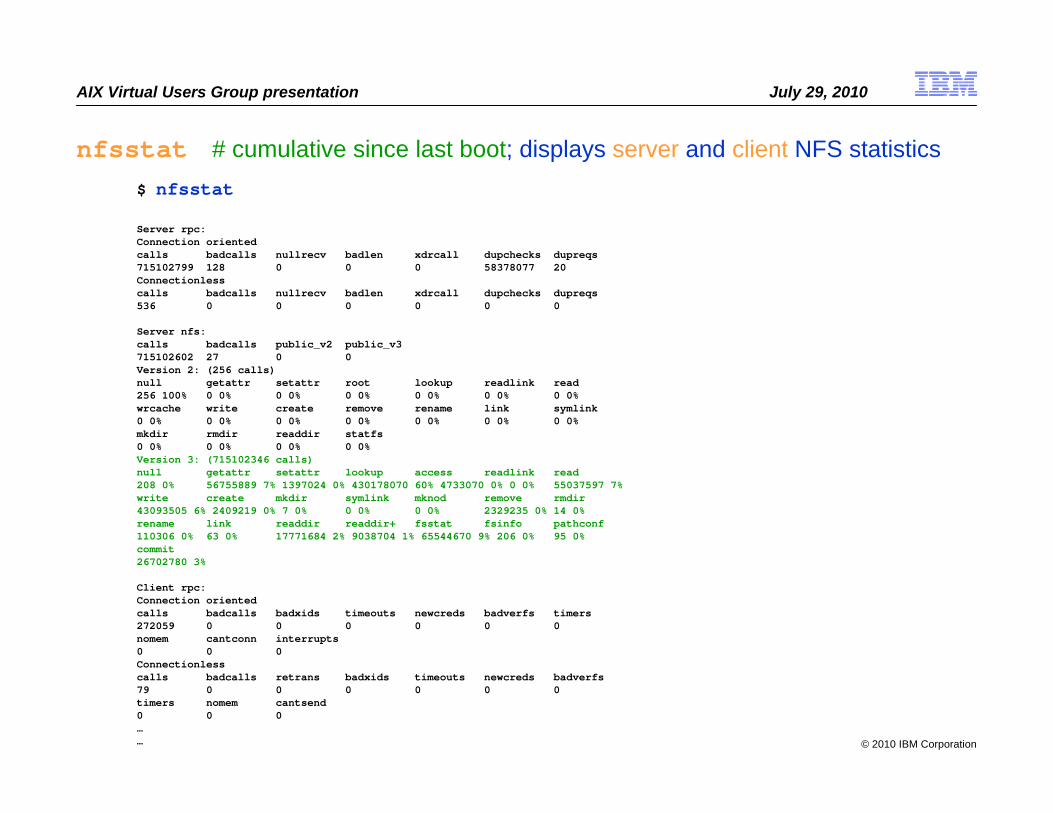
nfsstat # cumulative since last boot; displays server and client NFS statistics$ nfsstat
Server rpc:Connection orientedcalls badcalls nullrecv badlen xdrcall dupchecks dupreqs715102799 128 0 0 0 58378077 20Connectionlesscalls badcalls nullrecv badlen xdrcall dupchecks dupreqs536 0 0 0 0 0 0
Server nfs:calls badcalls public_v2 public_v3715102602 27 0 0Version 2: (256 calls)null getattr setattr root lookup readlink read256 100% 0 0% 0 0% 0 0% 0 0% 0 0% 0 0%wrcache write create remove rename link symlink0 0% 0 0% 0 0% 0 0% 0 0% 0 0% 0 0%mkdir rmdir readdir statfs0 0% 0 0% 0 0% 0 0%Version 3: (715102346 calls)null getattr setattr lookup access readlink read208 0% 56755889 7% 1397024 0% 430178070 60% 4733070 0% 0 0% 55037597 7%write create mkdir symlink mknod remove rmdir43093505 6% 2409219 0% 7 0% 0 0% 0 0% 2329235 0% 14 0%rename link readdir readdir+ fsstat fsinfo pathconf110306 0% 63 0% 17771684 2% 9038704 1% 65544670 9% 206 0% 95 0%commit26702780 3%
Client rpc:Connection orientedcalls badcalls badxids timeouts newcreds badverfs timers272059 0 0 0 0 0 0nomem cantconn interrupts0 0 0Connectionlesscalls badcalls retrans badxids timeouts newcreds badverfs79 0 0 0 0 0 0timers nomem cantsend0 0 0……
© 2010 IBM Corporation
AIX Virtual Users Group presentation July 29, 2010
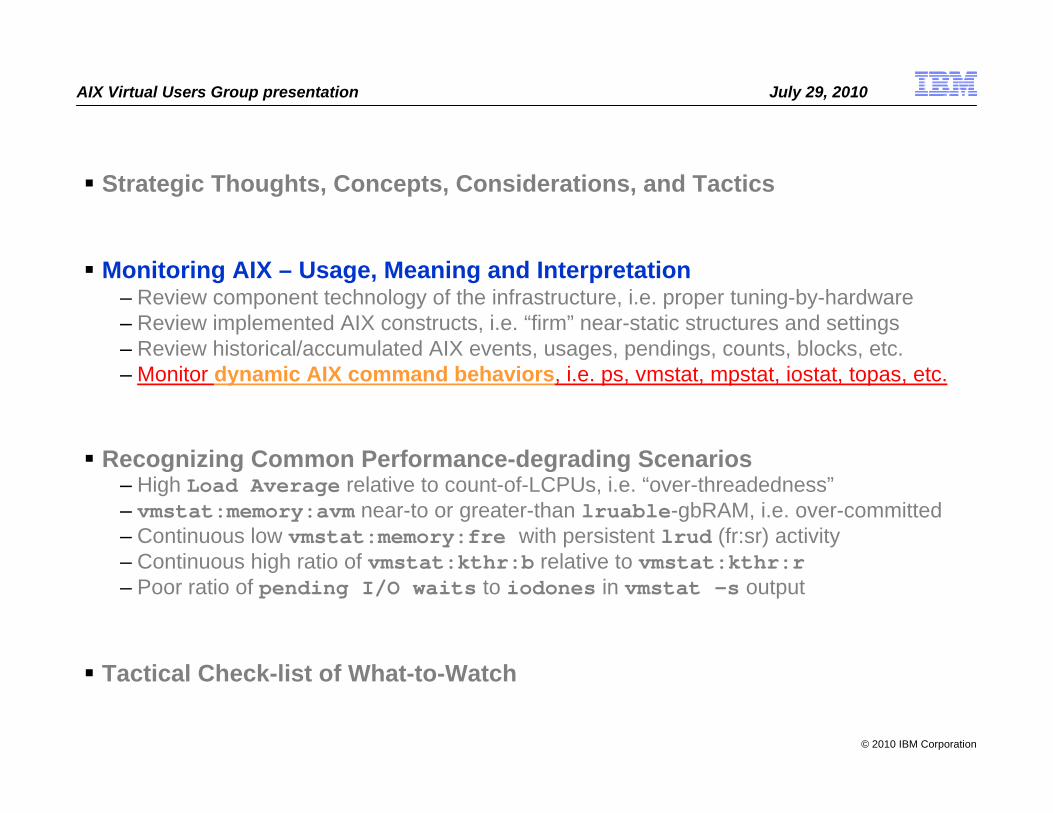
Strategic Thoughts, Concepts, Considerations, and Tactics
Monitoring AIX – Usage, Meaning and Interpretation– Review component technology of the infrastructure, i.e. proper tuning-by-hardware– Review implemented AIX constructs, i.e. “firm” near-static structures and settings– Review historical/accumulated AIX events, usages, pendings, counts, blocks, etc.– Monitor dynamic AIX command behaviors, i.e. ps, vmstat, mpstat, iostat, topas, etc.
Recognizing Common Performance-degrading Scenarios– High Load Average relative to count-of-LCPUs, i.e. “over-threadedness”– vmstat:memory:avm near-to or greater-than lruable-gbRAM, i.e. over-committed– Continuous low vmstat:memory:fre with persistent lrud (fr:sr) activity– Continuous high ratio of vmstat:kthr:b relative to vmstat:kthr:r– Poor ratio of pending I/O waits to iodones in vmstat -s output
Tactical Check-list of What-to-Watch

© 2010 IBM Corporation
AIX Virtual Users Group presentation July 29, 2010
Topas Monitor for host: sapdb1 EVENTS/QUEUES FILE/TTYSun Mar 2 11:14:49 2008 Interval: 2 Cswitch 5916 Readch 0.0G
Syscall 24150 Writech 1043.9KCPU User% Kern% Wait% Idle% Physc Reads 5587 Rawin 0cpu4 99.9 0.1 0.0 0.0 0.52 Writes 1213 Ttyout 686cpu5 99.9 0.1 0.0 0.0 0.48 Forks 0 Igets 0cpu9 99.8 0.2 0.0 0.0 0.72 Execs 0 Namei 46cpu6 99.8 0.2 0.0 0.0 0.69 Runqueue 20.0 Dirblk 0cpu11 99.8 0.2 0.0 0.0 0.69 Waitqueue 2.0cpu15 99.8 0.2 0.0 0.0 0.76cpu17 99.8 0.2 0.0 0.0 0.48 PAGING MEMORYcpu20 99.6 0.4 0.0 0.0 0.51 Faults 854 Real,MB 73728cpu13 99.5 0.3 0.1 0.1 0.62 Steals 1986 % Comp 59.2cpu16 99.5 0.5 0.0 0.0 0.52 PgspIn 0 % Noncomp 41.4cpu21 99.5 0.4 0.2 0.0 0.49 PgspOut 0 % Client 41.4cpu22 99.1 0.4 0.1 0.4 0.59 PageIn 1369cpu1 98.3 0.8 0.4 0.4 0.64 PageOut 167 PAGING SPACEcpu23 97.0 0.7 0.9 1.5 0.40 Sios 1436 Size,MB 130944cpu2 93.0 6.0 0.2 0.8 0.53 % Used 0.7cpu18 93.0 4.9 0.9 1.2 0.50 NFS (calls/sec) % Free 99.2cpu3 92.8 2.0 2.4 2.8 0.41 ServerV2 0cpu7 92.4 2.3 2.5 2.8 0.31 ClientV2 0 Press:cpu10 91.4 2.2 3.1 3.2 0.31 ServerV3 11 "h" for helpcpu0 90.7 3.4 3.2 2.8 0.32 ClientV3 0 "q" to quitcpu19 90.3 5.2 2.2 2.3 0.40cpu8 89.0 2.0 4.4 4.6 0.28cpu12 87.8 7.7 2.0 2.5 0.38cpu14 83.9 3.7 5.0 7.4 0.24
Name PID CPU% PgSp Owneroracle 2424844 6.4 18.1 orapr1oracle 1474750 6.3 8.9 orapr1oracle 3256398 5.8 9.4 orapr1topas 33759394 1.3 40.1 eyj1oracle 4227258 5.7 11.1 orapr1oracle 33087570 5.7 8.9 orapr1oracle 2007246 5.7 8.9 orapr1oracle 33861652 5.6 12.3 orapr1
topas<cr>d n c c # vastly improved instrumentation and functionality
© 2010 IBM Corporation
AIX Virtual Users Group presentation July 29, 2010
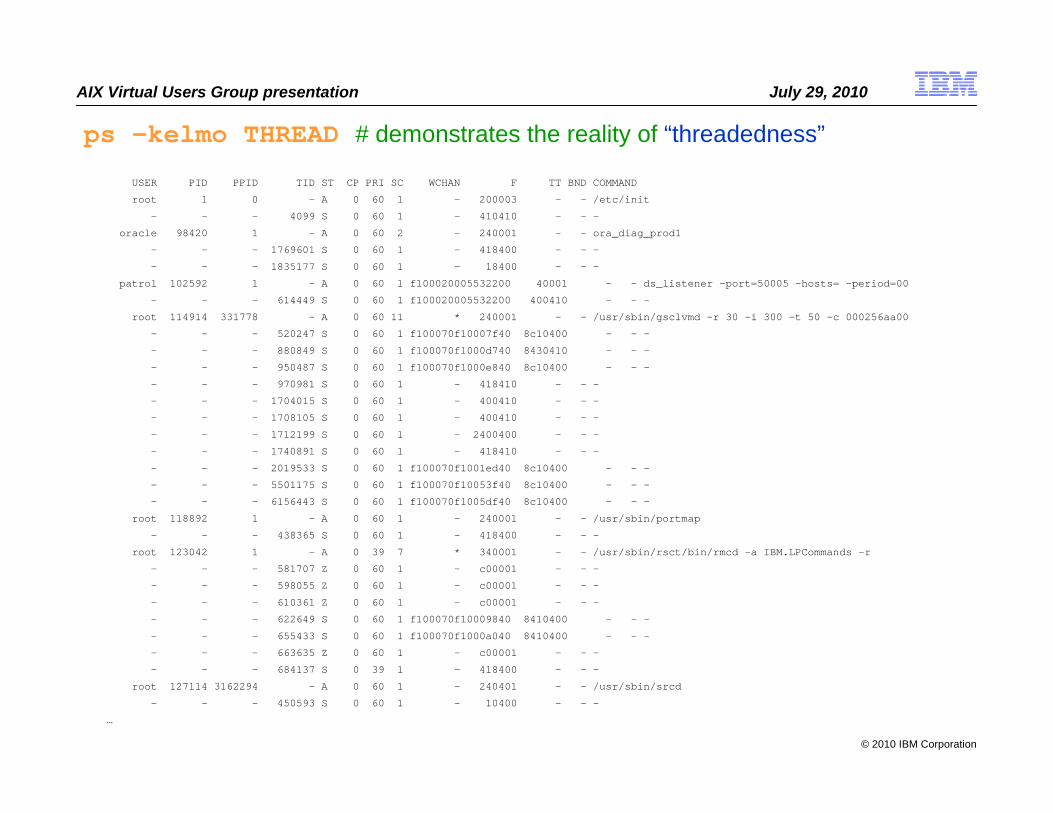
ps –kelmo THREAD # demonstrates the reality of “threadedness”
USER PID PPID TID ST CP PRI SC WCHAN F TT BND COMMAND
root 1 0 - A 0 60 1 - 200003 - - /etc/init
- - - 4099 S 0 60 1 - 410410 - - -
oracle 98420 1 - A 0 60 2 - 240001 - - ora_diag_prod1
- - - 1769601 S 0 60 1 - 418400 - - -
- - - 1835177 S 0 60 1 - 18400 - - -
patrol 102592 1 - A 0 60 1 f100020005532200 40001 - - ds_listener -port=50005 -hosts= -period=00
- - - 614449 S 0 60 1 f100020005532200 400410 - - -
root 114914 331778 - A 0 60 11 * 240001 - - /usr/sbin/gsclvmd -r 30 -i 300 -t 50 -c 000256aa00
- - - 520247 S 0 60 1 f100070f10007f40 8c10400 - - -
- - - 880849 S 0 60 1 f100070f1000d740 8430410 - - -
- - - 950487 S 0 60 1 f100070f1000e840 8c10400 - - -
- - - 970981 S 0 60 1 - 418410 - - -
- - - 1704015 S 0 60 1 - 400410 - - -
- - - 1708105 S 0 60 1 - 400410 - - -
- - - 1712199 S 0 60 1 - 2400400 - - -
- - - 1740891 S 0 60 1 - 418410 - - -
- - - 2019533 S 0 60 1 f100070f1001ed40 8c10400 - - -
- - - 5501175 S 0 60 1 f100070f10053f40 8c10400 - - -
- - - 6156443 S 0 60 1 f100070f1005df40 8c10400 - - -
root 118892 1 - A 0 60 1 - 240001 - - /usr/sbin/portmap
- - - 438365 S 0 60 1 - 418400 - - -
root 123042 1 - A 0 39 7 * 340001 - - /usr/sbin/rsct/bin/rmcd -a IBM.LPCommands -r
- - - 581707 Z 0 60 1 - c00001 - - -
- - - 598055 Z 0 60 1 - c00001 - - -
- - - 610361 Z 0 60 1 - c00001 - - -
- - - 622649 S 0 60 1 f100070f10009840 8410400 - - -
- - - 655433 S 0 60 1 f100070f1000a040 8410400 - - -
- - - 663635 Z 0 60 1 - c00001 - - -
- - - 684137 S 0 39 1 - 418400 - - -
root 127114 3162294 - A 0 60 1 - 240401 - - /usr/sbin/srcd
- - - 450593 S 0 60 1 - 10400 - - -
…

© 2010 IBM Corporation
AIX Virtual Users Group presentation July 29, 2010
ps –el; ps –elmo THREAD; ps –kl; ps –klmo THREAD # Shows thread counts of kernel vs. user processes for a sense of “threadedness”
ps -el | wc
ps -elmo THREAD | wc
ps -kl | wc
ps -klmo THREAD | wc
857 11953 81517 # 857 user procs (one line of column header)
2106 28273 199962 # 2106 – 857 = 1249 threads(user)
46 617 4099 # 46 kernel procs (one line of column header)
215 2795 17682 # 215 – 46 = 169 threads(kernel)
# 1249 + 169 = 1418 total threads

© 2010 IBM Corporation
AIX Virtual Users Group presentation July 29, 2010
ps guww # descending %CPU, SZ:RSS, STIME:TIME, full-syntax;a useful hunter-seeker of “run-away” processes (read: CPU-time “hogs”)
USER PID %CPU %MEM SZ RSS TTY STAT STIME TIME COMMAND
udb02p 18284686 0.6 0.0 22072 15620 - A 09:26:53 52:05 db2agent (CICP75) 0
udb02p 19640470 0.3 0.0 11836 1800 - A 15:41:30 0:01 db2agent (instance) 0
udb02p 15945764 0.3 0.0 8296 6772 - A May 24 266:05 db2agent (CICP75) 0
udb02p 26599546 0.2 0.0 11948 4920 - A 14:57:38 1:49 db2agent (instance) 0
root 2494534 0.1 0.0 7404 7416 - A May 24 132:09 db2ckpwd 0
root 2023454 0.1 0.0 7408 7420 - A May 24 131:32 db2ckpwd 0
root 15098066 0.1 0.0 7408 7420 - A May 24 131:32 db2ckpwd 0
root 19169494 0.1 0.0 126912 128960 - A Apr 30 824:12 /usr/tivoli/tsm/client/ba/bin/dsmc sched -se=AIXDB
udb02p 18792502 0.1 0.0 18296 14980 - A May 26 29:31 db2agent (CICP75) 0
udb02p 11047078 0.1 0.0 16768 13772 - A May 26 27:20 db2agent (CICP75) 0
maestro 14848224 0.1 0.0 2504 2192 - A 14:02:48 1:35 /appl/maestro/maestro/bin/batchman -parm 32000
udb02p 17072266 0.1 0.0 20788 15040 - A 08:58:06 6:17 db2agent (CICP75) 0
udb02p 27947030 0.1 0.0 18564 15952 - A May 26 29:05 db2agent (CICP75) 0
udb02p 27500798 0.1 0.0 25264 17660 - A 13:10:28 2:14 db2agent (CICP75) 0
udb02p 18423896 0.1 0.0 17808 15900 - A May 25 46:34 db2agent (CICP75) 0
udb02p 27803760 0.1 0.0 8752 6524 - A May 26 26:16 db2agent (CICP75) 0
udb02p 10149890 0.1 0.0 19024 15708 - A 07:59:23 6:15 db2agent (CICP75) 0
udb02p 987158 0.1 0.0 17004 6072 - A 15:40:31 0:01 db2agent (CICP75) 0
udb02p 12279828 0.1 0.0 19468 15768 - A May 26 19:43 db2agent (CICP75) 0
udb02p 31576232 0.1 0.0 12556 9176 - A 08:19:57 5:32 db2agent (CICP75) 0
udb02p 26505352 0.1 0.0 28652 24120 - A 08:02:33 5:43 db2agent (CICP75) 0
root 8196 0.1 0.0 384 384 - A Mar 11 1355:41 wait
udb02p 17924100 0.0 0.0 14764 8888 - A 09:23:38 4:30 db2agent (CICP75) 0
udb02p 21852330 0.0 0.0 20252 15208 - A 10:56:48 3:22 db2agent (CICP75) 0
udb02p 25665600 0.0 0.0 21004 14808 - A 11:25:53 2:48 db2agent (CICP75) 0
udb02p 12111920 0.0 0.0 8772 6544 - A May 26 19:05 db2agent (CICP75) 0
udb02p 22696146 0.0 0.0 15376 10332 - A 10:59:24 2:58 db2agent (CICP75) 0
udb02p 18362514 0.0 0.0 14688 5612 - A 15:40:09 0:01 db2agent (idle) 0
udb02p 16011488 0.0 0.0 19588 15056 - A 08:17:00 4:29 db2agent (CICP75) 0
udb02p 5300390 0.0 0.0 14012 10248 - A 19:00:14 12:27 db2agent (CICP75) 0
udb02p 11256034 0.0 0.0 19636 14848 - A 07:53:48 4:39 db2agent (CICP75) 0
udb02p 17399988 0.0 0.0 21036 14520 - A 09:47:43 3:27 db2agent (CICP75) 0

© 2010 IBM Corporation
AIX Virtual Users Group presentation July 29, 2010
ps gvww # ascending PID, SIZE:RSS, TIME:PGIN, %CPU, full-syntaxPGIN (v flag) The number of disk I/Os resulting from references by the process to pages not loaded in core
PID TTY STAT TIME PGIN SIZE RSS LIM TSIZ TRS %CPU %MEM COMMAND
0 - A 359:49 7 384 384 xx 0 0 0.0 0.0 swapper
1 - A 2:58 112 688 736 32768 32 48 0.0 0.0 /etc/init
8196 - A 1355:41 0 384 384 xx 0 0 0.1 0.0 wait
12294 - A 4:11 0 448 448 xx 0 0 0.0 0.0 sched
16392 - A 0:50 0 1216 1216 xx 0 0 0.0 0.0 lrud
20490 - A 0:00 0 448 448 xx 0 0 0.0 0.0 vmptacrt
…
192694 - A 231:54 25933 492 500 xx 3 8 0.0 0.0 /usr/sbin/syncd 60
…
1921222 - A 1:12 0 448 448 xx 0 0 0.0 0.0 aioserver
1945664 - A 1:27 0 448 448 xx 0 0 0.0 0.0 aioserver
1954040 - A 0:01 6502 14184 7704 32768 39 112 0.0 0.0 db2agent (CICP75) 0
1958100 - A 0:00 0 2708 1924 32768 39 112 0.0 0.0 db2agent (CICP75) 0
1962154 - A 0:00 0 2804 1700 32768 39 112 0.0 0.0 db2agent (CICP75) 0
1982616 - A 0:03 7630 21912 14920 32768 39 112 0.0 0.0 db2agent (CICP75) 0
1990804 - A 0:09 35673 20560 15488 32768 39 112 0.0 0.0 db2agent (CICP75) 0
1998936 - A 0:21 18151 11576 7656 32768 39 112 0.0 0.0 db2agent (CICP75) 0
2003126 - A 11:16 0 384 384 xx 0 0 0.0 0.0 wait
2007224 - A 0:07 20302 23108 15988 32768 39 112 0.0 0.0 db2agent (CICP75) 0
2023454 - A 131:32 37058 7372 7420 32768 39 112 0.1 0.0 db2ckpwd 0
2027608 - A 0:08 25717 13248 7792 32768 39 112 0.0 0.0 db2agent (CICP75) 0
2031778 - A 0:01 4392 17400 8296 32768 39 112 0.0 0.0 db2agent (CICP75) 0
2056344 - A 1:22 0 448 448 xx 0 0 0.0 0.0 aioserver
2072818 - A 0:01 789 11080 7736 32768 39 112 0.0 0.0 db2agent (CICP75) 0
2089120 - A 0:10 35352 19668 14596 32768 39 112 0.0 0.0 db2agent (CICP75) 0
2105366 - A 0:04 16649 20856 15016 32768 39 112 0.0 0.0 db2agent (CICP75) 0
2117646 - A 0:02 3150 14996 6340 32768 39 112 0.0 0.0 db2agent (CICP75) 0
2126002 - A 0:00 456 11380 4772 32768 39 112 0.0 0.0 db2agent (CICP75) 0
2129984 - A 0:15 16343 13100 7196 32768 39 112 0.0 0.0 db2agent (CICP75) 0
2150502 - A 0:00 6 3892 2916 32768 39 112 0.0 0.0 db2agent (CICP75) 0
2158720 - A 0:02 4948 15320 7304 32768 39 112 0.0 0.0 db2agent (CICP75) 0
© 2010 IBM Corporation
AIX Virtual Users Group presentation July 29, 2010
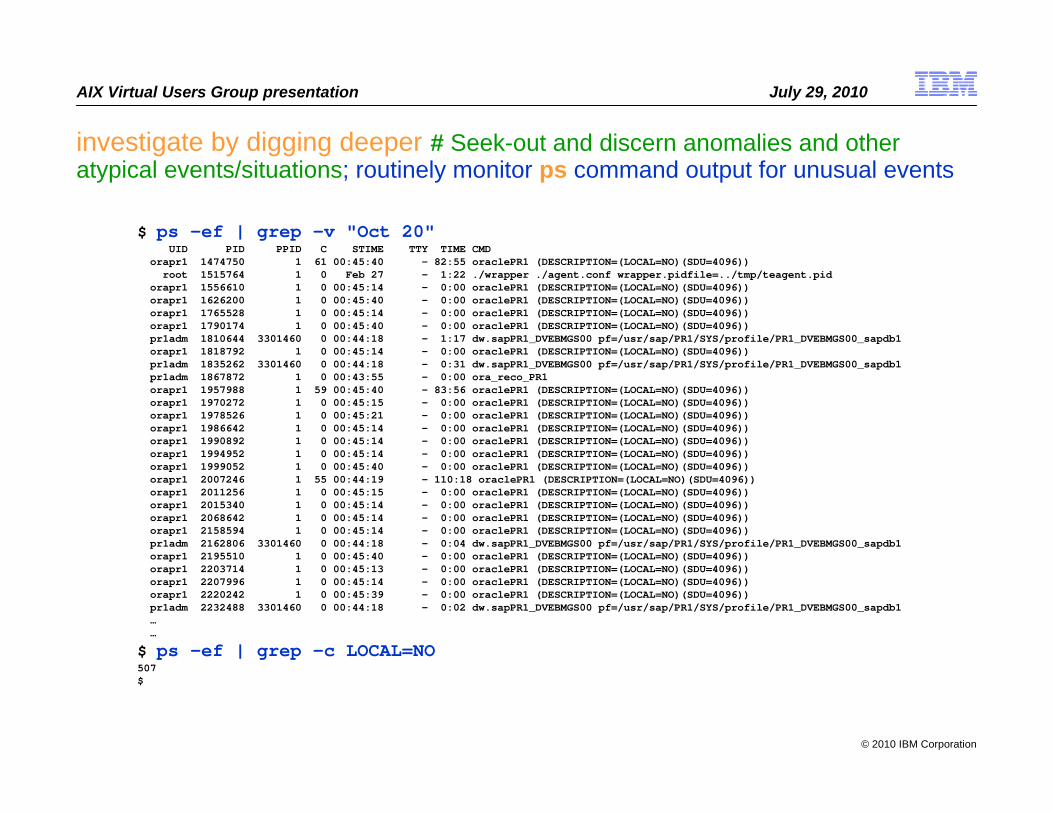
investigate by digging deeper # Seek-out and discern anomalies and other atypical events/situations; routinely monitor ps command output for unusual events
$ ps -ef | grep -v "Oct 20"UID PID PPID C STIME TTY TIME CMD
orapr1 1474750 1 61 00:45:40 - 82:55 oraclePR1 (DESCRIPTION=(LOCAL=NO)(SDU=4096))root 1515764 1 0 Feb 27 - 1:22 ./wrapper ./agent.conf wrapper.pidfile=../tmp/teagent.pid
orapr1 1556610 1 0 00:45:14 - 0:00 oraclePR1 (DESCRIPTION=(LOCAL=NO)(SDU=4096))orapr1 1626200 1 0 00:45:40 - 0:00 oraclePR1 (DESCRIPTION=(LOCAL=NO)(SDU=4096))orapr1 1765528 1 0 00:45:14 - 0:00 oraclePR1 (DESCRIPTION=(LOCAL=NO)(SDU=4096))orapr1 1790174 1 0 00:45:40 - 0:00 oraclePR1 (DESCRIPTION=(LOCAL=NO)(SDU=4096))pr1adm 1810644 3301460 0 00:44:18 - 1:17 dw.sapPR1_DVEBMGS00 pf=/usr/sap/PR1/SYS/profile/PR1_DVEBMGS00_sapdb1orapr1 1818792 1 0 00:45:14 - 0:00 oraclePR1 (DESCRIPTION=(LOCAL=NO)(SDU=4096))pr1adm 1835262 3301460 0 00:44:18 - 0:31 dw.sapPR1_DVEBMGS00 pf=/usr/sap/PR1/SYS/profile/PR1_DVEBMGS00_sapdb1pr1adm 1867872 1 0 00:43:55 - 0:00 ora_reco_PR1orapr1 1957988 1 59 00:45:40 - 83:56 oraclePR1 (DESCRIPTION=(LOCAL=NO)(SDU=4096))orapr1 1970272 1 0 00:45:15 - 0:00 oraclePR1 (DESCRIPTION=(LOCAL=NO)(SDU=4096))orapr1 1978526 1 0 00:45:21 - 0:00 oraclePR1 (DESCRIPTION=(LOCAL=NO)(SDU=4096))orapr1 1986642 1 0 00:45:14 - 0:00 oraclePR1 (DESCRIPTION=(LOCAL=NO)(SDU=4096))orapr1 1990892 1 0 00:45:14 - 0:00 oraclePR1 (DESCRIPTION=(LOCAL=NO)(SDU=4096))orapr1 1994952 1 0 00:45:14 - 0:00 oraclePR1 (DESCRIPTION=(LOCAL=NO)(SDU=4096))orapr1 1999052 1 0 00:45:40 - 0:00 oraclePR1 (DESCRIPTION=(LOCAL=NO)(SDU=4096))orapr1 2007246 1 55 00:44:19 - 110:18 oraclePR1 (DESCRIPTION=(LOCAL=NO)(SDU=4096))orapr1 2011256 1 0 00:45:15 - 0:00 oraclePR1 (DESCRIPTION=(LOCAL=NO)(SDU=4096))orapr1 2015340 1 0 00:45:14 - 0:00 oraclePR1 (DESCRIPTION=(LOCAL=NO)(SDU=4096))orapr1 2068642 1 0 00:45:14 - 0:00 oraclePR1 (DESCRIPTION=(LOCAL=NO)(SDU=4096))orapr1 2158594 1 0 00:45:14 - 0:00 oraclePR1 (DESCRIPTION=(LOCAL=NO)(SDU=4096))pr1adm 2162806 3301460 0 00:44:18 - 0:04 dw.sapPR1_DVEBMGS00 pf=/usr/sap/PR1/SYS/profile/PR1_DVEBMGS00_sapdb1orapr1 2195510 1 0 00:45:40 - 0:00 oraclePR1 (DESCRIPTION=(LOCAL=NO)(SDU=4096))orapr1 2203714 1 0 00:45:13 - 0:00 oraclePR1 (DESCRIPTION=(LOCAL=NO)(SDU=4096))orapr1 2207996 1 0 00:45:14 - 0:00 oraclePR1 (DESCRIPTION=(LOCAL=NO)(SDU=4096))orapr1 2220242 1 0 00:45:39 - 0:00 oraclePR1 (DESCRIPTION=(LOCAL=NO)(SDU=4096))pr1adm 2232488 3301460 0 00:44:18 - 0:02 dw.sapPR1_DVEBMGS00 pf=/usr/sap/PR1/SYS/profile/PR1_DVEBMGS00_sapdb1……
$ ps -ef | grep -c LOCAL=NO507$

© 2010 IBM Corporation
AIX Virtual Users Group presentation July 29, 2010
vmstat –Iwt 2 # establish dynamic baselines of AIX behaviors
$ vmstat –Iwt 2System configuration: lcpu=8 mem=15808MB
kthr memory page faults cpu time ----------- --------------------- ------------------------------------ ------------------ ----------- --------r b p avm fre fi fo pi po fr sr in sy cs us sy id wa hr mi se6 9 0 3622390 1865 1171 637 57 680 2228 5066 896 68533 7908 89 7 1 3 09:17:406 8 0 3627696 1764 847 3 57 808 3489 8207 812 48745 10969 73 6 6 15 09:17:422 13 0 3631998 2875 231 343 52 798 2903 6644 777 14471 2850 64 4 14 19 09:17:44
10 9 0 3636139 2053 994 880 129 527 2904 16706 1013 55414 7332 91 6 1 3 09:17:4610 5 0 3619116 18481 1381 629 145 510 1228 19741 1098 53549 10147 91 7 1 2 09:17:4811 2 0 3609866 21981 2570 893 244 0 0 0 1537 53911 13926 91 8 0 1 09:17:508 5 0 3610726 15307 2522 718 353 0 0 0 1522 49902 9863 89 7 1 3 09:17:526 3 0 3595648 28527 588 474 316 0 0 0 1006 100617 5395 84 6 4 5 09:17:54
10 5 0 3595806 25633 1101 564 273 0 0 0 1113 109611 7128 88 8 1 2 09:17:566 11 0 3601571 16601 1191 255 423 0 0 0 1216 140583 9472 87 8 1 4 09:17:588 12 0 3604703 11245 661 247 427 0 0 0 1041 118076 10307 89 8 0 3 09:18:006 14 0 3600579 12444 1035 293 424 0 0 0 1315 67304 18072 87 9 0 4 09:18:027 15 0 3600064 9638 1008 268 395 0 0 0 1292 66735 15921 82 9 1 9 09:18:046 12 0 3602133 4839 776 295 464 0 0 0 1050 103319 4426 80 6 2 12 09:18:065 13 0 3605240 2170 1025 266 307 279 1556 13844 1042 66953 3916 65 5 8 22 09:18:088 6 0 3606415 1945 1975 297 317 0 2752 37581 1440 70972 4870 87 7 1 5 09:18:10
10 4 0 3610938 2084 1366 164 234 0 3943 55882 1241 75037 8307 92 6 0 2 09:18:129 2 0 3594623 19789 1321 512 246 41 2271 19132 1343 70210 8794 90 7 1 2 09:18:158 4 0 3593551 18060 1188 1890 123 0 0 0 1491 58462 7443 76 8 6 10 09:18:175 8 0 3598228 9838 1499 5765 226 0 0 0 1502 39586 10136 73 11 6 10 09:18:19kthr memory page faults cpu time
----------- --------------------- ------------------------------------ ------------------ ----------- --------r b p avm fre fi fo pi po fr sr in sy cs us sy id wa hr mi se7 2 0 3601032 4779 969 2464 103 0 0 0 1099 35643 12135 86 7 3 4 09:18:218 5 0 3604401 2167 1282 328 293 0 2070 10143 1168 54493 17465 89 10 0 1 09:18:23
10 5 0 3611569 2022 1012 38 282 9 4822 19771 1112 47936 11135 89 8 1 1 09:18:258 8 0 3614396 2000 741 7 339 56 2487 11217 1040 40025 8102 91 6 1 2 09:18:276 6 0 3617421 2014 404 8 267 303 2191 7130 733 98557 7510 77 5 7 11 09:18:298 8 0 3619413 2974 252 90 169 519 1899 5209 704 87714 3431 78 4 4 14 09:18:316 7 0 3620661 1965 488 201 293 255 922 2729 1094 39403 4851 89 5 2 4 09:18:337 7 0 3623343 2617 684 72 109 610 2468 8924 937 15606 16827 69 7 5 19 09:18:356 8 0 3624146 2831 443 7 272 332 1228 4517 739 15674 3277 82 4 4 10 09:18:376 7 0 3625514 1934 464 7 336 168 1048 3851 758 17909 4927 79 4 4 14 09:18:394 8 0 3608643 19107 618 29 393 115 1171 3803 889 28193 5547 73 5 4 18 09:18:416 8 0 3596033 29222 815 8 429 0 0 0 977 62182 10416 73 7 5 16 09:18:436 5 0 3598914 22745 1233 246 369 0 0 0 1116 77652 5335 74 7 7 12 09:18:455 3 0 3604955 12994 1151 372 375 0 0 0 1085 83391 6533 79 6 5 11 09:18:47
…

© 2010 IBM Corporation
AIX Virtual Users Group presentation July 29, 2010
vmstat –I 2 # Best 6-in-1 monitor; no-load leave-it-up all-day VMM monitor
$ vmstat –I 2
System configuration: lcpu=24 mem=73728MB ent=12.00
kthr memory page faults cpu-------- ----------- ------------------------ ------------ -----------------------r b p avm fre fi fo pi po fr sr in sy cs us sy id wa pc ec10 6 0 11507787 49543 3483 823 0 0 5306 5355 5662 45907 26258 33 4 53 10 4.71 39.3 10 7 0 11509796 47989 3824 594 0 0 4116 27771 6252 56592 45959 54 7 28 12 7.65 63.8 9 7 0 11510010 47770 3955 622 0 0 3977 9647 5907 56222 46833 48 7 31 15 6.87 57.2 8 6 0 11510560 50021 4164 2431 0 0 5564 40421 6607 51080 49691 41 7 39 13 6.08 50.7 6 6 0 11512741 46710 4886 1443 0 0 4443 4608 6110 42400 30394 36 5 42 17 5.28 44.0 5 7 0 11514081 48807 4675 227 0 0 6461 7028 4838 34521 11343 33 3 55 9 4.68 39.0 8 7 0 11515469 48531 5679 482 0 0 6445 6593 5686 44979 13230 37 3 48 12 4.99 41.5 9 7 0 11514065 49598 3858 1046 0 0 4128 4255 5807 51871 27521 44 6 32 19 6.27 52.3 8 7 0 11517672 49905 4848 632 0 0 7173 7221 5679 44566 47102 48 6 32 14 6.84 57.0 10 13 0 11520210 50148 4669 692 0 0 6313 6491 6341 47122 45622 52 5 28 15 7.22 60.2 7 9 0 11521192 48222 5087 814 0 0 5194 5790 6211 49553 44306 45 6 34 15 6.45 53.7 10 7 0 11521212 50922 3830 627 0 0 5330 5353 6248 48130 32364 47 4 37 12 6.42 53.5 4 7 0 11521503 49362 3475 573 0 0 3075 3102 5717 47907 13356 42 3 41 14 5.69 47.4 9 8 0 11523055 48731 3502 511 0 0 4143 4176 5884 44391 13427 46 2 41 11 6.01 50.1 10 8 0 11524140 50987 3483 761 0 0 5363 5683 5830 45416 15252 60 3 23 14 7.89 65.7 8 7 0 11524407 45661 3871 351 0 0 1488 1621 5378 34403 13034 54 2 29 15 7.14 59.5 6 7 0 11523652 50033 3325 355 0 0 5229 5448 5434 40780 14372 45 3 36 16 6.06 50.5 8 9 0 11525268 48536 4209 272 0 0 4102 4337 4599 36202 10449 44 4 35 18 6.05 50.4 9 9 0 11525476 48242 4322 521 0 0 4307 4634 5375 33863 13975 44 3 35 18 5.97 49.7 8 11 0 11526444 49830 4988 699 0 0 6351 6828 6743 53110 45620 46 6 32 16 6.63 55.3……

© 2010 IBM Corporation
AIX Virtual Users Group presentation July 29, 2010
vmstat –I 2 # Best 6-in-1 monitor; no-load leave-it-up all-day VMM monitor
kthr
Number of kernel threads in various queues averaged per second over the sampling interval. The kthr columns are as follows:
– rAverage number of kernel threads that are runnable, which includes threads that are
running and threads that are waiting for the CPU. If this number is greater than the number of CPUs, then there is at least one thread waiting for a CPU and the more threads there are waiting for CPUs, the greater the likelihood of a performance impact.
– bAverage number of kernel threads in the VMM wait queue per second. This includes
threads that are waiting on filesystem I/O or threads that are blocking on a shared resource, i.e. inode-lock.
– pFor vmstat -I The number of threads waiting on I/Os to raw devices per second. Threads
waiting on I/Os to filesystems would not be included here.

© 2010 IBM Corporation
AIX Virtual Users Group presentation July 29, 2010
vmstat –I 2 # Best 6-in-1 monitor; no-load leave-it-up all-day VMM monitor
memory
Provides information about the real and virtual memory.– avmThe Active Virtual Memory, avm, column represents the number of active virtual memory
pages present at the time the vmstat sample was collected. It is the sum-total of all computational memory – including content paged-out to the pagingspace. The avmstatistics do not include file pages.
– freThe fre column shows the average number of free memory pages. A page is a 4 KB area
of real memory. The system maintains a buffer of memory pages, called the free list, that will be readily accessible when the VMM needs space. The minimum number of pages that the VMM keeps on the free list is determined by the minfree parameter of the vmocommand.

© 2010 IBM Corporation
AIX Virtual Users Group presentation July 29, 2010
vmstat –I 2 # Best 6-in-1 monitor; no-load leave-it-up all-day VMM monitor
page [ fi and fo are only included with vmstat –I ]
Information about page faults and paging activity. These are averaged over the interval and given in units per second.
– fiThe fi column details the number of pages paged-in from persistent storage, i.e. pages
read-in from JFS/JFS2 file systems on disk. This does not include pagingspace-pagein’sfrom the pagingspace; rather, these are filesystem-reads.
– foThe fo column details the number of pages paged-out to persistent storage, i.e. pages
written-out to JFS/JFS2 file systems on disk. This does not include pagingspace-pageout’s to the pagingspace ; rather, these are filesystem-writes.

© 2010 IBM Corporation
AIX Virtual Users Group presentation July 29, 2010
vmstat –I 2 # Best 6-in-1 monitor; no-load leave-it-up all-day VMM monitor
Page (continued)
Information about page faults and paging activity. These are averaged over the interval and given in units per second.
– pi The pi column details the number of pages paged in from paging space. Paging space is the part of
virtual memory that resides on disk. It is used as an overflow when memory is over committed. Paging space consists of logical volumes dedicated to the storage of working set pages that have been stolen from real memory. When a stolen page is referenced by the process, a page fault occurs, and the page must be read into memory from paging space.
Due to the variety of configurations of hardware, software and applications, there is no absolute number to look out for. This field is important as a key indicator of paging-space activity. If a page-in occurs, there must have been a previous page-out for that page. It is also likely in a memory-constrained environment that each page-in will force a different page to be stolen and, therefore, paged out.
– poThe po column shows the number (rate) of pages paged out to paging space. Whenever a page of
working storage is stolen, it is written to paging space, if it does not yet reside in paging space or if it was modified. If not referenced again, it will remain on the paging device until the process terminates or disclaims the space. Subsequent references to addresses contained within the faulted-out pages results in page faults, and the pages are paged in individually by the system. When a process terminates normally, any paging space allocated to that process is freed. If the system is reading in a significant number of persistent pages, you might see an increase in po without corresponding increases in pi. This does not necessarily indicate thrashing, but may warrant investigation into data-access patterns of the applications.

© 2010 IBM Corporation
AIX Virtual Users Group presentation July 29, 2010
vmstat –I 2 # Best 6-in-1 monitor; no-load leave-it-up all-day VMM monitor
page (continued)
Information about page faults and paging activity. These are averaged over the interval and given in units per second.
– frNumber of pages that were freed per second by the page-replacement algorithm during
the interval. As the VMM page-replacement routine scans the Page Frame Table, or PFT, it uses criteria to select which pages are to be stolen to replenish the free list of available memory frames. The criteria include both kinds of pages, working (computational) and file (persistent) pages. Just because a page has been freed, it does not mean that any I/O has taken place. For example, if a persistent storage (file) page has not been modified, it will not be written back to the disk. If I/O is not necessary, minimal system resources are required to free a page.
– srNumber of pages that were examined per second by the page-replacement algorithm
during the interval. The page-replacement algorithm might have to scan many page frames before it can steal enough to satisfy the page-replacement thresholds. The higher the sr value compared to the fr value, the harder it is for the page-replacement algorithm to find eligible pages to steal.
© 2010 IBM Corporation
AIX Virtual Users Group presentation July 29, 2010
vmstat –I 2 # Best 6-in-1 monitor; no-load leave-it-up all-day VMM monitor
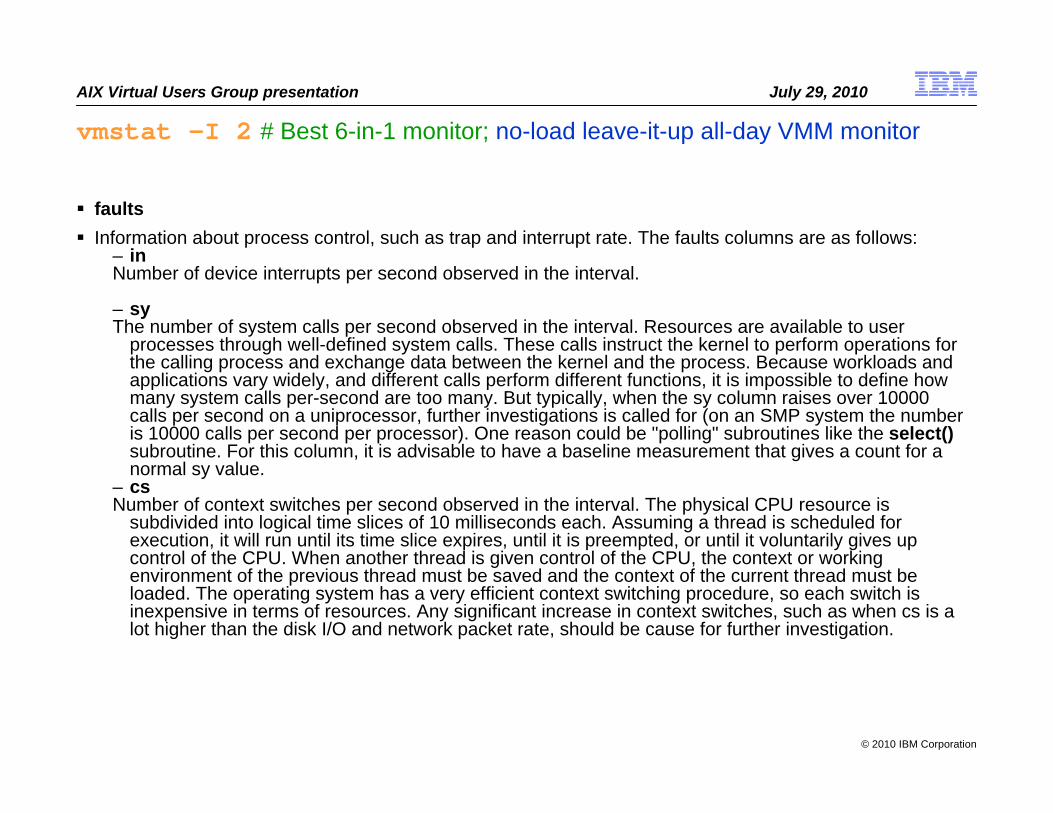
faults Information about process control, such as trap and interrupt rate. The faults columns are as follows:
– inNumber of device interrupts per second observed in the interval.
– syThe number of system calls per second observed in the interval. Resources are available to user
processes through well-defined system calls. These calls instruct the kernel to perform operations for the calling process and exchange data between the kernel and the process. Because workloads and applications vary widely, and different calls perform different functions, it is impossible to define how many system calls per-second are too many. But typically, when the sy column raises over 10000 calls per second on a uniprocessor, further investigations is called for (on an SMP system the number is 10000 calls per second per processor). One reason could be "polling" subroutines like the select()subroutine. For this column, it is advisable to have a baseline measurement that gives a count for a normal sy value.
– csNumber of context switches per second observed in the interval. The physical CPU resource is
subdivided into logical time slices of 10 milliseconds each. Assuming a thread is scheduled for execution, it will run until its time slice expires, until it is preempted, or until it voluntarily gives up control of the CPU. When another thread is given control of the CPU, the context or working environment of the previous thread must be saved and the context of the current thread must be loaded. The operating system has a very efficient context switching procedure, so each switch is inexpensive in terms of resources. Any significant increase in context switches, such as when cs is a lot higher than the disk I/O and network packet rate, should be cause for further investigation.

© 2010 IBM Corporation
AIX Virtual Users Group presentation July 29, 2010
vmstat –I 2 # Best 6-in-1 monitor; no-load leave-it-up all-day VMM monitor
cpu Percentage breakdown of CPU time usage during the interval. The cpu columns are as follows:
– us– The us column shows the percent of CPU time spent in user mode. A UNIX® process can execute in either user mode
or system (kernel) mode. When in user mode, a process executes within its application code and does not require kernel resources to perform computations, manage memory, or set variables.
– sy– The sy column details the percentage of time the CPU was executing a process in system mode. This includes CPU
resource consumed by kernel processes (kprocs) and others that need access to kernel resources. If a process needs kernel resources, it must execute a system call and is thereby switched to system mode to make that resource available. For example, reading or writing of a file requires kernel resources to open the file, seek a specific location, and read or write data, unless memory mapped files are used.
– id– The id column shows the percentage of time which the CPU is idle, or waiting, without pending local disk I/O. If there
are no threads available for execution (the run queue is empty), the system dispatches a thread called wait, which is also known as the idle kproc. On an SMP system, one wait thread per processor can be dispatched. The report generated by the ps command (with the -k or -g 0 option) identifies this as kproc or wait. If the ps report shows a high aggregate time for this thread, it means there were significant periods of time when no other thread was ready to run or waiting to be executed on the CPU. The system was therefore mostly idle and waiting for new tasks.
– wa– The wa column details the percentage of time the CPU was idle with pending local disk I/O and NFS-mounted disks. If
there is at least one outstanding I/O to a disk when wait is running, the time is classified as waiting for I/O. Unless asynchronous I/O is being used by the process, an I/O request to disk causes the calling process to block (or sleep) until the request has been completed. Once an I/O request for a process completes, it is placed on the run queue. If the I/Os were completing faster, more CPU time could be used.
– A wa value over 25 percent could indicate that the disk subsystem might not be balanced properly, or it might be the result of a disk-intensive workload.

© 2010 IBM Corporation
AIX Virtual Users Group presentation July 29, 2010
vmstat –Iwt 2 # check for memory-overcommitment; MAX(avm)*4096;load average=AVG(vmstat:kthr:r) over 60secs: current,5mins,15mins ago
$ uptime ; vmstat -Iwt 2 2010:51AM up 133 days, 13:43, 3 users, load average: 19.45, 19.53, 19.32
System configuration: lcpu=24 mem=73728MB ent=12.00
kthr memory page faults cpu time----------- --------------------- ------------------------------------ ------------------ ----------------------- --------r b p avm fre fi fo pi po fr sr in sy cs us sy id wa pc ec hr mi se
20 0 0 10957853 48491 66 47 0 0 0 0 363 117648 2422 96 2 2 0 12.00 100.0 10:51:2620 0 0 10957452 48808 16 81 0 0 0 0 418 94030 4048 97 2 2 0 12.00 100.0 10:51:2818 0 0 10957456 48524 111 136 0 0 0 0 486 6692 2338 98 0 2 0 12.00 100.0 10:51:3018 0 0 10957463 48455 25 34 0 0 0 0 152 11637 1348 97 1 2 0 12.00 100.0 10:51:3218 0 0 10957464 48432 6 14 0 0 0 0 77 3019 1141 98 0 2 0 12.00 100.0 10:51:3419 1 0 10957470 48298 65 7 0 0 0 0 197 4164 1330 97 0 2 0 11.95 99.6 10:51:3618 0 0 10957472 48296 0 5 0 0 0 0 39 2842 1028 97 0 3 0 11.86 98.8 10:51:3819 0 0 10957479 48236 23 13 0 0 0 0 234 5335 1448 98 0 2 0 12.00 100.0 10:51:4019 1 0 10957487 47686 271 5 0 0 0 0 402 13439 1806 97 1 2 0 12.00 100.0 10:51:4219 0 0 10957489 47684 0 9 0 0 0 0 37 7145 997 97 1 2 0 12.00 100.0 10:51:4420 0 0 10957481 47610 39 56 0 0 0 0 167 2837 1061 98 0 2 0 12.00 100.0 10:51:4619 0 0 10957483 47548 31 1 0 0 0 0 85 3075 1065 98 0 2 0 12.00 100.0 10:51:4818 0 0 10957481 47500 26 13 0 0 7 135 75 2921 1032 98 0 2 0 12.00 100.0 10:51:5019 0 0 10957889 49033 53 6 0 0 1025 1031 129 88541 1871 96 2 2 0 11.98 99.8 10:51:5219 0 0 10957888 48954 40 0 0 0 0 0 89 94550 1869 96 2 2 0 12.00 100.0 10:51:5420 1 0 10957882 48926 17 6 0 0 0 0 74 123666 2068 96 2 2 0 12.00 100.0 10:51:5619 0 0 10957880 48916 5 8 0 0 0 0 47 120104 1913 94 3 4 0 11.80 98.4 10:51:5820 0 0 10957666 49062 34 1 0 0 0 0 80 117384 1849 96 2 2 0 12.00 100.0 10:52:0018 0 0 10957883 48841 1 7 0 0 0 0 59 130003 1924 95 3 2 0 12.00 100.0 10:52:0220 0 0 10957889 48779 28 6 0 0 0 0 143 126580 2284 96 3 2 0 12.00 100.0 10:52:04
$ bc10957889 * 4096 # MAX(avm)*4096 relative-to mem=73728MB 73728*1024*102444883513344 # 44883513344 relative-to 77309411328quit$
© 2010 IBM Corporation
AIX Virtual Users Group presentation July 29, 2010
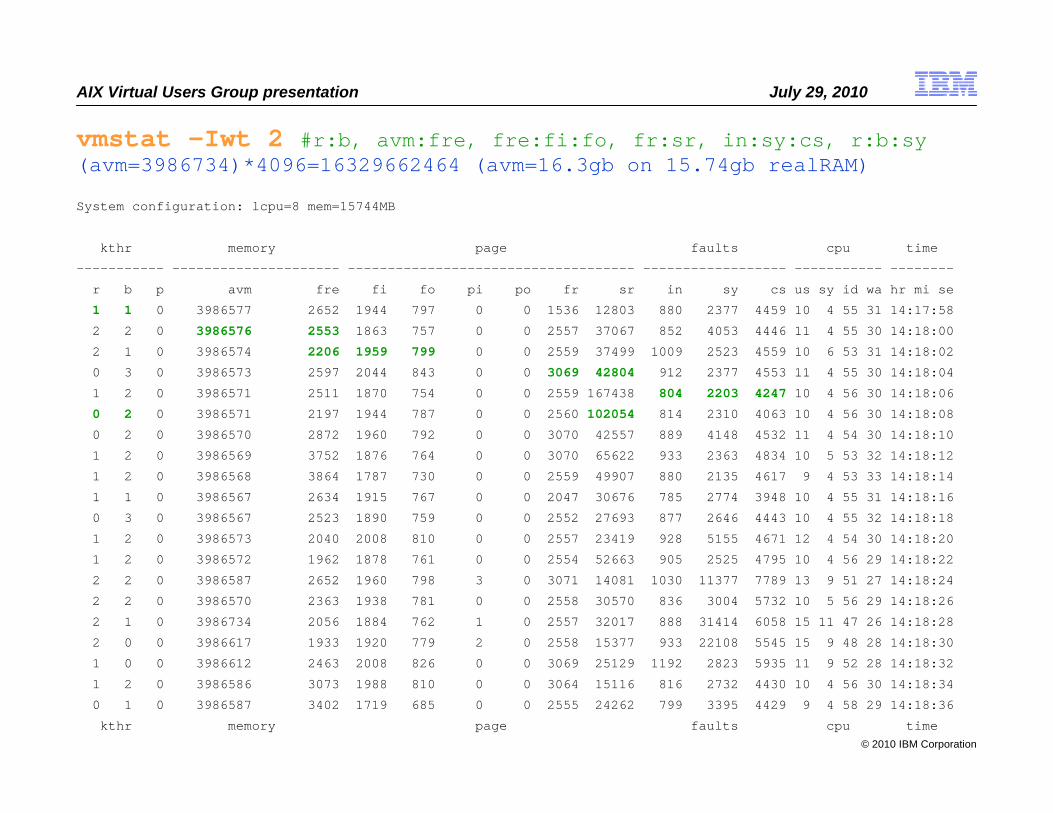
vmstat –Iwt 2 #r:b, avm:fre, fre:fi:fo, fr:sr, in:sy:cs, r:b:sy(avm=3986734)*4096=16329662464 (avm=16.3gb on 15.74gb realRAM)
System configuration: lcpu=8 mem=15744MB
kthr memory page faults cpu time
----------- --------------------- ------------------------------------ ------------------ ----------- --------
r b p avm fre fi fo pi po fr sr in sy cs us sy id wa hr mi se
1 1 0 3986577 2652 1944 797 0 0 1536 12803 880 2377 4459 10 4 55 31 14:17:58
2 2 0 3986576 2553 1863 757 0 0 2557 37067 852 4053 4446 11 4 55 30 14:18:00
2 1 0 3986574 2206 1959 799 0 0 2559 37499 1009 2523 4559 10 6 53 31 14:18:02
0 3 0 3986573 2597 2044 843 0 0 3069 42804 912 2377 4553 11 4 55 30 14:18:04
1 2 0 3986571 2511 1870 754 0 0 2559 167438 804 2203 4247 10 4 56 30 14:18:06
0 2 0 3986571 2197 1944 787 0 0 2560 102054 814 2310 4063 10 4 56 30 14:18:08
0 2 0 3986570 2872 1960 792 0 0 3070 42557 889 4148 4532 11 4 54 30 14:18:10
1 2 0 3986569 3752 1876 764 0 0 3070 65622 933 2363 4834 10 5 53 32 14:18:12
1 2 0 3986568 3864 1787 730 0 0 2559 49907 880 2135 4617 9 4 53 33 14:18:14
1 1 0 3986567 2634 1915 767 0 0 2047 30676 785 2774 3948 10 4 55 31 14:18:16
0 3 0 3986567 2523 1890 759 0 0 2552 27693 877 2646 4443 10 4 55 32 14:18:18
1 2 0 3986573 2040 2008 810 0 0 2557 23419 928 5155 4671 12 4 54 30 14:18:20
1 2 0 3986572 1962 1878 761 0 0 2554 52663 905 2525 4795 10 4 56 29 14:18:22
2 2 0 3986587 2652 1960 798 3 0 3071 14081 1030 11377 7789 13 9 51 27 14:18:24
2 2 0 3986570 2363 1938 781 0 0 2558 30570 836 3004 5732 10 5 56 29 14:18:26
2 1 0 3986734 2056 1884 762 1 0 2557 32017 888 31414 6058 15 11 47 26 14:18:28
2 0 0 3986617 1933 1920 779 2 0 2558 15377 933 22108 5545 15 9 48 28 14:18:30
1 0 0 3986612 2463 2008 826 0 0 3069 25129 1192 2823 5935 11 9 52 28 14:18:32
1 2 0 3986586 3073 1988 810 0 0 3064 15116 816 2732 4430 10 4 56 30 14:18:34
0 1 0 3986587 3402 1719 685 0 0 2555 24262 799 3395 4429 9 4 58 29 14:18:36
kthr memory page faults cpu time

© 2010 IBM Corporation
AIX Virtual Users Group presentation July 29, 2010
uptime;vmstat;mpstat # compare and match the meaning of both stats$ uptime ; vmstat -Iwt 2 3 ; mpstat -w 2 107:06AM up 12 days, 10:09, 4 users, load average: 8.97, 9.55, 9.79
System configuration: lcpu=36 mem=79360MB
kthr memory page faults cpu time ----------- --------------------- ------------------------------------ ------------------ ----------- --------r b p avm fre fi fo pi po fr sr in sy cs us sy id wa hr mi se
10 1 0 12542527 27282 877 551 0 0 0 0 1419 189441 10772 44 3 50 3 07:06:478 1 0 12545249 21863 1114 647 0 0 0 0 1477 178350 12383 48 2 47 3 07:06:49
12 1 0 12552354 22160 988 893 0 0 5250 70921 1438 286966 10384 57 6 34 3 07:06:51
System configuration: lcpu=36 mode=Capped
cpu min maj mpc int cs ics rq mig lpa sysc us sy wa id pc0 0 2 0 378 962 710 0 55 99.6 28017 70.4 4.6 0.2 24.7 0.811 0 0 0 29 8 4 0 0 100.0 0 2.4 0.4 0.0 97.2 0.192 1025 5 0 561 1352 910 0 53 100.0 3662 83.8 2.5 0.6 13.1 0.883 0 0 0 16 0 0 0 0 - 0 0.0 0.2 0.0 99.8 0.124 1513 12 0 837 2132 1302 0 100 99.9 9266 36.7 6.8 2.2 54.3 0.655 0 0 0 41 0 0 0 0 - 0 0.0 0.2 0.0 99.8 0.366 1061 5 0 485 873 465 0 80 100.0 31318 63.2 5.4 0.6 30.8 0.777 0 0 0 29 0 0 0 0 - 0 0.0 0.2 0.0 99.8 0.248 694 4 0 801 1422 742 0 63 100.0 16970 67.1 4.6 0.7 27.6 0.799 0 0 0 28 0 0 0 0 - 0 0.0 0.2 0.0 99.8 0.21
10 184 135 0 299 1206 836 0 153 85.9 16218 43.1 6.0 21.3 29.6 0.6711 10 45 0 131 46 46 0 0 100.0 48 2.3 1.4 11.2 85.1 0.3312 264 37 0 488 1333 810 0 124 89.6 5712 57.1 5.4 4.1 33.4 0.7413 0 0 0 32 0 0 0 0 - 0 0.0 0.2 0.0 99.8 0.2414 348 47 0 206 356 227 0 79 82.0 36145 60.9 6.8 4.4 27.9 0.7715 0 0 0 25 0 0 0 0 100.0 6 0.0 0.2 0.0 99.7 0.2316 419 67 0 339 850 482 0 140 85.6 5772 55.7 4.5 8.8 31.1 0.7317 0 0 0 36 0 0 0 0 - 0 0.0 0.3 0.0 99.7 0.2718 123 55 0 592 1308 708 0 161 89.0 20956 59.3 7.6 7.2 25.9 0.6319 13 48 0 295 437 238 0 18 96.5 2485 45.8 2.8 7.2 44.2 0.37…26 139 0 0 205 23 13 0 1 95.5 245 0.6 1.1 0.0 98.3 0.5127 0 0 0 52 0 0 0 0 - 0 0.0 0.2 0.0 99.8 0.4928 185 0 0 152 27 16 0 2 91.7 219 0.5 1.6 0.0 97.9 0.5229 0 0 0 54 0 0 0 0 - 0 0.0 0.2 0.0 99.8 0.4830 795 0 0 150 82 43 0 2 97.5 1075 6.2 2.1 0.7 91.1 0.5531 0 0 0 51 0 0 0 0 - 0 0.0 0.2 0.0 99.8 0.4532 0 0 0 152 8 4 0 0 100.0 16360 34.3 2.9 0.0 62.9 0.6233 52 0 0 42 38 19 0 0 100.0 198 1.2 0.3 0.0 98.5 0.3834 0 0 0 162 0 0 0 0 100.0 0 99.7 0.3 0.0 0.0 1.0035 0 0 0 9 16 8 0 0 100.0 0 0.0 87.3 0.0 12.7 0.00ALL 6851 575 0 7302 12664 7732 0 1031 94.2 195563 46.6 2.7 3.8 46.8 17.97-------------------------------------------------------------------------------------------------------------

© 2010 IBM Corporation
AIX Virtual Users Group presentation July 29, 2010
mpstat –w 2 # min:maj:int, (maj=0):int?, cs:ics, int:sysc:pc; monitor ratios to learn what is typical/normal – so you can discern what’s atypical/abnormal
$ mpstat –w 2System configuration: lcpu=12
cpu min maj mpc int cs ics rq mig lpa sysc us sy wa id pc
0 12 14 0 409 894 545 0 102 100.0 3900 41.3 10.4 6.1 42.2 0.70
1 0 0 0 179 0 0 0 0 - 0 0.0 1.4 0.0 98.6 0.30
2 15 17 0 528 1045 611 0 78 100.0 2086 26.8 11.5 13.1 48.6 0.66
3 1 0 0 211 0 0 0 0 - 0 0.0 1.6 0.0 98.4 0.34
4 42 38 0 488 1489 852 0 101 100.0 3024 30.3 12.5 17.7 39.6 0.69
5 0 0 0 214 0 0 0 0 - 0 0.0 1.8 0.0 98.2 0.31
6 21 17 0 643 1205 762 0 90 100.0 4000 33.9 12.8 8.1 45.2 0.70
7 0 0 0 194 0 0 0 0 - 0 0.0 1.6 0.0 98.4 0.30
8 0 0 0 409 5 5 0 0 100.0 119 0.0 2.1 0.0 97.9 0.55
9 0 0 0 287 0 0 0 0 - 0 0.0 1.6 0.0 98.4 0.45
10 0 0 0 303 20 10 0 0 100.0 0 0.0 1.6 0.0 98.4 0.55
11 0 0 0 288 0 0 0 0 - 0 0.0 1.6 0.0 98.4 0.45
ALL 91 86 0 4153 4658 2785 0 371 100.0 13129 15.1 6.3 5.1 73.4 6.00
------------------------------------------------------------------------------------------------------------------------------------
0 12 21 0 424 1146 693 0 99 100.0 5313 42.9 13.8 10.0 33.3 0.72
1 0 0 0 173 0 0 0 0 - 0 0.0 1.7 0.0 98.3 0.29
2 21 23 0 562 1479 843 0 91 100.0 2112 27.4 11.2 17.3 44.1 0.66
3 0 0 0 225 0 0 0 0 - 0 0.0 1.8 0.0 98.2 0.33
4 17 15 5 509 1117 668 0 106 100.0 4688 40.6 11.7 8.0 39.7 0.73
5 0 0 0 195 0 0 0 0 - 0 0.0 1.7 0.0 98.3 0.27
6 19 19 0 694 1111 671 0 93 100.0 2253 18.4 9.7 8.8 63.1 0.63
7 0 0 0 247 0 0 0 0 - 0 0.0 1.7 0.0 98.3 0.37
8 1 0 0 385 4 4 0 0 100.0 20 0.0 2.1 0.6 97.3 0.55
9 0 0 0 303 0 0 0 0 - 0 0.0 1.7 0.0 98.3 0.45
10 0 0 0 315 19 10 0 0 100.0 0 0.0 1.6 0.0 98.4 0.54
11 0 0 0 305 0 0 0 0 - 0 0.0 1.6 0.0 98.4 0.45
ALL 70 78 5 4337 4876 2889 0 389 100.0 14386 15.1 6.3 5.1 73.6 6.00
------------------------------------------------------------------------------------------------------------------------------------
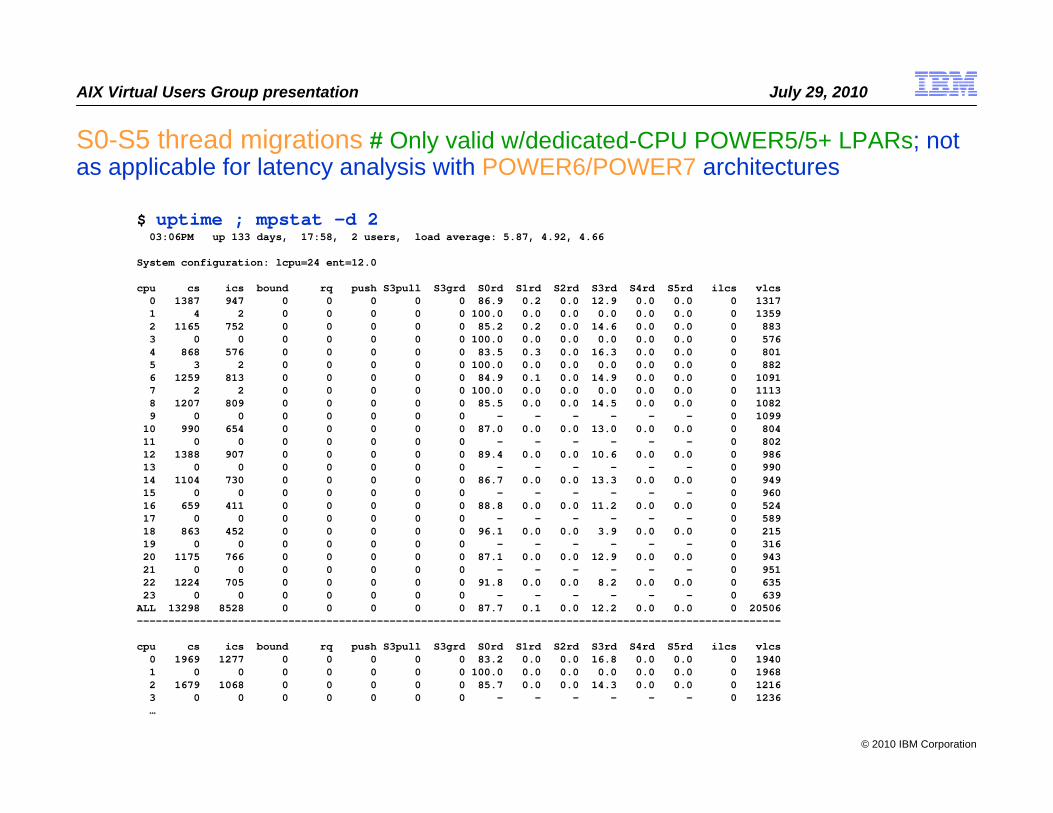
© 2010 IBM Corporation
AIX Virtual Users Group presentation July 29, 2010
S0-S5 thread migrations # Only valid w/dedicated-CPU POWER5/5+ LPARs; not as applicable for latency analysis with POWER6/POWER7 architectures
$ uptime ; mpstat -d 203:06PM up 133 days, 17:58, 2 users, load average: 5.87, 4.92, 4.66
System configuration: lcpu=24 ent=12.0
cpu cs ics bound rq push S3pull S3grd S0rd S1rd S2rd S3rd S4rd S5rd ilcs vlcs0 1387 947 0 0 0 0 0 86.9 0.2 0.0 12.9 0.0 0.0 0 13171 4 2 0 0 0 0 0 100.0 0.0 0.0 0.0 0.0 0.0 0 13592 1165 752 0 0 0 0 0 85.2 0.2 0.0 14.6 0.0 0.0 0 8833 0 0 0 0 0 0 0 100.0 0.0 0.0 0.0 0.0 0.0 0 5764 868 576 0 0 0 0 0 83.5 0.3 0.0 16.3 0.0 0.0 0 8015 3 2 0 0 0 0 0 100.0 0.0 0.0 0.0 0.0 0.0 0 8826 1259 813 0 0 0 0 0 84.9 0.1 0.0 14.9 0.0 0.0 0 10917 2 2 0 0 0 0 0 100.0 0.0 0.0 0.0 0.0 0.0 0 11138 1207 809 0 0 0 0 0 85.5 0.0 0.0 14.5 0.0 0.0 0 10829 0 0 0 0 0 0 0 - - - - - - 0 1099
10 990 654 0 0 0 0 0 87.0 0.0 0.0 13.0 0.0 0.0 0 80411 0 0 0 0 0 0 0 - - - - - - 0 80212 1388 907 0 0 0 0 0 89.4 0.0 0.0 10.6 0.0 0.0 0 98613 0 0 0 0 0 0 0 - - - - - - 0 99014 1104 730 0 0 0 0 0 86.7 0.0 0.0 13.3 0.0 0.0 0 94915 0 0 0 0 0 0 0 - - - - - - 0 96016 659 411 0 0 0 0 0 88.8 0.0 0.0 11.2 0.0 0.0 0 52417 0 0 0 0 0 0 0 - - - - - - 0 58918 863 452 0 0 0 0 0 96.1 0.0 0.0 3.9 0.0 0.0 0 21519 0 0 0 0 0 0 0 - - - - - - 0 31620 1175 766 0 0 0 0 0 87.1 0.0 0.0 12.9 0.0 0.0 0 94321 0 0 0 0 0 0 0 - - - - - - 0 95122 1224 705 0 0 0 0 0 91.8 0.0 0.0 8.2 0.0 0.0 0 63523 0 0 0 0 0 0 0 - - - - - - 0 639ALL 13298 8528 0 0 0 0 0 87.7 0.1 0.0 12.2 0.0 0.0 0 20506------------------------------------------------------------------------------------------------------
cpu cs ics bound rq push S3pull S3grd S0rd S1rd S2rd S3rd S4rd S5rd ilcs vlcs0 1969 1277 0 0 0 0 0 83.2 0.0 0.0 16.8 0.0 0.0 0 19401 0 0 0 0 0 0 0 100.0 0.0 0.0 0.0 0.0 0.0 0 19682 1679 1068 0 0 0 0 0 85.7 0.0 0.0 14.3 0.0 0.0 0 12163 0 0 0 0 0 0 0 - - - - - - 0 1236…
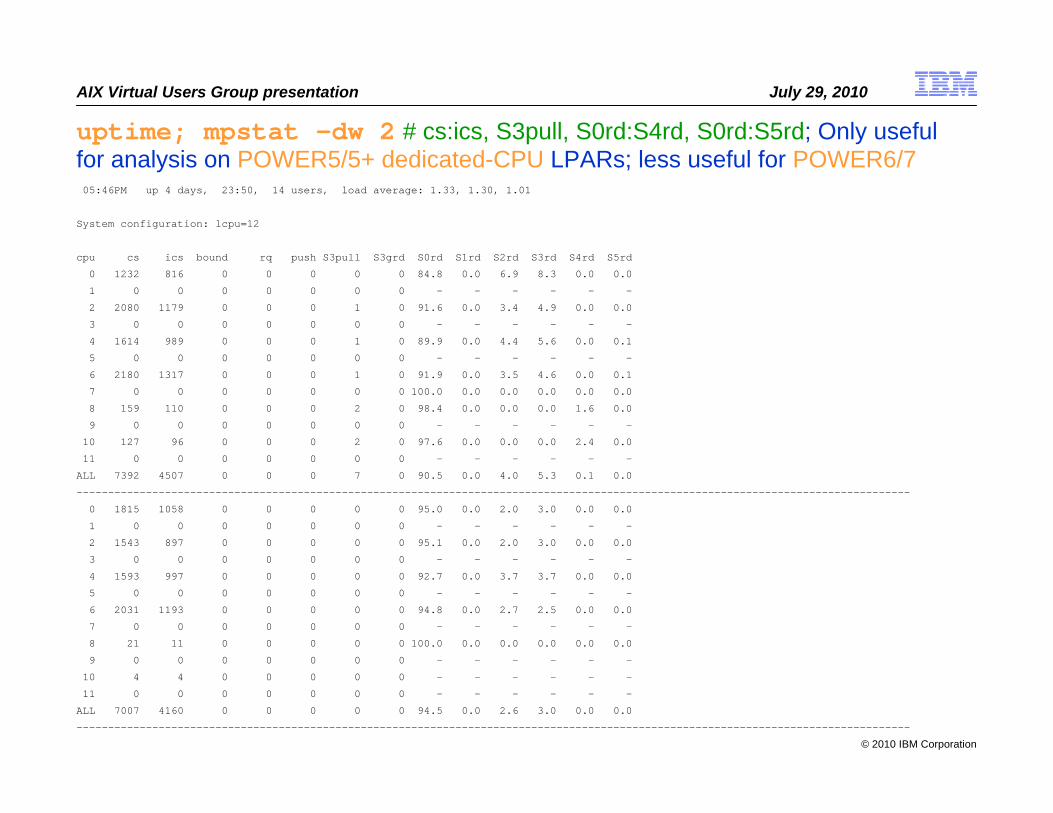
© 2010 IBM Corporation
AIX Virtual Users Group presentation July 29, 2010
uptime; mpstat –dw 2 # cs:ics, S3pull, S0rd:S4rd, S0rd:S5rd; Only useful for analysis on POWER5/5+ dedicated-CPU LPARs; less useful for POWER6/705:46PM up 4 days, 23:50, 14 users, load average: 1.33, 1.30, 1.01
System configuration: lcpu=12
cpu cs ics bound rq push S3pull S3grd S0rd S1rd S2rd S3rd S4rd S5rd
0 1232 816 0 0 0 0 0 84.8 0.0 6.9 8.3 0.0 0.0
1 0 0 0 0 0 0 0 - - - - - -
2 2080 1179 0 0 0 1 0 91.6 0.0 3.4 4.9 0.0 0.0
3 0 0 0 0 0 0 0 - - - - - -
4 1614 989 0 0 0 1 0 89.9 0.0 4.4 5.6 0.0 0.1
5 0 0 0 0 0 0 0 - - - - - -
6 2180 1317 0 0 0 1 0 91.9 0.0 3.5 4.6 0.0 0.1
7 0 0 0 0 0 0 0 100.0 0.0 0.0 0.0 0.0 0.0
8 159 110 0 0 0 2 0 98.4 0.0 0.0 0.0 1.6 0.0
9 0 0 0 0 0 0 0 - - - - - -
10 127 96 0 0 0 2 0 97.6 0.0 0.0 0.0 2.4 0.0
11 0 0 0 0 0 0 0 - - - - - -
ALL 7392 4507 0 0 0 7 0 90.5 0.0 4.0 5.3 0.1 0.0
------------------------------------------------------------------------------------------------------------------------------------
0 1815 1058 0 0 0 0 0 95.0 0.0 2.0 3.0 0.0 0.0
1 0 0 0 0 0 0 0 - - - - - -
2 1543 897 0 0 0 0 0 95.1 0.0 2.0 3.0 0.0 0.0
3 0 0 0 0 0 0 0 - - - - - -
4 1593 997 0 0 0 0 0 92.7 0.0 3.7 3.7 0.0 0.0
5 0 0 0 0 0 0 0 - - - - - -
6 2031 1193 0 0 0 0 0 94.8 0.0 2.7 2.5 0.0 0.0
7 0 0 0 0 0 0 0 - - - - - -
8 21 11 0 0 0 0 0 100.0 0.0 0.0 0.0 0.0 0.0
9 0 0 0 0 0 0 0 - - - - - -
10 4 4 0 0 0 0 0 - - - - - -
11 0 0 0 0 0 0 0 - - - - - -
ALL 7007 4160 0 0 0 0 0 94.5 0.0 2.6 3.0 0.0 0.0
------------------------------------------------------------------------------------------------------------------------------------

© 2010 IBM Corporation
AIX Virtual Users Group presentation July 29, 2010
iostat -aT 2 # Create a complete technology-stack map of I/O;i.e. RAIDset/tech->LUN-> [LVMvg:lv::JFS2mtpt w/options]->logical_content
$ iostat -aT 2 | grep -v "0.0 0.0 0.0 0 0"
System configuration: lcpu=24 drives=87 ent=12.00 paths=172 vdisks=0
tty: tin tout avg-cpu: % user % sys % idle % iowait physc % entc time0.0 62.1 92.4 4.8 0.3 2.6 11.8 98.6 15:42:10
Adapter: Kbps tps Kb_read Kb_wrtn timescsi0 2.0 0.5 4 0 15:42:10
Disks: % tm_act Kbps tps Kb_read Kb_wrtn timehdisk0 0.0 2.0 0.5 4 0 15:42:10
Adapter: Kbps tps Kb_read Kb_wrtn timescsi1 0.0 0.0 0 0 15:42:10
Disks: % tm_act Kbps tps Kb_read Kb_wrtn time
Adapter: Kbps tps Kb_read Kb_wrtn timefcs0 150429.9 7234.0 298240 2369 15:42:10
Disks: % tm_act Kbps tps Kb_read Kb_wrtn timehdisk86 14.0 228.2 16.0 264 192 15:42:10hdisk87 11.0 88.1 11.0 176 0 15:42:10hdisk88 9.5 64.1 8.0 128 0 15:42:10hdisk89 20.0 2886.4 62.1 5760 8 15:42:10hdisk90 20.5 9203.7 150.1 18392 0 15:42:10hdisk91 34.0 7190.0 351.8 14368 0 15:42:10hdisk92 59.5 6081.1 543.0 12152 0 15:42:10hdisk93 32.5 384.3 42.0 768 0 15:42:10hdisk94 12.0 260.2 21.0 304 216 15:42:10hdisk95 8.5 64.1 8.0 128 0 15:42:10hdisk96 39.0 7742.5 444.4 15280 192 15:42:10hdisk97 33.5 400.3 45.0 800 0 15:42:10hdisk98 12.0 260.2 19.5 328 192 15:42:10hdisk99 10.5 68.1 8.5 136 0 15:42:10……

© 2010 IBM Corporation
AIX Virtual Users Group presentation July 29, 2010
iostat -AQ 2 # Monitoring asynchronous I/O activity (typically via aioserver)RDBMS using aio typically exhibit in concurrent bursts (2sec intervals)
aio: avgc avfc maxg maif maxr avg-cpu: % user % sys % idle % iowait
32 0 223 0 8192 21.1 7.8 46.5 24.5
Queue# Count Filesystems
149 2 /db2/AB7/sapdata1
150 3 /db2/AB7/sapdata2
151 3 /db2/AB7/sapdata3
153 3 /db2/AB7/sapdata4
154 2 /db2/AB7/sapdata5
156 2 /db2/AB7/sapdata7
158 3 /db2/AB7/sapdata9
159 3 /db2/AB7/sapdata10
160 6 /db2/AB7/sapdata11
161 5 /db2/AB7/sapdata12
aio: avgc avfc maxg maif maxr avg-cpu: % user % sys % idle % iowait
0 0 215 0 8192 18.8 7.7 49.1 24.4
…

© 2010 IBM Corporation
AIX Virtual Users Group presentation July 29, 2010
Strategic Thoughts, Concepts, Considerations, and Tactics
Monitoring AIX – Usage, Meaning and Interpretation– Review component technology of the infrastructure, i.e. proper tuning-by-hardware– Review implemented AIX constructs, i.e. “firm” near-static structures and settings– Review historical/accumulated AIX events, usages, pendings, counts, blocks, etc.– Monitor dynamic AIX command behaviors, i.e. ps, vmstat, mpstat, iostat, topas, etc.
Recognizing Common Performance-degrading Scenarios– High Load Average relative to count-of-LCPUs, i.e. “over-threadedness”– vmstat:memory:avm near-to or greater-than lruable-gbRAM, i.e. over-committed– Continuous low vmstat:memory:fre with persistent lrud (fr:sr) activity– Continuous high ratio of vmstat:kthr:b relative to vmstat:kthr:r– Poor ratio of pending I/O waits to iodones in vmstat -s output
Tactical Check-list of What-to-Watch

© 2010 IBM Corporation
AIX Virtual Users Group presentation July 29, 2010
High Load Average relative to count-of-LCPUs, i.e. “over-threadedness”
System configuration: lcpu=128 mem=239871MB
kthr memory page faults cpu time
----------- --------------------- ------------------------------------ ------------------ ----------- --------
r b p avm fre fi fo pi po fr sr in sy cs us sy id wa hr mi se
38 0 0 36247940 1134306 10022 6471 0 0 0 0 11595 311282 416080 38 11 50 1 23:08:01
60 1 2 36349490 1030093 3903 1595 0 0 0 0 7458 358377 420907 46 10 43 1 23:08:02
0 0 0 36361251 1003440 7677 7990 1 0 0 0 10060 292767 409014 43 11 45 1 23:08:03
35 1 2 36368530 990454 6505 92 0 0 0 0 9184 264537 418087 39 10 50 1 23:08:04
27 1 0 36401856 953864 3833 41 0 0 0 0 6181 442110 332004 43 28 28 0 23:08:05
98 1 0 36443786 902689 1643 7964 0 0 0 0 6029 329798 316835 47 33 20 0 23:08:06
85 1 0 36529792 814869 2650 4 0 0 0 0 5875 246727 344842 53 22 24 0 23:08:07
54 1 0 36695785 649875 4592 29 0 0 10693 53771 7637 261305 342048 59 21 20 0 23:08:08
99 1 0 36710625 650934 4223 40 0 0 13889 77048 6807 244587 390610 45 24 30 0 23:08:09
45 1 0 36734792 620598 6352 35 0 0 0 0 8684 350507 435002 42 21 37 0 23:08:10
33 1 0 36764231 582083 9065 5 0 0 0 0 10111 251847 486571 40 21 38 0 23:08:11
36 2 2 36781445 555793 9115 40 0 0 0 0 9386 233633 432140 22 28 49 1 23:08:12
55 0 0 36857354 462204 10362 8014 0 0 0 0 11187 296126 426007 46 21 32 1 23:08:13
100 2 0 36997474 374643 13160 13 0 0 63312 337520 12250 344183 407138 65 16 18 1 23:08:14
79 1 0 36974495 375888 12967 14743 0 0 0 0 10337 263413 496578 50 25 25 0 23:08:15
94 3 0 37018259 324905 1589 992 0 0 44695 240220 6172 593465 347183 46 41 12 1 23:08:16
0 0 0 37026480 402687 1899 39740 0 0 14796 82454 6355 164643 325407 17 64 11 8 23:08:17
60 25 0 37127886 320753 9624 80065 1 0 77802 416638 11793 282172 473596 54 35 7 4 23:08:18
179 24 0 37229111 324464 5116 16020 0 1 124674661349 9837 261490 494991 61 30 6 4 23:08:19
99 19 0 37212306 405774 18191 8117 0 42 89516 459518 11330 225756 425797 39 36 24 1 23:08:20
kthr memory page faults cpu time
----------- --------------------- ------------------------------------ ------------------ ----------- --------
r b p avm fre fi fo pi po fr sr in sy cs us sy id wa hr mi se
87 2 0 37205572 397386 15420 67 0 0 0 0 6062 98600 205265 28 60 12 0 23:08:21
110 0 0 37210411 381230 11371 1268 0 0 0 0 8002 174732 367078 33 36 30 1 23:08:22
52 1 0 37220337 359035 23466 128 0 0 11284 50173 14472 226184 443127 35 27 37 0 23:08:23
55 0 0 37234473 356191 15934 356 0 0 23547 96122 9191 193647 382616 34 32 34 0 23:08:24

© 2010 IBM Corporation
AIX Virtual Users Group presentation July 29, 2010
vmstat:memory:avm near-to or greater-than lruable-gbRAM;memory over-committed 3986734*4096=16329mb vs 15744mb
System configuration: lcpu=8 mem=15744MB
kthr memory page faults cpu time
----------- --------------------- ------------------------------------ ------------------ ----------- --------
r b p avm fre fi fo pi po fr sr in sy cs us sy id wa hr mi se
1 1 0 3986577 2652 1944 797 0 0 1536 12803 880 2377 4459 10 4 55 31 14:17:58
2 2 0 3986576 2553 1863 757 0 0 2557 37067 852 4053 4446 11 4 55 30 14:18:00
2 1 0 3986574 2206 1959 799 0 0 2559 37499 1009 2523 4559 10 6 53 31 14:18:02
0 3 0 3986573 2597 2044 843 0 0 3069 42804 912 2377 4553 11 4 55 30 14:18:04
1 2 0 3986571 2511 1870 754 0 0 2559 167438 804 2203 4247 10 4 56 30 14:18:06
0 2 0 3986571 2197 1944 787 0 0 2560 102054 814 2310 4063 10 4 56 30 14:18:08
0 2 0 3986570 2872 1960 792 0 0 3070 42557 889 4148 4532 11 4 54 30 14:18:10
1 2 0 3986569 3752 1876 764 0 0 3070 65622 933 2363 4834 10 5 53 32 14:18:12
1 2 0 3986568 3864 1787 730 0 0 2559 49907 880 2135 4617 9 4 53 33 14:18:14
1 1 0 3986567 2634 1915 767 0 0 2047 30676 785 2774 3948 10 4 55 31 14:18:16
0 3 0 3986567 2523 1890 759 0 0 2552 27693 877 2646 4443 10 4 55 32 14:18:18
1 2 0 3986573 2040 2008 810 0 0 2557 23419 928 5155 4671 12 4 54 30 14:18:20
1 2 0 3986572 1962 1878 761 0 0 2554 52663 905 2525 4795 10 4 56 29 14:18:22
2 2 0 3986587 2652 1960 798 3 0 3071 14081 1030 11377 7789 13 9 51 27 14:18:24
2 2 0 3986570 2363 1938 781 0 0 2558 30570 836 3004 5732 10 5 56 29 14:18:26
2 1 0 3986734 2056 1884 762 1 0 2557 32017 888 31414 6058 15 11 47 26 14:18:28
2 0 0 3986617 1933 1920 779 2 0 2558 15377 933 22108 5545 15 9 48 28 14:18:30
1 0 0 3986612 2463 2008 826 0 0 3069 25129 1192 2823 5935 11 9 52 28 14:18:32
1 2 0 3986586 3073 1988 810 0 0 3064 15116 816 2732 4430 10 4 56 30 14:18:34
0 1 0 3986587 3402 1719 685 0 0 2555 24262 799 3395 4429 9 4 58 29 14:18:36
kthr memory page faults cpu time
----------- --------------------- ------------------------------------ ------------------ ----------- --------
r b p avm fre fi fo pi po fr sr in sy cs us sy id wa hr mi se
0 3 0 3986582 2347 1841 748 0 0 2047 14678 865 2352 4683 10 4 56 31 14:18:38
0 1 0 3986580 3068 1945 784 0 0 3070 24649 784 4741 4233 11 4 55 29 14:18:40
0 2 0 3986583 2797 1929 780 0 0 2559 16436 806 2466 4205 10 4 57 29 14:18:42

© 2010 IBM Corporation
AIX Virtual Users Group presentation July 29, 2010
Continuous high ratio of vmstat:kthr:b relative to vmstat:kthr:r
System configuration: lcpu=8 mem=20480MB ent=3.90
kthr memory page faults cpu time
----------- --------------------- ------------------------------------ ------------------ ----------------------- --------
r b p avm fre fi fo pi po fr sr in sy cs us sy id wa pc ec hr mi se
1 11 0 2381462 12283 574 41 4 0 0 0 282 14044 3759 36 3 36 24 1.59 40.8 02:00:03
5 6 0 2383434 9229 537 21 15 0 0 0 214 9309 1221 65 8 22 5 2.94 75.4 02:00:05
3 5 0 2381734 10665 571 5 4 0 451 1303 442 8902 3345 83 6 5 6 3.53 90.4 02:00:07
3 10 0 2383409 7700 666 1 3 0 0 0 232 2606 1828 46 7 20 28 2.08 53.3 02:00:09
6 10 0 2383410 7743 611 0 0 0 661 1956 270 5229 3206 93 2 2 4 3.72 95.3 02:00:11
5 8 0 2384836 7559 544 35 1 45 1150 3962 475 9629 4267 48 10 22 19 2.33 59.7 02:00:13
4 7 0 2385533 8572 569 82 1 30 1437 3311 259 8388 1512 83 2 6 10 3.33 85.3 02:00:15
2 8 0 2387636 7716 411 90 5 7 967 2971 467 40650 2367 58 15 12 16 2.89 74.1 02:00:17
5 7 0 2390359 7622 542 20 19 11 1908 5953 360 18005 2195 77 4 9 10 3.19 81.8 02:00:19
3 11 0 2390756 7956 511 0 91 10 977 3899 178 3897 1655 59 2 17 22 2.40 61.5 02:00:21
3 9 0 2390761 7750 487 16 87 0 504 1368 471 3018 2893 45 2 33 19 1.89 48.5 02:00:23
6 7 0 2392294 7597 483 4 80 40 1227 3822 233 4682 2070 69 5 17 9 2.92 75.0 02:00:25
4 8 0 2392294 7837 413 30 53 0 571 2025 416 4990 5019 85 2 5 8 3.45 88.4 02:00:27
8 8 0 2392294 7704 409 0 0 0 385 983 184 2894 3480 53 1 25 20 2.16 55.3 02:00:29
11 8 0 2387726 19279 325 114 118 177 3971 13773 224 39964 2564 84 15 0 1 3.88 99.6 02:00:31
4 13 0 2402933 7698 390 656 189 118 3732 14638 436 39993 4822 53 24 7 16 3.06 78.6 02:00:33
5 11 0 2403390 8018 396 57 95 6 946 3780 263 23753 1784 93 3 1 3 3.77 96.6 02:00:35
3 11 0 2402851 7753 424 17 73 0 64 98 393 6538 2994 52 6 9 33 2.31 59.3 02:00:37
5 11 0 2404724 7710 354 10 49 0 1356 5981 239 4234 1928 70 6 16 9 2.96 75.8 02:00:39
3 11 0 2404716 8279 324 23 36 0 586 2056 436 6414 3849 76 2 8 13 3.12 80.0 02:00:41
kthr memory page faults cpu time
----------- --------------------- ------------------------------------ ------------------ ----------------------- --------
r b p avm fre fi fo pi po fr sr in sy cs us sy id wa pc ec hr mi se
5 13 0 2404718 8054 373 0 0 0 274 784 192 1603 2058 56 1 26 17 2.36 60.4 02:00:43
5 13 0 2404716 7965 311 0 0 0 273 583 237 2342 2394 79 1 7 13 3.16 81.0 02:00:45
2 12 0 2388769 26143 353 22 35 3 322 590 390 3550 3130 48 4 25 24 2.06 52.9 02:00:47

© 2010 IBM Corporation
AIX Virtual Users Group presentation July 29, 2010
Poor ratio of pending I/O waits to iodones in vmstat -s output
02:18PM up 223 days, 15:57, 5 users, load average: 2.00, 2.54, 2.88
3955510096 total address trans. faults
663204206 page ins
2212345555 page outs
146844573 paging space page ins
136603972 paging space page outs
0 total reclaims
1876773643 zero filled pages faults
29655645 executable filled pages faults
3363959830 pages examined by clock
819733 revolutions of the clock hand
1565374921 pages freed by the clock
82564968 backtracks
5138 free frame waits
0 extend XPT waits
2353814111 pending I/O waits
2859262790 start I/Os
2376968599 iodones
50335935279 cpu context switches
16475063625 device interrupts
1149300248 software interrupts
8545158185 decrementer interrupts
88508563 mpc-sent interrupts
88508328 mpc-receive interrupts
1247188423 phantom interrupts
0 traps
223061804590 syscalls

© 2010 IBM Corporation
AIX Virtual Users Group presentation July 29, 2010
Strategic Thoughts, Concepts, Considerations, and Tactics
Monitoring AIX – Usage, Meaning and Interpretation– Review component technology of the infrastructure, i.e. proper tuning-by-hardware– Review implemented AIX constructs, i.e. “firm” near-static structures and settings– Review historical/accumulated AIX events, usages, pendings, counts, blocks, etc.– Monitor dynamic AIX command behaviors, i.e. ps, vmstat, mpstat, iostat, topas, etc.
Recognizing Common Performance-degrading Scenarios– High Load Average relative to count-of-LCPUs, i.e. “over-threadedness”– vmstat:memory:avm near-to or greater-than lruable-gbRAM, i.e. over-committed– Continuous low vmstat:memory:fre with persistent lrud (fr:sr) activity– Continuous high ratio of vmstat:kthr:b relative to vmstat:kthr:r– Poor ratio of pending I/O waits to iodones in vmstat -s output
Tactical Check-list of What-to-Watch

© 2010 IBM Corporation
AIX Virtual Users Group presentation July 29, 2010
Tactical Check-list of What-to-Watch: check balance of component capacities/capabilities for workload, i.e. ensure proper tuning-by-hardware
date ; uname -a ; id ; oslevel –s; lparstat -i
prtconf
lscfg
lsdev

© 2010 IBM Corporation
AIX Virtual Users Group presentation July 29, 2010
Tactical Check-list of What-to-Watch: Review implemented AIX constructs, i.e. “firm” near-static structures and settings
lsps –a
lsps –s
mount
df –k
ipcs –bm
vmo –L
ioo -L

© 2010 IBM Corporation
AIX Virtual Users Group presentation July 29, 2010
Tactical Check-list of What-to-Watch: Review historical/accumulated AIX events, usages, delays, counts, exhaustions, etc.
uptime; vmstat –s
uptime; vmstat –v
uptime ; ps -ekf | egrep "syncd|lrud|nfsd|biod|wait"
iostat –a
iostat –D
vmstat –v | grep pbuf
for VG in `lsvg`; do; lvmo -a -v $VG; echo; done
netstat –ss
netstat –v
nfsstat

© 2010 IBM Corporation
AIX Virtual Users Group presentation July 29, 2010
Tactical Check-list of What-to-Watch: Monitor dynamic AIX command behaviors, i.e. ps, vmstat, mpstat, iostat, topas, etc.
topas <cr> d n c c
ps –kelmo THREAD
ps guww
ps gvww
vmstat –Iwt 2
mpstat –w 2
mpstat –dw 2
iostat –aT 2
iostat -AQ 2

© 2010 IBM Corporation
AIX Virtual Users Group presentation July 29, 2010
67 29-Jul-10
TrademarksThe following are trademarks of the International Business Machines Corporation in the United States, other countries, or both.
The following are trademarks or registered trademarks of other companies.
* All other products may be trademarks or registered trademarks of their respective companies.
Notes: Performance is in Internal Throughput Rate (ITR) ratio based on measurements and projections using standard IBM benchmarks in a controlled environment. The actual throughput that any user will experience will vary depending upon considerations such as the amount of multiprogramming in the user's job stream, the I/O configuration, the storage configuration, and the workload processed. Therefore, no assurance can be given that an individual user will achieve throughput improvements equivalent to the performance ratios stated here. IBM hardware products are manufactured from new parts, or new and serviceable used parts. Regardless, our warranty terms apply.All customer examples cited or described in this presentation are presented as illustrations of the manner in which some customers have used IBM products and the results they may have achieved. Actual environmental costs and performance characteristics will vary depending on individual customer configurations and conditions.This publication was produced in the United States. IBM may not offer the products, services or features discussed in this document in other countries, and the information may be subject to change without notice. Consult your local IBM business contact for information on the product or services available in your area.All statements regarding IBM's future direction and intent are subject to change or withdrawal without notice, and represent goals and objectives only.Information about non-IBM products is obtained from the manufacturers of those products or their published announcements. IBM has not tested those products and cannot confirm the performance, compatibility, or any other claims related to non-IBM products. Questions on the capabilities of non-IBM products should be addressed to the suppliers of those products.Prices subject to change without notice. Contact your IBM representative or Business Partner for the most current pricing in your geography.
Adobe, the Adobe logo, PostScript, and the PostScript logo are either registered trademarks or trademarks of Adobe Systems Incorporated in the United States, and/or other countries.Cell Broadband Engine is a trademark of Sony Computer Entertainment, Inc. in the United States, other countries, or both and is used under license therefrom. Java and all Java-based trademarks are trademarks of Sun Microsystems, Inc. in the United States, other countries, or both. Microsoft, Windows, Windows NT, and the Windows logo are trademarks of Microsoft Corporation in the United States, other countries, or both.Intel, Intel logo, Intel Inside, Intel Inside logo, Intel Centrino, Intel Centrino logo, Celeron, Intel Xeon, Intel SpeedStep, Itanium, and Pentium are trademarks or registered trademarks of Intel Corporation or its subsidiaries in the United States and other countries.UNIX is a registered trademark of The Open Group in the United States and other countries. Linux is a registered trademark of Linus Torvalds in the United States, other countries, or both. ITIL is a registered trademark, and a registered community trademark of the Office of Government Commerce, and is registered in the U.S. Patent and Trademark Office.IT Infrastructure Library is a registered trademark of the Central Computer and Telecommunications Agency, which is now part of the Office of Government Commerce.
For a complete list of IBM Trademarks, see www.ibm.com/legal/copytrade.shtml:
*, AS/400®, e business(logo)®, DBE, ESCO, eServer, FICON, IBM®, IBM (logo)®, iSeries®, MVS, OS/390®, pSeries®, RS/6000®, S/30, VM/ESA®, VSE/ESA, WebSphere®, xSeries®, z/OS®, zSeries®, z/VM®, System i, System i5, System p, System p5, System x, System z, System z9®, BladeCenter®
Not all common law marks used by IBM are listed on this page. Failure of a mark to appear does not mean that IBM does not use the mark nor does it mean that the product is not actively marketed or is not significant within its relevant market.
Those trademarks followed by ® are registered trademarks of IBM in the United States; all others are trademarks or common law marks of IBM in the United States.

© 2010 IBM Corporation
AIX Virtual Users Group presentation July 29, 2010
DisclaimersNo part of this document may be reproduced or transmitted in any form without written permission from IBM
Corporation.
Product data has been reviewed for accuracy as of the date of initial publication. Product data is subject to change without notice. This information could include technical inaccuracies or typographical errors. IBM may make improvements and/or changes in the product(s) and/or program(s) at any time without notice. Any statements regarding IBM's future direction and intent are subject to change or withdrawal without notice, and represent goals and objectives only.
The performance data contained herein was obtained in a controlled, isolated environment. Actual results that may be obtained in other operating environments may vary significantly. While IBM has reviewed each item for accuracy in a specific situation, there is no guarantee that the same or similar results will be obtained elsewhere. Customer experiences described herein are based upon information and opinions provided by the customer. The same results may not be obtained by every user.
Reference in this document to IBM products, programs, or services does not imply that IBM intends to make such products, programs or services available in all countries in which IBM operates or does business. Any reference to an IBM Program Product in this document is not intended to state or imply that only that program product may be used. Any functionally equivalent program, that does not infringe IBM's intellectual property rights, may be used instead. It is the user's responsibility to evaluate and verify the operation on any non-IBM product, program or service.
THE INFORMATION PROVIDED IN THIS DOCUMENT IS DISTRIBUTED "AS IS" WITHOUT ANY WARRANTY, EITHER EXPRESS OR IMPLIED. IBM EXPRESSLY DISCLAIMS ANY WARRANTIES OF MERCHANTABILITY, FITNESS FOR A PARTICULAR PURPOSE OR INFRINGEMENT. IBM shall have no responsibility to update this information. IBM products are warranted according to the terms and conditions of the agreements (e.g. IBM Customer Agreement, Statement of Limited Warranty, International Program License Agreement, etc.) under which they are provided. IBM is not responsible for the performance or interoperability of any non-IBM products discussed herein.

© 2010 IBM Corporation
AIX Virtual Users Group presentation July 29, 2010
Disclaimers ContinuedInformation concerning non-IBM products was obtained from the suppliers of those products, their published
announcements or other publicly available sources. IBM has not tested those products in connection with this publication and cannot confirm the accuracy of performance, compatibility or any other claims related to non-IBM products. Questions on the capabilities of non-IBM products should be addressed to the suppliers of those products.
The providing of the information contained herein is not intended to, and does not, grant any right or license under any IBM patents or copyrights. Inquiries regarding patent or copyright licenses should be made, in writing, to:
IBM Director of LicensingIBM CorporationNorth Castle DriveArmonk, NY 10504-1785USA
IBM customers are responsible for ensuring their own compliance with legal requirements. It is the customer's sole responsibility to obtain advice of competent legal counsel as to the identification and interpretation of any relevant laws and regulatory requirements that may affect the customer's business and any actions the customer may need to take to comply with such laws.
IBM does not provide legal advice or represent or warrant that its services or products will ensure that the customer is in compliance with any law.
The information contained in this documentation is provided for informational purposes only. While efforts were made to verify the completeness and accuracy of the information provided, it is provided “as is” without warranty of any kind, express or implied. IBM shall not be responsible for any damages arising out of the use of, or otherwise related to, this documentation or any other documentation. Nothing contained in this documentation is intended to, nor shall have the effect of, creating any warranties or representations from IBM (or its suppliers or licensors), or altering the terms and conditions of the applicable license agreement governing the use of IBM software.
© 2010 IBM Corporation
AIX Virtual Users Group presentation July 29, 2010
AIX 5L/6 Performance Tuning Part I: Tactics for Monitoring Indications of Performance Issues
Thank YouEarl JewIBM Field Technical Sales Specialist for Power Systems and StorageIBM Regional Designated Specialist - Power/AIX Performance & Tuning400 North Brand Blvd., Suite 700 c/o IBM, Glendale, CA, USA [email protected] (310)251-2907