airport local air quality studies (alaqs) … · alaqs - airport local air quality studies concept...
TRANSCRIPT

EUROPEAN ORGANISATION FOR THE SAFETY OF AIR NAVIGATION
EUROCONTROL EXPERIMENTAL CENTRE EUROCONTROL
SOCIETY-ENVIRONMENT-ECONOMY
AIRPORT LOCAL AIR QUALITY STUDIES (ALAQS)
Concept Document
Issue – 2.1
EEC/SEE/2005/003

(report title)
ii 2.1
Intentionally blank

ALAQS - Airport Local Air Quality Studies CONCEPT DOCUMENT
2.1 iii
EEXXEECCUUTTIIVVEE SSUUMMMMAARRYY
Airports bring many benefits, but airport operations can have a significant impact on those living nearby. Airport activities affect the environment in several ways, contributing to increased noise and emissions, and degrading air quality. Airport operators and airlines face pressure from two fronts – the real environmental impact of increasing air traffic, and increasing public awareness of local air quality around airports. This pressure translates into additional constraints on airport capacity which compound constraints already in place for noise restrictions and mandatory air quality limits such as EU Directive 1999/30/EC due to come into force in 2010 [Ref 3.].
Thus local air quality is an increasingly important issue for airports. Many airport operators are well aware of the local air quality issues. A high profile example is the third runway issue at London Heathrow where BAA acknowledges their stewardship for air quality issues concerning the airport [Ref 8.]. To comply with national and international air quality directives and strategies airport operators must carry out detailed assessments of the impact of pollution. And, as a consequence, airports need a consistent and accurate methods and tools to assess the current and future impact of their activities on air quality. In Europe airport authorities can use several commercial products to assess local air quality, but the methods employed by these tools are often not completely suitable to the complex situation at a typical airport.
The EUROCONTROL Experimental Centre ALAQS (Airport Local Air Quality Studies) Project addresses the strategic, methodological and practical issues surrounding air quality assessment around airports. The aim of the project is to raise awareness among airport operators and practitioners about ‘best practice’ emissions inventory and dispersion modelling methods that are specifically relevant to all European airports. ALAQS achieves this aim through case studies using the ALAQS-AV test-bed resulting in guidelines and methods that can be applied at a Pan-European level. The GIS-based tool ALAQS-AV was developed especially for the ALAQS project and draws on new and existing methods. ALAQS-AV can be used to conduct airport air quality studies, or as a test-bed for comparing different emission factors, inventory and dispersion methodologies.
In the context of demonstrating different methodologies, a number of case studies have been commissioned by the ALAQS project at several European airports whose operators have acknowledged experience in air quality monitoring and environmental issues. Also, some Eastern European airports have shown interest to participate in the ALAQS project during European air quality working groups, and case studies have also been initiated with them.
The first section of this report presents an overview of airport air quality concepts and the history of the ALAQS project; the second section describes the scope of the ALAQS project and provides a description of the toolset and database; the third section describes the emission estimation methods implemented in ALAQS for different airport sources; and the last section presents the current development on dispersion modelling and how this is integrated in the ALAQS project, and provides details on collaboration projects conducted with universities in the field of atmospheric chemistry.
The ALAQS-AV user manual and more detailed reports on the case studies can be found on the EEC website: http://www.eurocontrol.int/eec/public/related_links/SEE_reports.html .

ALAQS - Airport Local Air Quality Studies CONCEPT DOCUMENT
iv 2.1
(left blank or page 2 of Exec Summary)

ALAQS - Airport Local Air Quality Studies CONCEPT DOCUMENT
2.1 v
REPORT DOCUMENTATION PAGE
Reference: SEE Note No. EEC/SEE/2005/003
Security Classification: Unclassified
Originator: Society, Environment, Economy Research Area
Originator (Corporate Author) Name/Location: EUROCONTROL Experimental Centre Centre de Bois des Bordes B.P.15 91222 BRETIGNY SUR ORGE CEDEX France Telephone: +33 1 69 88 75 00
Sponsor: EUROCONTROL EATM
Sponsor (Contract Authority) Name/Location: EUROCONTROL Agency Rue de la Fusée, 96 B –1130 BRUXELLES Telephone: +32 2 729 90 11
TITLE: Report Title Airport Local Air Quality Studies (ALAQS) - Concept Document Issue 2.1 Authors : Ayce CELIKEL, Ian FULLER, Marcel SILUE, Serge PEETERS, Nicolas DUCHENE
Date 01/06
Pages 34
Figures 9
Tables 2
Appendix
References 6
EATMP Task Specification -
Project ALAQS
Task No. Sponsor -
Period 2002-2006
Distribution Statement: (a) Controlled by: EUROCONTROL Project Manager (b) Special Limitations: None (c) Copy to NTIS: YES / NO Descriptors (keywords): Local air quality - Emissions - Pollutants - Airport Sources - Dispersion modelling
Abstract: The concept document describes the methods and philosophy of the Eurocontrol Airport Local Air Quality Studies (ALAQS) project and the ALAQS-AV toolset (April 2005 version).

ALAQS - Airport Local Air Quality Studies CONCEPT DOCUMENT
6 2.1
Intentionally blank
ALAQS - Airport Local Air Quality Studies CONCEPT DOCUMENT
vii
TABLE OF CONTENTS
EXECUTIVE SUMMARY ........................................................................................... iii
INTRODUCTION......................................................................................................... 1 Overview............................................................................................................................................. 1 History................................................................................................................................................. 1 Case Studies ...................................................................................................................................... 2
ALAQS Project Design and Objectives ................................................................... 4 Airport Emission Sources: .................................................................................................................. 4 Pollutants ............................................................................................................................................ 5 The ALAQS-AV toolset ....................................................................................................................... 6
Activity profiles............................................................................................................................... 7
Aircraft movement data ................................................................................................................. 7
Gate scenarios............................................................................................................................... 7
Emission calculations in ALAQS-AV ............................................................................................. 8
ALAQS Emission Factor Database .................................................................................................... 9
Methodologies......................................................................................................... 11 Aircraft Emissions ............................................................................................................................. 11
Taxiway emissions....................................................................................................................... 11
Vertical profiles. ........................................................................................................................... 12
Aircraft Grouping.......................................................................................................................... 13
Engine type. ................................................................................................................................. 14
Selection of a methodology for gate and road vehicle emissions .................................................... 15 Gate emissions (GSE, APU, GPU and Engine Start)....................................................................... 15 Vehicle Emissions............................................................................................................................. 17 Stationary Source Emissions............................................................................................................ 19
Dispersion Modelling and Chemistry .................................................................... 20
Future Work............................................................................................................. 22
References............................................................................................................... 23

ALAQS - Airport Local Air Quality Studies CONCEPT DOCUMENT
viii 2.1
LIST OF TABLES
TABLE 1: AIRCRAFT GROUPS.........................................................................................................................15 TABLE 2: GSE TECHNICAL AND OPERATIONAL PARAMETERS.............................................................16 TABLE 3: ENGINE START AIRCRAFT GROUPS AND EMISSION INDICES..............................................17
LIST OF FIGURES
FIGURE 1: AIRPORT EMISSION SOURCES ......................................................................................................5 FIGURE 2: ALAQS-AV SCREEN SHOT FOR DATA INPUT ............................................................................6 FIGURE 3: ALAQS - EXAMPLE OF INVENTORY RESULTS REPRESENTATION - NOX...........................9 FIGURE 4: ALAQS-AV DATABASE SCHEMATIC .........................................................................................10 FIGURE 5: CLIMB-OUT PROFILES - ALAQS DEFAULT AND INM FOR A LARGE JET (B772) .............13 FIGURE 6: AIRCRAFT GROUPING EXAMPLE - ONE YEAR OF TRAFFIC MOVEMENTS (2003)..........14 FIGURE 7: GSE EMISSION METHODOLOGY OVERVIEW ..........................................................................16 FIGURE 8: VEHICLE EMISSIONS - ALAQS METHOD SCHEMATIC ..........................................................18 FIGURE 9: ALAQS DISPERSION MODEL INTERFACE OVERVIEW...........................................................21

ALAQS - Airport Local Air Quality Studies CONCEPT DOCUMENT
ix
ABBREVIATIONS
Acronym Definition
ACARE Advisory Council for Aviation Research in Europe.
ALAQS Airport Local Air Quality Studies
ALAQS-AV ALAQS tool
ANCAT Abatement of Nuisances Caused by Air Transport
ANTLE Affordable Near Term Low Emissions
AP AirPort
APU Auxiliary Power Unit
AV Arc View
BAA British Airports Authority
CAEP Committee on Aviation Environmental Protection
CITEPA Centre Interprofessionnel Technique d'études de la Pollution Atmosphérique.
CNG Compressed Natural Gas
COPERT III Computer Program to calculate Emissions from Road Transport III
CORINAIR Acronym for air emission inventory initially developed in the frame of the CORINE programme COoRdination d'INformation anvironnementale.
ECAC European Civil Aviation Conference
EDMS Emission and Dispersion Modeling Software (US EPA)
EEA European Environmental Agency
EEC Eurocontrol Experimental Centre
EPA US Environmental Protection Agency
FAA Federal Aviation Administration
FOI Swedish Aviation Instirute
GIS Geographical Information System
GPU Ground Power Unit
GSE Ground System Equipment
HDV Heavy Duty Vehicle
IATA International Air Transport Association
ICAO International Civil Aviation Organization
INM Integrated Noise Model
LDV Light Duty Vehicle
LPG Liquefied Petroleum Gas
LTO ICAO Landing and Take Off cycle
PC Passenger Car
SEE Social, Economic and Environment
STNA Service Technique de la Navigation Aerienne (French Civil Aviation Authority)
UNIQUE Zurich airport operator

ALAQS - Airport Local Air Quality Studies CONCEPT DOCUMENT
x 2.1
ALAQS - Airport Local Air Quality Studies CONCEPT DOCUMENT
1
IINNTTRROODDUUCCTTIIOONN
Overview
The aviation industry is experiencing rapid growth and there are increasing environmental concerns about noise pollution and the degradation of local air quality and the resulting effects on human health (e.g. Tunstall-Pedoe et al, 19961) ). At airports in particular, there are also non-aircraft pollution sources related to land-based transport, aircraft supply and support equipment, fuel tanks, refuelling facilities, etc. Airports are also intermodal transport hubs, including nearby roadways and industries; these sources can make it difficult to determine the effect of airport-induced emissions on the environment.
To address the health concerns related to local air pollution, legislators have developed framework directives on ambient air quality assessment. Besides the EU Framework Directives, some European countries are also developing national Air Quality Strategies. However, it is difficult to estimate the airport-related pollution by only monitoring the ambient air quality, as there are also other sources that contribute to the overall pollution. Therefore, estimating the contribution of airport sources relative to regional pollution can only be achieved by modelling2. The modelling comprises both inventory of the emission quantities, and dispersion modelling to estimate the atmospheric concentrations of the pollutants.
The ALAQS project aims to promote ‘best practice’ in airport air quality modelling, through a series of studies based on the demonstration and implementation of emissions inventory and dispersion modelling methods and parameters. To demonstrate the merits of each method, the project uses a GIS (Geographical Information System) based toolset – ALAQS-AV. The choice of a GIS as a test bench simplifies the process of defining the various airport elements (runways, taxiways, buildings, etc.) and allows the spatial distribution of emissions to be visualized.
History
EUROCONTROL has supported international and European environmental groups with several projects related to ATM and environment. Recently local air quality issues have also become a concern, as it is believed that this could have a constraining effect on airport capacity in the long-term. Thus, developing a methodology to estimate the effect of airport operations on local air quality became important, as it is complex to estimate the air quality effect of airport operations: First the quantity and rates of emissions for each source have to be estimated, and then plume concentrations must be calculated.
Air quality issues around airports create some health concerns for society. These concerns are typically managed through national or regional regulatory frameworks and standards for air pollution. A variety of pollutants are regulated: Nitrogen Dioxide (NO2), Sulphur Dioxide (SO2), Carbon Monoxide (CO), Hydrocarbons (HC or VOC), Ozone (O3), Particulate Matter
1 Tunstall-Pedoe, N., Raper, D. W. and Holden, J. (Eds) (1996) Airports and the Environment - liabilities and social responsibilities. Proceedings of International Conference, Manchester Airport, July 1995. Thomas Telford, London. ISBN 0 7277 2520 3 2 Rogers H. L., Lee D. S., Raper D. W., Forster P. M. de F., Wilson C. W. and Newton P. The impacts of aviation on the atmosphere. QINETIC/FST/CAT/TR021654

ALAQS - Airport Local Air Quality Studies CONCEPT DOCUMENT
2 2.1
(PM10 or PM2.5) as well as a number of heavy metals (e.g. lead). As a result, airport authorities often have to monitor these pollutants in the airport surroundings.
The industry response to this issue is extensive. In particular the industry has commissioned a number of studies (for example AEROCERT, AERO2K) to better understand strengths and sources of emissions, and operational characteristics of key sources such as aircraft. ICAO publishes engine emission certifications for several pollutants (unburned hydrocarbons, nitrogen oxides, and carbon monoxide). At the local level, airports are working alongside regional partners and stakeholders to assess the impact of airport emissions on local air quality, and to develop management strategies and plans.
Governments and international organisations are also showing interest in the local air quality issues. AERONET and ICAO WG2 have both launched working groups on air quality issues.
The SEE business area ALAQS (Airport Local Air Quality Studies) project has started to develop Pan-European methodology in order to assess the contribution of aviation to the surrounding local air quality. However, as there is currently no standardised European approach, some airports have developed their own methods and approaches to conduct ALAQS studies.
During the ALAQS project the GIS-based ALAQS-AV tool was developed to create a test bed for different methods and emission factors. After almost two years of development ALAQS-AV has achieved a certain maturity, but several evolutions are planned in 2005 to continue improving the tool. The integration of dispersion modelling systems (such as LASAT) is foreseen with the use of a ‘smoothed and shifted’ approach and studies of atmospheric chemistry modelling issues will be undertaken based on collaborative research with Brunel University and Richard Ramaroson of ONERA. . Also, in the context of demonstrating the effect of using different methodologies and different parameters, some Airport case studies were commissioned. Zurich Airport was chosen as a case study for the final development stage, as they have acknowledged experience in air quality monitoring and modelling. This case study follows a number of other collaborations carried out during the development phase of ALAQS, with organisations such as Lyon Airport, Zurich Airport UNIQUE, STNA, MMU, BAA and air quality working groups.
Case Studies
The ALAQS project received interest from European airport operators and the European Community. Several case studies at European airports were completed and more are planned. The added value of case studies to the project is to improve emission calculation methodologies via the investigation and validation of different methods and parameters, as well as to obtain operational data via expert users. In parallel, a better understanding of data requirements is expected, together with a data availability assessment and the identification of limitations due to non-expert users.
Initial case studies were made at Lyon Airport in 2003 and 2004. Another study at Zurich Airport provided a comparison of three inventory methods (ALAQS-AV v1, LASPORT v1.2, and EDMS v4.12) using different emission factors and aircraft vertical profiles. Other partners showed interest in conducting air quality studies with ALAQS-AV and these studies started in 2004 (Bucharest Henri Coanda airport, Warsaw F. Chopin airport, and Munich Technical University).
These case studies have shown that the data currently collected at airports does not necessarily correspond to the data specified in the methodologies. As ALAQS-AV is used as a test-bench for these studies, it serves to identify issues concerning the data collection, which in turn gives important feedback for improvement of the tool and the methods. Method

ALAQS - Airport Local Air Quality Studies CONCEPT DOCUMENT
3
improvements may also be initiated through sensitivity analyses using the case study data, and field measurements are planned to validate dispersion modelling methods.
The case studies can also be used to extrapolate future scenario estimations.
Following each case study, a report will be published comprising the following sections:
Study definition
Data collection
ALAQS-AV set-up
4D emission inventory simulation (i.e. 3 dimensions for x, y, z axis plus time)
Presentation of results
The outputs of the case studies are used as feedback for review of the methods and parameters.
For future case studies, new environmental scenarios, which include forecasts to future years, will be considered together with the resulting dispersion modelling.

ALAQS - Airport Local Air Quality Studies CONCEPT DOCUMENT
4 2.1
AALLAAQQSS PPrroojjeecctt DDeessiiggnn aanndd OObbjjeeccttiivveess The ALAQS project, initiated in 2003, is part of the EEC SEE environmental study program. It focuses on airport environmental effects, which can impact airport capacity, which in turn has a direct effect on the ATM efficiency. The concept of the project was initiated in the light of European and international working groups such as AERONET, and ICAO WG2, which highlighted the need to harmonise the emission inventory methodologies and emission factors, and to develop reliable and verified dispersion models.
One of the principal aims of the ALAQS project was therefore to develop a toolset in order to build a capability for airport air quality modelling. ALAQS-AV is the GIS-based toolset developed for the ALAQS project. It provides the capability to conduct 4D emission inventories for all airport emission sources, as listed in the sections below. Case studies are also part of the project to provide validation and verification feedback for the methodologies and data used in the toolset. The development of improved capability for dispersion modelling and atmospheric chemistry interactions was the other main objective of the ALAQS project.
During 2004 the first operational version of the ALAQS-AV toolset was finalised and used for case studies. This version is limited to the preparation of 4D emission inventories for all airport sources and some pollutants. Future versions of ALAQS-AV will include an interface tool to convert ALAQS emissions output compatible for dispersion models and will integrate at least two different dispersion modelling approaches (Gaussian, Lagrangian and/or Eulerian).
The following sections summarise which airport sources and pollutants were taken into consideration, and provide a description of the toolset and the emission factors database.
Airport Emission Sources:
In the ALAQS project, air emissions from airports are categorised according to the following broad source groups:
Aircraft: Emissions from aircraft are mainly caused by fuel combustion in the engines and auxiliary power units (APU), tyre and brake wear. Aircraft emissions in ALAQS-AV cover the engine emissions during the LTO cycle between ‘off-block/on-block’ and 3000ft above aerodrome reference point (ARP). Engine start and APU/GPU emissions are calculated as part of the emissions from ‘stand equipment’ (see below).
Stand equipment (GSE, APU, GPU and engine start emissions): Ground support equipment (GSE) includes all the ground handling equipment and vehicles normally associated with an aircraft arrival or departure at the aircraft parking location (stand), whether that is an open stand or pier. The GSE category includes mobile generators, air start compressors, tugs, baggage handling equipment, and fuel trucks/loaders. In ALAQS-AV the aircraft engine starts and emissions from APU/GPU whilst aircraft are on-stand are included in the stand emissions.
Stationary sources: Airports generally own and operate a number of power generation plants that are typically fuelled by natural gas or diesel. In addition, fuel tanks, fire training exercises, aircraft maintenance and de-icing are small contributors to total air emissions.
Vehicle sources: These include ‘airside’ and ‘landside’ vehicles that can be attributed to roadways.

ALAQS - Airport Local Air Quality Studies CONCEPT DOCUMENT
5
Airside vehicles include any vehicle that circulates on airside service roads inside the operational area of the airport, such as service vehicles, coaches, tankers, and catering trucks. Note that vehicles related to on-stand (gate) operations are catered for in the Ground Support Equipment (GSE) emission category.
Landside vehicles include all road vehicle movements outside the airport operational area. Vehicles include passenger cars and taxis, coaches, Heavy Duty Vehicles (HDV), Light Duty Vehicle (LDV) and in the near future light and heavy rail.
For each of these sources ALAQS-AV proposes one or more methodologies to calculate the emissions (see later sections). Figure 1 shows an example of some different airport emission sources, with a different colour per source category.
Figure 1: Airport emission sources
Pollutants
Numerous pollutants are emitted from aviation fuel combustion and other airport activities, many of which are important due to their health effects. Key pollutants of interest for airport local air quality studies are CO, VOC, NOx, PM and ozone; keeping in mind that they are not necessarily the same as regulated pollutants (As they are part of national monitoring strategy while the airport pollutants are local interest).
The table below shows all pollutants and those which are relevant to airports and those modelled by ALAQS.
Carbon Monoxide: The major sources of CO within airport environs are: petrol- and diesel-fuelled motor vehicles, stationary plants and aircraft engines.
Airside roads Public roads Car parks
Power Generation
QUEUE
Take-off/Landing Taxi Start-up, APU/GPU
Fuel Storage, De-icing
GSE
Vehicles
Stationary
Aircraft
GSE
Heating

ALAQS - Airport Local Air Quality Studies CONCEPT DOCUMENT
6 2.1
Hydrocarbons: Hydrocarbons or VOC are important components of air quality concerns relating to health. The major emission sources in airport environs are the motor vehicles and aircraft engines, as well as the releases associated with refuelling and fuel storage.
Oxides of Nitrogen: There are many chemical species of nitrogen, the most important in terms of air quality terms being NO and NO2, (reported together as NOx for ALAQS). They are emitted from aircraft and fuel combustion processes including vehicles and fixed plants. Within airport environs the major sources of NOx are motor vehicles, stationary plants and aircraft.
Particulate Matter: Particulate matter is not a single pollutant, but made up of particles of many different sizes and chemical composition from a wide range of natural and anthropogenic (man-made) sources. So far only PM10 (i.e. the size of which is below 10 microns) are considered in ALAQS-AV, but it is foreseen that in the near future PM2.5 and PM01 will be considered as well. Within the airport environs the major source of fine particles is fossil fuel combustion, i.e. road vehicles, aircraft and stationary plants.
The ALAQS-AV toolset stores emission factors for each emission source in the system database. A literature review and some research collaborations during the project were the main sources of this data. Data sources were airport operational data, and other data from STNA, BAA, FAA, EPA, etc. For some pollutants, such as PM, there is still a large amount of uncertainty in the quality of the emission factors.
The emission factors currently included in the ALAQS-AV emission inventory database are CO, HC, NOx, SOx and PM10. However, not all the emission factors are available for the different road vehicle types. SOx and PM10 emission factors are not included in the ICAO aircraft engine database, so substitute indicative figures were used instead.
The ALAQS-AV toolset
As part of the ALAQS project the ALAQS-AV toolset was developed to facilitate estimation of detailed airport emissions inventories and dispersion modelling. ALAQS-AV is a customised Geographical Information System (GIS) application based on ArcMap - ArcView 9.0®. It is designed to capture airport pollution sources, and to process different types of emission source estimates into a standard format in preparation of dispersion modelling. It was
developed on behalf of Eurocontrol.
Before a project can be started in ALAQS-AV the user has to import airport mapping data that will be used to capture the location of the different emission sources. The importation of mapping data is carried out by means of standard ArcView functionalities. This spatial database describes the location and dimensions of the emission sources. The application handles the four emission source categories described in the previous sections. An example is provided in Figure 2
Figure 2: ALAQS-AV Screen Shot for Data Input

ALAQS - Airport Local Air Quality Studies CONCEPT DOCUMENT
7
When a new project is started the user also specifies the study global parameters such as the airport location (latitude/longitude). This will ensure that the project data layers can be geo-referenced with other airports or regional map data.
Based on the background airport map the user captures the different emission sources. For aircraft emissions four feature layers need to be captured: runways, queue areas, taxiways and gates (or stands). For non-aircraft emissions four additional layers are captured: stationary and area sources, roadways and parking lots. For each feature captured the user has to enter the required attributes.
The simplified data entry and study management in ALAQS-AV uses some aggregation techniques for describing the behaviour of some fixed sources: the temporal activity profiles and the gate scenarios.
Activity profiles
Temporal activity profiles (also known as ‘operational profiles’ in EDMS, or ‘time courses’ in LASPORT) are important attributes of non-aircraft emission data. They are intended to capture the typical intensity of an emission source’s activity for each hour of the year, relative to the annual total. Activity profiles are derived from available hourly, daily and monthly operational data and statistics. Those figures are expected to be provided by airport operators. Wherever possible, activity profiles are created based on local data for the airport studied; if local data is unavailable, default airport activity profiles may be substituted. Once valid profiles have been obtained, they can easily be captured in ALAQS-AV through the activity profiles definition window. The subsequent repartition of the emissions is much more detailed from both the geographical and temporal point of view.
Aircraft movement data
Aircraft emissions in ALAQS-AV use a movement based method. LTO (landing take-off cycle) methods, which are defined by the ICAO, are sufficient for calculating the total emissions exhausted over a selected period. However, a movement based method is essential for accurately describing the spatial/temporal distribution of emissions, since aircraft will use different runway/gate combinations for arrival and departure.
The aircraft movements table is provided by the user in database format. For each movement, the table specifies the date, time, type of aircraft (ICAO code), type of operation (arrival/departure), gate (stand) and runway. The movement table can either be actual movement data collected from the airport, or data generated by a simulator (e.g. TAAM3 or RAMS).
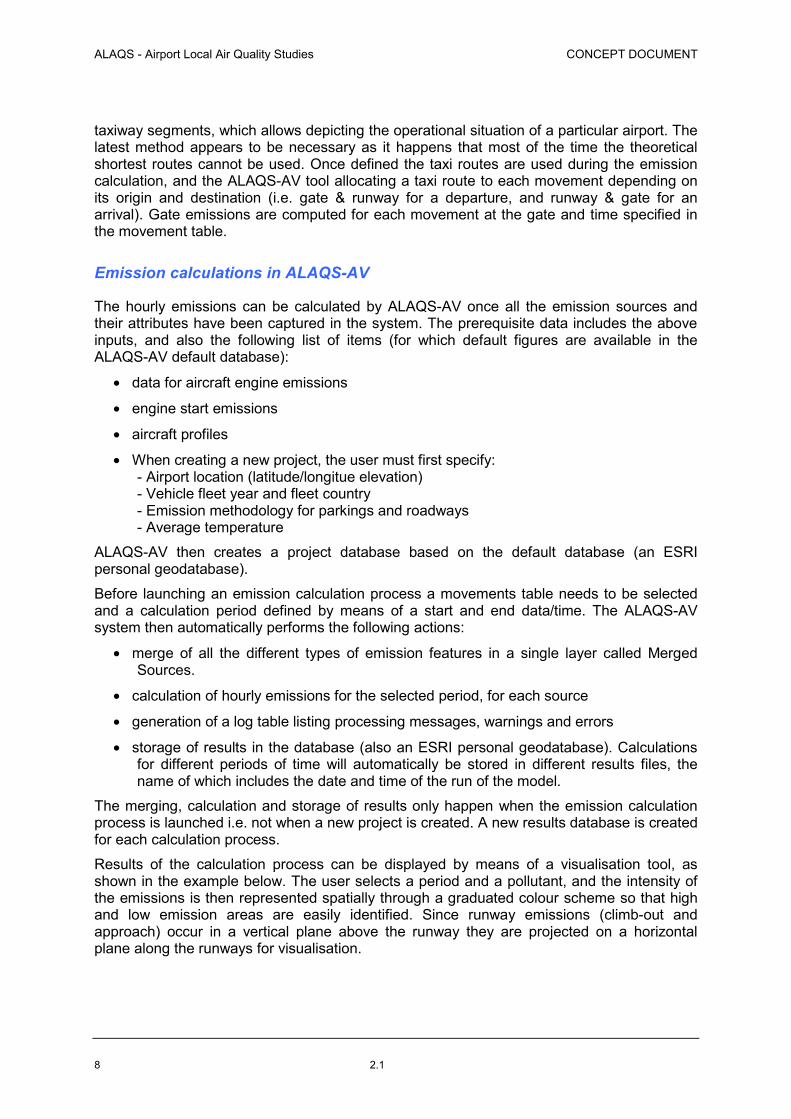
Gate scenarios
Gate scenarios are a means to define for each ‘gate type’ – ‘aircraft group’ combination the amount of pollutants released at the gate during departure and arrival operations. A gate scenario includes emissions from the GSE (Ground Support Equipment), an APU (Auxiliary Power Unit) and a GPU (Ground Power Unit). Aircraft taxi routes have to be defined between gates and runways (and vice versa). For each taxi route, taxiway segments are selected from gate to runway or vice versa (The new version of ALAQS selects automatically). There are two ways to define the taxi route network in ALAQS-AV: one is automatic and based on the theoretical shortest geometric route while the other is based on a manual selection of the
3 Total Airspace and Airport Modeller, www.preston.net/products/TAAM.htm
ALAQS - Airport Local Air Quality Studies CONCEPT DOCUMENT
8 2.1
taxiway segments, which allows depicting the operational situation of a particular airport. The latest method appears to be necessary as it happens that most of the time the theoretical shortest routes cannot be used. Once defined the taxi routes are used during the emission calculation, and the ALAQS-AV tool allocating a taxi route to each movement depending on its origin and destination (i.e. gate & runway for a departure, and runway & gate for an arrival). Gate emissions are computed for each movement at the gate and time specified in the movement table.
Emission calculations in ALAQS-AV
The hourly emissions can be calculated by ALAQS-AV once all the emission sources and their attributes have been captured in the system. The prerequisite data includes the above inputs, and also the following list of items (for which default figures are available in the ALAQS-AV default database):
• data for aircraft engine emissions
• engine start emissions
• aircraft profiles
• When creating a new project, the user must first specify: - Airport location (latitude/longitue elevation) - Vehicle fleet year and fleet country - Emission methodology for parkings and roadways - Average temperature
ALAQS-AV then creates a project database based on the default database (an ESRI personal geodatabase).
Before launching an emission calculation process a movements table needs to be selected and a calculation period defined by means of a start and end data/time. The ALAQS-AV system then automatically performs the following actions:
• merge of all the different types of emission features in a single layer called Merged Sources.
• calculation of hourly emissions for the selected period, for each source
• generation of a log table listing processing messages, warnings and errors
• storage of results in the database (also an ESRI personal geodatabase). Calculations for different periods of time will automatically be stored in different results files, the name of which includes the date and time of the run of the model.
The merging, calculation and storage of results only happen when the emission calculation process is launched i.e. not when a new project is created. A new results database is created for each calculation process.
Results of the calculation process can be displayed by means of a visualisation tool, as shown in the example below. The user selects a period and a pollutant, and the intensity of the emissions is then represented spatially through a graduated colour scheme so that high and low emission areas are easily identified. Since runway emissions (climb-out and approach) occur in a vertical plane above the runway they are projected on a horizontal plane along the runways for visualisation.

ALAQS - Airport Local Air Quality Studies CONCEPT DOCUMENT
9
Figure 3: ALAQS - Example of inventory results representation - NOx
For a full explanation of how to use the ALAQS-AV tool, refer to the ALAQS-AV Application Reference Manual [ref.2].
ALAQS-AV was used as above for the case studies for Lyon Airport, and then for Zurich Airport, to compare three different methodologies which are described later in this report (ALAQS, LASPORT, EDMS).
Future versions of ALAQS-AV should incorporate modifications and improvements resulting from the users' feedback collected through the case studies.
ALAQS-AV is coded in VBA. To help with distribution issues future versions may be implemented as a DLL. The DLL will be compiled from VB code.
ALAQS Emission Factor Database
One of the main problems facing those who wish to complete local air quality studies for airports is that there is no harmonised emission factor database for all airport pollution sources. Each practitioner seems to use his own sources. An objective of this study is to collect as much as possible of these data and harmonise them in one database. This will permit users of the database to complete their studies more quickly and have more confidence in the results. It will also permit comparisons between airports.
During the execution of the ALAQS project, emission factors and other data were collected from several sources therefore the content and the format of the data are not the same. These were harmonised in order to be used in the toolset database. Besides emission factors for each source, the resulting database tables contain data on aircraft/engine fit, GSE/APU combinations and settings, airports, road traffic, and stationary emission sources.. This approach of including data from many sources was chosen to create a test-bed for the ALAQS-AV users, and to obtain feedback on the different methods and emissions factors.
Aircraft emission factors currently included in the ALAQS-AV database originate from EDMS 4.11 with PM emission approximations from UNIQUE (Zurich). LASPORT emission indices for new, present and old technology aircraft have also been included
ALAQS - Airport Local Air Quality Studies CONCEPT DOCUMENT
10 2.1
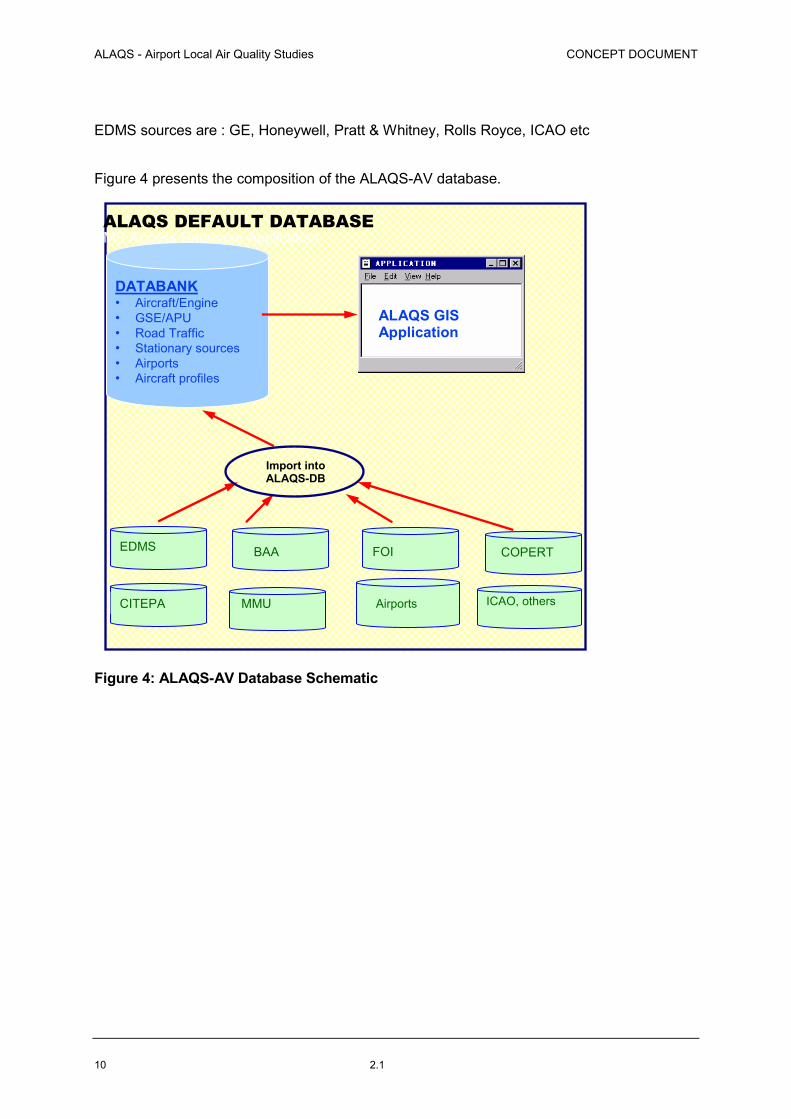
EDMS sources are : GE, Honeywell, Pratt & Whitney, Rolls Royce, ICAO etc
Figure 4 presents the composition of the ALAQS-AV database.
Figure 4: ALAQS-AV Database Schematic
DATABANK • Aircraft/Engine • GSE/APU • Road Traffic • Stationary sources • Airports • Aircraft profiles
CITEPA
EDMS
Airports MMU
FOI
ALAQS DEFAULT DATABASEMS Access Database Application
ALAQS GIS Application
Import into ALAQS-DB
BAA
ICAO, others
COPERT

ALAQS - Airport Local Air Quality Studies CONCEPT DOCUMENT
11
MMeetthhooddoollooggiieess
Aircraft Emissions
Aircraft exhaust emissions are calculated for the operating modes below, which follow ICAO engine thrust standards (7%, 30%, 85%, 100%):
Engine Start
Taxi in and taxi out (TX, 7% thrust )
Queuing (TX, 7% thrust)
Approach (AP, 30% thrust)
Landing roll (AP, 30% thrust)
Takeoff roll (TO, 100% thrust)
Climb-out (CL, 85% thrust)
Except for Engine Start emissions, aircraft engine emissions are calculated for each movement (departure/ arrival) as the product of the time-in-mode, the fuel flow rate and the emission factor for the appropriate engine thrust setting engaged. The resulting equation is shown below:
ACe = FFmode * EFmode * T * N ACe Aircraft total engine emissions, per landing-takeoff (LTO) cycle
FFmode Fuel flow rate (kg/s) per engine in mode
EFmode Emission factor (kg/kg) per engine in mode
T Time-in-mode (s)
N Number of engines
The above parameters are estimated based on realistic gate scenarios, taxiway and runway operations. To estimate hourly emissions per LTO mode, the aircraft movement database is linked to a specified aircraft profiles database. Hourly total emission rates are then stored in the results database (See ALAQS-AV user manual for more information).
The aircraft movement data is an essential part of an ALAQS-AV study, allowing the calculation of the spatial and temporal distribution of aircraft emissions. However, the current version of ALAQS-AV only provides variation of LTO in the vertical plane above the runway and time –in-mode. No allowance is made for horizontal deviation from runway centre-line. Future versions may investigate the feasibility of using ground track and vertical profiles derived from real or simulated data – in a similar way to the ENHANCE INM pre-processor.
Taxiway emissions
Taxiway emissions are released by aircraft engines while an aircraft travels from the gate to the runway and vice versa.
The ALAQS-AV method calculates emissions per movement which are stored in the results database as emissions per hour for each taxiway segment. However, emissions are

ALAQS - Airport Local Air Quality Studies CONCEPT DOCUMENT
12 2.1
calculated on the assumption that all engines are idling at 7% power thrust setting (mode TX), even if the actual taxi speed varies! This, arguably minor, limitation is due to the ICAO engine emissions database which only provides emissions indices for 4 discrete thrust settings (7%, 30%, 85%, 100%).
In ALAQS-AV it is assumed that aircraft will take the first available taxiway after the landing roll is completed. Since separate taxi routes should be defined for each of the exit taxiways normally used by arriving aircraft, more than one taxi route can be defined for a gate-runway combination. Taxi routes have an arrival and departure section each made up of one or more taxiway segments.
In ALAQS-AV taxi routes between gates and runways are selected automatically from the user-defined taxi routes based on the end roll position (for arrivals). The end roll position is the sum of the arrival profile’s landing roll and the touchdown offset specified for the runway. The selection of a taxi route is thus done on four criteria: Gate, Runway, Arrival/Departure flag (A or D) and End Roll Position. For a gate-runway combination the end roll position is compared to the routes’ exit positions. The route corresponding to the exit position situated immediately ahead of the end roll position is selected.
If the on-block/off-block time is specified (i.e. the total taxi time is known) the time for each taxi section is adjusted so that the total of the taxi times and queue time corresponds to the total taxi time.
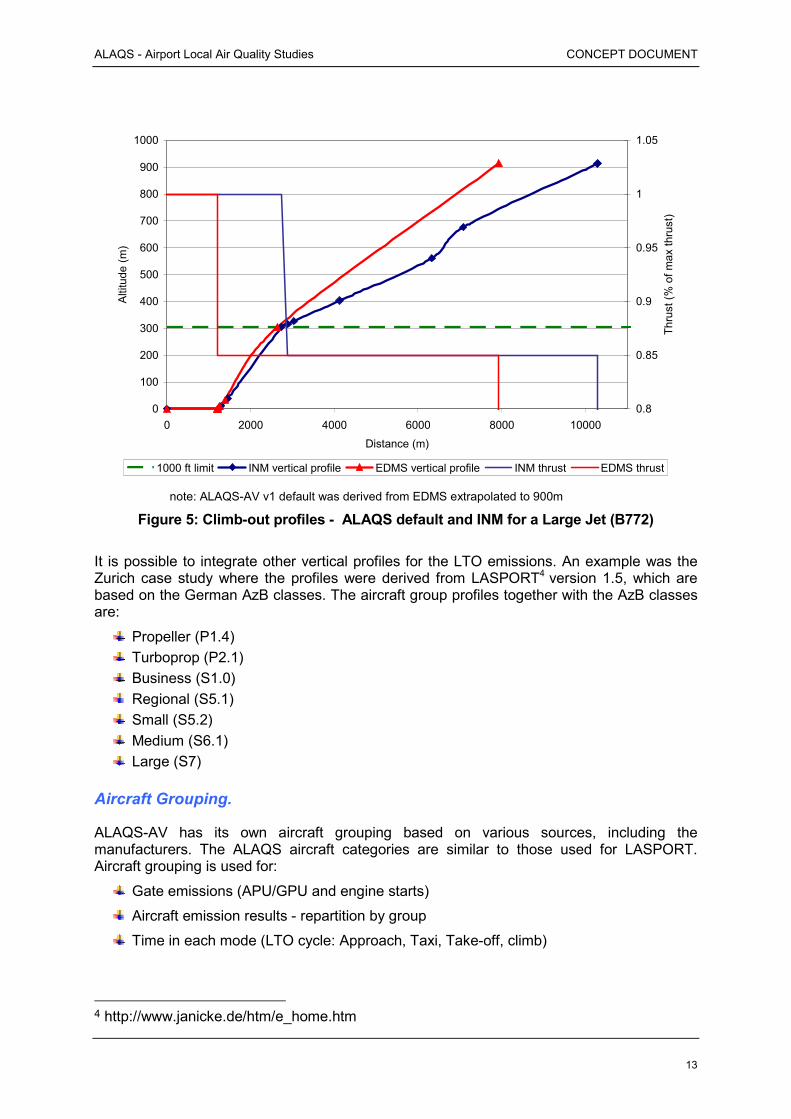
Vertical profiles.
The ALAQS-AV default vertical profiles used in take-off, approach and landing are derived from EDMS and then linearly extrapolated from 1000ft to 3000ft (and vice versa for the arrival profile). During recent ALAQS case studies the default profiles were replaced by the INM (Integrated Noise Model) profiles, which give a more realistic estimate of the vertical profiles. In the April2005 version of ALAQS-AV the default profiles were replaced by the INM profiles. Nevertheless, once more complete profile, thrust and fuel flow data are available for LTO phases for the majority of aircraft types these should be introduced into ALAQS-AV and noise modelling. Figure 5 shows an example comparison of two such profiles for B772.
ALAQS - Airport Local Air Quality Studies CONCEPT DOCUMENT
13
0
100
200
300
400
500
600
700
800
900
1000
0 2000 4000 6000 8000 10000
Distance (m)
Alti
tude
(m)
0.8
0.85
0.9
0.95
1
1.05
Thru
st (%
of m
ax th
rust
)
1000 ft limit INM vertical profile EDMS vertical profile INM thrust EDMS thrust note: ALAQS-AV v1 default was derived from EDMS extrapolated to 900m
Figure 5: Climb-out profiles - ALAQS default and INM for a Large Jet (B772)
It is possible to integrate other vertical profiles for the LTO emissions. An example was the Zurich case study where the profiles were derived from LASPORT4 version 1.5, which are based on the German AzB classes. The aircraft group profiles together with the AzB classes are:
Propeller (P1.4) Turboprop (P2.1) Business (S1.0) Regional (S5.1) Small (S5.2) Medium (S6.1) Large (S7)
Aircraft Grouping.
ALAQS-AV has its own aircraft grouping based on various sources, including the manufacturers. The ALAQS aircraft categories are similar to those used for LASPORT. Aircraft grouping is used for:
Gate emissions (APU/GPU and engine starts)
Aircraft emission results - repartition by group
Time in each mode (LTO cycle: Approach, Taxi, Take-off, climb)
4 http://www.janicke.de/htm/e_home.htm
ALAQS - Airport Local Air Quality Studies CONCEPT DOCUMENT
14 2.1
The ALAQS-AV default emission indices for APU, GPU, Engine Start and GSE are defined on an aircraft group basis when the gate scenarios method is used to calculate gate emissions.
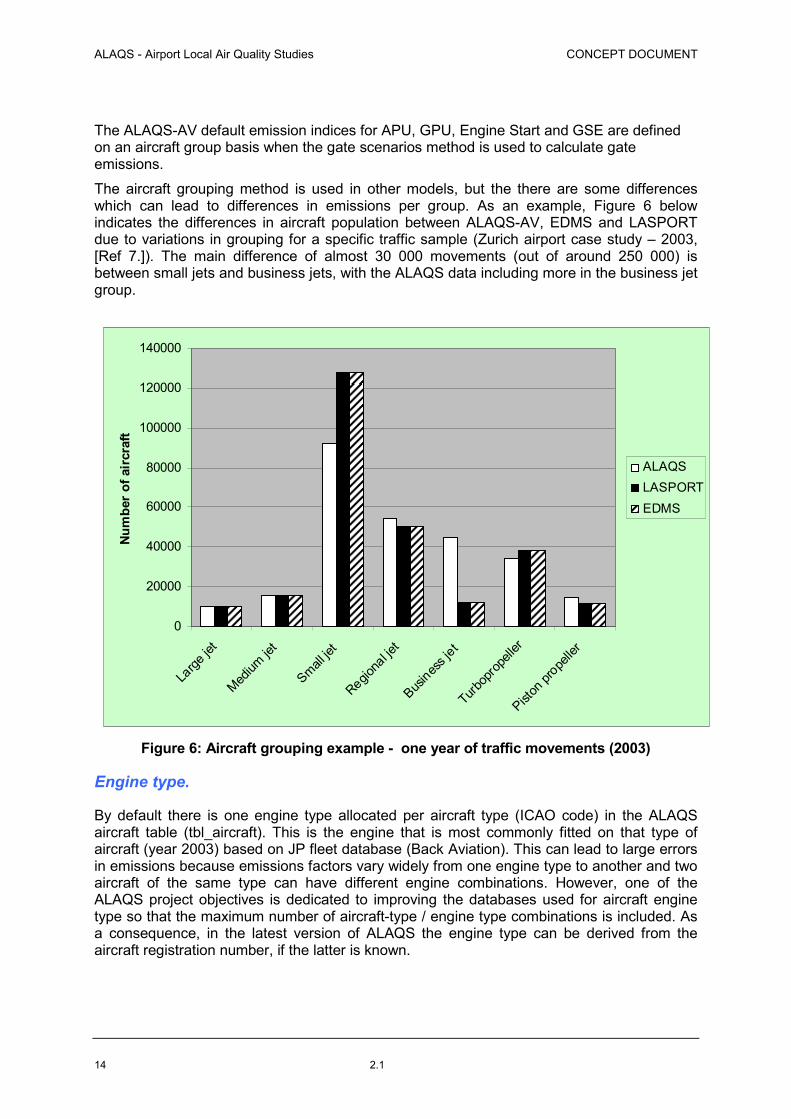
The aircraft grouping method is used in other models, but the there are some differences which can lead to differences in emissions per group. As an example, Figure 6 below indicates the differences in aircraft population between ALAQS-AV, EDMS and LASPORT due to variations in grouping for a specific traffic sample (Zurich airport case study – 2003, [Ref 7.]). The main difference of almost 30 000 movements (out of around 250 000) is between small jets and business jets, with the ALAQS data including more in the business jet group.
0
20000
40000
60000
80000
100000
120000
140000
Large
jet
Medium
jet
Small je
t
Regiona
l jet
Busines
s jet
Turbop
ropell
er
Piston
prope
ller
Num
ber
of a
ircr
aft
ALAQSLASPORTEDMS
Figure 6: Aircraft grouping example - one year of traffic movements (2003)
Engine type.
By default there is one engine type allocated per aircraft type (ICAO code) in the ALAQS aircraft table (tbl_aircraft). This is the engine that is most commonly fitted on that type of aircraft (year 2003) based on JP fleet database (Back Aviation). This can lead to large errors in emissions because emissions factors vary widely from one engine type to another and two aircraft of the same type can have different engine combinations. However, one of the ALAQS project objectives is dedicated to improving the databases used for aircraft engine type so that the maximum number of aircraft-type / engine type combinations is included. As a consequence, in the latest version of ALAQS the engine type can be derived from the aircraft registration number, if the latter is known.

ALAQS - Airport Local Air Quality Studies CONCEPT DOCUMENT
15
Selection of a methodology for gate and road vehicle emissions
In ALAQS-AV there are a number of methods available for calculating emissions from stand equipment and road vehicles. As a consequence the user must select one method from each of the following lists:
• Vehicle Sources (Roadways and Parking) methods: - ALAQS (based on COPERT-III) - LASPORT - CITEPA
• GSE sources (Ground Support Equipment) methods: - top down approach (i.e. gate scenarios, no need for a detailed list of the
equipments operated at the airport) - bottom up approach (i.e. based on a detailed inventory of the equipment used for
handling and gates operations).
For the aircraft and stationary source categories, there is only one methodology, but default emission factors can be changed. Default emission factors for each group of sources are stored in an ALAQS database in order to be used during the simulation. The ALAQS-AV tool gives the possibility to change any of the system data with more realistic airport data whenever available.
The following sections present the emission estimation methodologies for each source category.
Gate emissions (GSE, APU, GPU and Engine Start)
During the development of the project some research was done with the collaboration of UNIQUE to develop a standalone methodology to calculate GSE emissions. The research led to the adoption of some concepts from LASPORT in the current ALAQS-AV version. As in LASPORT, APU and GPU emissions are estimated based on average emission values by aircraft group.
However in practice, specific APU models are installed on different aircraft, and the available APU fuel flow and emission data is APU model specific. In the EDMS model, APU emission calculations are based on the specific APU model being used on an aircraft.
The current ALAQS GSE/APU/GPU methodology is described below.
ALAQS GSE emission methodology is a very detailed bottom-up approach in a sense that it develops a case-inventory that gives the amount of emissions per aircraft type (group) for each stand type. The GSE Emissions factors per stand are calculated in a stand-alone database and used by ALAQS-AV to calculate the ‘merged emissions’
Aircraft are grouped in nine categories described in Table 1. It is assumed that all aircraft in the same group use the same GSE equipment and operation times. Even though some GSE emissions related to an aircraft are generated elsewhere on the apron, most of GSE emissions occur at, or in the vicinity of, the stand where the aircraft is parked.
Table 1: Aircraft groups Jet Large Jet Medium Jet Small
Jet Business Turboprop Propeller
Supersonic Helicopter Light Helicopter Heavy

ALAQS - Airport Local Air Quality Studies CONCEPT DOCUMENT
16 2.1
The ALAQS GSE methodology requires that aircraft type, Stand and arrival/departure times are provided by the aircraft movement journal. An overview of the methodology is given in Figure 7.
Figure 7: GSE Emission Methodology Overview An inventory of all the equipments available at the airport is carried out. For each piece of GSE the following input data is specified
Table 2: GSE Technical and Operational Parameters
Parameter Description Emission Class Emission Class : GSE, APU or GPU GSE Type GSE type refers to the equipment (e.g., cargo loader) Power (kW or BHP) GSE engine power in kW or BHP. Brake horsepower refers to the
average rated brake horsepower of an equipment type’s engine Load Factor The load factor is the average operational horsepower output of the
engine divided by its rated BHP. Engine Fuel Type Gasoline, Diesel, LPG, Electric, Jet Fuel (for APU only)
GSE Engine Coolant – Water or Air Emission Standard EEC EUNRMM or EDMS emission factors Operation time The specific hours of operations per aircraft group type (Jet Large,
Jet Medium, Jet Business, Jet Small, Turboprop, Propeller, Super-Sonic, Helicopter light, Helicopter Heavy)
Population Units The number of units of the equipment requires per aircraft group type. In ALAQS systems defaults values are available for the above technical and operational parameters per aircraft type. Further details are given in the APAQS-AV GSE Methodology handbook.
TerminalOpen Freight Helipad GPU
Type of GSE APU, GPU operating
Aircraft Stand Properties
Stand movements Statistics
Operational info per AC Group
Technical information
Airport GSE Inventory
Compute total Stand GSE Emissions
Movement journal including Aircraft type Group and Stand

ALAQS - Airport Local Air Quality Studies CONCEPT DOCUMENT
17
Engine starts Engine start emissions are calculated as mass of pollutant per movement (departure) as a function of aircraft group. The current version of ALAQS-AV has values for HC derived from LASPORT. Other pollutants are assumed to be negligible at engine start-up as the emissions indices are all zero. ALAQS-AV has extended aircraft grouping as shown in Table 3 below. Table 3: Engine start aircraft groups and emission indices
ALAQS Aircraft GROUP CODE LASPORT GROUP EMIS_UNIT HC HELICOPTER HEAVY H2 - gram/aircraft 100 HELICOPTER LIGHT H1 - gram/aircraft 50 JET BUSINESS JB BUSINESS gram/aircraft 200 JET LARGE JL LARGE gram/aircraft 1000 JET MEDIUM JM MEDIUM gram/aircraft 800 JET REGIONAL JR REGIONAL gram/aircraft 300 JET SMALL JS SMALL gram/aircraft 500 PROPELLER PP PROPELLER gram/aircraft 50 SUPERSONIC SS - gram/aircraft 500 TURBOPROP TP TURBOPROP gram/aircraft 100
Engine start emissions can have a significant impact on the total HC emissions (unburnt fuel) at an airport.
Vehicle Emissions
The ALAQS project is focused on European airports, thus the ALAQS-AV vehicle emissions method is closely tied to the COPERT-III method, which is the EU recommended model for calculating emissions from road transport for use in CORINAIR (COoRdination d’INformation Environmentale) emissions inventories. COPERT-III is based on vehicle populations in EU member states and is aimed at providing a transparent and standardised methodology and data. COPERT-III is also conforming to international reporting protocols, conventions and EU legislation.
Emission factors from COPERT III cover the pollutants CO, NOx, VOC and PM10, and the vehicle categories PC (cars, motorbikes, scooters), LDV (light trucks) and HDV (heavy trucks, buses and coaches). These are implemented in a database that contains national fleet statistics and distributions for European countries.
COPERT–III was designed for all road transport; for use in an airport context we consider that COPERT-III could be adapted by modifying the proportions of PC/LDV/HDV to better reflect traffic serving an airport.
The ALAQS methodology for estimating vehicle emissions is summarised in Figure 8 and described further below.

ALAQS - Airport Local Air Quality Studies CONCEPT DOCUMENT
18 2.1
Figure 8: Vehicle emissions - ALAQS method schematic
After a review, it was decided to base the ALAQS method on a localised (airport scale and vehicle fleet) version of the COPERT III methodology. The ALAQS method simplifies the calculation by grouping vehicles into 3 classes (PC, LDV and HDV). Similar classes are used in the CITEPA method (September 2002) and are intended to simplify the task of counting vehicles circulating in the study area.
Airport land-side operations (activity outside the airport) are generally country/region specific. For example vehicle type distribution in one country is different from one country to another. The choice of a country to set up airport specific characteristics for road vehicles should rely on the choice of an EU15 country whose vehicle fleet is similar to the one of the country of the airport under assessment. This is necessary in order to provide a realistic emissions inventory for local conditions.
Set up Study
Method, Country, Year, Avg Temp
Country, Year
Calculate Aggregated Emission Factors for PC, LDV, HDV
Country Fleet composition, annual mileage,
mileage distribution, Representative speeds
Average Temperature
RVP, V, Tmax, Tmin,
Set up Road Parameters
Create a Roadway and set parameters
Aggregated Emission Factors (g/km)
Per vehicle cat’. PC, LDV, HDV
Calculate Total Emission for PC, LDV, HDV
Road Segment Length - L
Number of vehicles (N) for vehicle category (PC, LDV,
Total Emissions per road segment
Calculate Hourly Emissions
Cost 319 Vehicle Fleet Table

ALAQS - Airport Local Air Quality Studies CONCEPT DOCUMENT
19
Although the ALAQS methodology above is recommended according to the results obtained from previous ALAQS case studies, the ALAQS-AV toolset also allows the user to choose alternative vehicle emissions methods; these are EDMS (EPA MOBILE5a), CITEPA or the LASPORT (German/Swiss Scenario) method. Additional methods may be added if required by trials.
Stationary Source Emissions
Stationary sources are site specific. Typically stationary sources at airports consist of combustion and non-combustion sources such as boilers, space heaters, emergency generators, incinerators, fuel storage tanks, painting operations, de-icing operations, etc. Generally boilers and space heaters are used for heating and power generation requirements and they burn several different fuel types: fuel oil, diesel, natural gas or jet fuel.
Combustion Sources: In ALAQS methodology, the EDMS approach is adopted. EDMS has a database containing emission factors for several categories of stationary sources. The basic methodology for calculating emissions from each of these sources is fairly simple; the quantity of fuel burned is multiplied by an emission factor to determine the emission of each pollutant. The treatment of stationary sources in EDMS has been simplified to use default data for parameters such as percent controls, percent ash, and percent sulphur for combustion sources.
Stationary source emission factors currently included in the ALAQS default database were extracted from EDMS 4.11. However, the EDMS emission factors should only be used when no other data is available. Wherever possible, stationary emission factors should be obtained from airport sources (preferably based on actual measurements). The default stationary emission factors can be replaced by more appropriate (European) factors if these become available. In the case studies for Lyon Airport and Zurich Airport, airport specific emission factors were used.
Area sources (e.g. de-icing, groups of fuel tanks, etc…) do not have default emission factors in the ALAQS-AV database.

ALAQS - Airport Local Air Quality Studies CONCEPT DOCUMENT
20 2.1
DDiissppeerrssiioonn MMooddeelllliinngg aanndd CChheemmiissttrryy
Emissions can be calculated for individual sources such as operational data and specific emission factors, as described in the previous sections. It is also necessary to know the impact of these sources on local air quality, but unfortunately the ambient air quality at airports can only be measured in total, including dispersed pollutants from many surrounding sources.
There is a clear need for a tool that can model the atmospheric dispersion of emissions generated by the operation of an airport. Fortunately, existing dispersion models can be used or adapted to meet this requirement. Models can be used to analyse the direct effect of each source type (i.e. aircraft operations, roadway or GSE contribution), and can also be used to show the concentration plume around the airport.
The current state of dispersion modelling is adequately described in the UBA report by Yamartino et al [Ref 6.].
The ALAQS project objective is to evaluate and recommend dispersion modelling methods suitable for use at airports. The following were the principal criteria and constraints considered in this evaluation. The model must:
be suitable for airport scale (5 x 5km2 with a adaptable resolution down to 10m)
provide results that are consistent with the regional (25 x 25km2) and national (2000 x 2000km2) scale models and the EU requirements
cater for non-reactive and reactive chemical species.
capture and model the effects of point sources with high levels of reacting species (mainly aircraft engines).
accept vertical boundaries extending from ground level to mixing height (default is 3000ft or 900m). The mixing height is a parameter.
And last but not least, the model must provide realistic results for a variety of airports.
The dispersion models evaluated by ALAQS are based on several well-established mathematical models (Gaussian, Lagrangian, or Eulerian), and may or may not take into account the chemical reactivity of the pollutants in the atmosphere. Most of the models are either too simple (using Gaussian profiles and treating NOx as a passive scalar ...) or too complex (Eulerian in CFD frame). The generally accepted view on dispersion models is that Lagrangian or Eulerian models better suit air quality studies. A number of other implementation details can impact the choice and the accuracy of results, for example, it is important to distinguish reactive and non-reactive species, and whether the supporting data (meteorology, etc) allows modelling of non-linear AND linear chemistry over the airport and regional scales. Another factor to consider is that Eulerian models require high levels of data preparation and technical expertise.
For ALAQS dispersion modelling studies it was decided to initially focus on using the Lagrangian dispersion model that already exists in LASPORT (LASAT). That is because this model is fully validated and widely used by both airports and authorities in Germany. CFD modelling integration with ALAQS will also occur later. In parallel to this activity, the atmospheric chemistry process is also important to consider in ALAQS for better

ALAQS - Airport Local Air Quality Studies CONCEPT DOCUMENT
21
representation of pollutants, and collaboration will be made via AERONET using the Richard Ramaroson Chemistry model5.
Figure 9 shows the dispersion models and process as integrated in the ALAQS project for 2005 and later years.
Figure 9: ALAQS Dispersion model interface overview The data necessary for more realistic dispersion modeling are thorough meteorological data for the airport concerned. Airports are more fortunate than urban and rural areas as they can use meteo observations from the airport’s own meteo station, augmented as necessary by national data, either historical or predicted. ALAQS-AV requires meteo data in sufficient detail and format that can be used for all the dispersion models under test. This may vary from standard weather observations at ground level to complete description of the atmosphere up to the boundary layer within 10km of the airport on an hourly basis for a complete year. It is expected that the availability and resolution of meteo data will vary from one airport to another. At the same time it recognized that great progress has been made in the accuracy of local meteorological models as opposed to meso scale models which extend down to the order of 12km resolution. Local models can given precision of 2 to 3 meters and 50 or so vertaicl aincrements from ground level to 50000ft [Ref 9.].
5 R.Ramaroson. Modélisation locale, a une et trois dimensions des processus photochimiques de l’atmosphère moyenne. Thèse de doctorat. Université Paris VI

ALAQS - Airport Local Air Quality Studies CONCEPT DOCUMENT
22 2.1
FFuuttuurree WWoorrkk
The aviation industry is making considerable efforts to reduce environmental impacts, using both direct and indirect means. Direct efforts are focused on the implementation of different operating procedures to reduce emissions, for example the avoidance of starting aircraft engines at gates. Indirect efforts result in a net improvement in environmental impact through the implementation of new equipment or procedures that arise from some other requirement, perhaps due to safety or economic reasons (for example fuel or maintenance reductions).
Future activities in the ALAQS project are focused on three threads
Support to ICAO CAEP Working Group 2 – air quality
Support to AERONET thematic research network
Trade-off analyses for future scenarios
The ALAQS project aims to serve the European airport community by contributing to the ICAO CAEP Working Group 2 and the AERONET thematic research network. The future activities in ALAQS are closely tied to providing support to these bodies by conducting studies and trials of different methods, including the evaluation of new procedures and data – e.g. emissions factors
In the area of trade-off analyses, EUROCONTROL are particularly interested in evaluating the trade-off issues between environmental constraints (noise and emissions) and airport capacity, whilst maintaining a safe air transport system. Trade-off analysis is particularly relevant to future scenarios relying on simulated and predicted traffic. Future work will be directed at improving the knowledge and procedures for such analysis, together with the integration of modelling tools used for Noise, ATM and airport capacity (such as PACS, RAMS, SIMMOD, TAAM).
Yamartino et al [Ref 6.] propose several areas of work which could be included in the scope of ALAQS, including:
Investigate methods and guidelines for hazardous air pollutants (HAPs) generated by aircraft and GSE.
Review and evaluate methods for modelling particulate matter (PM10, PM2.5 and smaller) and aerosols relevant to aircraft engines.
A comparison between Gaussian and Lagrangian dispersion models – EDMS and LASAT – in the context of airport air quality studies.
ALAQS - Airport Local Air Quality Studies CONCEPT DOCUMENT
23
RReeffeerreenncceess
[Ref 1.] IATA Fuel Action Plan – guidance material for best practices for fuel and environmental management. Version 26 November 2004.
[Ref 2.] ALAQS-AV v2 Application Reference Manual. June 2005. EEC Document (available on request) [Ref 3.] EU 15.10.20.30 - Monitoring of atmospheric pollution http://europa.eu.int/eur-
lex/en/lif/reg/en_register_15102030.html [Ref 4.] Tunstall-Pedoe, N., Raper, D. W. and Holden, J. (Eds) (1996) Airports and the Environment -
liabilities and social responsibilities. Proceedings of International Conference, Manchester Airport July 1995. Thomas Telford, London. ISBN 0 7277 2520 3
[Ref 5.] Rogers H. L., Lee D. S., Raper D. W., Forster P. M. de F., Wilson C. W. and Newton P. The impacts of aviation on the atmosphere. QINETIC/FST/CAT/TR021654
[Ref 6.] Yamartino R.J., Builtjes P.J.H., Stern R.M., Status of current Level of development and understanding in the field of modelling pollutant dispersion at airports, July 2004, Free university of Berlin – Institute of Meteorlogy, UBA-FB.
[Ref 7.] Celikel A, Duchene N, Fleuti E. Fuller I.C, Hofmann P, Moore T, Silue M. Airport Local Air Quality Studies Case Study: Emission Inventory for Zurich Airport with Different Methodologies. EUROCONTROL SEE report, Report SEE/2004/010
[Ref 8.] BAA website. Sustainable development - Air quality : http://www.baa.co.uk/main/corporate/sustainable_development_frame.htmll
[Ref 9.] N Nelson, A K Mirza, K N Weaver. An Assessment of Alternative Sources of Met Data for Use in Dispersion Modelling. UK Meteorological office. ADMLC/2002/1. http://www.admlc.org.uk/documents/ADMLC20021.pdf

ALAQS - Airport Local Air Quality Studies CONCEPT DOCUMENT
24 2.1